Abstract
Along with the rapid urbanization and economic growth of China over the past decades, the thermal comfort needs of the people in this region have risen dramatically, and at the same time, promoting building energy efficiency is cited as part of the major projects in the 14th five-year plan for energy efficiency improvement. In addition, the outbreak of the COVID-19 epidemic has plunged people into long-term panic, and promoted the entire construction industry to think about a healthier and more sustainable living environment. To respond to the imbalance between energy supply and demand, an optimization analysis based on energy use is developed, assessing the energy efficiency of the window-to-wall ratio (WWR) design and calculating the energy consumption of three different types of residential buildings for both cooling and heating loads as well as for year-round loads. Owing to its harsh climate and huge energy consumption, in this study, the Hot-summer and Cold-winter (HSCW) zone of China was chosen as the experimental setting for the optimization analysis of WWR. Then, in the three main types of residential buildings, including detached houses, multi-story dwellings and high-rise dwellings, a correlation between WWRS and energy consumption in the cooling season, heating season and year-round was built. The comparisons between the WWRS and energy consumption for different types of residential buildings are presented. The design optimization recommendation for WWRS are proposed. It has significant positive meanings for the development of green and sustainably designed residential buildings that offer high levels of thermal comfort and energy efficiency.
1. Introduction
In recent decades, as populations and living standards have climbed, energy issue has become more and more prominent in present-day world society and, in the near future, energy will likely become a worldwide resource shortage [1,2]. China, for example, has seen a steady increase in its energy demand, with an average annual growth rate of around 5.50% over the last 39 years. To be precise, its total energy use has risen from 603 million tonnes of standard coal equivalent in 1980 to 4870 tonnes in 2019 [3]. Numerous relevant data show that the residential energy consumption (REC) is the second category (27.9% in 2018) that accounts for total national energy consumption after industrial energy consumption, and approximately 65% of the energy is consumed in the heating and cooling loads of residential buildings [4]. Since the end of 2019, COVID-19 has caused people to fall into extreme panic all over the world. In order to prevent the continued spread of the epidemic, everyone had to be trapped at home, which prolonged indoor time. During the long-term home epidemic prevention process, the quality of life in the house has gradually become a focus of attention, and in particular to the human thermal comfort. At the same time, as the standard of everyday life continues to improve, people’s requirements for living conditions are becoming more and more stringent [5], especially for human thermal comfort in living spaces. Under these circumstances, people’s indoor environment does not give them a comfortable thermal comfort condition. It follows that people’s growing demand for thermal comfort is one of the core contributors to the increasing energy use of residential buildings. The developing trend of building energy consumption in China over the past 14 years is shown in Figure 1, displaying a steady increase and reaching nearly 10 billion tons of standard coal (TCE) in 2018, of which the energy consumption of cooling and heating equipment such as the HVAC system accounted for 65%. Specific to each household, the electric energy consumption is also on a rapidly rising trend, and reached 722 kWh per capita in 2018 [6]. It means that in the foreseeable future, as people’s demand for thermal comfort rising continuously, the increase in energy consumption is obvious.
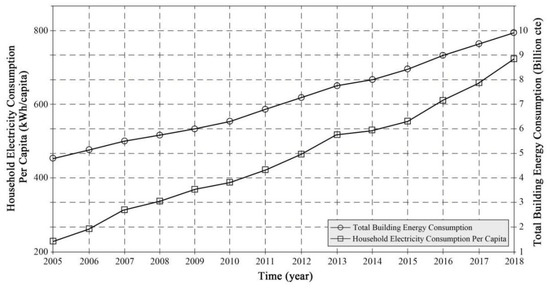
Figure 1.
The building energy consumption and household electricity use per capita in China, 2005–2018.
Measures to reduce heat emissions from the interior to the exterior of a building play an important role in creating a suitable indoor thermal environment and saving energy. Measures to reduce heat emission from the inside of the building to the outside play an important role in creating a suitable indoor thermal environment and saving energy. The volume factor of the building should be minimized. Volume factor is the ratio of the surface area to the volume of a building. Its magnitude reflects the size of the surface area of the building. From the comparison of surface results, the larger the volume factor, it means that for the same volume of room, the larger the surface area, the more energy loss way of the building; at the same time, the smaller the volume factor, it means the smaller the external window area of the building and the relatively low cost. The height of the building and the height of the floor are also important parameters that directly affect the volume factor and indirectly affect the heat absorption and heat loss of the building. The performance of the exterior envelope also directly affects the heat loss parameter. The exterior walls and the doors and windows on the exterior walls bear the main functions of lighting and ventilation of the building. Choosing a suitable window-to-wall area ratio and adopting windows with small heat transfer coefficient are important ways to improve the thermal insulation performance of exterior windows. However, as a part of high energy consumption, there is still a great gap between China and the other developed countries in the level of energy efficiency of residential buildings. Therefore, to effectively improve the energy consumption of residential buildings and their impact on the climate environment, many scholars have conducted many studies on the energy consumption and thermal performance of the residential building envelope. Furthermore, these studies confirm that the most direct and effective way to improve the thermal performance of residential buildings is to change the exterior form of the building and optimize the thermal performance of the envelope [7]. However, it is worth noting that this is not a single and easy task, as it is well-known to all that the composition of the building envelope is complex, including many components, such as walls, windows and doors, etc. The thermal performances of these constituent elements are different and therefore have different effects on the flow of energy (heat loss, solar gain, etc.) between the interior and exterior, as well as on various aspects of indoor comfort, such as visual shading, acoustic transmission, etc. Additionally, people increasingly tend to prefer residential buildings with large floor-to-ceiling windows in modern life, but floor-to-ceiling windows are detrimental to building energy-saving, as exterior windows contribute to a larger proportion of the energy consumption of maintenance structures. It can be seen that the window-to-wall ratio (WWR), defined as the ratio of the area of the window opening to the area of the wall facade of the room in which the window is located, is an important parameter that affects the thermal performance of the building envelope and the energy consumption of the building. Because the heat transfer factor of the window is greater than that of the wall. With an increase in the area of the windows, the heat transfer from the room to the outside the heat gained by the solar radiation inside is all enhanced. Both of these are unfavorable factors for the cooling load of the building, but doubly so for the heating load. Thus, when the cooling load of the building becomes the main energy consumption, excessively large windows are damaging to energy efficiency. However, for residential buildings with multiple orientations, the extent to which the WWR contributes to the energy consumption of a room varies in each direction, as the solar radiation is different in each direction of the building. Therefore, in order to most directly and effectively improve the energy efficiency of residential buildings, it is essential to determine the impact of WWR on the energy consumption in all directions. It has been shown that increasing the value of WWR will not only increase the solar radiation indoors, but also enhance the energy flow and heat exchange between indoors and outdoors. In this way, the increased solar radiation, although beneficial to improve the indoor thermal environment in winter, will lead to an increase in energy use for air conditioning in summer. In addition, while the increased indoor-outdoor heat exchange raises the heat consumption of the room in winter, it facilitates indoor heat dissipation in summer [8]. Several studies have shown that the effects of increased WWR are multifaceted, with benefits and detriments to the indoor thermal environment in winter and summer, respectively. Therefore, a reasonable WWR should be determined in order to jointly improve human thermal comfort and energy efficiency.
The innovation and novelty of this paper lies in the logical coherence. The author first conducted a questionnaire survey on basic building information, thermal comfort, thermal demand and energy consumption status of residents, with 368 valid questionnaires, which is the first-hand information of such research in the region. By compiling the data from the questionnaires, the cases were classified into three building types: detached houses, multi-story dwellings and high-rise dwellings. Then, indoor thermal conditions data collection was conducted for one year for typical cases of each building type, and based on this, building models with reasonable boundary conditions were established to optimize the analysis of WWR and ensure the accuracy and reasonableness of the data. In this case, it is crucial to consider all three together by forming the current situation of people’s desire for thermal comfort and huge energy consumption. This study investigates this topic and explores whether there exists an optimal WWR that not only maximizes the energy efficiency of residential buildings, but also provides better thermal comfort for the residents, which is a very novel idea and attempt. In conclusion, this study provides practical information for architects and the building industry, as well as a method that can be used to configure an appropriate WWR that provides reference data for a reasonable value of residential buildings. This aspect of the study is important for designing sustainable residential buildings with high energy efficiency and satisfactory thermal comfort.
2. Literature Review
In terms of the current state of research, there have been numerous publications and discussions on the impact of WWR on the building energy consumption, and most of them have confirmed that the building energy consumption and WWR are basically in a positive linear relationship, but no discuss of reasonable WWR is made [9,10,11,12,13,14]. From the perspectives of dynamic simulation and steady-state calculation are the most common methods, but the research conclusions on the reasonable value of WWR are inconsistent. In the Hot-summer and Cold-winter (HSCW) zone of China, for an indication, the former shows a power-of-quadratic correlation between energy consumption and WWR in the south of residential buildings, while printing a positive linear relationship in the other directions [15]. The latter, a calculation method based on steady state, points out that the consumption of heating has a positive linear relationship with the WWR in all directions [16]. Clearly, the results of these two studies show that the smaller the value of WWR, the more significant the effect on building energy efficiency. The current “Design Standard for Energy Efficiency of Residential Buildings in Hot Summer and Cold Winter Zone” (JGJ134-2010) [17] of China uses the dynamic simulation analysis method to study the relationship between the reasonable value of WWR of each orientation and the thermal insulation performance of external windows [18]. It has been noted that the maximum WWR of 0.6 for south-facing can only be set when the heat transfer coefficient of the external windows is reduced to 2.5 W/(m2°C) [19]. At the same time, for east and west exterior windows, if an exterior shading facility with a solar radiation transmittance of less than 0.25 is used, the WWR can also be increased to 0.6.
Besides, a number of scholars have discussed the relationship between WWR and human thermal comfort [20,21,22,23,24,25,26,27,28]. By using an office as an experimental space and conducting thermal comfort evaluation statistics for the people, the best value of the WWR is evaluated, which may provide pleasant situations during the longest time of the year [25]. In terms of comfort, however, it should also be noted that the degree of influence of window characteristics in the practical environment also lies in human performance [29]. It can be found that there are more optimization analyses of WWR for residential buildings, but few sub-studies of different building types relatively, and this paper can fill the gap of relevant basic data in this part. Precisely, the existing studies on WWR, energy consumption in residential buildings and human thermal comfort are independent.
3. Methodology
3.1. Questionnaire Investigation
The questionnaire investigation method was used as the first step in this study to conduct a statistical survey of residential building characteristics, energy consumption, and human thermal comfort ratings of urban residents in the HSCW zone of China. As shown in Figure 2, there were three areas from the most developed region, namely Shanghai, Zhejiang province, and Jiangsu province, were analyzed. In this study, questionnaires were distributed in the form of paper questionnaires, which were completed from March to June 2018, with a total of 500 distributed and 480 returned, removing invalid questionnaires for a total of 368 usable questionnaires.
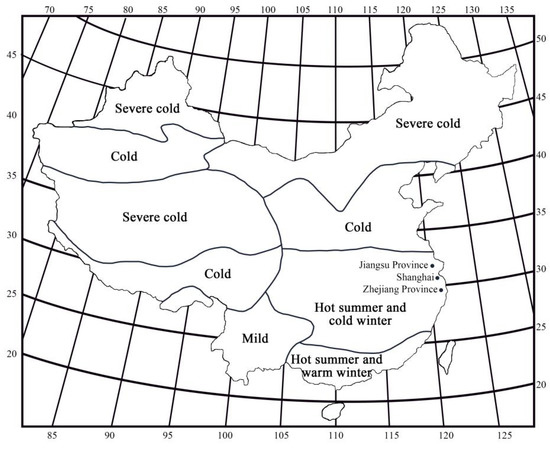
Figure 2.
The layout of the five climate zones in China and the cities investigated.
3.1.1. Investigation Method
In order to better understand the underlying information such as building information, thermal comfort status, thermal demand, energy consumption and other basic data in the HSCW zone, and lay the foundation for following research, this paper filtered cities based on multiple criteria and randomly samples from different cities. Furthermore, then the sample data were classified and extracted. After the questionnaire is distributed, data processing is conducted. In this study, there are three common and practical methods can be used as follows:
- Samples deletion. This method is often used when the entire questionnaire has no answer, and should be removed.
- Partial deletion. Some items in the questionnaire are unanswered, then the information for this variable in the sample can be deleted, but the statistical information for other variables is still valid.
- Modify. This is a way of replacing a missing value with another value. For a variable where the proportion of missing values is under 5% of the total sample, the overall mean of the variable can be used to replace the missing value. However, in the case where the proportion of missing values exceeds 5%, it is recommended that a “hot deck” approach be used, whereby similar samples are divided into groups and the mean of this group is chosen to replace the missing data in these groups [30,31].
3.1.2. Results of the Questionnaire Investigation
Household Characteristics
Table 1 listed the main content of this questionnaire. Before the questionnaire was distributed, the sampling method was designed scientifically and rationally to make the data of survey samples more objective and effective. Therefore, a three-stage sampling method was used to first identify survey cities, secondly select residential areas in each survey city, and finally select households in each of the selected residential areas for the survey [32].

Table 1.
Related basic information.
Generally, there are three types of residential buildings according to building height, as shown in Table 2: detached houses (1 to 3 stories), multi-story dwellings (4 to 6 stories) and high-rise dwellings (7 stories and above).
Table 2.
Relationship between building type and number of floors.
As presented in Figure 3, the occupancy ratios of the three residential building types in this survey are a reasonable reflection of the actual situation in the surveyed cities. Approximately 50.00% of the respondents were high-rise dwellings, 33.33% were multi-story dwellings, and only 16.67% were detached houses.
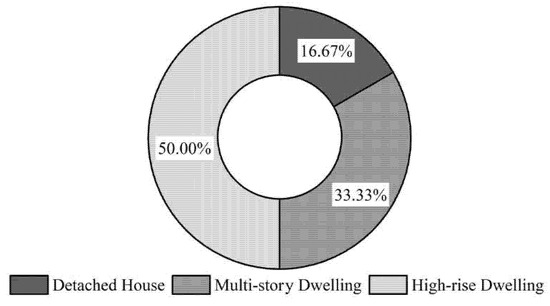
Figure 3.
The proportion of the three building types.
Figure 4 shows the age of construction of the selected residential buildings in the three surveyed cities. It can be observed that, among the buildings selected, those built after the 1990s are mainly multi-story and high-rise dwellings, while very few high-rise dwellings were built before the 1990s. Furthermore, concerning floor area of the residences, the average areas of all residential buildings of three types were calculated in this study, which can be a basis for comparison between the three building types. A detached house has the mean average area, about 121 m2/household, while the average areas of multi-story dwelling and high-rise dwelling are 106 m2/household and 118 m2/household respectively. Finally, the window area of each building type is shown in Figure 5. Detached house always uses the largest window size, while the multi-story dwelling has the smallest window size.
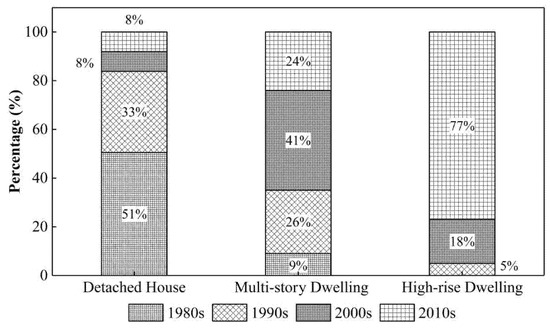
Figure 4.
Distribution of the surveyed building construction year.

Figure 5.
Window area for three building types.
Energy Consumption and Thermal Satisfaction
Figure 6 shows that 95% of the surveyed households use air conditioning as their primary heating/cooling device. As illustrated in Figure 7 and combined with the energy use of each household, it can be seen that detached house is the most energy-efficient building type. Furthermore, in contrast to the other two types, the residential building energy use of high-rise dwellings is somewhat higher than in the case of multi-story dwellings in both summer and winter. As far as building types are concerned, the type with the highest energy consumption is the high-rise dwellings, while the detached house is the most energy-efficient type. However, in practical terms, for single-family houses, which are the largest of the three building types, inefficient space utilization is the main reason for low energy consumption.
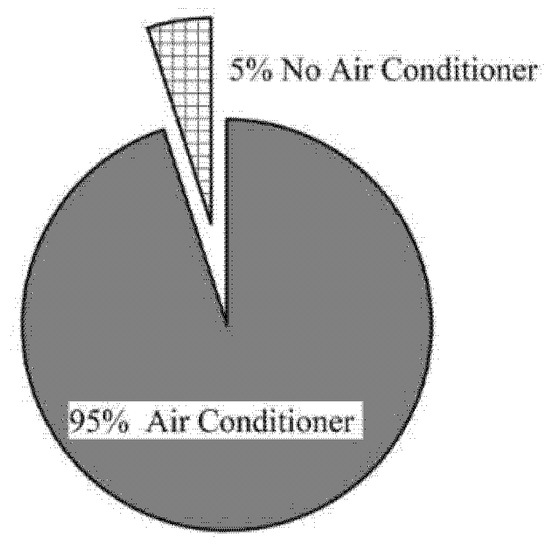
Figure 6.
The space heating/cooling appliances.
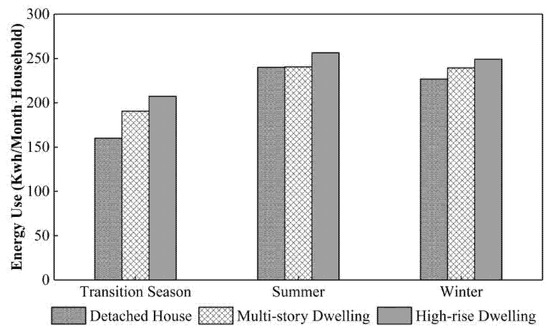
Figure 7.
Relationships between three building types and energy use.
Figure 8 shows the satisfaction level of the surveyed residents with the thermal condition of their houses. It is clear to see that very few people have chosen “Strongly dissatisfied”, and only about 38% of residents in multi-story dwellings were “Neutral” or more satisfied. In contrast, the other two types were above 45%. From another point of view, as shown in Figure 4, high-rise dwelling is the newest built type among the three residential building types, with the better materials, building techniques processes and construction technology than before, so the investigated residents’ thermal satisfaction (“Neutral” and above it) for high-rise dwellings is higher than for the other building types.
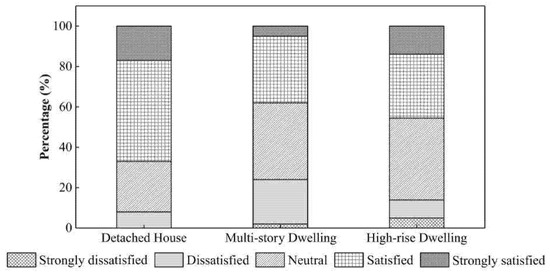
Figure 8.
Current thermal satisfaction in various situations in different seasons.
In addition, the analysis of residents’ thermal satisfaction proved that the three residential building types have very similar resident satisfaction ratings. Based on this premise, and with a certain air-conditioning efficiency, the building energy consumption is proportional to the WWR. Figure 9 illustrates the relationship between the WWR and residential building energy consumption in summer, winter and year-round for the three building types. Whether it is the detached house, the multi-story dwelling or the high-rise dwelling, the larger the building energy consumption in summer or winter, the larger the corresponding WWR. It is thus clear that the WWR does have considerable influence on the residential building energy consumption.
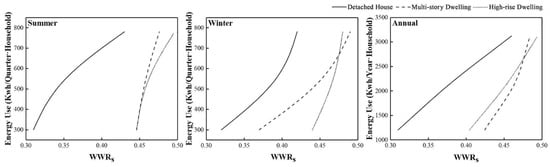
Figure 9.
The relationship between residential building energy use and WWR in survey samples.
Table 3 shows the most common window types of the three housing types. Comparing the thermal conductivity K between various window types, the double-glazed window in high-rise dwelling was the most energy-efficient, while the single window in detached house was the least, because the high-rise dwelling is the newest type to be built. With the corresponding building design specifications improved gradually, the thermal performance requirements for windows of high-rise dwelling are higher than the others. Moreover, linking the K of the window with Figure 9, it is not difficult to find that the WWR of the detached house changed more with energy use, while the change of high-rise dwelling was the most slightly, as the window of the detached house is the option with the worst thermal performance.
Table 3.
Thermal parameters of external windows of three building types.
3.2. Field Survey
3.2.1. Selection of Location
Climatic conditions vary significantly from area to area in China, contributing to the differing characteristics of building energy consumption in different regions. The “Thermal Design Code for Civil Buildings” [33] defines the division of China into five climatic zones based on the average temperature of the coldest and hottest months, as shown in Figure 2.
- The climate zone covers 16 provinces, containing half number of provinces in China, more than 40% of the Chinese population lives in the region, which is no more than 20% of China’s land area, and a higher population density in the HSCW zone compared to that in other climate zones.
- The economic situation and growth rate are both better than other regions, accounting for 48% of GDP in 2019.
- The region has very specific climatic conditions that require both cooling in summer and heating in winter, and consumes more energy than other regions.
Based on meteorological data form the Typical Meteorological Year, it can be found that the average outdoor temperature in this zone is 0–10 °C in the coldest month and 25–30 °C in the hottest month [34]. At the same time the relative humidity throughout the year is 70–80%, sometimes even higher. In addition to these characteristics, with the long period of summer and winter (summer: early May to late September, winter: mid-December to mid-February next year) and significant climatic differences, the building energy consumption in HSCW zone accounts for about 45% of the national energy consumption in buildings.
According to Chinese design regulations and local traditional customs, buildings in the HSCW area are not designed with central heating systems. Taking Shanghai as an example, the daily outdoor dry bulb temperature, relative humidity and direct solar radiation in Shanghai during a year are shown in Figure 10, Figure 11 and Figure 12. In Figure 10, the black area is the comfort zone. Then, the temperatures in summer and winter are different, too low in winter and too high in summer. In addition, in Figure 11, the humidity is kept at a high level of about 60–85% throughout the year. The energy savings are severe in both summer and cold seasons. In Figure 12, the direct solar radiation shows that it can significantly affect the thermal situation in the room.
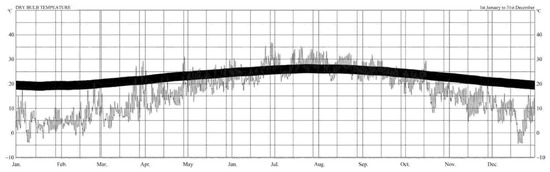
Figure 10.
Daily dry bulb temperature profile in Shanghai.
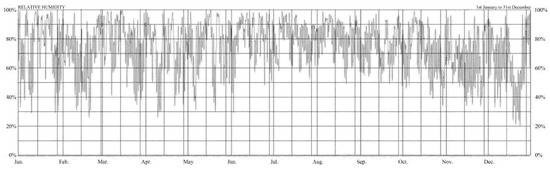
Figure 11.
Daily relative humidity in the city of Shanghai.
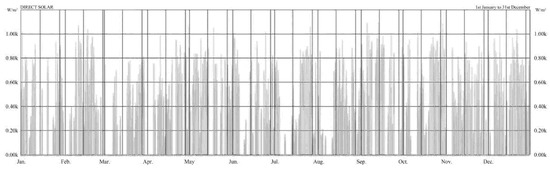
Figure 12.
Daily direct sunlight in Shanghai city.
3.2.2. Case Models Constructing
According to the results of the questionnaire investigation, three case models need to be selected to represent the three building types in this study. While selecting the case models, we have set up relevant boundary conditions to ensure the credibility of the research:
- Select the middle floor. In order to avoid the case models from being affected by different insulation layers on the roof, the detached house chose the second floor (3 floors in total), the multi-story dwelling chose the third floor (6 floors in total), and the sixth floor was selected of high-rise dwelling (11 floors in total);
- Select the household units on the edge. The impact of WWR in different orientations (south, east, north, and west) on building energy consumption is the core content of this study, so it is vital to choose households with all three orientations. In addition, the east-facing room is selected as the research area to represent the east and west orientations, as saving experimental costs.
Finally, these three cases models were selected as follows:
- Detached house;
- Multi-story dwelling;
- High-rise dwelling.
In addition, indoor temperature and humidity measurements were carried out for one year for three types of buildings.
The layouts of the three cases are shown in Figure 13, and the basic information is also shown in Table 4. The floor areas of the three cases were 61.1 m2 (only the area of one floor was calculated), 82.7 m2 and 86.5 m2, respectively. For different building types, each building type has its own characteristics. For example, in the case of balconies, the balconies of high-rise dwellings are located outside the bedrooms, the balconies of multi-story dwellings are located outside the living rooms, and the balconies of freestanding houses are located on the 2nd and 3rd floors.
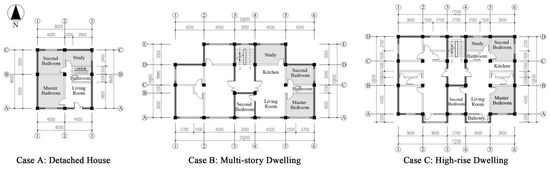
Figure 13.
Three types of building layouts.
Table 4.
Basic information of measurement areas.
In this field survey, each room of three case models was tested, generating much valid data. To facilitate the explanation of the relationship between the WWR, human thermal comfort and energy consumption for the three cases, the master bedroom in the south-face is taken as an example for the discussion here. So, only the effect of the change of the WWR of the master bedroom be explored in this study, while the WWR ratios of the second bedroom, kitchen and bathroom remain unchanged. In Figure 13, the shaded area is the measurement area in this study, and the window types of the three cases are different. If it is detached house, the window area is 5.04 m2, the WWR is 0.51. In multi-story dwelling, the window area is 6.3 m2, the WWR is 0.60. Lastly, in high-rise dwelling, the window area is 5.88 m2, the WWR is 0.67.
The outdoor climatic conditions of the three building types are basically the same, and the unoccupied occupants can illustrate the thermal performance and insulation effect of the envelope. As shown in Table 5, the thermal parameters of the exterior walls of the three building types (in the order from outside to inside) are:
Table 5.
The thermal parameters of external walls for the three building types.
- For detached house, the Layers and materials were 30 mm Polyphenyl granule + 20 mm Cement mortar + 170 mm Reinforced concrete + 20 mm Cement-lime mortar [35];
- For multi-story dwelling, the Layers and materials were 30 mm Semi-hard mineral wool board + 20 mm Cement mortar + 170 mm Reinforced concrete + 20 mm Cement-lime mortar [36];
- For high-rise dwelling, the Layers and materials were 20 mm Expanded polystyrene panel + 20 mm Cement mortar + 170 mm Reinforced concrete + 20 mm Cement-lime mortar [36].
The thermal performance of external walls and roofs meets the requirements of “Design Standard for Energy-saving Residential Buildings in Hot Summer and Cold Winter Zone”. As for the types of exterior windows, they are all plastic steel hollow windows. In the selection of window types, the most common window types in the three types of buildings in the questionnaire investigation were followed, avoiding the influence of window thermal performance on building energy consumption and ensuring the authenticity of the experimental data.
The hourly heat generation data of the lighting fixtures, electrical equipment and gas stoves in each room in the house are in the literature. The operation mode of heating and air-conditioning equipment is intermittent operation, while the indoor set temperature is 18 °C and 26 °C, respectively. The air-source heat pump air conditioner is selected as a source of cooling and heating, and the rated energy efficiency ratio is consistent with the current “Design Standard for Energy-saving Residential Buildings in Hot Summer and Cold Winter Areas”, with heating at 1.9 and air conditioning at 2.3. For the ventilation of the room, first consider adopting a fixed ventilation method of 1 h−1 air changes throughout the year.
3.2.3. Evaluation Indices
In this study, the PMV/PPD model, proposed by P.O. Fanger using the heat-balance equations and empirical studies on skin temperature, was chosen as a way to define comfort. In this model, subjects were asked about their thermal sensations through a standard thermal comfort survey, and people’s thermal sensations were classified on a 7-point scale from cold (−3) to hot (+3). At the same time, Fanger’s equations are used to calculate the PMV for a specific combination of air temperature, mean radiant temperature, relative humidity, air velocity, metabolic rate, and clothing insulation in the space where a set of subjects are located [37,38]. Thus, the PMV index, an integrated and objective value scale, is an important parameter that can be used to evaluate thermal comfort condition, as it incorporates a number of thermal comfort influences such as air temperature, air velocity, mean radiant temperature, humidity, clothing and activity level, among others, the thermal sensation scale can be seen in Table 6. The ranges of application for the PMV model were shown in Table 7.
Table 6.
Thermal sensation scale of PMV.
Table 7.
Ranges of application for the PMV model.
When PMV is zero, thermal comfort remains constant; when PMV is greater than 0, it indicates relatively hot conditions, where +1, +2 and +3 indicate slightly warm, warm and hot conditions; and when PMV is less than 0, it indicates relatively cold conditions, where +1, +2 and +3 indicate slightly cool, cool and cold conditions [38,39].
In association with relevant academic studies, to express the quality of the thermal environment, the percentage of thermal dissatisfaction (i.e., those who feel too cold or too hot) is predicted quantitatively in this paper, and the PPD index (predicted percentage of dissatisfaction) is also used. The PPD is related to the PMV value, expressed through equation (1), whose mathematical structure shows that under thermoneutral conditions (i.e., PMV = 0), a small dissatisfaction can be expected percentage (5%) [2,38].
In this paper, we consider the usual conditions as a standard base case, the quietly seated person in the selected units. As shown in Table 8, the temperature and the relative humidity are all real-time temperature and the relative humidity, as it is an indoor situation and windows are all closed, the air is steady, so we can make it as 0.1 m/s. For a quietly seated person, the Met is 1.1. For the clo value, we define it as a typical case, in spring, autumn, winter season, the common situation is cold if wearing the typical clothes (the clo value x in Table 8, spring and autumn, clo = 0.75, winter clo = 1, summer clo = 0.5).
Table 8.
Parameters setting.
3.3. Simulation Method
In this study, the energy dynamic simulation analysis and calculation software DOE-2IN developed by IBPCABR (Institute of Building Physics, China Academy of Building Research) was selected to perform energy consumption simulation on three case models [40]. This software uses the DOE-2 program as the calculation core, which can simulate the heating and air-conditioning load of the building and the energy consumption of heating and air-conditioning equipment for 8760 h a year [41]. It is essentially consistent with the DOE-2 software. The DOE-2 dynamic simulation load calculation method is a computer program based on the response coefficient method, which was proposed by the US Department of Energy and developed by the Lawrence Berkeley National Laboratory.
Compared with DOE-2, the DOE2IN has the biggest advantage: it is convenient, concise and has an intuitive architectural description [42,43]. It runs under the Windows operating system and has the main characteristics of general Windows applications. The user should only complete the description of the building through a standard Windows dialog box. For example, the corresponding energy-saving material parameters can be selected through the construction of the envelope structure, moreover, the thermal performance of the envelope and the building thermal bridges can also be calculated with DOR-2IN. Furthermore, other complex analysis calculations and various forms of calculation result output are completely automatically completed by it.
4. Analysis
4.1. Analysis of Indoor Thermal Comfort of Three Building Types
The PMV of the four seasons is shown in Figure 14.
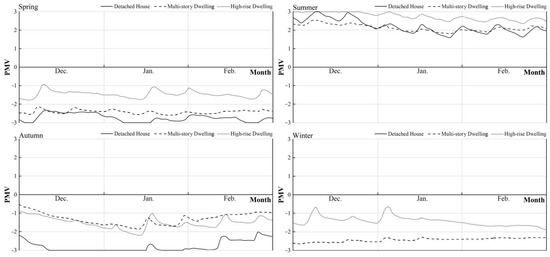
Figure 14.
The PMV situations in four seasons in three building types.
In spring, the PMV values in all three cases were between −1 and −3, which is still cold for a person sitting quietly in a cape. In all three cases, the PMV values for the high-rise dwellings were between −1 and −2, meaning that more than 60% of people would feel uncomfortable and need to use air conditioning. The PMV values for multi-story dwellings ranged between −2 and −2.5, which was a little cold but required the use of air conditioning for a long time. However, for detached houses, the PMV values are between −2.5 and −3, which are hot and cold, and require the use of air conditioning almost full time.
In summer, as shown above, high-rise dwellings require almost full-time air conditioning for cooling. Multi-story dwellings require more than half of the time, while detached dwellings require the least amount of air conditioning time. Therefore, in summer, high-rise dwellings consume the most energy, while freestanding dwellings require air conditioning all day and sometimes at night, and multi-story dwellings are the least energy intensive building type.
In autumn, for high-rise and multi-story dwellings, PMV values are 0 to −2 most of the time and only a short time air conditioning is needed, but for detached houses, PMV values are −2 to −3 most of the time and it is freezing and longtime air conditioning operation is needed.
In winter time, the values for high rise dwellings are −0.5 to −2 and people have to use air conditioners. For multi-story dwellings, PMV values are between −2 and −3, which are very cold and require the use of air conditioning for long periods of time. However, for detached houses, the PMV value is always −3, which is an extremely cold condition and requires the use of air conditioners almost all the time. Based on the above, we can know that for energy consumption, freestanding houses are the largest, followed by multi-story dwellings, and high-rise dwellings are the building type with the least energy consumption in spring.
In conclusion, among the three building types, detached houses consume the most energy in a year, followed by multi-story dwellings. High-rise dwellings are the most energy-efficient building type. To demonstrate this result, computer-aided simulations were conducted.
4.2. Simulation Analysis of the Three Building Models
The simulation program DOE-2 was used in this research verifying the authenticity of energy consumption and the feasibility of optimized design strategies for each case model of the three building types.
In many cases, like in the “Design Standard for Energy Efficiency of Residential Building in Hot Summer and Cold Winter Zone” [17] in China, the energy consumption standard made based on the indoor temperature was easily set 18 ℃ in winter and 26 ℃ in summer. However, in this study, the energy consumption calculation was based on the thermal comfort, and the clo was averaged set as one. The outdoor temperature-humidity, solar radiation, and heat loss/gains were the real-time values. The air conditioner was assumed to be 24 h operating without natural ventilation. The total energy consumption in the three building types is shown in Table 9. For the high-rise dwelling, the thermal performance is better than the other two types, the total energy consumption is only around half of the other two types. For the multi-story dwelling and the detached house, both in summer and winter were close, but for the energy consumption per m2, the detached house is a little better than the multi-story dwelling.
Table 9.
Energy consumption for heating/cooling for the three building types.
Figure 15a–c, and Table 9 show, for all three building types, that the heating load is much higher than the cooling load and how to improve the thermal insulation property is a problem that all building types must face. Additionally, among these three building types, both in the hot and cold seasons, the heating and cooling loads, high-rise dwelling, were the lowest. That says the insulation of external envelopes is much better than the other two types. Multi-story dwelling and high-rise dwelling, for the total heating and cooling load, the multi-story dwelling type is smaller, but for m2, the detached house is slightly better than the multi-story dwelling. For the transition seasons, the heating and cooling loads can still be seen countless, the passive design and natural ventilation should be considered during our design process.
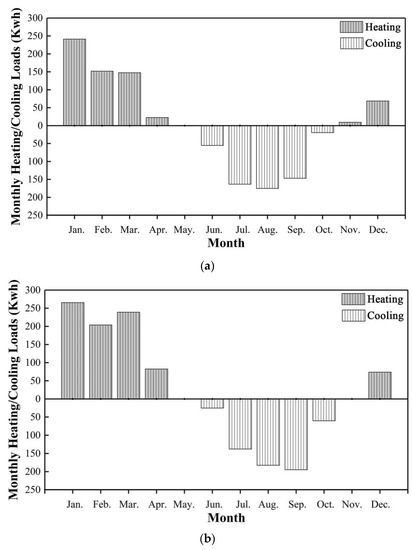
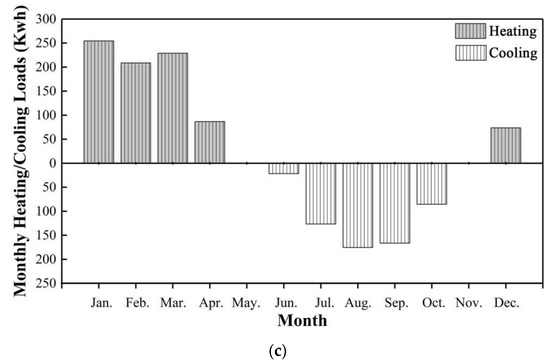
Figure 15.
(a) Monthly heating/cooling loads of detached house; (b) Monthly heating/cooling loads of multi-story dwelling; (c) Monthly heating/cooling loads of high-rise dwelling.
The energy consumption in three building types is not the real situation because the user’ habits, usage period, the thermal requirement and so on are different. In the “Design Standard for Energy Efficiency of Residential Buildings in Hot Summer and Cold Winter Zone” [17], the energy consumption of residential building should be smaller than 65 kwh per m2. However, in this simulation, the value is much higher than in the standard, because the standard is set for the real situation, but the simulation is based on an ideal condition, nobody in and the air conditioner operating all 24 h to keep the thermal comfort.
The energy consumption results of three building types, which were simulated by the program DOE-2IN, showed that the energy consumption values obtained in the experiment were similar, proving the feasibility of the simulation program and can be used normally in later WWR optimization.
5. Optimization Analysis of the WWR
The buildings selected in this paper are actual residences, in an attempt to study the directions of the windows’ sizes influence residential energy consumption. Each direction of the windows for a single variable change will make all directions of energy load change in turn and will not affect the results and the trend analysis, to represent the result better, and in the meantime to avoid facing the influence of different room areas on the energy load of the building.
In this paper, the simulation results for statistical processing, the per unit area (m2) energy load index of single room were calculated respectively in a one-year period.
In the interest of better excluding the effect of shading on building energy consumption, all simulation results in this paper are carried out in the way of no shading. The regression relationship between residential building unit area (m2) and WWR can be derived from the simulation results by fitting a polynomial. The first optimization analysis step was to set the boundary conditions by considering a constant external condition while changing the WWR index. The boundary conditions are as shown in Table 5. The temperature and humidity of the three building types in one-year are shown in Figure 16, Figure 17 and Figure 18.
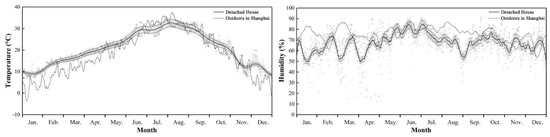
Figure 16.
Temperature and humidity in detached houses throughout the year.
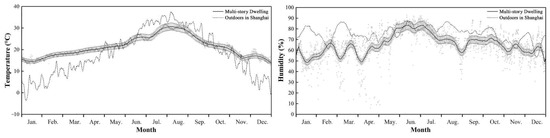
Figure 17.
Temperature and humidity in multi-story dwelling throughout the year.
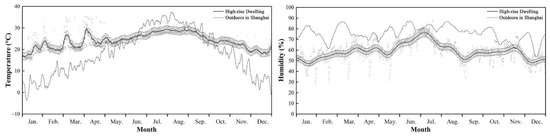
Figure 18.
Temperature and humidity in high-rise dwelling throughout the year.
In this study, the window orientations are divided into south, north and east, and Figure 19, Figure 20 and Figure 21 illustrate the regression relationship of heating load, cooling load, annual energy consumption load and the WWR in different orientations. Furthermore, the building energy consumption per unit area is shown in Table 10, Table 11 and Table 12. As a more detailed supplement, the relationship between the various energy consumption loads per unit area of the buildings and WWRs is shown in the following three figures.
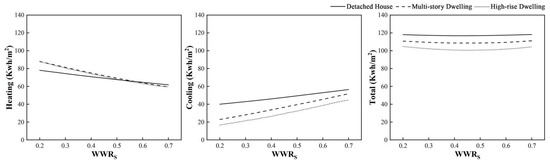
Figure 19.
Relationship between WWRS and building energy consumption for the three building types.
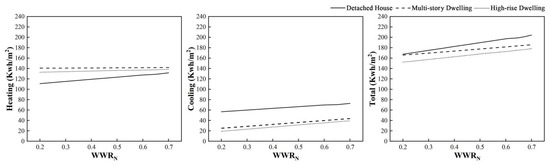
Figure 20.
Relationship between WWRN and building energy consumption for the three building types.
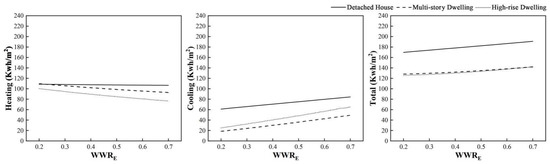
Figure 21.
The relationship between WWRE and building energy consumption for the three building types.
Table 10.
Heating/cooling energy consumption on the south side of the three building types.
Table 11.
Energy consumption in heating/cooling in the north side of the three building types.
Table 12.
Energy consumption in heating/cooling in the east side of the three building types.
For the south side, with the growth of the WWR, the heating loads of the multi-story dwelling and high-rise dwelling have a great reduction, but the cooling loads have a large increase. Additionally, while the WWR is between 0.4 and 0.5, the energy consumption per unit area of each building type reaches the optimal value. In detail, the heat absorption through the windows is more than the heat loss for each building type, so the heating load is reduced in winter. However, when the WWR rises in summer, the heat loss and heat radiation, which are unfavorable factors, increase simultaneously, resulting in a significant increase in the heating load. Therefore, under the superposition of the above two seasons, the total energy consumption changes throughout the year show an inverse parabolic relationship, which means that all three building types will reach the optimal value of energy consumption design within the WWR of 0.4–0.5.
On the north side, as the WWR grew, the heating loads of multi-story dwelling and high-rise dwelling changed a little, but the heating load of the detached house has increased significantly. However, the cooling load of the three building types has increased significantly. Exactly, the cooling load per unit area is highest in detached houses, followed by multi-story and least in high-rise dwelling, which is related to the building structure, insulation, window structure and window material of the three building types, as detailed in Table 1 and Table 3. For the total annual energy consumption per unit of floor area, the growth in total energy consumption is accompanied by an increase in the WWR, so that the smaller the WWR the lower the energy consumption for all three building types, and vice versa.
For the east side, the heating load tends to decrease for all three building types as the WWR increases. Furthermore, the reduction is slowest in the multi-story dwelling and fastest in the high-rise dwelling. However, for the cooling loads, the greater the east WWR, the greater the cooling load consumption. In addition, among them, the fastest growth rate is the multi-story dwelling, and the slowest one is the detached house. In terms of total energy consumption per unit building area, detached house has the highest annual unit energy consumption and the highest growth rate, while the multi-story dwelling is similar to the high-rise dwelling.
In the state of no shading, the heating load of the room in the east-west direction has a slight decrease with the growth of the WWRS, but the cooling load increases significantly. On the whole, for the comprehensive energy consumption of the detached house, the smaller WWR results in lower energy consumption per unit area. For multi-story and high-rise dwellings, when WWR value is between 0.4 and 0.5, a balance between the WWR and energy consumption is achieved. For north-facing rooms, because the direct solar radiation cannot be obtained, increasing the window area makes the increase in the amount of solar scattered radiation limited. However, for high-rise dwellings, the increase in the north-facing WWR has little influence on the increase in heating load in winter. The detached houses and multi-story dwellings have increased significantly. It can be seen that the WWR of the north rooms should be reduced as much as possible.
6. Conclusions
This paper provides a comprehensive overview of energy consumption in the residential sector in China based on a detailed dataset of 368 surveyed households from the 2018 China Residential Energy Consumption Survey (CRECS).
First, the questionnaire survey shows that detached house, multi-story dwelling and high-rise dwelling are the three most common types of houses in HSCW zone of China, and that high-rise dwelling is the newest and detached house is the oldest. About 50.00% of the respondents were high-rise residences, 33.33% were multi-story residences, and only 16.67% were detached residences. The age of construction and floor area varied significantly by building type. High-rise dwelling uses the largest window sizes, while multi-story dwellings use the smallest window sizes for historical reasons. The total energy consumption of high-rise dwelling is the highest of the three residential building types, while a detached house has high total energy consumption, but the lowest annual energy consumption per unit area due to their large size. Residents living in high-rise buildings have the highest human comfort requirements of the three building types. The thermal satisfaction of high-rise residences is better than the other two building types. Meanwhile, the energy consumption generated is related to the type of dwelling: in the south direction, for example, the energy consumption per unit area of the three building types shows a growing trend as the WWR increases.
Second, based on the questionnaire survey, Shanghai, a city located in the middle of the three regions was selected, as the experimental area to represent the HSCW zone in China and selected three residences based on the questionnaire results, combined with the year of construction, the average window area and other characteristics as the experimental subjects. The experiment is an investigation of the current situation of the three dwellings under natural conditions, and the results show that: for example, in the south direction, the PMV of the three building types shows a large difference, with the thermal comfort of high-rise dwelling being better and that of detached houses being the worst. Alternatively, the heating load of each building type is greater than the cooling load in a year, but the energy consumption per unit area of the detached house is the largest, followed by multi-story dwelling, and the smallest for high-rise dwelling. Overall, this part provides the current data basis for the next optimization simulation and analysis of the WWR.
Third, and most importantly in this paper, the impact of WWR on indoor heating and cooling energy demand is experimented and then analyzed through hourly-based dynamic simulations, which are of interest to regions in the HSCW region of China, such as the reference location Shanghai. So, at the beginning of these specific experiments, different building types, such as detached house, multi-story dwelling and high-rise dwelling, and different envelope and window characteristics were considered as independent variables, including insulation levels, orientation, shading and control of natural ventilation. The results of simulations performed at a constant occupancy rate indicate that an optimal WWR value that balances the three aforementioned energy uses results in the least amount of energy required per year.
Overall, for the comprehensive energy consumption of the detached house, the smaller WWR results in lower energy consumption per unit area. For multi-story dwelling and high-rise dwelling, when WWR value is between 0.4 and 0.5, a balance between the WWR and energy consumption is achieved. For north-facing rooms, because the direct solar radiation cannot be obtained, increasing the window area makes the increase in the amount of solar scattered radiation limited. However, for high-rise dwelling, the increase in the north-facing WWR has little effect on the increase in heating load in winter. The detached house and multi-story dwelling have increased significantly. It can be seen that the WWR of the north rooms should be reduced as much as possible.
Author Contributions
Conceptualization, methodology, writing—review and editing H.L.; software, computer-aided simulation and data curation, Z.Z.; writing—original draft preparation, X.M.; supervision, W.L., S.K.; funding acquisition, D.L. All authors have read and agreed to the published version of the manuscript.
Funding
This research was supported by the Scientific Research Foundations of Zhejiang Sci-tech University (Code: 11142932618142).
Informed Consent Statement
Not applicable.
Data Availability Statement
Not applicable.
Acknowledgments
Not applicable.
Conflicts of Interest
The authors declare no conflict of interest.
Nomenclature
WWR: Windows-to-Wall Ratio; HSCW zone, hot-summer and cold-winter zone.
References
- Yılmaz, Z. Evaluation of energy efficient design strategies for different climatic zones: Comparison of thermal performance of buildings in temperate-humid and hot-dry climate. Energy Build. 2007, 39, 306–316. [Google Scholar] [CrossRef]
- Yu, J.; Yang, C.; Tian, L.; Liao, D. Evaluation on energy and thermal performance for residential envelopes in hot summer and cold winter zone of China. Appl. Energy 2009, 86, 1970–1985. [Google Scholar] [CrossRef]
- China National Statistics Bureau or Yearbook 2020; China Statistics Press: Beijing, China, 2020.
- China Building Energy Efficiency Annual Development Research Report 2020; China Construction Industry Press: Beijing, China, 2020.
- Chen, S. Contrastive analyses on annual energy consumption characteristics and the influence mechanism between new and old residential buildings in Shanghai, China, by the statistical methods. Energy Build. 2009, 41, 1347–1359. [Google Scholar] [CrossRef]
- Wong, S. Household Electricity Consumption Per Capita in China 2000–2018 (in Kilowatt Hours). Available online: https://www.statista.com/statistics/597852/household-consumption-of-electricity-per-capita-in-china/ (accessed on 15 January 2021).
- Marino, C.; Nucara, A.; Pietrafesa, M. Mapping of the indoor comfort conditions considering the effect of solar radiation. Sol. Energy 2015, 113, 63–77. [Google Scholar] [CrossRef]
- Shen, H.; Tzempelikos, A. Sensitivity analysis on daylighting and energy performance of perimeter offices with automated shading. Build Environ. 2013, 59, 303–314. [Google Scholar] [CrossRef]
- Shen, H.; Tzempelikos, A. Day lighting and energy analysis of private offices with automated interior roller shades. Sol. Energy 2012, 86, 681–704. [Google Scholar] [CrossRef]
- Krarti, M.; Erickson, P.M.; Hillman, T.C. A simplified method to estimate energy savings of artificial lighting use from day lighting. Build. Environ. 2005, 40, 747–754. [Google Scholar] [CrossRef]
- Stegou-Sagia, A.; Antonopoulos, K.; Angelopoulou, C.; Kotsiovelos, G. The impact of glazing on energy consumption and comfort. Energy Convers. Manag. 2007, 48, 2844–2852. [Google Scholar] [CrossRef]
- Sartori, I.; Napolitano, A.; Voss, K. Net zero energy buildings: A consistent definition framework. Energy Build. 2012, 48, 220–232. [Google Scholar] [CrossRef]
- Ochoa, C.E.; Aries, M.B.; van Loenen, E.J.; Hensen, J. Considerations on design optimization criteria for windows providing low energy consumption and high visual comfort. Appl. Energy 2012, 95, 238–245. [Google Scholar] [CrossRef]
- Jian, Y.W.; Jiang, Y. Influence of window-wall ratio on annual energy consumption for heating and air conditioning in residential buildings. Hv&Ac 2006, 36, 1–5. [Google Scholar]
- Hou, Y.B.; Fu, X.Z. Affection of Window-Wall Ratio on Energy Consumption in Region of Hot Summer and Cold Winter. Archit. Technol. 2002, 32, 661–662. [Google Scholar]
- Li, Y.Y.; Chen, G.M. Influence of Envelops on Energy Consumption of Cetral Air-conditioning System. J. Wuhan Univ. Sci. Tech. 2003, 26, 256–258. [Google Scholar]
- Design Standard for Energy Efficiency of Residential Buildings in Hot Summer and Cold Winter Zone (JGJ134-2010); Ministry of Housing and Urban-rural Development of the People’s Republic of China: Beijing, China, 2010. (in Chinese)
- Liu, Y.; Zou, S.; Chen, H.; Wu, X.; Chen, W. Simulation Analysis and Scheme Optimization of Energy Consumption in Public Buildings. Adv. Civ. Eng. 2019, 2, 1–13. [Google Scholar] [CrossRef]
- Yu, J.; Tian, L.; Yang, C.; Xu, X.; Wang, J. Sensitivity analysis of energy performance for high-rise residential envelope in hot summer and cold winter zone of China. Energy Build. 2013, 64, 264–274. [Google Scholar] [CrossRef]
- Susorova, I.; Tabibzadeh, M.; Rahman, A.; Clack, H.L.; Elnimeiri, M. The effect of geometry factors on fenestration energy performance and energy savings in office buildings. Energy Build. 2013, 57, 6–13. [Google Scholar] [CrossRef]
- Lee, J.W.; Jung, H.J.; Park, J.Y.; Lee, J.B.; Yoon, Y. Optimization of building window system in Asian regions by analyzing solar heat gain and day lighting elements. Renew Energy 2013, 50, 522–531. [Google Scholar] [CrossRef]
- Leskovar, V.Ž.; Premrov, M. An approach in architectural design of energy-efficient timber buildings with a focus on the optimal glazing size in the south-oriented façade. Energy Build. 2011, 43, 3410–3418. [Google Scholar] [CrossRef]
- Goia, F.; Haase, M.; Perino, M. Optimizing the configuration of a façade module for office buildings by means of integrated thermal and lighting simulations in a total energy perspective. Appl. Energy 2013, 108, 515–527. [Google Scholar] [CrossRef]
- Pino, A.; Bustamante, W.; Escobar, R.; Pino, F.E. Thermal and lighting behavior of office buildings in Santiago of Chile. Energy Build. 2012, 47, 441–449. [Google Scholar] [CrossRef]
- Hassouneh, K.; Alshboul, A.; Al-Salaymeh, A. Influence of windows on the energy balance of apartment buildings in Amman. Energy Convers. Manag. 2010, 51, 1583–1591. [Google Scholar] [CrossRef]
- Persson, M.L.; Roos, A.; Wall, M. Influence of window size on the energy balance of low energy houses. Energy Build. 2006, 38, 181–188. [Google Scholar] [CrossRef]
- Tzempelikos, A.; Athienitis, A.K. The impact of shading design and control on building cooling and lighting demand. Sol. Energy 2007, 81, 369–382. [Google Scholar] [CrossRef]
- Alibaba, H. Determination of optimum window to external wall ratio for offices in a hot and humid climate. Sustainability 2016, 8, 187. [Google Scholar] [CrossRef]
- Marino, C.; Nucara, A.; Pietrafesa, M. Does window-to-wall ratio have a significant effect on the energy consumption of buildings? A parametric analysis in Italian climate conditions. J. Build. Eng. 2017, 13, 169–183. [Google Scholar]
- Mashreghi, Z.; Léger, C.; Haziza, D. Bootstrap methods for imputed data from regression, ratio and hot-deck imputation. Can. J. Stat. 2014, 97, 1–9. [Google Scholar] [CrossRef]
- Raja, G.; Angelo, G.C.; Moshe, B.A. Combining multiple imputation and control function methods to deal with missing data and endogeneity in discrete-choice models. Transp. Res. Part B Methodol. 2020, 142, 45–57. [Google Scholar]
- Chen, S.; Li, N.; Guan, J.; Xie, Y.; Sun, F.; Ni, J. A statistical method to investigate national energy consumption in the residential building sector of China. Energy Build. 2008, 40, 654–665. [Google Scholar] [CrossRef]
- Code for Design of Civil Buildings (GB50352-2005); Ministry of Housing and Urban-rural Development of the People’s Republic of China: Beijing, China, 2005. (in Chinese)
- Meteorological Information Center of China Meteorological Administration and Tsinghua Meteorological Administration and Tsinghua University. Meteorological Data Set for Building Thermal Environment Analysis of China; China Construction Industry Press: Beijing, China, 2005. (in Chinese) [Google Scholar]
- Wang, Z.J.; Yi, L.L.; Gao, F.S. Night ventilation control strategies in office buildings. Sol. Energy 2009, 83, 1902–1913. [Google Scholar] [CrossRef]
- Fanger, P.O. Thermal Comfort: Analysis and Applications in Environmental Engineering; McGraw-Hill: New York, NY, USA, 1970. [Google Scholar]
- Liu, H.Q. Design Method of Energy Efficiency Residential Building in Hot-Summer and Cold-Winter Zone in China. Ph.D. Thesis, Saga University, Saga, Japan, 2017. [Google Scholar]
- ASHRAE, Thermal Environmental Conditions for Human Occupancy. ASHRAE Standard 55; American Society of Heating, Refrigerating and Air-conditioning Engineers: Atlanta, GA, USA, 2017. [Google Scholar]
- Kana, H.; Yao, F.; Yao, J. Numerical optimization of thermal comfort improvement for indoor environment with occupants and furniture. Energy Build. 2015, 88, 303–315. [Google Scholar]
- Hong, T.; Sartor, D.; Mathew, P.; Yazdanian, M. Comparisons of HVAC Simulations Between EnergyPlus and DOE-2.2 for Data Centers; ASHRAE Transactions: Berkeley, CA, USA, 2009; Volume 115, pp. 373–381. [Google Scholar]
- Crawley, D.B.; Hand, J.W.; Kummert, M.; Griffith, B.T. Contrasting the capabilities of building energy performance simulation programs. Build. Environ. 2008, 43, 661–673. [Google Scholar] [CrossRef]
- Zhu, D.; Hong, T.; Yan, D.; Wang, C. A detailed loads comparison of three building energy modeling programs: EnergyPlus, DeST and DOE-2.1E. Build. Simul. 2013, 6, 323–335. [Google Scholar] [CrossRef]
- Zheng, X.; Wei, C.; Qin, P.; Guo, J.; Yu, Y.; Song, F.; Chen, Z. Characteristics of residential energy consumption in China: Findings from a household survey. Energy Policy 2014, 75, 126–135. [Google Scholar] [CrossRef]


Publisher’s Note: MDPI stays neutral with regard to jurisdictional claims in published maps and institutional affiliations. |
© 2021 by the authors. Licensee MDPI, Basel, Switzerland. This article is an open access article distributed under the terms and conditions of the Creative Commons Attribution (CC BY) license (https://creativecommons.org/licenses/by/4.0/).