Abstract
Large-scale nature-based solutions (NBS) contribute to the change in large-scale landscapes and ecosystems for which continuous monitoring activities would be necessary to reflect the constantly changing environment. To fill the existing gap in the design-making process of implementing NBS, a framework that incorporates the landscape dynamics into the design of NBS is expedient and beneficial. This research addresses the above knowledge gap and presents a practically applicable framework for large-scale NBS that incorporates landscape dynamics into the design of NBS. To amplify the power of stakeholders’ involvement and evidence-based knowledge (i.e., field experiences and literature reports), the framework developed in this study was evaluated on a case-study site in Odense area, Denmark, within the EU-funded RECONECT project. Furthermore, this study also addresses the relationship between landscape dynamics and biodiversity by performing a detailed literature review. The results obtained from this work demonstrate that the framework developed can be applied to existing large-scale NBS and it has the potential to recommend guidelines during the planning and design step of large-scale NBS.
1. Introduction
Nature-based solutions (NBS) are one of the most promising climate adaptation strategies in Europe [1], which has proven advantages to reduce flood risk and provide co-benefits [2]. Besides, NBS also offers strategies for the sustainable use of ecosystems and provides enhanced social-ecological resilience in the region. This has been highlighted as a short-term priority climate action in the 24th edition of the United Nations Climate Conference [1]. Therefore, governments and international organizations are increasingly more interested in the implementation of large-scale NBS worldwide in an effort to restore ecosystem services, and support human well-being and biodiversity [3]. However, the existing International Union for Conservation of Nature (IUCN) framework for NBS and its principles does not necessarily address the temporal dynamics and ecosystem complexity, which are considered to be important factors for the successful implementation of NBS. Ecosystems have self-organizing abilities, e.g., hydrology and the propagation of disturbance can be highly self-reinforcing [4]. Therefore, local variations can create global patterns, and in many instances, the outcomes of the interventions are rather difficult to predict or interpret with certainty [5]. Extreme events are representative of severe disturbances of the different regimes present within an ecosystem, which are usually acknowledged as unpredictable or uncertain (the proverbial “black swan”) [6].
Since large-scale NBS usually contribute to changes in ecosystems and biodiversity, a variety of relationships between the implementing interventions and changing factors should be studied in the design process to consider the key, yet representative, parameters/variables that should be monitored in the environment [7]. In order to compare the interventions and results of different NBS, the following aspects should be considered: (i) adopting the same standard procedure for sample collection, (ii) transparency in monitoring and data analysis, (iii) defining the indicators after discussing with different stakeholders, and (iv) evaluating the results using standard metrics and receiving feedback. Thus, the idea is to incorporate all the dynamic factors (such as spatial and temporal properties) into the NBS design and to reach biodiversity benefits on top of resolving the problem of natural disasters.
However, currently there are still knowledge gaps in this field, which can be summarized as follows: (i) The NBS implementation framework by EKLIPSE is focused on urban areas with no consideration of rural and agricultural environments [8]; (ii) the review of the literature to date indicates that the development of a framework and guidelines concerning the implementation of large-scale NBS design is necessary for current and future demands [9]; (iii) at the early stage of planning large scale NBS, it is important to develop a proper methodology, working framework, and guidelines for designing NBS that can be used to address biodiversity degradation; (iv) the changing spatial and temporal properties of habitat networks on the species viability is not readily available/documented during the planning phase of large-scale NBS; (v) landscape ecology has given attention to spatial heterogeneity; however, the spatial and temporal properties have to be integrated into the framework [10,11]; and (vi) a systematic, site-specific practical guideline based on current field data is required in order to further understand the spatial and temporal variables required to ascertain different biodiversity functions.
To fill the gaps in the design process of large-scale NBS, a framework that incorporates landscape dynamics into the design of NBS to address biodiversity degradation is developed and proposed in this study. The framework will also guide experts on how to implement large-scale NBS in practice with full engagement and consent of local communities and stakeholders in the decision-making process. Although the implementation of NBS will certainly bring co-benefits for water, nature, and people [12], this research only focuses on nature, which means that a framework proposed for large-scale NBS design is from an environmental point of view. Additionally, this research studied biodiversity on the landscape/habitat scale to understand how to restore or modify habitat diversity in practice, which is more practical and applicable for large-scale NBS projects. The specific objectives of this research can be stated as follows: (1) to study the relationship between landscape dynamics and biodiversity patterns, (2) to conceptualize and develop a framework that incorporates the landscape dynamics and biodiversity into the design of large-scale NBS, and (3) to evaluate the framework in a case study area. For this purpose, the case of Odense area in Denmark, which is a coastal area in the EC-funded RECONECT project, was selected.
2. Methodology
A detailed conceptual framework for this research work is shown in Figure 1. This framework shows how we can incorporate landscape dynamics into the design of large-scale NBS to address biodiversity degradation.

Figure 1.
Flow chart showing the conceptual framework developed in this study.
2.1. Studying Biodiversity in Dynamic Landscapes (Objective 1)
2.1.1. Literature Review
The implementation of large-scale NBS contributes to changes in ecosystems and biodiversity; therefore, the linkage between biodiversity patterns and dynamic landscapes was inferred by performing a literature study. The following questions were asked/answered during the literature review:
- What are the key variables that decide the response of species populations to habitat pattern changes?
In this study, a total of ten key network variables were distinguished, including spatial (habitat) network properties and temporal (habitat) network properties (Table 1). Nine key network properties were chosen based on the methodology proposed in the literature [11,12]. Another variable, habitat structural heterogeneity, was added, as it has a positive effect on the biodiversity [13].

Table 1.
The key variables and their definitions regarding network properties (modified from [11]).
- What is the effect of changing spatial and temporal network properties on the species viability according to the outcome of creating habitats by large-scale NBS?
In this study, three case studies were selected to study the relationship between biodiversity patterns and dynamic landscapes: Thur River in Switzerland, Greater Aarhus in Denmark, and Sand Engine in the Netherlands (Table 2). The different interventions and outcomes were described as follows: (1) Intervention: to identify which species groups were studied and which kinds of network properties were considered through empirical studies, and (2) Outcomes: positive effect, negative effect, neutral (no effect), or mixed effect [11]. Based on the empirical findings, Table 2 was prepared, and it shows a positive/negative or mixed effect of an intervention on the individual (target) species.
Table 2.
The effects of increasing the spatial or temporal network properties on the species viability (note: the categories in this table were adapted from [11]).
2.1.2. Stakeholder/Expert Involvement
Three key stakeholders were interviewed in this study. These interviewees were asked questions on the case study areas and their responses were used to identify the current biodiversity situations and future monitoring plans, and their opinions were integrated into Table 2. The professional backgrounds of the stakeholders/experts were (i) a biologist involved in different bio-monitoring programs in the Egå Engsø Lake (interviewed by Skype), (ii) a researcher/consultant on nature-based flood defense at Deltares, The Netherlands (interviewed face to face), and (iii) a researcher from the University of Neuchâtel, Switzerland, who has been working on a case study of the restoration of a stretch of the Thur River.
2.2. Framework Development (Objective 2)
2.2.1. Literature Review for the Implementation of the Framework
The existing publications regarding the implementation guidance of NBS were reviewed. Moreover, a framework for the implementation of water source projects was also included because the implementation of large-scale NBS is usually located in river basins and coastal areas to reduce the risks of flooding [5]. After the literature review for the implementation framework, a general framework that incorporates landscape dynamics into the design process of NBS was formulated to address biodiversity degradation (Figure 2). In the design process, it was suggested to select measures of NBS, design a robust monitoring system, and thereafter design the intervention [3]. Therefore, these principles were followed in this study to develop two new steps and provide practical tools for decision-makers who aim to enhance biodiversity through large-scale NBS. The two new steps are (i) how to select NBS measures (based on their habitats), and (ii) identify and study/analyze the key variables involved in dynamic landscapes that could influence their target species in their creating/target habitats. After these two steps, the decision-makers can ascertain which key variables should be monitored or changed in their case study area and thereafter design a robust monitoring system for the design process. Only the measures that could be influenced by the variables in dynamic landscapes need additional design studies. From practical experience, it is not a necessary step for every measure identified or recommended for the study area because it depends mainly on the selected NBS measures.
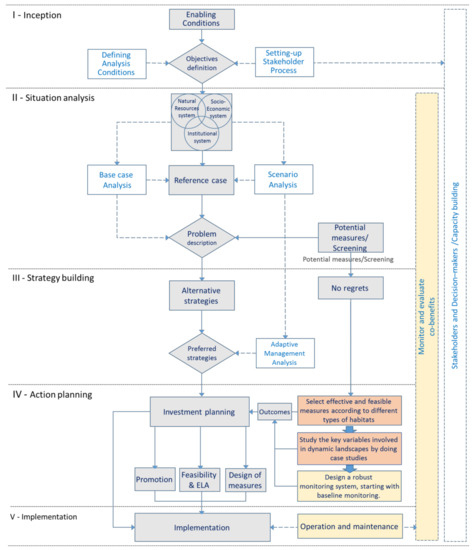
Figure 2.
Framework for the implementation of large-scale NBS projects. ( The main parts of this framework, adapted from [27];
  The elements to design a robust monitoring system and monitoring co-benefits, adapted from [3,8];
  The processes of selecting the measures and studying the key variables involved in dynamic landscapes were developed by the authors).
The main parts of this framework, adapted from [27]; The elements to design a robust monitoring system and monitoring co-benefits, adapted from [3,8]; The processes of selecting the measures and studying the key variables involved in dynamic landscapes were developed by the authors).
2.2.2. Categories and Definition
In order to support biodiversity, decision-makers should select effective NBS measures and implement them in large-scale NBS projects. For the design process, firstly, decision-makers should know which NBS measures can be used for their sites (i.e., the study area) to cause positive effects on their habitats. Therefore, a set of tools was developed in this study to help decision-makers (such as environmental regulators and environmental consultants) select effective measures according to the different types of habitats.
Habitat types covered by large-scale NBS can be divided into two categories: wetlands and not wetlands. Wetland habitat types consist of inland wetlands, coastal/marine wetlands, and human-made wetlands [28]. Forests and vegetated land is the habitat for non-wetlands (Figure S1).
In order to select NBS measures, the RECONECT NBS measures database was used [11,29]. There are 6 categories of solutions, including 49 measures that could be used in large-scale NBS projects. The possible benefits or the effects of implementing NBS on different habitat types were assessed based on a literature review and according to the list of NBA measures [11,29]. In this study, the intervention and outcomes are described as follows: (1) Intervention: to study the effect of NBS measures on different habitat types by performing a literature review, and (2) Outcomes: positive effect, negative effect, neutral (no effect), or mixed effect. Tables S1–S4 shows the effect of different NBS measures on different habitat types based on the literature review.
2.3. Evaluation of the Framework in a Case Study (Objective 3)
2.3.1. Case Study Area
A case study area within the RECONECT project using a hybrid combination (such as the blue-green-grey infrastructure) to achieve biodiversity and human well-being was selected. The RECONECT project aims to develop a holistic ecosystem-based framework and evaluation to advance the knowledge of NBS in the context of hydro-meteorological risk reduction. To evaluate the proposed framework in this research, a case study area was selected that is different from the 3 cases studies presented in Table 2. The reason for that was to verify and check whether the same table could be applied to the other NBS case, which is in progress within the RECONECT project. The selected case study area is a coastal area located in the Odense Fjord by the Seden Strandby, a suburb of Odense, the third largest city in Denmark. This area is one of the top 10 flood-prone areas in Denmark. The NBS in this area aims not only to protect livelihoods along the coastline from floods but also to improve the coastal habitats and species diversity within the Natura 2000 area [12].
2.3.2. Questionnaire Based Survey
There were 3 steps during the questionnaire survey for evaluating the developed framework. Firstly, the questionnaire was formulated into two parts, which were an introduction of the framework and a set of questions for the stakeholders to give feedback and suggestions on each step of the framework. Overall, a total of 11 combinations of scaling questions, open-ended questions, and 3 multiple-choice questions were provided. In order to be more time-efficient, most of the questions were ranking-based questions. Secondly, analyzing the results of the questionnaires according to the sum of scores was done based on the collected feedback. The answers were ranked from 1–5 (from “Strongly disagree” to “Strongly agree”) for each question in sections I and II. The sum of scores for each section was used to identify each step in the framework. In order to analyze the answers, the two sections (I and II) followed different standards for identifying the level of agreement/disagreement. The feedback and sum of scores of the approach are shown in Table S5. Finally, the comments received from the stakeholders were responded to and if the feedback showed “Strongly disagree” or “Disagree,” the main reason was analyzed immediately. The framework was then corrected or revised based on the comments (Table S5).
2.3.3. Stakeholder/Expert Involvement
This framework aimed to support the implementation of large-scale NBS with particular emphasis on the biodiversity benefits. Therefore, three key stakeholders from the Odense NBS played an important role in this process. These stakeholders were environmental regulators (e.g., Odense Municipality, Denmark) and environmental consultants (e.g., Amphi International ApS, Odense, Demark). The backgrounds of the stakeholders/experts were as follows: (1) a biologist from Amphi International APS (Amphi is responsible for environmental assessment and monitoring of the Odense NBS), (2) a project manager from Amphi International APS, and (3) a forest and landscape engineer from Odense Municipality. In addition, a small workshop was conducted, during which the key stakeholders involved in the Odense case study area completed the questionnaires.
3. Overview of the Proposed Framework
This framework was developed as a part of the general framework for large-scale NBS (Figure 2) and it follows the principles and implementation guidance for NBS recommended by The World Bank [3]. For the design of large-scale NBS, it has been suggested to select measures of NBS and thereafter, design the intervention. The developed framework can be applied to large-scale NBS in order to support biodiversity, with a focus on incorporating dynamic landscapes into the design process. The step-wise procedure is described as follows.
3.1. Steps of the Framework
The framework proposed shows three main steps in the design process of large-scale NBS. In this research, the main focus was only on the first two steps, i.e., detailing practical guidelines/tools for implementing steps 1 and 2 (Figure 3). In order to integrate the prior knowledge and bridge the knowledge gaps, this work relied on the support/help of experts working in the field of NBS and the various stakeholders (e.g., the local people) involved in Steps 1 and 2. Indeed, local (“wise”) people (citizens/community) with different backgrounds are considered as stakeholders in the RECONECT project. In any general case, for Step 1 (selecting the effective measures), all stakeholder groups can be involved to receive different opinions from different site conditions and situations. Step 2 (studying effects of key variables on the target species) is implemented with experts, such as environmental consultants, environmental scientists, or biologists, to identify the target species for each habitat in the identified study areas. Finally, for Step 3, some recommendations are provided for the decision-makers to follow up on the next step of actions. However, the details of Step 3 are not provided in this framework.
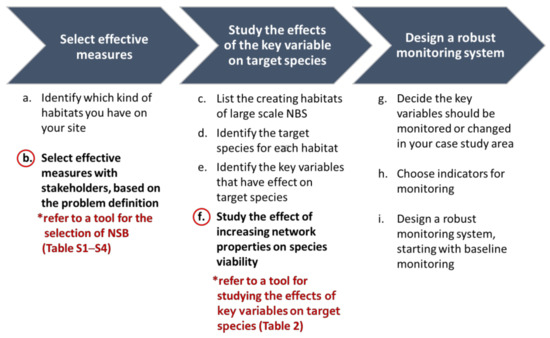
Figure 3.
Framework proposed in this study for the implementation of large-scale NBS.
3.1.1. Step 1: Selecting the Effective Measures
- Identifying the type of habitat at the site
Firstly, the different types of habitats are identified at the site in order to select the effective measures for large-scale NBS. Four main types of habitats [30] were identified based on the literature review (Figure S1). According to the information provided in Figure S1 on the different habitat types, multiple choices of habitats were available, as shown in Tables S1–S4.
- Selecting the effective measures with stakeholders, based on problem definition
According to Tables S1–S4, some NBS measures have positive effects on the habitats and can be identified by the user easily. For example, if we have multiple measures, we can discuss each measure with experts/stakeholders, based on the explanation of NBS measures. More details on the explanation of NBS measures has been reported and discussed elsewhere [9]. After that, the effective measures can be selected by discussing with various experts/stakeholders based on the problem definition [3].
3.1.2. Step 2: Studying the Effects of Key Variables on the Target Species
- Listing the creating habitats of large-scale NBS
During the design process, the intervention of the selected measures in dynamic landscapes in order to achieve the restoration and modification of habitat diversity should be studied in detail. After effective measures have been selected, the new habitats that are created by large-scale NBS are listed by doing a case study-based analysis with experts/stakeholders.
- Identifying the target species for each habitat
The target species for each habitat should be identified with experts/stakeholders afterwards. In general, the species groups should be clearly distinguished, including plants, arthropods, mammals, birds, amphibians, fish, aquatic microorganisms, and others as yet undefined [12].
- Identifying the key variables that have a significant effect on the target species
Referring to the definition of the key variables listed Table 1, 10 key network properties can be managed at the landscape scale. It is important for the users to identify which type of network properties were considered through empirical studies for the selected measures. For example, in the sand engine, an artificial sand bank in the coastal area was created, leading to increasing habitat network areas. The result showed that increasing habitat network areas leads to an increase in the vegetation. Thus, increasing the habitat network areas is one of the key network properties.
- Studying the effect of increasing network properties on species viability
Firstly, information from bio-monitoring reports and relevant research related to the case study areas should be gathered and classified. Secondly, the effect of changing spatial and temporal properties of habitat networks on the species viability at landscape units should be studied by carrying out a literature review. After that, the results obtained should be discussed with the stakeholders to integrate/incorporate more current biota conditions, features, and management strategies from the stakeholders. In this regard, Table 2 assists the user to study/identify the effect of changing network properties on the target species viability. The results of Table 2 reveal information about which network properties would have strong positive or negative effects. It can help the users to decide which network properties should be changed or managed in the target habitat(s).
3.1.3. Step 3: Design a Robust Monitoring System (User-Specific Recommendation)
- Decide the key variables that should be monitored or changed in your case study area
After finishing Steps 1 and 2, the users will understand the key variables in dynamic landscapes that have an effect on the target species, and thereafter, the users can decide which key variables should be monitored or changed in their case study area.
- Choose an indicator for monitoring
Stakeholder/expert involvement is very crucial during this step. They can help to point out or bespeak which indicators should be monitored for biodiversity.
- Design a robust monitoring system, starting with baseline monitoring and previous data
The data needed for monitoring programs should be listed (for example: it can be data at different levels—environmental, climatological, floristic/faunistic, taxonomic, morphological, genomic, phylogenetic, ecological). After that, a robust monitoring system can be designed by considering the baseline situation and the local conditions [3].
4. Results and Discussions
4.1. Biodiversity in Dynamic Landscapes (Objective1): Empirical Studies on Three Large-Scale NBS Case Studies
4.1.1. Introduction of Empirical Studies Regarding Three Large-Scale NBS Case Studies
To address this objective, three large-scale NBS case studies were selected to study the relationship between biodiversity patterns and dynamic landscapes: the Thur River in Switzerland, Greater Aarhus in Denmark, and Sand Engine in the Netherlands (Table 2). The Switzerland and Denmark NBS case studies are also a part of the EU-funded RECONECT project. The outcome shows a positive (+), negative (−), or mixed (+/−) effect of an intervention on the individual (target) species. The data were recorded through three stages. In the first stage, the data from the literature review were used, i.e., in black words with colorful backgrounds. In the second stage, the data from the stakeholder opinion and authors’ assumption were used in red words. As a last step, the total numbers of positive and negative effects were calculated to indicate which network properties have more effects on their target species. Both of them provided relevant bio-monitoring reports and the description of the data is integrated into Table 2.
4.1.2. Summary of the Results of Studying the Biodiversity in Dynamic Landscapes
According to Table 2, increasing (habitat) spatial network properties usually showed positive effects. In these three cases, the following observations were made: (a) increasing the network area and structural heterogeneity had positive effects on the overall biodiversity, (b) increasing the network connectivity could have positive or negative effects; and (c) the variation in patch size and quality did not show any demonstrable effects and hence, requires further study at the habitat and landscape levels. On the other hand, increasing the temporal (habitat) network properties showed mixed effects from the empirical findings. Regarding temporal network properties, such as turnover rate and turnover proportion (refer to Table 1 for the definition), two cases had proper management strategies to change the turnover proportion and rate, causing positive effects on the species viability.
Temporal correlation in turnover includes the variance in the turnover rate or the variance in the turnover proportion [11]. In the Sand Motor case area, a concentrated mega-nourishment strategy mitigated coastal erosion and reduced the variance in the turnover rate, which showed an increase in the overall biodiversity. This new nourishment strategy in Sand Motor can reduce the variance in the turnover rate caused by adequate coastal protection/management, thereby providing more time for the ecosystem to recover than shore face nourishment [7]. With Sand Motor, the sand is added once every twenty years, whereas “common” nourishment takes place (on average) once every five years. Thus, increasing the spatial network properties usually demonstrated a positive effect, whereas increasing the temporal network properties usually had a negative effect, which can be addressed by appropriate management strategies.
4.1.3. Discussion of the Results of Studying the Biodiversity in Dynamic Landscapes
In this research, the results show that increasing spatial (habitat) network properties is beneficial to their target species in their habitats. On the other hand, increasing temporal (habitat) network properties could have mixed effects, according to the empirical studies of three large-scale NBS case areas.
According to the three selected large-scale NBS project case studies for spatial network properties, literature evidence show that increasing network areas had positive effects on the overall biodiversity. In addition, increasing the structural heterogeneity had positive effects on the individual species viability, e.g., in the Thur River in Switzerland and Sand Engine in the Netherlands. On the other hand, in the artificial lake of Greater Aarhus in Denmark, altering network connectivity harms the migratory fish because some sensitive species could not adapt to sudden or unexpected changes. Although increasing network connectivity could increase the diversity of species such as birds and vegetation, the character of network connectivity also allows pollution or diseases to spread much faster and easier along rivers. Therefore, depending on the different baseline situation of the case study areas, decision-makers should study the target habitats and their target species carefully before they increase network connectivity to support biodiversity.
In the three cases, variation in patch size could have had effects on the species viability, yet there was no evidence to show positive or negative effects. Concerning the variation in patch quality, only one piece of evidence showed a positive effect. The main (practical) reason could be the fact that the variation in patch quality is difficult to define and measure, because it depends on the different habitats and their species. In many case areas, the biodiversity has declined with the years, leading to loss of habitat or isolation, ecosystem functions, and other synergistic functions. Therefore, further long-term study is required to identify the appropriate indicators that can be measured and monitored to study the variation in patch quality.
For temporal network properties, mixed effects were accessed from empirical findings because the implementation of management strategies by large-scale NBS regulates or reduces the negative effects caused by natural and human activities. Habitat turnover means changes in habitat suitability over time [11]. The authors showed that increasing the temporal network properties usually had negative effects on the individual species viability. In the Greater Aarhus case, the results show that increasing the turnover intensity had negative effects on sensitive species such as migrating juvenile brown trout. On the contrary, for more resilient species, they might not have shown negative effects. Therefore, determining the target habitats and the target species is important during the design process of large-scale NBS. Different habitats and species have different environmental indicators to point out the turnover intensity, hence, the result could be different.
Changing the turnover population and turnover rate yields/reveals mixed effects on the species viability. Increasing the turnover rate and population usually evidences negative effects. In the Thur River case, the turnover rate decreased after river restoration, causing positive effects on the floodplain and its soil organisms. Thus, river restoration activities could be an effective approach to change the turnover rate of riparian zones and reduce the negative effects on the local species. Another important aspect that needs to be highlighted is the fact that temporal correlation in turnover rate and proportion can be influenced by natural and human activities such as vegetation succession or management strategies. At present, there is insufficient evidence to ascertain these effects because temporal correlation in turnover was not measured and monitored. In the Sand Motor case, the evidence shows mixed effects due to management strategies.
Management strategies in dynamic landscapes might be necessary for the habitats created by humans, especially large-scale NBS. A robust monitoring system can not only ensure the performance of the intervention, but also regulate or reduce the negative effects by natural and human activities. It is not possible to make a steadfast conclusion about the effect of changing temporal network properties in this work because there are only few large-scale NBS cases that have long-term biota and abiotic data to support this research. Due to the limitation of relevant cases and monitoring data, it is also not possible (at this stage) to provide a qualitative/quantitative guideline for the entire design process based on these three case studies. However, based on the experiences gained so far, it is possible to recommend suitable guidelines for the planning and design step of large-scale NBS. In the immediate future, many large-scale NBS cases are going to be monitored in the RECONECT project. The authors therefore recommend that bio-monitoring programs should be included at the early stages because biodiversity situations need a long-term monitoring program of at least 10 years. Those bio-monitoring data can be used for further research to produce qualitative guidelines for planning and designing large-scale NBS.
The input of the results presented in Table 2 is not only from the literature reviewed, but was also prepared based on discussions (including questionnaires) we had with the stakeholders/experts. Due to the large amount of information gathered from these three case studies, the discussion consists mostly of an analysis of the results obtained from the three case studies. In addition, this research serves as the first step in implementing the developed framework and provides guidelines to the decision-makers on how to systematically study the effects of increasing network properties on the target species that support biodiversity in the case study area.
4.2. Framework Development (Objective 2)
4.2.1. Summary of the Results Regarding the Effect of Implementing Large-Scale NBS Based on Four Habitat Types
For Step 1 of the framework, Tables S1–S4 provide adequate guidelines for selecting the effective measures with stakeholders (e.g., local people with different backgrounds), detailing the effect of implementing NBS based on four habitat types. NBS measures can be implemented in different types of habitats, as they bring positive effects to the habitat regardless of whether it is a wetland or not. These results clearly indicate that many wetland habitats, including inland wetlands, coastal wetlands, and human-made wetlands, gained ecological benefits after the implementation of large-scale NBS.
4.2.2. Discussion of the Results Regarding the Effect of Implementing Large-Scale NBS Based on Four Habitat Types
NBS is one of the most promising climate adaptation strategies [1], which tends to combine green-blue infrastructure (GBI) and grey infrastructure to achieve co-benefits [2]. Biodiversity is one of the main targets to be achieved [31]. Therefore, from an environmental viewpoint, the results show more positive effects than negative effects. Additionally, more measures can be applied in wetland habitats than non-wetlands. It is noteworthy to mention that in Tables S1–S4, a list of NBS measures is also integrated according to the suggestions provided elsewhere [9]. The list provides a focus on NBS measures for hydro-meteorological risk reduction, so 38 of the measures focus on water issues in wetlands, yet only 10 of the NBS measures deal with source control in mountainous regions and urban areas. Large-scale NBS projects are usually implemented in the river basins, coastal areas, and mountainous regions [9]. Therefore, the results show that many wetland habitats, including inland wetlands, coastal wetlands, and human-made wetlands, gained ecological benefits directly and indirectly after the implementation of large-scale NBS.
Moreover, NBS aim to not only address societal challenges but also to bring multiple benefits, which are based on the restoration or modification of ecosystem services, supporting human well-being and biodiversity [31]. Thus, most NBS measures should offer benefits to the biodiversity. The information regarding NBS measures that was found on official websites tends to (always) promote NBS, so it only showed the positive effects. However, negative effects could be incurred in original habitats before the implementation of NBS projects. For instance, original habitats (such as vegetated land) could be replaced by new habitats (such as wetlands) after depoldering. Some original trees died after the Room for River project because these trees could not adapt to the higher water level after depoldering. If decision-makers are aware of this condition, i.e., during the planning phase and before construction, they can relocate original trees in advance to reduce the negative effects. In practice, it is important to remember that there will always be some gaps in the evidence base, because some NBS assessment is also related to the costs, interventions, and social and ecological outcomes [32]. Therefore, to understand the negative or mixed effects due to NBS measures, further research should target more case studies and interview local and governmental stakeholders to collect relevant information and integrate their opinions into Tables S1–S4.
The results also show numerous non-applicable (neutral) measures in many habitats, because many measures can only be applied for specific habitats. As an example, for each habitat in Tables S1–S4, 7–24 of the NBS measures can be used in wetland habitats and 7–15 of the NBS measures can be used in non-wetland habitats. Therefore, certain NBS measures can be used in each habitat and it usually brings positive effects on the specific habitat, regardless of whether it is a wetland or not. The results show that many wetland habitats gained ecological benefits, directly and indirectly, after the implementation of large-scale NBS. Particularly, certain NBS measures can only be used in each habitat and they usually bring positive effects to the specific habitats.
4.3. Evaluation of the Framework (Objective 3)
4.3.1. Overview of the Responses
The two sets of answers were received from environmental regulators and environmental consultants, respectively. These answers were valuable because they provided not only the total score of the comments for this framework, but also their experiences and suggestions based on the NBS case area in Denmark. Overall, both environmental regulators and environmental consultants agreed that this framework can provide sufficient guidance to select effective measures for large-scale NBS based on their habitat types. On the other hand, regarding Step 1: Selection of effective measures and Step 2: Study the effects of key variables on the target species, their opinions were entirely different. Environmental regulators believed that Step 1 is clearer and more easily understandable/recognizable than Step 2, whereas the opinions from environmental consultants were the opposite.
4.3.2. Discussion for Evaluating the Framework
Regarding the evaluation of the framework proposed in this study (Figure 3), several questions, including general comments, for Step 1: Selection of effective measures and Step 2: Study the effects of key variables on the target species, were asked and discussed with the stakeholders in the Odense case study area.
Overall, from an environmental regulator’s and consultant’s point of view, the explanation of Step 1 is more applicable than Step 2 and this framework can provide sufficient guidance to select effective measures for large-scale NBS based on the habitat types. The main reason why Step 1 is more applicable is the fact that (i) according to the stakeholders’ point of view, they just need to choose NBS measures from the tables based on the positive or negative effects of NBS measures, and this approach is rather straight forward; and (ii) the environmental regulators mentioned that they used different habitat categories for their habitats in the Odense case and can involve experts and ecologists in Step 1, and then the experts can help decision-makers to identify their habitats.
Regarding the explanation of Step 2, neutral feedback was given by the environmental regulators, whereas the instructions concerning Step 1 (selection of effective measures) were understandable and clear for the environmental regulators. Step 2 is about studying the biodiversity in dynamic landscapes through stakeholder involvement. This step provides an approach of design studies (for biodiversity) rather than a conclusion or a result. Therefore, for environmental regulators, they were not able to ascertain the desired conclusion from Table 2. Thus, because of the complexity, this process also requires the user to perform a literature review for selected measures at the beginning, which will be very helpful to study the effect of the intervention in dynamic landscapes. After that, expert involvement can help to list the created habitats of large-scale NBS and identify the target species for each habitat. In order to be more decipherable for all the stakeholders, an introductory text should be provided on why it is important to choose key habitats and target species to support biodiversity in any large-scale NBS.
Another reason could be related to the background or experiences of the interviewees. Step 2 (studying the effects of key variables on the target species) was designed for environmental consultants, environmental scientists, or ecologists to study the biodiversity. Therefore, from an environmental regulator point of view, the interviewee neither agreed nor disagreed that this framework can guide stakeholders/experts on how to study biodiversity in dynamic landscapes for large-scale NBS because they suggested that environmental consultants, environmental scientists, or ecologists should be involved. Therefore, it is recommended to formulate the questions related to Step 2 with the help of specialists in the case study areas who have local knowledge to identify the prevailing target species. It is noteworthy to mention that Table 2 uses only three cases regarding wetlands as examples. At present, for large-scale NBS implementation, inland wetlands have more cases, but some habitats have fewer cases or almost no case studies available. Therefore, depending on the habitats and the species, if the case areas are not wetlands, it could be more difficult to derive supporting conclusions than for wetlands. The results from this study can help stakeholders and other practicing engineers and managers to decide which key variables should be monitored or changed in their case study area. Besides, the identification and analysis of the key variables will help to clarify the desired effect of the solutions and possibly influence the choice of indicators and monitoring scheme to be followed in future research.
Based on stakeholders/experts’ opinions, for the NBS case in the Odense coastal area in Denmark, the environmental consultants acknowledged that Step 2 has a clear explanation and Table 2 provides good examples of how to analyze the key variables. Nevertheless, for practical applications in other study areas, it would be good to develop a standalone tool in an open platform during the evaluation of this framework. With significant advances in next-generation internet technologies, open-source platforms will certainly be one of the efficient ways to share the framework, its guidelines, and the project results, and receive feedback and recommendations for improvement from different stakeholders. Unfortunately, the framework developed in this study is not yet prepared to be released as a standalone tool (software) in either QGIS or other FOSS GIS platforms. However, within the scope of the RECONECT project, a holistic ecosystem-based framework is currently being developed by one of the project partners. While developing this practical tool, the framework should be improved by involving more experts who have relevant (on-site) knowledge and experience in biodiversity to prepare questionnaires and regularly invite experts/stakeholders to online workshops, project meetings, and forum discussions and receive feedback and recommendations. Based on the feedback received, the framework should be improved, the guideline to implement the framework should be prepared, and the online tool (software) should be user-friendly so that inter-sectoral experts and specialists involved in the NBS can easily apply the framework.
5. Conclusions
There are many nature-based solution (NBS) frameworks that have been proposed to date; however, none of them can be used readily to restore or modify habitat diversity at the landscape/habitat scale, which is practical and applicable for large-scale NBS projects. In this research, a practically feasible framework was developed that incorporated landscape dynamics into the design of NBS to address species biodiversity and degradation. The framework can be used (with or without modifications) in planned, designed, and existing large-scale NBS because it was developed from information obtained from existing literature and the results of questionnaires. The same framework also has the potential to recommend suitable guidelines during the planning and design step of large-scale NBS. For future questionnaire-based desk studies, a short introduction and description of NBS measures should be added to the framework to help decision-makers to make the proper selection. In addition, it will be pertinent for the RECONECT project to involve experts/stakeholders (e.g., local “wise” people) who have relevant knowledge and experience in biodiversity to prepare questionnaires and regularly involve and/or invite experts/stakeholders to online workshops, project meetings, and forum discussions and receive feedback and recommendations for improvement.
Supplementary Materials
The following are available online at https://www.mdpi.com/article/10.3390/su13116123/s1.
Author Contributions
Conceptualization, Z.V., A.S., E.R.R. and B.W.; methodology, A.S., L.R., B.W. and Z.V.; validation, B.W., M.R., L.R. and A.S.; formal analysis, B.W., Z.V., A.S. and E.R.R.; investigation, B.W. and L.R.; resources, Z.V.; data curation, B.W.; writing—original draft preparation, B.W.; writing—review and editing, B.W., A.S., Z.V., L.R., M.R. and E.R.R.; supervision, Z.V.; project administration, Z.V.; funding acquisition, A.S. and Z.V. All authors have read and agreed to the published version of the manuscript.
Funding
This research was funded by the European Union’s Horizon 2020 Research and Innovation programme under grant agreement No. 776866 for the research project RECONECT (Regenerating ECOsystems with Nature-based solutions for hydro-meteorological risk rEduCTion).
Institutional Review Board Statement
Not Applicable.
Informed Consent Statement
Not Applicable.
Data Availability Statement
Not Applicable.
Acknowledgments
The study reflects only the authors’ views and the European Union is not liable for any use that may be made of the information contained herein. The authors would like to thank the three anonymous reviewers for providing good suggestions and technical comments for improving the overall scientific quality and readability of this manuscript.
Conflicts of Interest
The authors declare no conflict of interest.
References
- UNFCCC COP24—Climate Adaptation and Nature-Based Solutions at COP24: Part 3. Available online: https://urbangreenadaptationdiary.wordpress.com/2018/12/24/climate-adaptation-and-nature-based-solutions-at-cop24-part-3/ (accessed on 10 October 2019).
- Alves, A.; Gersonius, B.; Kapelan, Z.; Vojinovic, Z.; Sanchez, A. Assessing the Co-Benefits of green-blue-grey infrastructure for sustainable urban flood risk management. J. Environ. Manag. 2019, 239, 244–254. [Google Scholar] [CrossRef] [PubMed]
- World Bank. World Bank Implementing Nature-Based Flood Protection: Principles and Implementation Guidance; World Bank: Washington, DC, USA, 2017. [Google Scholar]
- David, A.P. Self-organizing systems across scales. Trends Ecol. Evol. 1995, 10, 241–244. [Google Scholar]
- Cohen-Shacham, E.; Andrade, A.; Dalton, J.; Dudley, N.; Jones, M.; Kumar, C.; Maginnis, S.; Maynard, S.; Nelson, C.R.; Renaud, F.G.; et al. Core principles for successfully implementing and upscaling Nature-based Solutions. Environ. Sci. Policy 2019, 98, 20–29. [Google Scholar] [CrossRef]
- Donato, D.C.; Halofsky, J.S.; Reilly, M.J. Corralling a black swan: Natural range of variation in a forest landscape driven by rare, extreme events. Ecol. Appl. 2020, 30, e02013. [Google Scholar] [CrossRef] [PubMed]
- Luijendijk, A.P.; Oudenhoven, A.P.E. The Sand Motor: A Nature-Based Response to Climate Change. Findings and Reflections of the Interdisciplinary Research Program Naturecoast, Climate Change: Findings and Reflections of the Interdisciplinary Research Program Nature Coast; Delft University Publishers—TU Delft Library: Delft, The Netherlands, 2019. [Google Scholar]
- Raymond, C.M.; Frantzeskaki, N.; Kabisch, N.; Berry, P.; Breil, M.; Nita, M.R.; Geneletti, D.; Calfapietra, C. A framework for assessing and implementing the co-benefits of nature-based solutions in urban areas. Environ. Sci. Policy 2017, 77, 15–24. [Google Scholar] [CrossRef]
- Ruangpan, L.; Vojinovic, Z.; Di Sabatino, S.; Leo, L.S.; Capobianco, V.; Oen, A.M.P.; McClain, M.E.; Lopez-Gunn, E. Nature-based solutions for hydro-meteorological risk reduction: A state-of-the-art review of the research area. Nat. Hazards Earth Syst. Sci. 2020, 20, 243–270. [Google Scholar] [CrossRef]
- Sirami, C. Biodiversity in Heterogeneous and Dynamic Landscapes. In Oxford Research Encyclopedia of Environmental Science; Oxford University Press (OUP): Oxford, UK, 2016. [Google Scholar]
- Van Teeffelen, A.J.A.; Vos, C.C.; Opdam, P. Species in a dynamic world: Consequences of habitat network dynamics on conser-vation planning. Biol. Conserv. 2012, 153, 239–253. [Google Scholar] [CrossRef]
- RECONECT—Network of Cases. Available online: http://www.reconect.eu/network-of-cases/ (accessed on 8 October 2019).
- Zebisch, M. Modellierung der Auswirkungen von Landnutzungs Anderungen auf Landschaftsmuster und Biodiversit. Ph.D. Thesis, TU Berlin, Berlin, Germany, 24 March 2004. [Google Scholar]
- Moilanen, A.; Hanski, I. Connectivity and Metapopulation Dynamics in Highly Fragmented Landscapes. In Connectivity Conservation: Maintaining Connections for Nature; Crooks, K., Sanjayan, M.A., Eds.; Cambridge University Press: Cambridge, UK, 2006; pp. 44–71. [Google Scholar]
- Ricketts, T.H. The matrix matters: Effective isolation in fragmented landscapes. Am. Nat. 2001, 158, 87–99. [Google Scholar] [CrossRef] [PubMed]
- Vos, C.C.; Baveco, H.; Grashof-Bokdam, C.J. Corridors and Species Dispersal. In Applying Landscape Ecology in Biological Conservation; Springer Science and Business Media LLC: New York, NY, USA, 2002; pp. 84–104. [Google Scholar]
- Battisti, C. Habitat fragmentation, fauna and ecological network planning: Toward a theoretical conceptual framework. Ital. J. Zool. 2003, 70, 241–247. [Google Scholar] [CrossRef]
- Gippoliti, S.; Battisti, C. More cool than tool: Equivoques, conceptual traps and weaknesses of ecological networks in environmental planning and conservation. Land Use Policy 2017, 68, 686–691. [Google Scholar] [CrossRef]
- Dramstad, W.; Fry, G.; Fjellstad, W.; Skar, B.; Helliksen, W.; Sollund, M.-L.; Tveit, M.; Geelmuyden, A.; Framstad, E. Integrating landscape-based values—Norwegian monitoring of agricultural landscapes. Landsc. Urban Plan. 2001, 57, 257–268. [Google Scholar] [CrossRef]
- Manson, F.J.; Loneragan, N.R.; Skilleter, G.A.; Phinn, S.R. An evaluation of the evidence for linkages between mangroves and fisheries: A synthesis of the literature and identification of research directions. Ocean Mar. Biol. 2005, 43, 485–515. [Google Scholar]
- Tews, J.; Brose, U.; Grimm, V.; Tielbörger, K.; Wichmann, M.C.; Schwager, M.; Jeltsch, F. Animal species diversity driven by habitat heterogeneity/diversity: The importance of keystone structures. J. Biogeog. 2004, 31, 79–92. [Google Scholar] [CrossRef]
- McCarthy, M.A.; Lindenmayer, D.B. Incorporating metapopulation dynamics of greater gliders into reserve design in disturbed landscapes. Ecology 1999, 80, 651–667. [Google Scholar] [CrossRef]
- McCarthy, M.A.; Lindenmayer, D.B. Spatially-correlated extinction in a metapopulation model of Leadbeater’s Possum. Biodivers. Conserv. 2000, 9, 47–63. [Google Scholar] [CrossRef]
- Magurran, A.E. Measuring Biological Diversity; Blackwell Publications: Oxford, UK, 2004. [Google Scholar]
- Menges, E.S.; Quintana-Ascencio, P.F. Population viability with fire in eryngium cuneifolium: Deciphering a decade of demographic data. Ecol. Monogr. 2004, 74, 79–99. [Google Scholar] [CrossRef]
- Stelter, C.; Reich, M.; Grimm, V.; Wissel, C. Modelling Persistence in Dynamic Landscapes: Lessons from a Metapopulation of the Grasshopper Bryodema tuberculata. J. Anim. Ecol. 1997, 66, 508. [Google Scholar] [CrossRef]
- Loucks, D.P.; Van Beek, E. Water Resource Systems Planning and Management: An Introduction to Methods, Models, and Applications; Springer: Cham, Germany, 2017. [Google Scholar]
- Ramsar Convention. Ramsar Convention on Wetlands. Global Wetland Outlook: State of the World’s Wetlands and Their Services to People; Ramsar Convention Secretariat: Gland, Switzerland, 2018. [Google Scholar]
- Ruangpan, L.; Vojinovic, Z.; Plavšić, J.; Doong, D.-J.; Bahlmann, T.; Alves, A.; Tseng, L.-H.; Randelović, A.; Todorović, A.; Kocic, Z.; et al. Incorporating stakeholders’ preferences into a multi-criteria framework for planning large-scale Nature-Based Solutions. Ambio 2020, 1–18. [Google Scholar] [CrossRef]
- Russi, D.; ten Brink, P.; Farmer, A.; Badura, T.; Coates, D.; Förster, J.; Kumar, R.; Davidson, N. The Economics of Ecosystems and Biodiversity for Water and Wetlands (TEEB); IEEP: London, UK, 2013. [Google Scholar]
- IUCN. IUCN Global Standard for Nature-Based Solutions. 2020. Available online: https://www.iucn.org/theme/ecosystem-management/our-work/iucn-global-standard-nature-based-solutions (accessed on 10 July 2020).
- Chausson, A.; Turner, B.; Seddon, D.; Chabaneix, N.; Girardin, C.A.J.; Kapos, V.; Key, I.; Roe, D.; Smith, A.; Woroniecki, S.; et al. Mapping the effectiveness of nature-based solutions for climate change adaptation. Glob. Chang. Biol. 2020, 26, 6134–6155. [Google Scholar] [CrossRef] [PubMed]
Publisher’s Note: MDPI stays neutral with regard to jurisdictional claims in published maps and institutional affiliations. |
© 2021 by the authors. Licensee MDPI, Basel, Switzerland. This article is an open access article distributed under the terms and conditions of the Creative Commons Attribution (CC BY) license (https://creativecommons.org/licenses/by/4.0/).