Article

Assessment of Drinking Water Purification Plant Efficiency in Al-Hassa, Eastern Region of Saudi Arabia

by
El-Sayed A. Badr
1,2,* and
Ahmed A. Al-Naeem
1
1
Department of Environment and Natural Resources, College of Agricultural and Food Sciences, King Faisal University, Al-Hofuf, P.O. Box 420, 31982 Al-Hassa, Saudi Arabia
2
Environmental Sciences Department, Faculty of Science, Damietta University, New Damietta City 34517, Egypt
*
Author to whom correspondence should be addressed.
Sustainability 2021, 13(11), 6122; https://doi.org/10.3390/su13116122
Submission received: 2 April 2021 / Revised: 23 May 2021 / Accepted: 26 May 2021 / Published: 28 May 2021

Abstract

:
The quality of drinking water is an extremely important factor in public health. The main sources of drinking water in the Kingdom of Saudi Arabia (KSA) are bottled water, purified groundwater, and desalinated seawater. This study aimed to assess drinking water quality and evaluate the performance of water purification plants in Al-Hassa and with the aid of the water quality index (WQI). A total of 150 water samples were collected from 30 water purification plants. The physiochemical characteristics of drinking water, including the pH, TDS, EC, turbidity, free chlorine, total hardness, anions (Cl, HCO3, SO4, NO3, and F), cations (Na, K, Ca, and Mg), iron, and manganese, were investigated. The results revealed that the purified water was of acceptable quality for drinking with respect to the measured physiochemical characteristics. The overall water purification efficiency for the reduction in total dissolved salts and related anions and cations was over 90%. For instance, the average TDS values in groundwater were 1916 ± 806 mg/L, which decreased to 118 ± 32.9 mg/L in purified water. The WQI results showed that all the collected purified water samples were considered to be of excellent quality (class I) for drinking. Meanwhile, 81.7% of the untreated groundwater samples were considered to be poor quality (class III), and 11.7% were considered to be very poor quality (class IV) due to their high contents of dissolved salts. The purification of the groundwater improved its quality from very poor/poor quality (classes III and IV) to excellent water quality (class I). A Piper diagram revealed that 80% of the investigated groundwater samples were of the sodium chloride–sulfate water type. Overall, we found that the groundwater in the investigated area is not suitable for drinking purposes unless further purification techniques are applied.

1. Introduction

The availability of water in sufficient quantity and quality is essential for the survival of all known forms of life [1,2]. The increase in the world’s population growth and correlated urban, industrial, and agricultural development has resulted in the increased consumption of limited water resources [3]. Today, the competition for scarce water resources is intense in many places across the world [1,4]. Saudi Arabia, as an arid country, suffers from the problems of water scarcity and limited renewable water resources [5,6,7]. According to the UNESCO Water Scarcity Index, Saudi Arabia is subject to extreme water shortage conditions [4]. The main sources of water supply for domestic purposes in Saudi Arabia are groundwater and/or seawater desalination [5,8,9]. Although seawater desalination can help to overcome the water scarcity problems in Saudi Arabia, it consumes a lot of energy [4].
Drinking water should be of sufficient quantity and meet certain water quality criteria to assure its safe consumption by the population [10,11]. Groundwater purification for domestic purposes takes place using a variety of techniques, such as ion exchange, reverse osmosis, electron dialysis, activated carbon adsorption, and the addition of disinfectant with the use of chlorine, ozone, or UV light [1,12]. Reverse osmosis in combination with activated carbon treatment provides one of the most definitive means of water purification. Groundwater purification is essential to ensure that treated water meets the established drinking water guidelines/standards, such as those of the Saudi Arabian Standards Organization (SASO 2009) [13] and the World Health Organization (WHO 2011) [14]. The regular monitoring of the quality of purified water is necessary to evaluate the efficiency of reverse osmosis and other purification techniques [15].
Groundwater in Saudi Arabia is subject to overexploitation and enhanced anthropogenic inputs of pollutants, due to various human activities, such as urbanization, industrialization, and agricultural expansion [5,16]. For example, recent agricultural developments have resulted in the extensive use of pesticides and chemical fertilizers and the reuse of treated sewage [9,17]. Groundwater contamination might lead to marked changes in drinking water quality, including physiochemical and biological characteristics [5,18,19]. High levels of nitrates, fluorides, and total dissolved solids (TDS), including cations and anions, are the main environmental problems affecting groundwater quality [7,11]. High levels of salinity in groundwater in the Al-Hassa area might have resulted from excessive pumping and resulting groundwater depletion, soil weathering, agricultural drainage, and sea water intrusion, along with dry climate conditions [6,8,20,21,22]. The evaluation of groundwater quality for domestic purposes has been investigated in several studies [3,5,7,10,23].
Several studies have been conducted to evaluate drinking water sources in Saudi Arabia to promote public health. Massoud et al. 2011 [18] established a decision support system (using GIS) to manage water quality in Al-Hassa. Badr and Al-Naeem 2016 [13] assessed spatial and temporal variations in the potable water quality of the water distribution network in the Al-Hassa area. Al-Omran et al. 2015 [5] evaluated the drinking water quality of the main water network and household tanks in Riyadh. Aly et al. 2015 [3] used water quality index to assess the groundwater quality for drinking and irrigation purposes in Hafar Albatin. Other similar studies on the assessment of drinking water supplies have been conducted in Riyadh [9] and Al-Gassim [8].
The water quality index (WQI) is a simple mathematical model used to facilitate water quality assessment [3,24]. The WQI is an effective management tool that can be used by policy makers and stakeholders to easily judge water quality for various purposes [7,25]. WQI can be used to present a simple and concise method for assessing both groundwater and surface water quality for drinking and irrigation purposes [26,27,28]. WQI calculations consider the majority of physiochemical characteristics of water parameters. In a WQI calculation, a single water quality value is obtained by integrating different water quality variables [27,29].
The proper monitoring and assessment of groundwater used for drinking is necessary for the sustainable management of limited water resources. The main objectives of this study were the monitoring of untreated groundwater, the evaluation of water purification plants efficiency, and the assessment of treated drinking water quality with the aid of a water quality index in Al-Hassa in the eastern region of Saudi Arabia. The study area is characterized by arid climate conditions, along with a high level of dissolved salts in groundwater aquifers. Thus, we conducted a water quality assessment based on the investigation of related physiochemical characteristics, including pH, TDS, EC, turbidity, free chlorine, total hardness, anions (Cl, HCO3, SO4, NO3, F), cations (Na, K, Ca, Mg), and trace metals (Fe, Mn). This study is very important in terms of assessing drinking water quality, which is closely related to public health. Moreover, there are no detailed studies of using water quality index and purification plant efficiency to assess drinking water quality in the eastern region.

2. Materials and Methods

2.1. Study Area

Al-Hassa is the largest oasis in the Arabian Peninsula and is located in the Eastern Province of KSA [22]. It is characterized by a dry climate, with an average annual rainfall of 80 mm, an evaporation averaging 2600 mm/year, and a summer temperature that can reach 46 °C [4,30]. Al-Hassa is agricultural oasis covering an area of 80 km2 and consists of 5 cities, 22 main villages, and another 55 small villages (named Hejrah) [6,15]. The eastern province of Saudi Arabia has three types of aquifer: a Neogene shallow aquifer, a Dammam medium depth aquifer, and a UER (Umm Er Radhuma) deep aquifer [6,22,31]. All of them are subject to over-pumping with a resulting increased salt content with time. Geology of the study area is characterized by sandstone, limestone, halite, gypsum, and anhydrite [6,22].
The main sources of drinking water in the Al-Hasa area are the municipality water supply (distribution networks), private groundwater purification plants, and bottled water. Since municipality water has a high level of dissolved salts and bottled water is expensive, purified water from private purification plants is widely consumed by the local community [15]. The water sources used in private water purification plants include groundwater wells, municipality water, and mixtures of both groundwater and municipality water.
There are approximately 45 private water purification plants in the Al-Hassa region; all of them use sand filtration, active carbon filtration, and reverse osmosis techniques for water purification, with the addition of chlorine (sodium hypochlorite) as a disinfectant. These plants require continuous monitoring to assess water quality and improve the reverse osmosis and other purification techniques used. The current study assessed the quality of the drinking water produced from private water purification plants (Figure 1), with a focus on the physiochemical characteristics of water. The measured water quality variables include the pH, TDS, EC (electrical conductivity), turbidity, free chlorine, total hardness, cations (calcium, magnesium, sodium, and potassium), anions (chloride, bicarbonate, and sulfate), nitrate, fluoride, iron, and manganese.

2.2. Sample Collection

This study was conducted twice in the winter (December 2015) and the summer (May 2016) seasons to investigate whether there are seasonal variations in the quality of potable water supply. A total of 30 major private water purification plants, which are geographically distributed in the Al-Hassa region, were chosen to investigate their water quality. Those selected plants were classified as 11 water purification plants in Al-Hofuf (1–11), 7 plants in Al-Mubarraz (12–18), 5 plants (19–23) in northern villages, and 7 plants (24–30) in eastern villages (Figure 1). In each survey, a total of 60 water samples were collected from both untreated groundwater (before purification) and treated groundwater (after purification) from the selected water purification plants. An additional three water purification plants (numbered 3, 13, and 15, as shown in Figure 1) with various capacities were chosen for the regular monitoring of water quality and to evaluate the purification efficiency. They were used for a period of four months. Hence, an additional 30 water samples were collected from these 3 purification plants before and after purification on regular basis in the period January–April 2016 to assess the performance of the water purification plants over time. Thus, the total number of water samples in this study was 150, covering the majority of water purification plants in the Al-Hassa region.
In each water purification plant, water samples were collected from sources of groundwater and purified water outlets into pre-cleaned 1-L HDPE (high-density polyethylene) bottles and stored at 4 °C and in the dark until analysis. In situ water quality parameters include temperature, pH, TDS, EC and free chlorine; these were immediately measured in sample collection. All the glassware used was first acid-washed in 10% HCl for 24 h then rinsed 3–5 times with distilled water and a water sample before use.

2.3. Water Analysis

Master water quality variables, including the pH, TDS, EC, and free chlorine, were measured in situ. pH and temperature were measured in situ using a pH meter (model HI 9124, Hanna Instruments Ltd., Germany). The measurement of TDS and EC was performed using a Portable Conductivity/TDS meter (model 470-Digital, Jenway- UK) in units of mg/L and micro-siemens per centimeter, respectively. Free chlorine was measured based on the DPD colorimetric method using a portable colorimeter (C301, OAKTON, Eutech, Singapore). Turbidity was measured using a turbidity meter (model HI 88703, Hanna Instruments Ltd., Germany) and expressed in NTU (Nephelometric Turbidity Units) [32].
The analysis of water samples was conducted in the laboratory using a well-established method in accordance with the American Standards for Water and Wastewater Examination Manual [32]. Nitrate, fluoride, and sulfate were measured in the collected water samples using a UV-Vis Spectrophotometer (UV-1650, Shimadzu), based on the UV-direct method, SPADNS method, and turbid-metric method, respectively [32,33,34]. Ions such as Cl, HCO3, Ca, and Mg (total hardness) were measured using well-established titrimetric methods [33]. Na and K were measured using the flame emission photometric method (Flame Photometer, Jenway, UK). Fe and Mn were measured using an atomic absorption spectrophotometer (AA6650F, Shimadzu, Japan) [32].
Analytical data quality was guaranteed through the implementation of laboratory quality assurance and quality control methods. These include the use of standard operating procedures, calibrations with standards, blank determination, and triplicate analysis of water samples. The coefficient of variation (CV) or precision of sample analysis was typically < 3–5%. Moreover, the correctness of water chemical analysis was verified by calculating the ion balance error (up to ± 3%) [5]. Statistical analysis was carried out using the SPSS software package (version 25.0). The basic statistics of the resulted data were analyzed, such as the average, minimum, maximum, median, standard deviation, and variance. The resultant data were also analyzed using one-way analysis of variance (ANOVA) to assess the significance variance between water samples collected from areas of Al-Hofuf, Al-Mubarraz, in the eastern villages and northern villages. The ANOVA critical values of F (degree of freedom) were taken from the F-ratio table at the p < 0.01 level of significance (the 99% confidence level), n = 60. Moreover, investigations of the correlation matrix (Pearson’s product moment) between pairs of water quality parameters were calculated to identify any statistically significant correlations (p < 0.01, n = 150) and thus aid in the interpretation of the data.

2.4. Water Quality Index Computing

The WQI calculations consider the majority of the physiochemical characteristics of water parameters, such as pH, TDS, EC, turbidity, free chlorine, total hardness, anions (Cl, HCO3, SO4, NO3, F), and cations (Na, K, Ca, Mg), based on consulting a wide range of literature reviews [7,24,27,28,35]. The WQI was calculated for each collected water sample using the following empirical equations in order to evaluate the water quality [25,26,36]. First, each of the measured water parameters was assigned a weight (wi) of 1 to 5 according to its relative importance in the overall drinking water quality and based on the water quality standards presented in Table 1. A maximum weight of 5 was assigned to parameters of relevant importance for drinking water such as TDS, while a weight of 2 was assigned to parameters with minor relevance such as bicarbonate [37,38]. Secondly, the relative weight (Wi) for each water quality parameter was then calculated using the following equation:
Wi = wi i = 1 n wi
where Wi is the relative weight, wi is the weight of each parameter, and n is the number of parameters. The calculated relative weight (Wi) values of each parameter are presented in Table 1.
Thirdly, the quality rating scale (qi) for each parameter was computed by dividing the concentration of each water variable (Ci) by its respective water quality standard for drinking [13,14].
qi = Ci Si 100
where qi is the quality rating scale, Ci is the concentration of each water variable, and Si is the WHO 2011 [16] standard for each water parameter. Lastly, the value of WQI was calculated by the sum of multiplying the quality rating scale (qi) of each parameter by its relative weight (Wi).
WQI = i = 1 n Wi qi
The calculated WQI values were classified into five groups, as shown in Table 2. The WQI values ranged from < 50 (excellent water quality) to value >300 (highly polluted water), which is unsuitable for the intended use.

3. Results and Discussion

3.1. Groundwater Quality

Descriptive statistics for the groundwater quality parameters are presented in Table 3, and Supplementary Materials. The water temperature varied between 19.5 and 33.5 °C, with an average value of 24.3 ± 4.39 °C. It was noticed that average temperature values of the water samples collected in May 2016 (27.7 ± 3.35 °C) were relatively high compared to temperature values of those collected in December 2015 (21.0 ± 2.17 °C). The pH values of the collected water samples ranged between 6.77 and 7.69, with an average value of 7.15 ± 0.17. pH is an important indicator of water quality and the extent of pollution. The results of pH values recorded in this study fall within the range of the international and Saudi standards (6.5–8.5). The turbidity values of the groundwater samples ranged between 0.10 and 0.75 NTU, with an average value of 0.29 ± 0.14 NTU (Table 3). The concentrations of free chlorine (Cl2) ranged between 0.03 and 0.16 mg/L, with an average value of 0.08 ± 0.03 mg/L.
The values of TDS ranged between 850 and 5513 mg/L, with an average of 1916 ± 806 mg/L; meanwhile, the average concentrations of EC were 3191 ± 1341 µS/cm and ranged between 1416 and 9173 µS/cm. Higher TDS (and EC) values were observed in groundwater samples collected in May 2016 (range: 1162–5513 mg/L) relative to the water samples collected in December 2015 (range: 850–4024 mg/L). The temporal changes in water salinity might be due to the excessive pumping of groundwater for agriculture and domestic uses [22]. Exactly 1.7%, 68.3%, and 30% of the collected groundwater samples had TDS values of less than 1000 mg/L, in the range of 1000–2000 mg/L, and higher than 2000 mg/L, respectively. These results indicated that the groundwater in the study area could not be used for drinking without further purification processes due to the high salt content, as all the TDS values exceeded the permissible limit of 500 mg/L according to the drinking water standards [13,14]. It has been observed that the elevated groundwater salinity in different areas of the country, such as the Al-Hassa Oasis, Hafar Albatin, the Al-Qassim region, and Al-Madinah City, resulted from the excessive pumping of groundwater, agricultural drainage, and soil weathering [3,7,8,20].
High salinity levels (TDS > 1200 mg/L) in groundwater may lead to excessive scale formation in boilers and household equipment, affecting public health [11]. It has been reported in a similar study that most groundwater wells in the central and eastern part of the KSA are relatively highly saline, which might be due to over pumping and arid conditions [11,39].

3.1.1. Groundwater Anions

The results for the numbers of anions (Cl, HCO3, SO4, NO3, and F) measured in the collected groundwater samples are presented in Table 3. The chloride (Cl) concentrations were in the range of 253–2357 mg/L, with an average of 675 ± 370 mg/L. Lower chloride values were measured in the groundwater samples collected in December 2015 (average of 644 ± 317 mg/L), relative to those of water samples collected in May 2016 (average of 707 ± 419 mg/L) (Table 3). The concentration range of bicarbonates measured in the collected groundwater samples was 130–228 mg/L, with an average concentration of 191 ± 20 mg/L. Almost all of the collected groundwater samples had chloride and bicarbonate concentrations greater than the permissible limits of 250 mg/L and 125 mg/L, respectively [13,14].
The average concentrations of sulfates in the collected groundwater were 276 ± 70.4 mg/L, with a range of 167–596 mg/L. Relatively higher ranges of sulfates were reported for water samples collected in May 2016 (186–596 mg/L) compared to water samples collected in December 2015 (167–425 mg/L). Sulfate is a major ionic constituent, with 58.3% of the collected water samples having concentrations greater than the recommended guidelines of 250 mg/L for drinking water [13,14]. In a similar study, the average concentration of sulfates in the groundwater collected from Khamis Mushait (KSA) was 524 ± 125 mg/L, with 60% of water samples above concentrations of 200 mg/L [21]. Anthropogenic activities and the dissolution of sulfate-bearing rocks, such as gypsum (CaSO4.2H2O), are the main sources of sulfates in groundwater [1,21].
The nitrate and fluoride concentrations in the collected groundwater samples mainly averaged around 6.30 ± 2.27 mg-N/L and 0.99 ± 0.28 mg/L, with ranges of 0.635–14.6 mg-N/l and 0.54–1.94 mg/L, respectively. An examination of the seasonal variations revealed no significant changes between the nitrate and fluoride values of water samples collected in December 2015 and those water samples collected in May 2016. Moreover, 13.3%, 83.3%, and 3.3% of the collected groundwater samples had nitrate values of less than 5 mg/L, in the range of 5–10 mg/L, and higher than 10 mg/L, respectively. On the other hand, the result indicated that 61.7%, 31.6%, and 6.7% of the collected groundwater samples had fluoride values of less than 1 mg/L, in the range of 1–1.5 mg/L, and higher than 1.5 mg/L, respectively. The reported relatively high nitrate concentrations in the current study might have resulted from extensive anthropogenic activities within the study area, including rapid population growth and related activities, such as urbanization, agricultural activities, and industrial developments [11,17].

3.1.2. Groundwater Cations

The results for the numbers of cations (Na, K, Ca, and Mg) measured in the collected groundwater samples are presented in Table 3. The concentration ranges of sodium and potassium were 117–988 mg/L and 16.1–217 mg/L, with average values of 323 ± 132 mg/L and 49.9 ± 30.7 mg/L, respectively. Higher Na and K values were observed in water samples collected in May 2016 relative to water samples collected in December 2015. A total of 95% of the sodium values and almost all the measured values for potassium were above the permissible limits for drinking water of 200 mg/L and 12 mg/L, respectively [13,14].
The concentrations of calcium in the collected groundwater samples averaged around 158 ± 68.9 mg/L and ranged from 82.5 to 459 mg/L, whereas the measured values for magnesium ranged from 19.3 to 141 mg/L, with an average of 52.7 ± 24.9 mg/L. Moreover, higher calcium and magnesium values were observed in groundwater samples collected in December 2015 (averages of 172 ± 74.9 mg/L and 59.9 ± 19 mg/L), relative to groundwater samples collected in May 2016 (averages of 143 ± 60 mg/L and 45.5 ± 28.2 mg/L, respectively). Exactly 93.3% and 46.7% of the collected groundwater samples had calcium and magnesium concentrations above the permissible limits of 100 mg/L and 50 mg/L in drinking water, respectively [13,14].
The total hardness values were measured in the collected groundwater samples for CaCO3 and averaged around 611 ± 254 mg/L, with a range of 344–1503 mg/L. Higher average total hardness values of 677 ± 232 mg/L were observed in groundwater samples collected in December 2015 relative to those in groundwater samples collected in May 2016 (545 ± 261 mg/L). These findings revealed that the groundwater samples collected from Al-Hassa Oasis were very hard, as 58.3% of the measured samples had values greater than the recommended guidelines of 500 mg/L [13,14]. Water hardness values of more than 500 mg/L can consume more soap detergent and produce scale in heating vessels [1,8].
The average concentrations of iron and manganese measured in the collected groundwater samples were 114 ± 92.2 mg/L and 35.9 ± 18.9 mg/L, respectively, with ranges of 26.2–311 mg/L for Fe and 6.49–89.9 mg/L for Mn. Higher average values of iron (146 ± 103 mg/L) were observed for groundwater samples collected in May 2016 relative to those collected in December 2015 (82.3 ± 68 mg/L). A few of the water samples tested (6.7%) had iron concentrations greater than the maximum permissible limits of 300 mg/L, whereas all the measured magnesium values were lower than the maximum permissible limit of 100 mg/L, respectively [13,14]. In similar study, 26.7% of the groundwater samples collected from Khamis Mushait (KSA) exceeded the maximum permissible limits for iron [21]. The main sources of Fe and Mn in groundwater include dissolution from parent rocks in contact with aquifers and the corrosion of metallic pipes, and these elements can cause stains and a metallic taste [21,40,41].

3.1.3. Overall Groundwater Quality

Generally, the average concentrations of TDS, EC, anions (Cl, HCO3, and SO4), and cations (Na and K) in groundwater samples collected in May 2016 were high in comparison with those collected in December 2015. The higher values of TDS and major ions in groundwater in summer might be related to the arid climate of the area, along with its higher evaporation rates, agricultural drainage, and increasing use of groundwater pumping in the summer and resultant seawater intrusion [7,11,20]. On the other hand, the average concentrations of calcium and magnesium and total hardness in groundwater samples collected in December 2015 were higher than those of water samples collected in May 2016, probably due to dissolution from limestone parent rocks in the low-rainfall season. Higher concentrations of TDS, anions, and cations were observed in groundwater samples collected from northern and eastern villages compared to those collected from the central towns of Al-Hofuf and Al-Mubarraz, as supported by the ANOVA F significance values (Table 3).
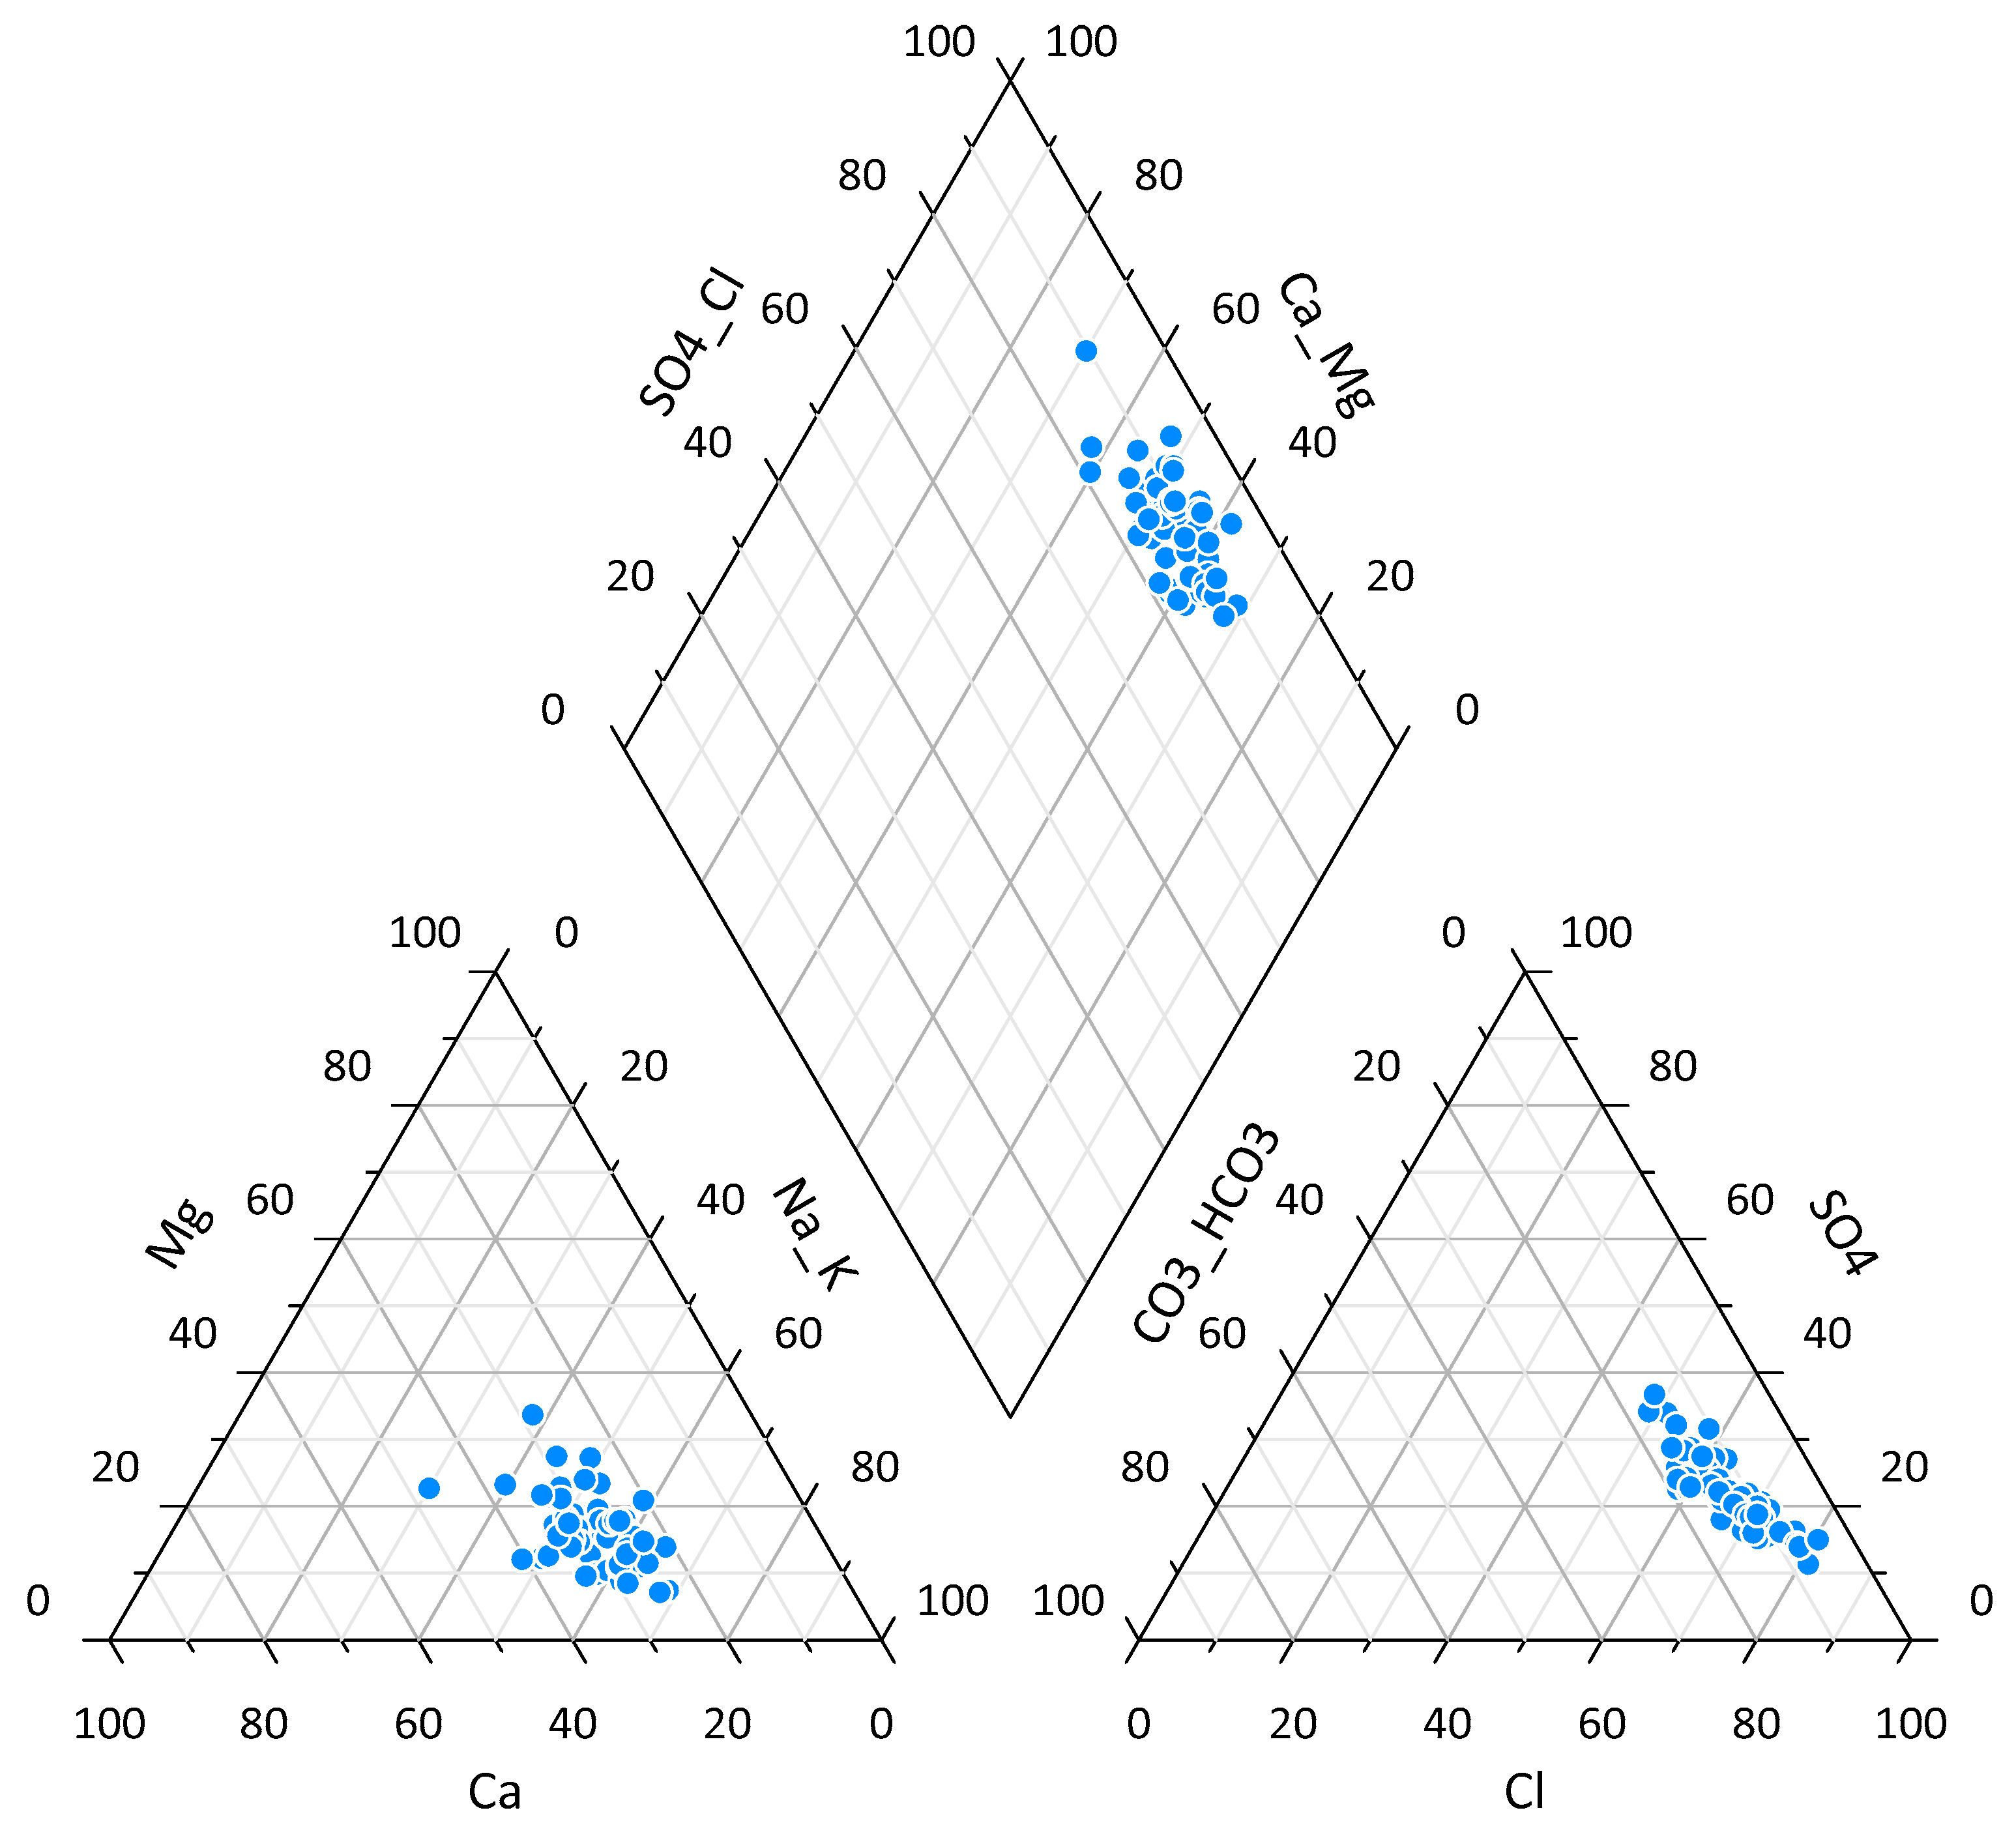
The majority of the collected groundwater samples had values of TDS, anions (Cl, HCO3, SO4, NO3), and cations (Na, K, Ca, Mg) and total hardness concentrations greater than the permissible limit for drinking water [13,14]. These findings indicate that the groundwater in the study area should be subject to further purification processes before it can be safely used for drinking/domestic purposes, as reported also by similar studies [15,41,42]. Groundwater contamination due to enhanced anthropogenic inputs of pollutants might result in marked changes in water quality [5,16]. The Piper trilinear diagram was used to show the chemical characteristics of the groundwater samples (Figure 2) based on their ionic composition [43]. It is indicated that 80% of the water samples are sodium chloride-sulfate water types, while the remaining 20% of water samples are calcium sulfate-chloride water types. These water types demonstrated that the geology of the study area is characterized by halite, gypsum, and anhydrite [3,22]. Thus, the current study revealed that the following chemical abundance order of the measured ions is Cl > SO4 > HCO3 > NO3 > F for anions and Na > Ca > Mg > K for cations. This ionic order might indicate the lithogenic origin of these ions in groundwater [19].

3.2. Purified Drinking Water Quality

Descriptive statistics for the purified drinking water quality characteristics are outlined in Table 4, and Supplementary Materials. The temperature values of the collected purified water ranged from 19.4 to 33.4 °C, with an average value of 24.1 ± 4.3 °C. It has been noticed that the average temperature values of the purified water samples collected in May 2016 (27.5 ± 3.3 °C) were relatively high compared to the average temperature values of those collected in December 2015 (20.8 ± 1.7 °C). The values of pH in the collected purified water samples ranged between 6.74 and 8.08, with an average value of 7.54 ± 0.27. The TDS values ranged between 50.6 and 265 mg/L, with average value of 118 ± 32.9 mg/L. EC concentrations ranged between 82.8 and 442 µS/cm, with an average value of 197 ± 54.8 µS/cm of the 60 collected purified water samples, 26.7%, 58.3%, 13.3%, and 1.7% had TDS values in the ranges of 50–100 mg/L, 100–150 mg/L, 150–200, and >200 mg/L, respectively. The values of turbidity and free chlorine (Cl2) in the purified water samples ranged from 0.10 to 0.78 NTU and 0.04 to 0.84 mg/L, with average values of 0.24 ± 0.13 NTU and 0.11 ± 0.11 mg/L, respectively. All the measured pH, TDS, turbidity, and free chlorine values in this study were within the permissible limit set by the WHO and the Saudi drinking water quality standards, as described in Table 1 [13,14].

3.2.1. Drinking Water Anions

The results for the number of anions (Cl, HCO3, SO4, NO3, and F) measured in the collected purified water samples are presented in Table 4. The average concentrations of chloride (Cl) were 42.6 ± 14.8 mg/L, with a range of 17.4–130 mg/L. Lower chloride values were observed in water samples collected in May 2016 (average of 40.9 ± 9.30 mg/L) relative to water samples collected in December 2015 (average of 44.3 ± 18.8 mg/L). Bicarbonate concentrations were in the range of 6.83–33.4 mg/L, with an average of 17.9 ± 6.61 mg/L. The average concentration of sulfates was 11.8 ± 6.70 mg/L, with a range of 2.33–29.6 mg/L. It is reported that the sulfate concentration ranges from 48 to 360 mg/L, with a mean value of 160 mg/L, in drinking water of the Al-Gassim region [8]. All the measured purified water samples had chloride, bicarbonate, and sulfate concentrations lower than the permissible limits of 250 mg/L, 125 mg/L, and 250 mg/L, respectively, for drinking water [13,14].
The average concentration of nitrate in the collected purified water samples was 0.88 ± 0.43 mg-N/l, with a range of 0.17–1.96 mg-N/l, as indicated in Table 4, whereas the concentrations of fluoride ranged between 0.04 and 0.58 mg/L, with an average value of 0.18 ± 0.12 mg/L. An examination of the seasonal variations revealed no significant changes between the values of nitrate in the water samples collected in December 2015 and those in the water samples collected in May 2016. Generally, the nitrate and fluoride concentrations in the collected purified water samples were below the recommended limits of 10 mg N/L and 1.5 mg/L, respectively. The process of fluoridation needs to be considered for use in water purification plants, as the optimum recommended level of fluoride in drinking water is 0.8–1.5 mg/L [13,14].

3.2.2. Drinking Water Cations

The average concentrations of sodium and potassium in the collected purified water samples were 28.3 ± 9.99 mg/L and 3.72 ± 1.08 mg/L, with ranges of 8.33–83.6 mg/L and 1.60–9.82 mg/L, respectively. Higher sodium and potassium values were observed in water samples collected in December 2015 (ranges: 12.4–83.6 mg/L and 2.87–9.82 mg/L) relative to those from water samples collected in May 2016 (ranges: 8.33–43.9 mg/L and 1.60–5.37 mg/L). The concentration ranges of calcium and magnesium in the collected purified water samples were 1.78–15.2 mg/L and 1.02–9.02 mg/L, respectively, with average values of 4.35 ± 2.31 mg/L (Ca) and 3.46 ± 1.41 mg/L (Mg). Moreover, an average higher calcium value of 5.41 ± 2.54 mg/L was observed in purified water samples collected in December 2015, relative to those of water samples collected in May 2016, with an average of 3.29 ± 1.44 mg/L. Almost all the collected purified water samples had Na, K, Ca, and Mg values within the permissible limits set for drinking water, as shown in Table 1 [13,14].
The total hardness concentrations in the collected purified water samples averaged 25.1 ± 8.87 mg/L, with a range of 13.6–54.8 mg/L. Relatively higher total hardness values were observed in the purified water samples collected in December 2015 (average of 28.6 ± 10.9 mg/L) compared to those for water samples collected in May 2016 (average of 21.6 ± 3.92 mg/L). All the purified water samples had total hardness values less than the permissible limit of 500 mg/L in drinking water and would be considered as soft water [13,14]. The iron concentrations in the collected purified water samples were in the range of 20.5–187 mg/L and averaged a value of 75.7 ± 43.4 mg/L, whereas the concentration values of manganese averaged a value of 27.7 ± 16.1 mg/L, with a range of 5.13–79.3 mg/L. All the collected purified water samples had iron and manganese values lower than the maximum permissible limits of 300 mg/L and 100 mg/L, respectively [13,14]. Higher average values of iron (85.3 ± 45.9 mg/L) were observed for purified water samples collected in May 2016 relative to those collected in December 2015 (66.2 ± 39 mg/L).

3.2.3. Overall Drinking Water Quality

Generally, all the measured purified water samples had pH, TDS, turbidity, anions (Cl, HCO3, SO4, NO3, and F), cations (Na, K, Ca, and Mg), total hardness, and Fe and Mn concentrations within the permissible limits set for drinking water [13,14]. A similar study indicated that 95% of the purified drinking water in Al-Hassa meets the WHO criteria for drinking purposes [15]. The average concentrations of TDS, EC, Cl, SO4, F, and cations (Na, K, Ca) in the purified water samples collected in December 2015 were relatively high in comparison with those collected in May 2016. As shown in Table 4, ANOVA analysis (F ratios) indicated a significant variance (p < 0.01) of bicarbonate (F = 4.32, p = 0.008), sulphate (F = 5.05, p = 0.004), and magnesium (F = 4.58, p = 0.006) measured in the water samples collected from the study area. The current study indicated the following ionic dominance order of Cl > HCO3 > SO4 > NO3 > F for anions and Na > Ca > Mg > K for cations.

3.3. Water Purification Plants’ Efficiency

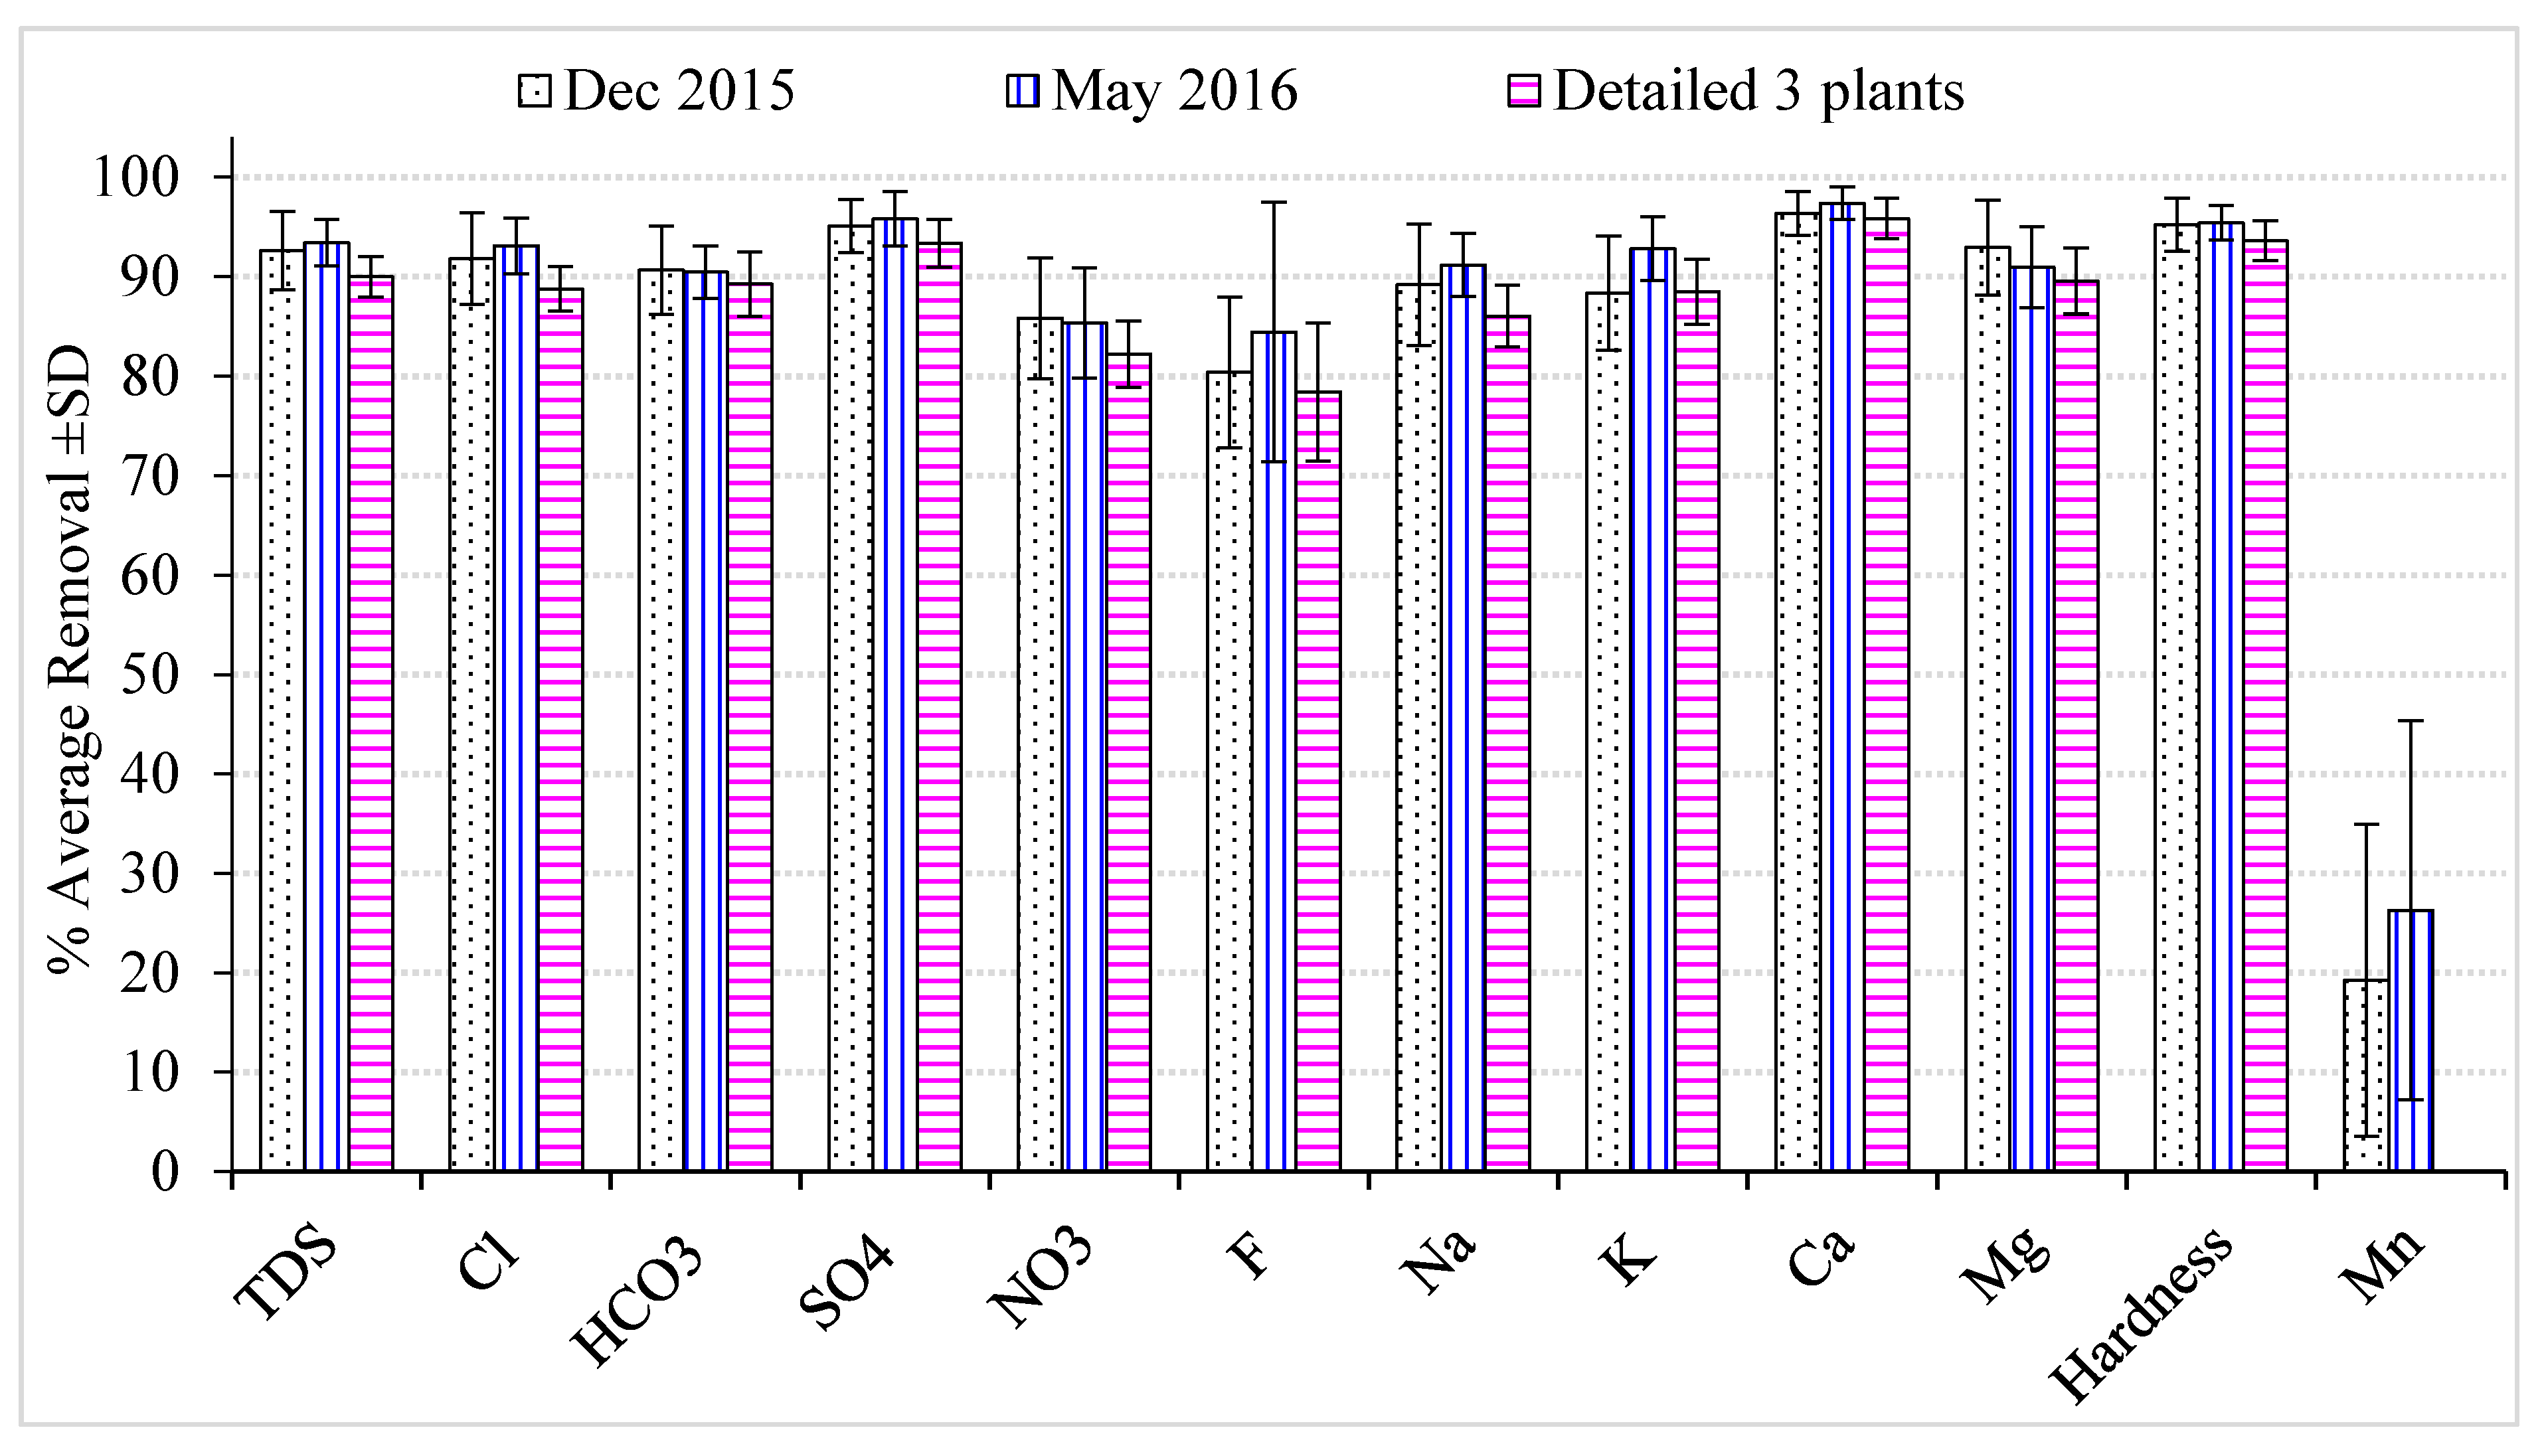
The average removal efficiency for the total dissolved solids, anions, and cations using the studied water purification plants is illustrated in Figure 3. The TDS percent removal ranged from 79.8 to 98.1%, with an average of 93 ± 3.23%. Meanwhile, the average concentrations of TDS decreased from 1916 ± 806 mg/L in groundwater to 118 ± 32.9 mg/L in purified water. Similarly, the average percentage removal of chloride, bicarbonate, and sulfate was 92.5 ± 3.84%, 90.5 ± 3.63%, and 95.4 ± 2.71%, respectively. Meanwhile, the nitrate and fluoride percent removal averaged 85.6 ± 5.76% and 82.4 ± 10.7%, respectively. As shown in Figure 3, the average percentage removal of cations (Na, K, Ca, Mg) was over 90%. The total hardness percentage removal ranged from 89.3 to 98.6%, as average concentrations reduced from 611 ± 254 to 25.1 ± 8.87 mg/L (CaCO3) through a purification process. On the other hand, this result indicated the lower percentage removal of Mn, averaging values of 23 ± 18.1%, Hence, further study is recommended in order to investigate the efficiency of water purification plants in removing trace metals (Fe, Mn, Cu, and Zn) from water. Overall, water purification techniques are essential to decrease the concentrations of dissolved solids, anions, and cations, and make groundwater suitable for safe human consumption [1,41,42].
The results indicate that there was no significant difference between the average efficiency of removal in December 2015 and that in May 2016. Moreover, the detailed investigation of the three water purification plants over the period December 2015–May 2016 indicated that there were no significant variations in purification efficiency over time. For instance, the average TDS percentage removal ranged from 87 to 95%, with a coefficient of variation of 2.3% throughout the studied period of December 2015–May 2016. Therefore, results of the current study indicated that the investigated water purification plants were working efficiently, with an average rate of over 90%. The studied water purification plants applied reverse osmosis and filtration processes, followed by the addition of chlorine as a disinfectant, removing total dissolved solids, anions (Cl, HCO3, and SO4), cations (Na, K, Ca, and Mg), and total hardness. Moreover, the results indicate that the purified water quality characteristics were consistent with the permissible limits set for drinking water. The availability of drinking water in sufficient quantity and quality is important to sustain public health and prevent the spread of waterborne diseases [3,26,28].

3.4. Water Quality Index

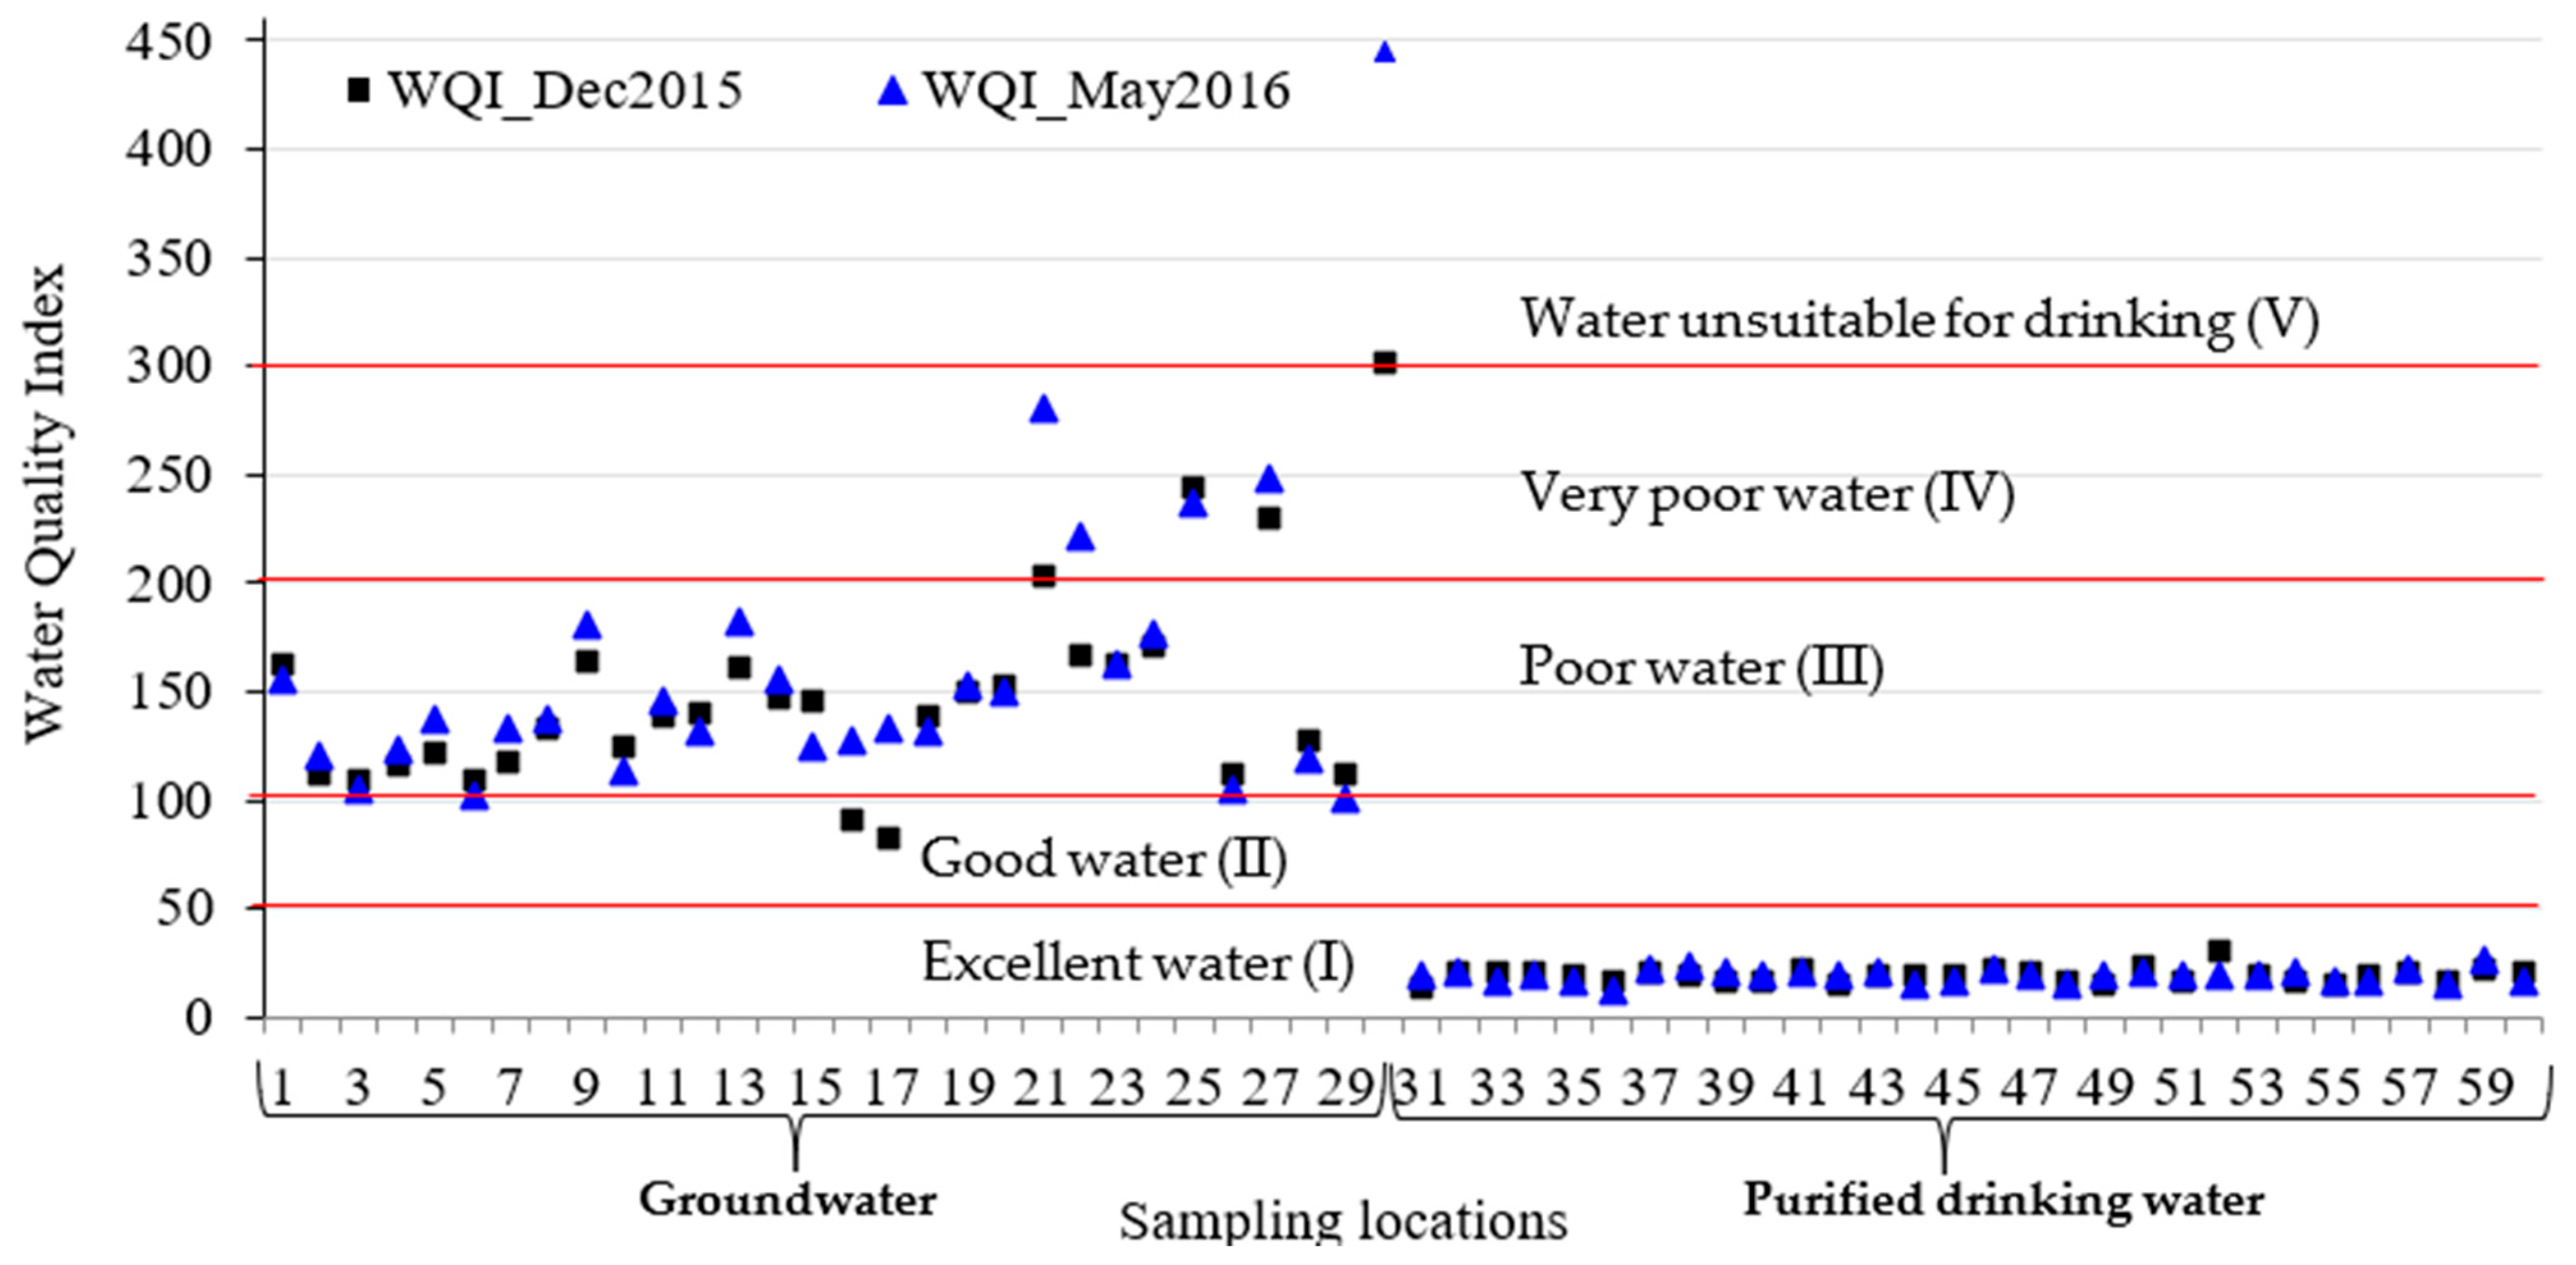
The average value of the water quality index for all the collected groundwater samples is 155 ± 59.2, which is equivalent to poor or very poor water quality (Table 3). Higher WQI values were observed in groundwater samples collected in May 2016 (range: 101–445) relative to those for water samples collected in December 2015 (range: 82.3 –302) (Figure 4). The observed high WQI values are correlated with high values of TDS, EC, anions (Cl, HCO3, and SO4), and cations (Na and K) measured in the groundwater samples collected in May 2016. The study area is characterized by dried conditions, along with increasing rates of groundwater pumping in summer for agricultural and domestic uses, resulting in a high salt content in groundwater [6,11,22]. Exactly 81.7%, 11.7%, and 3.33% of the collected groundwater samples had WQI values that classified it as poor water (100–200), very poor water (200–300), and water unsuitable for drinking (>300), respectively. It has been observed that 47% of the untreated groundwater in Hafar Albatin could be considered unsuitable (class V), whereas 39% and 14% could be considered very poor and poor water for drinking purposes [3]. Moreover, 87% of the groundwater samples collected from Al-Madinah City were considered unsuitable (class V) for drinking purposes [7].
On the other hand, 100% of the collected purified water samples could be classified as having excellent water quality for drinking (class I), as the WQI values ranged from 12.7 to 30.9, with an average of 18.9 ± 2.78 (Table 4 and Figure 4). In similar studies, 88% of the drinking water of the Riyadh main zone was considered excellent for drinking, whereas 64% of the treated groundwater in Hafar Albatin was considered to be of good quality [3,5]. Moreover, 74% of the drinking water in primary schools of Pakistan was considered of excellent and good quality for drinking [28]. The results of the current study indicated that purification plants improved the groundwater quality from water class III–V to class I, which is excellent for drinking purposes. Hence, the groundwater of the current study area should be subject to purification processes before use. Thus, WQI can be used as an effective management tool to facilitate drinking water quality assessment and support decision-making [26,27].
Since the competition for scarce water resources is intense in many countries, some water management strategies need to be employed to protect drinking water resources from pollution and sustain public health: first, by providing adequate potable water distribution networks covering both urban and rural areas of the community; second, by preventing drinking water resources from pollution through conducting environmental impact assessments (EIAs) for all anthropogenic projects; third, by establishing a periodic water quality monitoring and assessment program to ensure good drinking water quality; fourth, by investigating the efficiency of water purification plants through assessing various types of ion exchange materials and the reverse osmosis and filtration used in removing ions from water.

3.5. Correlation between Water Quality Variables

Pearson’s correlation analysis was applied to analyze the relationships between different water quality parameters (Table 5). There were significant positive correlations between TDS and the following ions: chloride, bicarbonate, sulfates, nitrate, sodium, potassium, calcium, and magnesium, with correlation coefficients of r = 0.84–0.99 (p < 0.01). These strong correlations reflect the significant contributions of these ions to the acquisition of water mineralization. Moreover, all the following water quality parameters (TDS, Cl, HCO3, SO4, NO3, Na, K, Ca, and Mg) were strongly correlated with each other (r = 0.74–0.99, p < 0.01). The significant positive correlations between Mg and Cl (r = 0.89) indicated that water hardness is permanent in nature [3].
The strong correlations among these measured variables suggest that they were influenced by the same environmental factors [11]. There was a weak but significant positive correlation (r = 0.26–0.28, p < 0.01) between iron, bicarbonate, and nitrate. Additionally, there was a weak, but significant, negative correlation (p < 0.01) between pH and all the measured water quality parameters (except turbidity, chlorine, Mn). No significant correlation was observed between chlorine and other water quality parameters, such as chlorine, which is added at the end of purification processes as a disinfectant.

4. Conclusions

Water is essential for the survival of all forms of life, and it represents up to 70% of living beings’ body weights. Many arid countries are suffering from water scarcity and limited freshwater resources. Providing a good drinking water quality in a sufficient quantity, along with assessing water purification plants, is essential to sustain human beings and protect the health of the whole world’s population. This study focused on the assessment of drinking water quality in the Al-Hassa region of KSA, an arid country, through the physiochemical analysis of water parameters, compared with the drinking water standards of Saudi Arabia and the World Health Organization, and with the aid of the water quality index. The study also evaluates the performance of water purification plants in removing total dissolved salts, anions, and cations. WQI is considered a simple management tool with which to evaluate the overall water quality and has been widely used to judge its suitability for various purposes.
The obtained results indicated that the concentrations of the total dissolved solids, turbidity, soluble anions and cations, nitrate, fluoride, total hardness, iron, and manganese in most purified water samples collected from Al-Hassa were within the permissible limits set by the SASO and WHO drinking water standards. On the other hand, the majority of the collected groundwater samples exceeded the allowable limits set for drinking water quality. Higher values of TDS, anions, and cations were observed in groundwater collected in May 2016 and from villages (northern and eastern) than in those collected in December 2015 and from central towns (Al-Hofuf and Al-Mubarraz). Therefore, the groundwater in the study area should be subject to further purification processes before it can be used for drinking purposes. The Piper diagram revealed two different types of groundwater: the sodium chloride-sulfate water type (80% of samples) and the calcium sulfate-chloride water type. Overall, this research provides an overview of drinking water quality assessment and the evaluation of the water purification efficiency in the Al-Hassa region, which can be applicable in other similar places.

Supplementary Materials

The following are available online at https://www.mdpi.com/article/10.3390/su13116122/s1.

Author Contributions

Conceptualization, E.-S.A.B. and A.A.A.-N.; methodology E.-S.A.B.; software, E.-S.A.B.; validation, E.-S.A.B. and A.A.A.-N.; formal analysis, E.-S.A.B. and A.A.A.-N.; investigation, E.-S.A.B. and A.A.A.-N.; resources, E.-S.A.B. and A.A.A.-N.; data curation, E.-S.A.B. and A.A.A.-N.; writing—original draft preparation, E.-S.A.B.; writing—review and editing, E.-S.A.B. and A.A.A.-N.; visualization, E.-S.A.B. and A.A.A.-N.; supervision, E.-S.A.B.; project administration, E.-S.A.B.; funding acquisition, E.-S.A.B. and A.A.A.-N. All authors have read and agreed to the published version of the manuscript.

Funding

This research was funded by the Deanship of Scientific Research, KFU, grant number 15008.

Data Availability Statement

Not Applicable.

Acknowledgments

The authors would like to acknowledge the help of the private water purification plants in Al-Hassa in providing the water samples used in this study. The comments of the anonymous reviewers are gratefully acknowledged.

Conflicts of Interest

The authors declare no conflict of interest.

References

  1. Rojas, L.V.; Santos, J.A.; Corcho-Alvarado, J.A.; Amaral, R.S.; Rollin, S.; Milan, M.O.; Fernandez, Z.H.; Francis, K.; Cavalcanti, M.; Santos, J.M.N. Quality and management status of the drinking water supplies in a semiarid region of Northeastern Brazil. J. Environ. Sci. Health Part A Toxic/Hazard. Subst. Environ. Eng. 2020, 55, 1247–1256. [Google Scholar] [CrossRef] [PubMed]
  2. Badr, E.A.; El-Sonbati, M.A.; Nassef, H.M. Water Quality Assessment in the Nile River, Damietta Branch, Egypt. Int. J. Environ. Sci. 2013, 8, 43–53. [Google Scholar] [CrossRef]
  3. Aly, A.A.; Al Omran, A.M.; Alharby, M.M. The water quality index and hydrochemical characterization of groundwater resources in Hafar Albatin, Saudi Arabia. Arab. J. Geosci. 2015, 8, 4177–4190. [Google Scholar] [CrossRef]
  4. Ghanim, A. Water-Resources-Crisis-in-Saudi-Arabia-Challenges-and-Possible-Management-Options-An-Analytic-Review. Int. J. Environ. Ecol. Eng. 2019, 13, 51–56. [Google Scholar]
  5. Al Omran, A.; Al Barakah, F.; Altuquq, A.; Aly, A.; Nadeem, M. Drinking water quality assessment and water quality index of Riyadh, Saudi Arabia. Water Qual. Res. J. Can. 2015, 50, 287–296. [Google Scholar] [CrossRef]
  6. Al-Naeem, A.A.; Al-Barrak, K.M. Assessment and evaluation of hydro-chemical and elemental analysis for Ain Al-Khadoud, Al-Hassa Oasis, Eastern Province, Saudi Arabia. J. Soil Sci. Agric. Eng. Mansoura Univ. 2010, 1, 815–826. [Google Scholar]
  7. Alghamdi, A.G.; Aly, A.A.; Aldhumri, S.A.; Al Barakaha, F.N. Hydrochemical and Quality Assessment of Groundwater Resources in Al-Madinah City, Western Saudi Arabia. Sustainability 2020, 12, 3106. [Google Scholar] [CrossRef] [Green Version]
  8. Al-Redhaiman, K.N.; Abdel Magid, H.M. The applicability of the local and international water quality guidelines to Al-Gassim region of central Saudi Arabia. Water Air Soil Pollut. 2002, 137, 235–246. [Google Scholar] [CrossRef]
  9. Alabdula’aly, A.I.; Al Rehaili, A.M.; Al Zarah, A.I.; Khan, M.A. Assessment of nitrate concentration in groundwater in Saudi Arabia. Environ. Monit. Assess. 2010, 161, 1–9. [Google Scholar] [CrossRef]
  10. Mohebbi, M.R.; Saeedi, R.; Montazeri, A.; Azam Vaghefi, K.; Labbafi, S.; Oktaie, S.; Abtahi, M.; Mohagheghian, A. Assessment of water quality in groundwater resources of Iran using a modified drinking water quality index (DWQI). Ecol. Indic. 2013, 30, 28–34. [Google Scholar] [CrossRef]
  11. Badr, E.S.A.; Al Naeem, A.A. Potable Water Quality Assessment in Al-Hassa, Eastern Region of Saudi Arabia. Fresenius Environ. Bull. 2016, 25, 4118–4129. [Google Scholar]
  12. Perez-Gonzalez, A.; Urtiaga, A.M.; Ibanez, R.; Ortiz, I. State of the art and review on the treatment technologies of water reverse osmosis concentrates. Water Res. 2012, 46, 267–283. [Google Scholar] [CrossRef] [PubMed]
  13. SASO. Bottled and Unbottled Drinking Water; Standard No. 409; SASO (Saudi Arabian Standards Organization): Riyadh, Saudi Arabia, 2009.
  14. WHO. Guidelines for Drinking Water Quality, 4th ed.; World Health Organization: Geneva, Switzerland, 2011. [Google Scholar]
  15. Massoud, M.A.; Al-Dakheel, Y.Y.; Hussein, A.H.; El-Mahmoudi, A.S. Spatial Decision Support System for Drinking Water Quality Monitoring and Evaluation in Al-Hassa. Int. J. Water Resour. Arid Environ. 2011, 1, 457–468. [Google Scholar]
  16. Ma, J.Z.; Ding, Z.Y.; Wei, G.X.; Zhao, H.; Huang, T.M. Sources of water pollution and evolution of water quality in the Wuwei basin of Shiyang river, Northwest China. J. Environ. Manag. 2009, 90, 1168–1177. [Google Scholar] [CrossRef] [PubMed]
  17. Zaidi, F.K.; Mogren, S.; Mukhopadhyay, M.; Ibrahim, E. Evaluation of groundwater chemistry and its impact on drinking and irrigation water quality in the eastern part of the Central Arabian graben and trough system, Saudi Arabia. J. Afr. Earth Sci. 2016, 120, 208–219. [Google Scholar] [CrossRef]
  18. Ikem, A.; Osibanjo, O.; Sridhar, M.K.C.; Sobande, A. Evaluation of groundwater quality characteristics near two waste sites in Ibadan and Lagos, Nigeria. Water Air Soil Pollut. 2002, 140, 307–333. [Google Scholar] [CrossRef]
  19. Soltan, M.E. Evaluation of ground water quality in Dakhla Oasis (Egyptian Western Desert). Environ. Monit. Assess. 1999, 57, 157–168. [Google Scholar] [CrossRef]
  20. Al-Naeem, A.A. Monitoring of Groundwater Salinity for Water Resources Management in Irrigated Areas of Al-Jouf Region, Saudi Arabia. Res. J. Environ. Sci. 2015, 9, 256–269. [Google Scholar] [CrossRef] [Green Version]
  21. Al-Otaibi, E.L.; Zaki, M.S. Physico-chemical Quality of Drinking Water at Mushait, Aseer, South-Western, Saudi Arabia. Afr. J. Clin. Exp. Microbiol. 2009, 10, 117–127. [Google Scholar] [CrossRef]
  22. Al-Zarah, A.I. Elemental Composition of Groundwater and Spring Waters in Al-Ahsa Oasis, Eastern Region Saudi Arabia. Trends Appl. Sci. Res. 2011, 6, 1–18. [Google Scholar] [CrossRef] [Green Version]
  23. Karavoltsos, S.; Sakellari, A.; Mihopoulos, N.; Dassenakis, M.; Scoullos, M.J. Evaluation of the quality of drinking water in regions of Greece. Desalination 2008, 224, 317–329. [Google Scholar] [CrossRef]
  24. Gupta, A.K.; Gupta, S.K.; Patil, R.S. A comparison of water quality indices for coastal water. J. Environ. Sci. Health Part A-Toxic/Hazard. Subst. Environ. Eng. 2003, 38, 2711–2725. [Google Scholar] [CrossRef]
  25. Lateef, K.H. Evaluation of groundwater quality for drinking purpose for tikrit and samarra cities using water quality index. Eur. J. Sci. Res. 2011, 58, 472–481. [Google Scholar]
  26. Rahaman, M.F.; Ali, M.S.; Arefin, R.; Mazumder, Q.H.; Majumder, R.K.; Jahan, C.S. Assessment of drinking water quality characteristics and quality index of Rajshahi city, Bangladesh. Environ. Dev. Sustain. 2020, 22, 3957–3971. [Google Scholar] [CrossRef]
  27. Saeedi, M.; Abessi, O.; Sharifi, F.; Meraji, H. Development of groundwater quality index. Environ. Monit. Assess. 2010, 163, 327–335. [Google Scholar] [CrossRef] [PubMed]
  28. Ahmed, J.; Wong, L.P.; Chua, Y.P.; Channa, N. Drinking Water Quality Mapping Using Water Quality Index and Geospatial Analysis in Primary Schools of Pakistan. Water 2020, 12, 3382. [Google Scholar] [CrossRef]
  29. Stambuk-Giljanovic, N. Water quality evaluation by index in Dalmatia. Water Res. 1999, 33, 3423–3440. [Google Scholar] [CrossRef]
  30. Almuhanna, E.A. Atmospheric aerosol characterization and element composition at Al-Ahsa Oasis of Saudi Arabia. Sci. J. King Faisal Univ. Basic Appl. Sci. 2017, 18, 35–47. [Google Scholar]
  31. Al Omran, A.M.; El Maghraby, S.E.; Aly, A.A.; Al Wabel, M.I.; Al Asmari, Z.A.; Nadeem, M.E. Quality assessment of various bottled waters marketed in Saudi Arabia. Environ. Monit. Assess. 2013, 185, 6397–6406. [Google Scholar] [CrossRef]
  32. APHA. Standard Methods for the Examination of Waters and Wastewaters, 20th ed.; American Public Health Association (APHA): Washington, DC, USA, 2005. [Google Scholar]
  33. Adams, V.D. Water & Wastewater Examination Manual; Lewis Publishers: Chelsea, MI, USA, 1990. [Google Scholar]
  34. Hanrahan, G.; Gardolinski, P.; Gledhill, M.; Worsfold, P. Environmental monitoring of nutrients. In Environmental Monitoring Handbook; Burden, F.R., Mckelvie, I.D., Forstner, U., Guenther, A., Eds.; McGraw-Hill: New York, NY, USA, 2002; pp. 8.1–8.16. [Google Scholar]
  35. Simoes, F.d.S.; Moreira, A.B.; Bisinoti, M.C.; Gimenez, S.M.N.; Yabe, M.J.S. Water quality index as a simple indicator of aquaculture effects on aquatic bodies. Ecol. Indic. 2008, 8, 476–484. [Google Scholar] [CrossRef]
  36. Yidana, S.M.; Yidana, A. Assessing water quality using water quality index and multivariate analysis. Environ. Earth Sci. 2010, 59, 1461–1473. [Google Scholar] [CrossRef]
  37. Sanchez, E.; Colmenarejo, M.F.; Vicente, J.; Rubio, A.; Garcia, M.G.; Travieso, L.; Borja, R. Use of the water quality index and dissolved oxygen deficit as simple indicators of watersheds pollution. Ecol. Indic. 2007, 7, 315–328. [Google Scholar] [CrossRef]
  38. Ramakrishnaiah, C.R.; Sadashivaiah, C.; Ranganna, G. Assessment of Water Quality Index for the Groundwater in Tumkur Taluk, Karnataka State, India. E-J. Chem. 2009, 6, 523–530. [Google Scholar] [CrossRef] [Green Version]
  39. Sadiq, M.; Hussain, G. Drinking water quality in Saudi Arabia—An overview. Arab. J. Sci. Eng. 1997, 22, 153–164. [Google Scholar]
  40. Al-Ghanim, K.A.; Abd El-Salam, M.M.; Mahboob, S. Assessment of Water Quality for Some Roof Tanks in Alkharj Governorate, KSA. Pak. J. Zool. 2014, 46, 1003–1012. [Google Scholar]
  41. Nouri, D.A.; Abdulkarim, B.A.; Arzoo, S.; Bakeet, Z.A.N. Quality Characteristics of Commonly Consumed Drinking Water in Riyadh and Effect of Domestic Treatments on Its Chemical Constituents. J. Food Nutr. Res. 2014, 2, 25–33. [Google Scholar]
  42. Alabdulaaly, A.I. Nitrate concentrations in Riyadh, Saudi Arabia drinking water supplies. Environ. Monit. Assess. 1997, 47, 315–324. [Google Scholar] [CrossRef]
  43. Piper, A.M. A graphic procedure in the geochemical interpretation of water-analyses. Trans. Am. Geophys. Union 1944, 25, 914–923. [Google Scholar] [CrossRef]
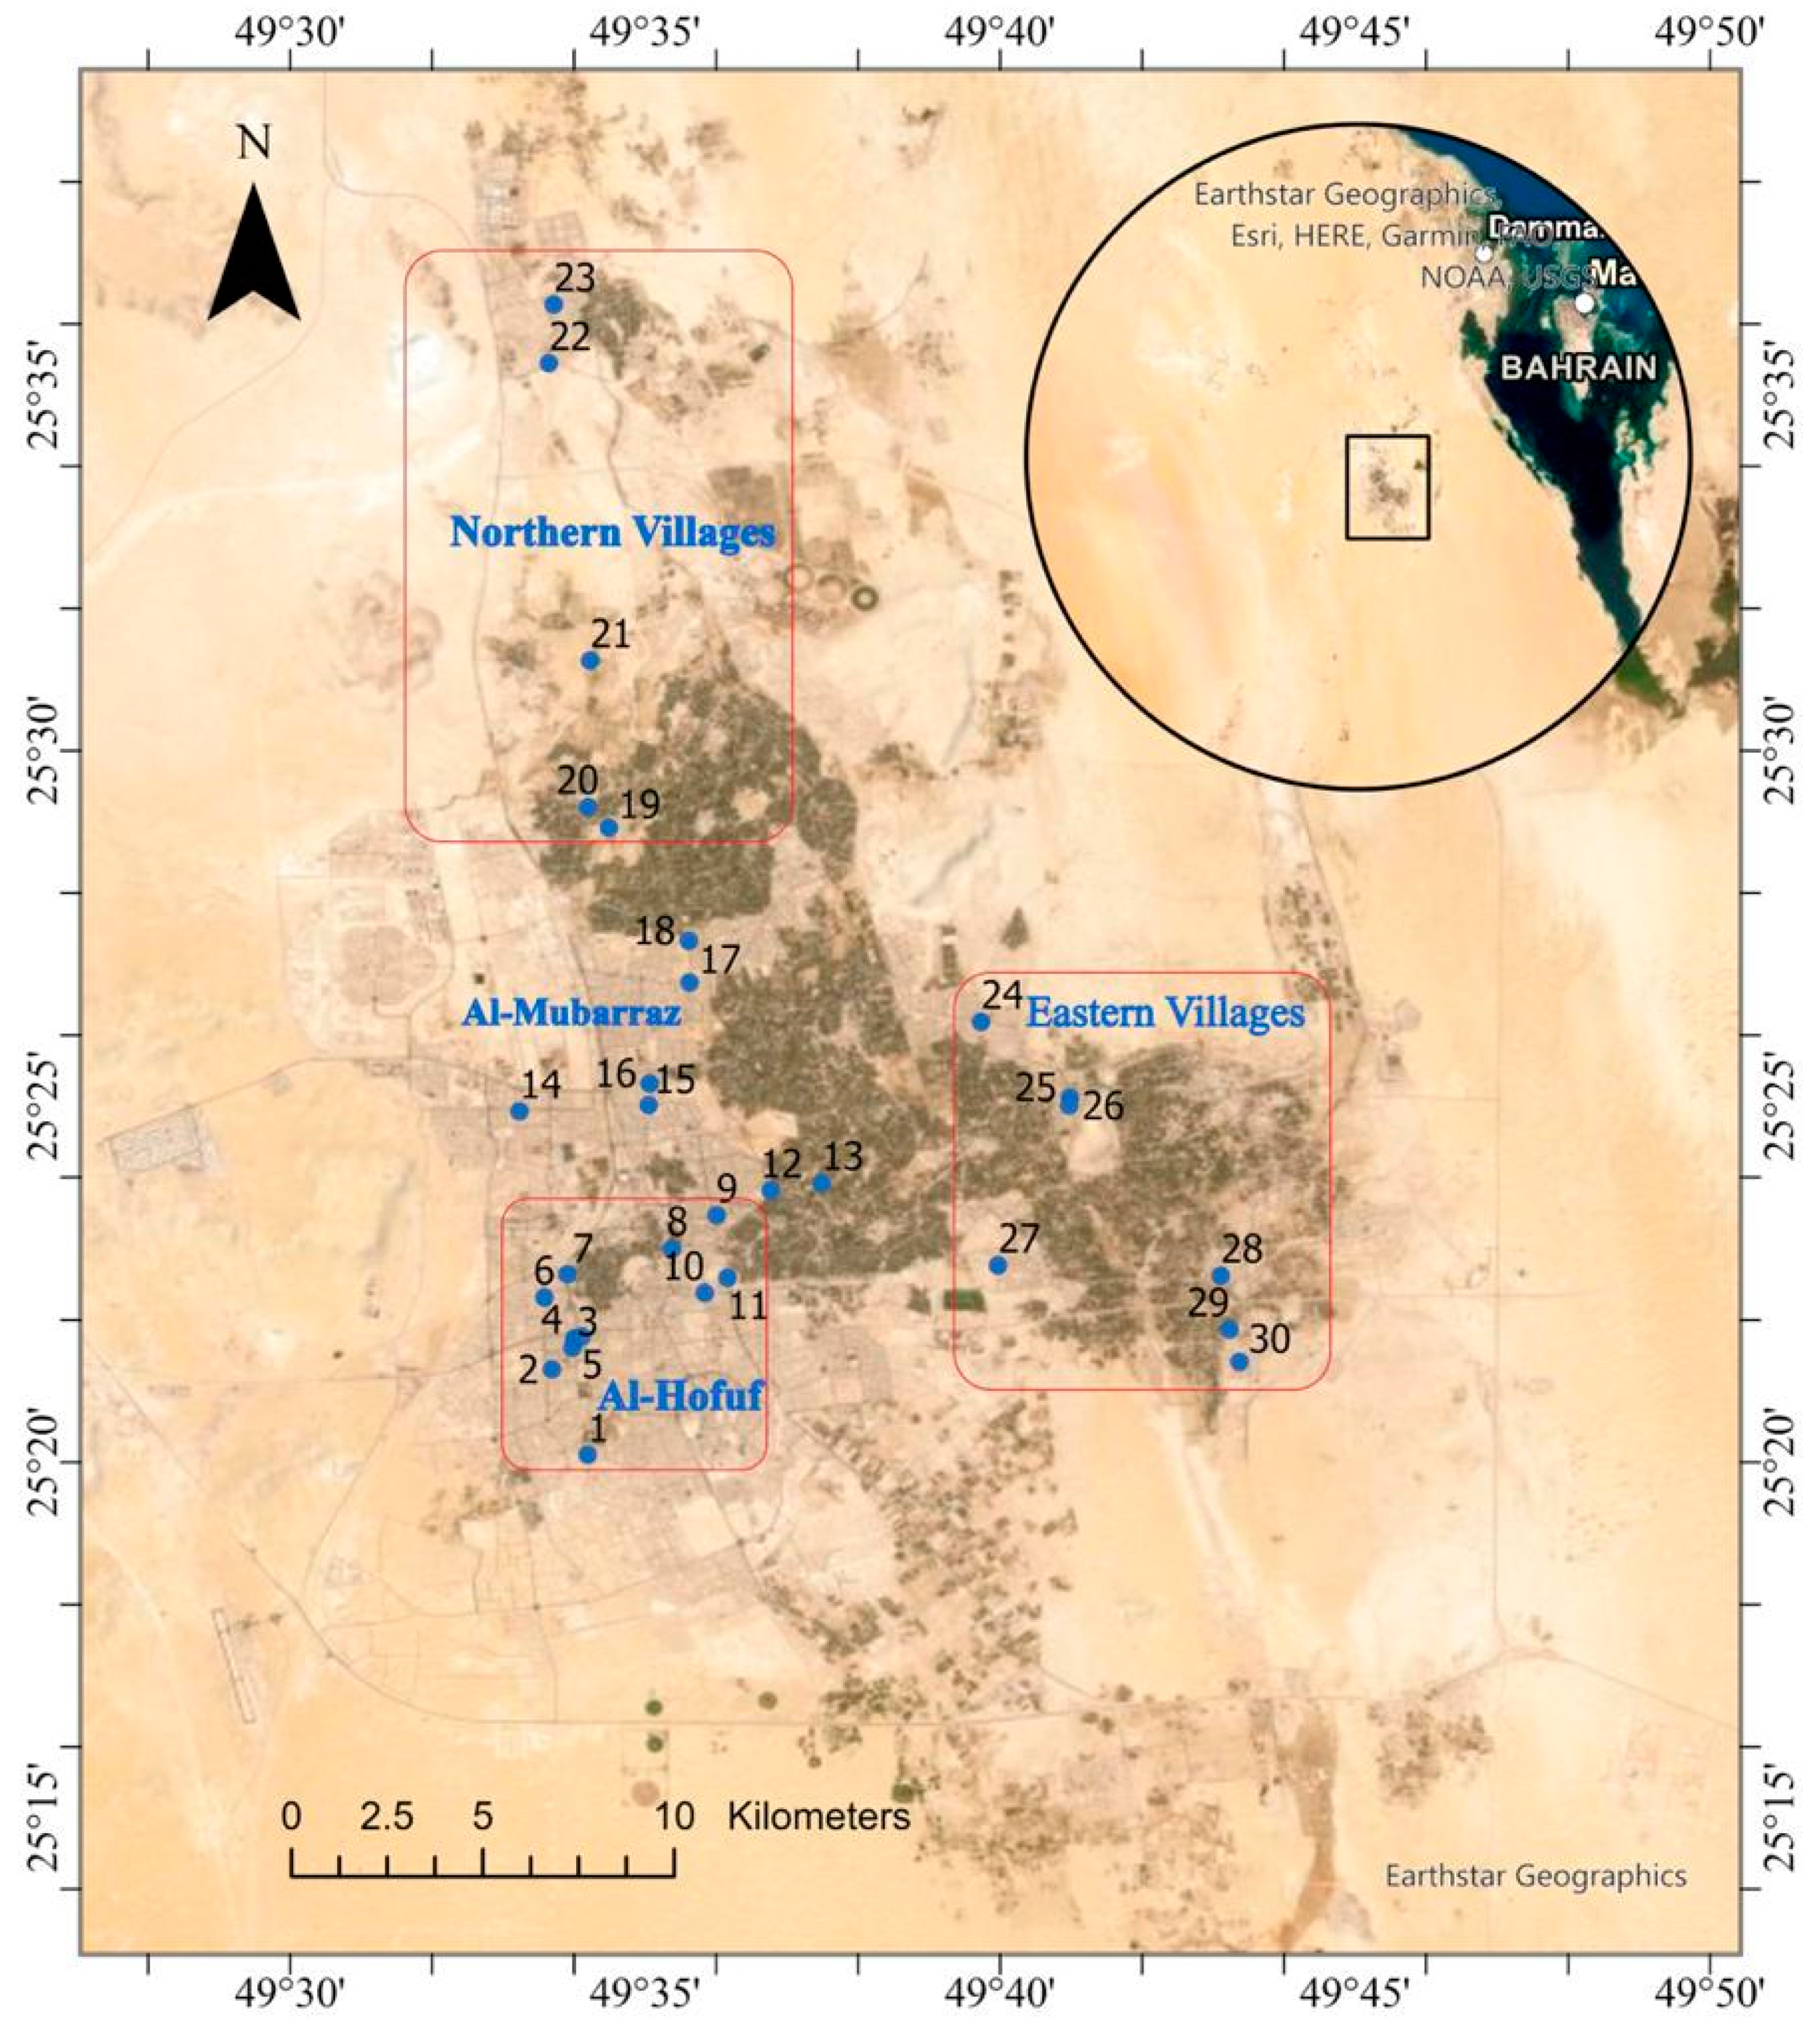
Figure 1. Geographic map of the Al-Hassa Oasis, KSA, showing the locations of the water purification plants investigated in this study.
Sustainability 13 06122 g001
Figure 2. Piper trilinear diagram showing the major ionic composition of groundwater samples collected from Al-Hassa Oasis, KSA.
Sustainability 13 06122 g002
Figure 3. Purification efficiency (% average removal ± SD) of the 30 studied private water purification plants in Al-Hassa Oasis, KSA.
Sustainability 13 06122 g003
Figure 4. Values of WQI for the collected groundwater and purified drinking water from Al-Hassa Oasis, KSA.
Sustainability 13 06122 g004
Table 1. Relative weight (Wi) for each water quality parameter and the Saudi Arabian Standards Organization (SASO 2009) [13] and World Health Organization (WHO 2011) [14] standards for drinking water (maximum permissible limit).
ParametersWeight (wi)Relative Weight (Wi) WHO (2011) and SASO (2009) Standards
pH30.0616.5–8.5
TDS (mg/L)50.102500
Turbidity (NTU)30.0615
Free Cl2 (mg/L)20.0410.2–0.5
Total Hardness (mg/L)30.061500
Chloride (mg/L)40.082250
Bicarbonate (mg/L)20.041125
Sulphate (mg/L)30.061250
Nitrate (mg/L as N)40.08210
Fluoride (mg/L)30.0611.5
Sodium (mg/L)40.082200
Potassium (mg/L)30.06112
Calcium (mg/L)30.061100
Magnesium (mg/L)30.06150
Iron (µg/L)20.041300
Manganese (µg/L)20.041100
wi = 49 Wi = 1
Table 2. Water quality classification based on WQI values [3].
Water ClassType of WaterWQI Value Range
IExcellent water<50
IIGood water50–100
IIIPoor water100–200
IVVery poor water200–300
VWater unsuitable for drinking>300
Table 3. Descriptive statistics of the measured parameters and WQI values in groundwater samples collected from Al-Hassa Oasis, KSA, including ANOVA F ratio of statistically significant variance.
ParametersGroundwater Quality, All Data (n = 60)December 2015 (n = 30)May 2016 (n = 30)
Average ± SDMinMaxANOVA FAverage ± SDAverage ± SD
Temperature24.3 ± 4.3919.533.54.0621.0 ± 2.1727.7 ± 3.35
pH7.15 ± 0.176.777.690.917.22 ± 0.197.08 ± 0.11
TDS (mg/L)1916 ± 80685055136.631868 ± 7061965 ± 905
EC (µS/cm)3191 ± 1341141691736.743110 ± 11703273 ± 1508
Turbidity 0.288 ± 0.140.1000.7450.940.263 ± 0.160.312 ± 0.11
Free Cl2 (mg/L)0.083 ± 0.030.0300.1600.450.078 ± 0.030.089 ± 0.02
Cl (mg/L)675 ± 37025323576.55644 ± 317707 ± 419
HCO3 (mg/L)191 ± 20.01302284.98185 ± 22.9198 ± 14.6
SO4 (mg/L)276 ± 70.41675964.00276 ± 57.8276 ± 82.2
NO3 (mg N/L)6.30 ± 2.270.63514.61.106.24 ± 2.246.35 ± 2.33
F (mg/L)0.999 ± 0.280.5381.941.061.03 ± 0.260.973 ± 0.29
Na (mg/L)323 ± 1321179884.30291 ± 101356 ± 151
K (mg/L)50.0 ± 30.716.12172.6739.8 ± 16.160.1 ± 38.0
Ca (mg/L)158 ± 68.982.545910.33172 ± 74.9143 ± 60.0
Mg (mg/L)52.7 ± 24.919.31413.7759.9 ± 19.045.5 ± 28.2
Hardness (mg/L)611 ± 25434415038.83677 ± 232545 ± 261
Fe (µg/L)114 ± 92.226.23112.7882.3 ± 68.0146 ± 103
Mn (µg/L)35.9 ± 18.96.4989.90.2934.0 ± 18.337.8 ± 19.6
WQI155 ± 59.282.34456.01148 ± 46.8161 ± 69.7
Bold F ratio is significant at p “probability” < 0.01 significance level (critical F value = 4.16).
Table 4. Descriptive statistics of the measured parameters and WQI values in the purified drinking water samples collected from Al-Hassa Oasis, KSA, including the ANOVA F ratio of statistically significant variance.
ParametersPurified Water Quality, All Data (n = 60)December 2015 (n = 30)May 2016 (n = 30)
Average ± SDMinMaxANOVA FAverage ± SDAverage ± SD
Temperature24.1 ± 4.2719.433.43.1320.8 ± 1.7527.5 ± 3.26
pH7.54 ± 0.276.748.081.147.46 ± 0.307.61 ± 0.21
TDS (mg/L)118 ± 32.950.62651.43122 ± 40.8115 ± 22.7
EC (µS/cm)197 ± 54.882.84421.41203 ± 68.1191 ± 37.4
Turbidity 0.239 ± 0.130.1000.7830.310.247 ± 0.160.230 ± 0.08
Free Cl2 (mg/L)0.106 ± 0.110.0400.8401.730.090 ± 0.080.122 ± 0.14
Cl (mg/L)42.6 ± 14.817.41302.3044.3 ± 18.840.9 ± 9.30
HCO3 (mg/L)17.9 ± 6.616.8333.44.32 16.9 ± 7.5618.9 ± 5.46
SO4 (mg/L)11.8 ± 6.702.3329.65.05 13.2 ± 7.2810.5 ± 5.88
NO3 (mg N/L)0.881 ± 0.430.1731.961.700.848 ± 0.420.914 ± 0.45
F (mg/L)0.177 ± 0.120.0360.5791.850.197 ± 0.080.156 ± 0.14
Na (mg/L)28.3 ± 9.998.3383.62.8128.1 ± 12.528.6 ± 6.84
K (mg/L)3.72 ± 1.081.609.822.423.99 ± 1.233.45 ± 0.84
Ca (mg/L)4.35 ± 2.311.7815.10.845.41 ± 2.543.29 ± 1.44
Mg (mg/L)3.46 ± 1.411.029.024.58 3.67 ± 1.843.25 ± 0.75
Hardness(mg/L)25.1 ± 8.8713.654.83.1628.6 ± 10.921.6 ± 3.92
Fe (µg/l)75.7 ± 43.320.51871.1966.2 ± 39.085.3 ± 45.9
Mn (µg/l)27.7 ± 16.15.1379.30.3327.5 ± 13.727.9 ± 18.5
WQI18.9 ± 2.7812.730.90.6319.1 ± 3.0618.8 ± 2.51
Bold F ratio is significant at the p “probability” < 0.01 significance level (critical F value = 4.16).
Table 5. Correlation coefficient matrix of water quality parameters and WQI for water samples collected from Al-Hassa Oasis, KSA.
pHTDSTURCl2ClHCO3SO4NO3FNaKCaMgFeMn
pH1.00
TDS−0.331.00
TUR0.140.181.00
Cl20.04−0.12−0.101.00
Cl−0.280.990.17−0.111.00
HCO3−0.410.890.19−0.150.821.00
SO4−0.450.870.09−0.150.790.921.00
NO3−0.330.840.11−0.120.800.830.821.00
F−0.460.700.17−0.140.600.850.850.541.00
Na−0.320.990.19−0.120.980.880.850.840.681.00
K−0.290.940.13−0.100.940.780.810.800.560.951.00
Ca−0.360.960.14−0.130.930.890.900.820.740.920.851.00
Mg−0.340.920.11−0.140.890.840.870.770.750.880.830.911.00
Fe−0.260.190.080.070.180.280.230.260.190.230.170.200.081.00
Mn−0.140.260.05−0.050.250.240.230.270.150.260.300.240.190.121.00
Bold correlations are significant at the p “probability” < 0.01 significance level, (N = 150).
Publisher’s Note: MDPI stays neutral with regard to jurisdictional claims in published maps and institutional affiliations.