Abstract
Research focusing on stress change comparing before and after being affected by the first COVID-19 outbreak is still limited. This study examined the model between the stress changes during the first COVID-19 outbreak and social attributes (age, sex, occupation, etc.) among residents of four cities around the globe. We obtained 741 valid responses from the residents of London (11.5%), New York (13.8%), Amsterdam (11.7%), and Tokyo (53.4%), through a web-based questionnaire survey conducted in collaboration with a private research firm. We identified 16 statistically significant variables out of 36 explanatory variables, which explained a significant stress change compared to the pre-outbreak period. This result showed that whether living alone or not and the number of times going out for walk or jogging during the first COVID-19 outbreak were the explanatory variables with higher significance for the reduced stress. In addition, those who lived in a place different from their hometowns, who were dissatisfied with their work or their family relationships were more stressed, with statistically significant differences.
1. Introduction
As of 11 March 2021, a total of 118 million people were confirmed to be infected by the novel coronavirus disease COVID-19, and 2.6 million deaths were reported globally. The death toll in the four target cities was as follows: 1497 people in Tokyo [1], 48,092 in New York [2], 694 people in Amsterdam [3], and 84,935 people in London [4]. Kissler et al. indicated that the prolonged or intermittent social distancing may continue to be necessary into 2022; they also mentioned that SARS-CoV-2 outbreaks may resurge as late as 2024 [5]. While attention has been paid to the people who become infected or lost their lives due to COVID-19, however, we would like to emphasize that a much larger number of non-infected people are also experiencing serious impacts due to increasing stress levels under the effects of lockdowns, self-restraint practices and various societal changes. For instance, social distancing, which is considered necessary to reduce the spread of COVID-19, can make people feel isolated and lonely, leading to an increase of stress and anxiety [6]. Further, movement restrictions aimed to prevent the spread of the COVID-19 can make violence at homes more frequent or severe [7]. It is therefore important to explore common factors that alleviate stresses under the pandemic, particularly in cities, with larger populations and higher population densities. Such studies could play an important role in coping not only with the prolonged COVID-19 outbreaks, but also with possible new viral outbreaks in the future.
When we were preparing for our survey, we recognized that existing research on COVID-19 outbreak and stress caused by various restrictions have mainly targeted Chinese citizens, particularly healthcare workers and patients [8,9,10,11], or university students [12,13]. Thus, we suspect that the findings from the early studies have been biased toward the cases in China. The majority of the studies on individuals under COVID-19 has been related to sensitivity prevention [14,15] and stress observed in different workplaces or occupations (medical institutions of educational settings) [16,17,18,19,20]. Other scholars have also examined stress levels in remote working environments [21,22]. During the phase of data collection and analyses, stresses caused by COVID-19 with particular focus on a number of specific groups or social attributes were reported, such as healthcare workers [23,24,25,26,27,28,29], adults taking care of children [30,31,32], pregnant women [33,34], university students [35], elderly [36], scientists [37], people with illnesses [38,39,40,41], and civil servants [41,42]. Though researchers have also studied the stress levels of medical professionals, an analysis of stress changes that compared before and during the COVID-19 outbreak with diverse groups of people has been very limited, to the best of our knowledge.
The limited studies on stress in the general population [43,44,45,46,47,48,49,50], rather than in individual populations, have indicated that women and socially isolated people were experiencing more stress during the first outbreak due to COVID-19. Therefore, we assume that there are two major knowledge gaps in the studies described above: (1) studies on stress of a single or a particular group of people only represent a small part of the society, and (2) the studies did not investigate the stress changes compared to the period prior to the outbreak, the influence of people already receiving stress before the COVID-19 outbreak cannot be excluded. Although a few studies have compared the stress before and during the first outbreak of COVID-19, such studies are only targeting a particular group of people [51,52]. There is one study that analyzed stress changes in the general society, however, it compared the situation during the initial lockdown and the situation after it [53]. Therefore, it is important to comprehensively analyze the relationship between the stress change compared to before the outbreak and the age, occupation, range of activities, place of residence, and community of people with various other attributes.
Uehara et al. have already reported the first model analysis of stress change caused by the COVID-19 outbreak in the general population in major Japanese cities and a rural area [46]. In this study, we examined the relationships between the stress change due to the first COVID-19 outbreak in 2020 and social attributes (age, sex, occupation, etc.) among urban residents of four global cities (Tokyo, New York, Amsterdam, and London; Figure 1). The four cities were selected as the target for this study: London from the major European cities, New York from the American continent, Tokyo from Asia, and finally Amsterdam, which developed in a different path from the Roman style city planning.
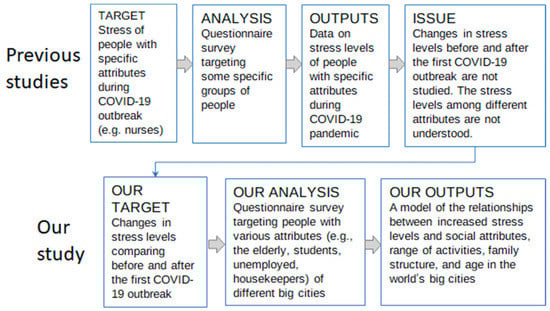
Figure 1.
Position of our research in the literature.
2. Materials and Methods
2.1. Design and Participants
In the previous article, we analyzed a model of stress change caused by the first COVID-19 outbreak in three regions of Japan, with the data from residents in large cities (Tokyo and Osaka) and a rural area (Nagano Prefecture) [46]. In this article, we have put a strong emphasis on world’s large-scale urban areas where the issue of stress is even more serious. This enabled us to reveal the common factors that can reduce stress and improve the quality of life under the COVID-19 pandemic.
Our research question is as follows: what are the important factors that affect stress changes under the COVID-19 pandemic in the world’s highly populated urban areas? Under this research question, we hypothesized that the following three factors have significant impacts on the stress change in urban areas: (1) relationships with family members and local communities (as we observed in Japan in the previous article), (2) the number of COVID-19 infected individuals and seriousness of the outbreak (i.e., New York City), and (3) income levels and economic vulnerability.
As the sampling targets, we selected the residents of Tokyo, New York, Amsterdam, and London. Table 1 presents the basic information, including population density, first outbreak (request for ‘self-restraint’ for Tokyo, and ‘lockdown’ for the other three cities) period, and some of the examples of major restrictions imposed on the citizens of the four target cities. The population of Tokyo appeared to be the largest among the four cities. While New York had the highest population density, that of Amsterdam marked the lowest (one-third of New York’s). The duration of the initial outbreak period was the longest in London and the shortest in Tokyo. The citizens of Tokyo only experienced a “request” from the government, while the people in the other three cities were under strict “control.” (Table 1).

Table 1.
Basic information of the four target cities.
We planned to conduct a web-based questionnaire survey through a private company called Asmark Inc., by continuing to request respondents from the four target cities until the responses reach a total of 300 from each city. However, due to differences in the cost per respondent, we eventually obtained responses from many people in Tokyo, while the other three cities received around 100 responses. Asmark Inc. has 16 million registered users and provides support to deliver questionnaire surveys in accordance with the international standard JIS Y20252 (ISO 20252). In June 2020, we obtained 435 answers from Tokyo. In July 2020, a total of 367 people mainly from the three global cities (i.e., New York, Amsterdam, and London, including 71 respondents from other cities) answered the web survey questionnaire, and thus we obtained 802 samples in total. We excluded incomplete answers and the responses that had same values for all items related to the objective variable of stress change, which yielded a valid response rate of 92.4% (741 respondents). The sample size for this survey was larger than 10 times of the total number of the 62 questions (consisting of the questions for the objective variable, stress change, vigor, and health related issues [mean value] = 26, and that of the explanatory variables = 36). In order to conduct an exploratory research, we used as many variables as possible, and narrowed down to identify the significant variables.
2.2. Ethical Considerations
This study obtained an official approval from the Institutional Review Board of the Faculty of Economics and Law of Shinshu University on 10 June 2020. At the beginning of the questionnaire, the respondents were asked to click on the consent button, if they agree to participate in the survey and if they approve publication of the survey results. In case the respondents did not agree or wished not to continue the survey, they could always quit the survey.
2.3. Definition of Variables
2.3.1. Explanatory Variables
A web-based questionnaire consisting of the following components (36 explanatory variables) was developed: relationships with family and neighbors (availability of support in case they faced difficulties, frequency of conversations); satisfaction with work and family life; most restricted public facilities and private facilities; changes of daily activities compared to the situation before the COVID-19 outbreak; daily activities under the COVID-19 outbreak (times/week); whether the respondent (and family) had done any walking or jogging during first outbreak; habits of walking/jogging outdoors; sex, age, and number of family members, environment where the respondent grew up; type of house which the respondent lived the longest during childhood; type of current residence; number of years living in the current residence; history of moving; occupation; income status compared to the situation before the first outbreak; and ownership of a private car.
2.3.2. Objective Variables Using the Job Stress Questionnaire of the Japanese Ministry of Health, Labour and Welfare
The stress change comparing before and during the COVID-19 outbreak was the objective variable, which was assessed based on the general stress assessment questions used in Japan. The abovementioned original set of questions had 57 items for checking stress, which were divided into working stress, stress response, and stress-mitigating factors. In this study, we particularly focused on the two factors of the original questionnaire, which were stress response and stress-mitigating factors. The Cronbach’s alpha (the reliability coefficient) of the original questionnaire of the Ministry of Health, Labour and Welfare of Japan is reported to be >0.8.
Questions related to stress, vigor, and health were developed based on the Job Stress Questionnaire of the Japanese Ministry of Health, Labour and Welfare Stress Check in 2015. This questionnaire includes questions on work-related stress. For this article, questions on stress change compared to the situation before the outbreak were prepared by referring to the questions used for general stress assessment. This is a simple clinical tool for analyzing subjective anxiety. Our questionnaire comprised of 26 questions in total, scored on a five-point Likert scale to assess the status. Our modified five-point scale was as follows: 1 = much less than before; 2 = less than before; 3 = no difference; 4 = more than before; and 5 = much more than before (Appendix A). Questions 1–3 were indicators for vigor, Questions 4–18 were indicators for stress, and Questions 18–26 were indicators for health. A higher mean score for vigor indicates a more positive mental state. In contrast, higher mean scores of stress and health related issues indicate higher levels of stress and poor health, respectively. A score > 3 indicates an increase in the value from the situation before the COVID-19 outbreak, whereas a score ≤ 3 indicates a decrease from the pre-outbreak period. Since the scores for stress change was used as the objective variable in this analysis, the scores for health-related issues and vigor were considered collinear if they strongly correlated with the stress scores, and in that case could not be used as objective variables. The Cronbach’s alpha of our questionnaire was 0.95, while McDonald’s Omega Index of this questionnaire was 0.97. A study on a questionnaire for measuring health-related quality of life concluded that the Cronbach’s alpha and the McDonald’s Omega Index of 0.93 had a good reliability [64]; this result supports the relevance of our questionnaire.
Figure 2 shows the transition of newly infected COVID-19 cases (per 100,000 people) at the early stages of the outbreak in four countries where the four target cities are located. This figure indicates that our web survey was conducted at the same time when the drastic increase of new infection was alleviated, except for the United States. The first outbreak (request for ‘self-restraint’ in Tokyo, and ‘lockdown’ for the other three cities) period for each was as follows; 7 April–25 May 2020 for Tokyo, 22 March–15 May 2020 for New York, 23 March–11 May 2020 for Amsterdam, and 26 March–4 July 2020 for London). We assumed that the respondents would consider the period from autumn 2019 to January, February, and early March 2020 as the pre-outbreak period when answering the questionnaire.
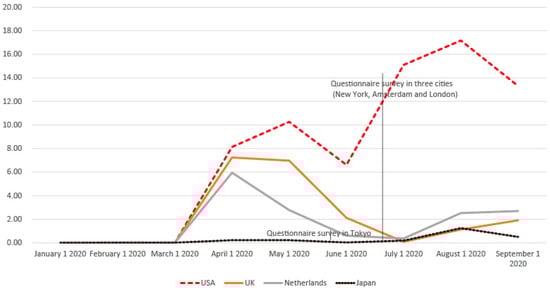
Figure 2.
Transition of newly infected cases of COVID-19 (per 100,000 people) in the United States, United Kingdom, The Netherlands, and Japan.
2.4. Statistical Analysis
This study was implemented in three steps to explore the relationships between stress change and the 36 explanatory variables: (1) correlation analysis, (2) comparison of stress changes for each significant explanatory variable, and (3) explanatory modelling by multiple regression analysis for stress change. For the explanatory model, explanatory variables with significant correlations divided into detailed response categories were used. Categorical data were expressed as frequencies and percentages, and continuous data as mean ± standard deviation (SD). Comparisons in the two groups were performed using two independent-sample t-tests, and comparisons among multiple groups were conducted using single-factor analysis of variance. Correlations among quantitative data (amount of change in self-assessments of vigor, stress, and health related issues using the Japanese Ministry of Health, Labour and Welfare Stress Check) were analyzed using Pearson’s correlation analysis, and multiple linear regression analysis was used for multivariate analysis. All statistical analyses were performed using R version 4.0.2, with two-tailed p < 0.05 being considered significant.
3. Results
3.1. Characteristics of Participants
Figure 3 and Figure 4 show the distribution of age and occupation of the target respondents. The ages of all subjects were Bell Shaped: The normal pattern (Figure 3), and their occupations were more diverse compared to the other studies (e.g., nurses and teachers), showing that our data covered a diverse group of people (Figure 4). Regarding age, while most target cities were in a normal pattern, Amsterdam had a larger proportion of young people, and a smaller proportion of old people (Ragged Plateau: No single clear process or pattern). In terms of occupation, Amsterdam had a large percentage of students, while Tokyo had a high percentage of respondents engaged in domestic duties.
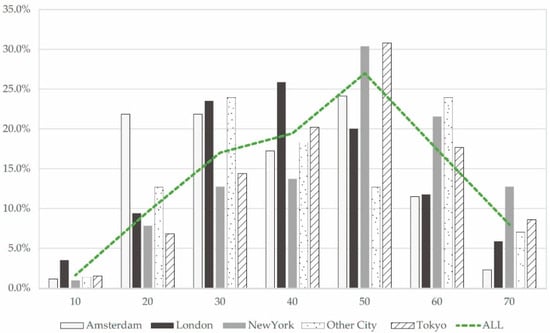
Figure 3.
Age distribution of research subjects.
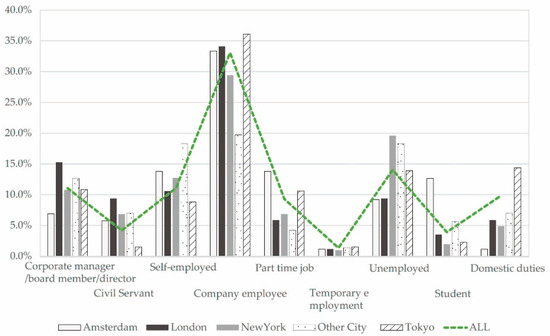
Figure 4.
Occupations of research subjects.
Of the 741 persons who participated in the survey, 417 were male (56.3%) and 324 were female (43.7%). Age ranged from 35 to 64 years (49.10 ± 14.48 years). The number of participants in each city was as follows: 87 participants in Amsterdam (11.7%), 85 participants in London (11.5%), 102 participants in New York (13.8%), 71 participants in other cities (9.6%) and 396 participants in Tokyo (53.4%). Overall, 503 people (68.0%) lived alone, while 238 (32.0%) lived with their family or others. The occupations of participants were as follows: corporate manager/board member/director (1), 82 (11.1%); civil servant (2), 31 (4.2%); self-employed (3), 82 (11.1%); company employee (4), 245 (33.1%), part-time employment (5), 69 (9.3%), temporary employment (6), 10 (1.3%), unemployed (7), 104 (14.0%), student (8), 29 (3.9%); and domestic duties (9), 73 (9.9%). The type of current residence was as follows: detached house, 238 (33.7%); low-rise apartment (1st–3rd floor), 174 (24.6%); middle-rise apartment (4th–10th floor); 187 (26.4%); and high-rise apartment (≥10th floor), 108 (15.3%). Private car ownership was as follows: yes, 388 (52.4%); no, 353 (47.6%).
3.2. Comparison of the Average Scores of Changes in Stress, Vigor, and Health Related Issues
The 741 valid responses (802 people answered the web questionnaire) showed a mean stress average score of 3.25 ± 0.65. Compared to the situation before the first COVID-19 outbreak, stress was increased in 542 residents (73.1% of respondents), unchanged in 44 residents (5.9% of respondents), and decreased in 155 residents (20.9% of respondents). The average stress changes in these three subgroups were as follows: The average of the group with increased stress was 3.519 ± 0.439; the average of the group with no change was 3 ± 0; and the average of the group with decreased stress was 2.394 ± 0.586.
3.3. Correlations among Scores of Stress, Vigor, and Health Related Issues
Pearson correlation analysis showed that the mean stress scores were significantly correlated with the mean scores on vigor and health related issues (r = −0.483 and 0.766, respectively). The correlation analysis found a strong negative correlation between changes in the scores of stress and vigor, and a strong positive correlation between changes in the scores on stress and health related issues. Since the change in stress scores were the objective variable in this analysis, we removed vigor and health related scores as explanatory variables from multiple regression analysis to eliminate the issue of collinearity.
3.4. Correlation Analysis of Stress Change and All Explanatory Variables
Table 2 presents the results of the correlation analysis between the objective variable, average stress change, and the data of the 36 explanatory variables. The explanatory variables in bold are the ones with statistically significant correlations (Table 2). The explanatory variables with the largest correlation coefficients were (1) satisfaction with work (including housework and study), (2) satisfaction with family life, (3) number of times to go out and exercise (e.g., walking, jogging) in a week during the first COVID-19 outbreak, and (4) number of times to go out (e.g., shopping, dinner) in a week during the first COVID-19 outbreak. In addition, there was a significant correlation between the stress change and gender (i.e., women were more stressed). It should be noted that the increase of stress scores was larger among respondents in New York and less in Tokyo, both with statistical significance.
Table 2.
Correlation analysis of the stress change and all explanatory variables.
3.5. Differences in Average Stress Change Scores for Each Response Categories of Explanatory Variables
Table 3 indicates a comparison of the stress change for each significant explanatory variables presented in Table 2, obtained by dividing the explanatory variables into detailed response categories. The explanatory variables in bold had statistically significant differences in the stress scores (Table 3). For satisfaction with work (including housework and study), which was the most strongly correlated variable with the objective variable, the more dissatisfied the respondents were, the more stress they experienced compared to the situation before the first COVID-19 outbreak: satisfied (1): 2.96 ± 0.83; not satisfied at all (4): 3.54 ± 0.73. For satisfaction with family life, which was the second most strongly correlated variable with the objective variable, the more dissatisfied the respondents were, the more stress they experienced compared to the situation before the outbreak: satisfied (1): 3.01 ± 0.71, not satisfied at all (4): 3.66 ± 0.67.
Table 3.
Stress change for each significant explanatory variable.
3.6. Multiple-Factor Analysis of the Stress Change Scores
Multiple regression analysis was conducted to select explanatory variables by forward–backward stepwise regression to develop a significant model. The explanatory variables in bold indicates the variables with statistically significant changes in stress scores (Table 4). The mean stress change score was used as a dependent variable, and a single-factor analysis of stress utilized 16 significant questions (bold variables in Table 2 and Table 3) as independent variables for multiple linear regression analysis. Those who live in a place different from their hometown were more likely to experience increased stress than those who live in a city where they were born. It was found that the increase in stress scores was greater for those who were more dissatisfied with work (including housework and study) and family life. In addition, “I live alone by myself (Yes = 1, No = 0)” and “The number of times per week you went out of your house for exercise (walking, jogging, etc.) (during the COVID-19 outbreak)” were chosen as the significant factors for the decrease in stress. People who lived alone and those who exercised outside (walking or jogging) during the first outbreak tended to show reduced stress. These lifestyle and outside activities were more statistically significant factors than income changes, gender.
Table 4.
Multiple-factor analysis of the stress change in the first COVID-19 outbreak.
This model can explain 16.8% of the stress change, as shown in Table 4.
4. Discussion
The aim of this paper was to identify the common factors that contribute to the stress change particularly observed in large cities around the world. We identified 16 statistically significant variables out of 36 explanatory variables, which explains the change of stress levels compared to the pre-outbreak period in a population with diverse groups of people. We developed an explanatory model for increase and decrease in stress using significant variables. Our results unexpectedly indicated that the following two variables were not significant: whether or not the residents are from Tokyo, which has the largest sample size (i.e., 1 = Resident of Tokyo, 0 = Resident of other cities), “status of income compared to the situation before the COVID-19 lockdown (self-restraint)” (i.e., Largely increased = 1, No difference = 3, Largely decreased = 5). Similar to our previous study [46], one of the major contributors to increased stress under COVID-19 restrictions in the four cities appeared to be the dissatisfaction with family life or jobs. Moreover, our findings highlighted the following new significant variables from the data in four global cities: “whether or not the current place of residence is one’s home town”, “I live alone by myself (Yes = 1, No = 0)”, “The number of times per week you went out of your house for exercise (walking, jogging, etc.) (during the COVID-19 outbreak)”, “Age”, and “To what extent have your daily activities changed compared to before the COVID-19 outbreak”.
If population size or population density had strong influence on stress levels, we can presume that whether or not the respondent is from Amsterdam with the lowest population and population density would significantly affect stress levels. In addition, based on the multiple regression model of stress change, although not selected as a significant variable, respondents in New York tended to have significantly higher levels of stress change than the rest of the cities, while respondents in Tokyo tended to have significantly lower levels of stress change than the rest. Despite the fact that Tokyo has the largest population and that New York has the highest population density among the four cities, the correlations between the two variables and stress change had the opposite relationships. Thus, we can presume that the number of infected people and difference in the severity of restrictions may have stronger impacts on the stress changes of the world’s urban residents than population or population density of each city.
Existing literature with a focus on stress change, like this article, has been targeting certain groups of people, including people with mental disorders, children with cancer and their caregivers [51,52]. In [51], the authors reported an increase in stress after the COVID-19 outbreak compared to the situation before, while less additional stress was confirmed by the outbreak in study [52]. Another research surveyed a relatively large sample of 445 subjects, in which they compared the stress under the initial lockdown period and the situation after the lockdown [53]. According to this study, depressions were found to be not resolved even after few weeks after the initial lockdown was finished. Thus, there have been few studies focusing on stress change comparing before and after the outbreak of COVID-19 like this article, which targeted a wide range of population with diverse social attributes.
One GIS analysis revealed that walkability within urban blocks (calculated from population density, intersection density, block length, access to various amenities, etc.) can be effective in preventing the spread of COVID-19 in New York during the first outbreak [65]. Moreover, a 5 year’s follow-up study of 200 elderly people in Japan showed that the Hospital Anxiety and Depression Scales (HADS) of the elderly people who took part in physical activities such as walking were significantly better than that of those who did not take part in such activities [66].
Our study results highlight that frequency of walking or jogging was one of the common factors that alleviate stress even under the sudden epidemic disaster in the world’s largest cities. In particular, as the people who moved into cities from their home towns appeared to have higher stress scores, walking or jogging outside of their houses would be an effective measure to alleviate stress. Further, we suggest that walking or jogging in small number of people can improve the relationships among friends or family members, which are also the major causes of stress.
This study has several limitations. First, the scores for stress, vigor, and health related issues were not absolute values, since these were respondents’ self-scores. Another issue found was that the explanatory model only made small contributions to the increase or decrease of stress levels. This may be because the mean levels of vigor and health related issues were not included as explanatory variables; these were highly correlated with mean levels of stress (objective variables). We recommend that future research involve analyses using objective measures with holistic scores of stress, vigor, and health related issues. Variables such as the frequency of going out before and during the outbreak (e.g., exercise, shopping) and the decrease rate in the range of activities under the lockdown period compared to the situation before the outbreak are considered as the indicators for resilient behaviors that may have contributed to changes in stress scores. The final significant explanatory variable of the multiple regression model also shows that the greater the reduction in the range of activities during the lockdown, the more stress the person is receiving. This variable can be considered as one of the indicators for resilient behaviors. In addition, there is a need for further research on indicators such as Adolescent Resilience Scale (ARS) [67].
About half of the sampled data were obtained from Tokyo. However, in the analysis of the multiple regression model, Tokyo’s dummy variable (1 = respondents from Tokyo, 0 = respondents from other cities) were not selected as a significant variable. Similarly, dummy variable of New York and the other two cities were also not significant in the multiple regression model of stress change. Therefore, according to this model, we argue that neither sample size nor the population density of each city had statistically significant impacts. However, we suggest that future research should consider conducting principal component analysis (PCA) to highlight and compare the regional characteristics.
5. Conclusions
To conclude, we have identified 16 statistically significant variables out of 36 explanatory variables, explaining the stress changes compared to the pre-outbreak period with diverse groups of people. Contrary to our expectations, respondents’ place of residence and “status of income compared to the situation before the COVID-19 lockdown (self-restraint)” were found to be non-significant variables. On the other hand, our results revealed that dissatisfaction with family life or jobs were the major contributors of stress change under the COVID-19 outbreak, which seemed to be similar with our previous study [46]. Further, variables such as “whether or not the current place of residence is one’s home town”, “I live alone by myself”, “The number of times per week you went out of your house for exercise (walking, jogging, etc.) (during the COVID-19 outbreak)” appeared to be the significant variables that affected stress changes. We believe that our findings can contribute to explore how we can alleviate stress levels in urban areas under the prolonged, unprecedented pandemic.
Author Contributions
M.U. conducted the literature review and conceived the study. K.K. and M.U. built the data extraction file, while K.K. performed data extraction. M.F. and M.U. analyzed the data. M.U. supervised the process. Y.H. found and decided the company that is capable of conducting the questionnaire survey equivalent to the one implemented in Japan. Y.A. developed the English version of the web questionnaire and contributed to review relevant literature. All authors contributed extensively to this work, interpreted the data, contributed substantially to the writing and revision of the manuscript, and read and approved the final version of the manuscript. All authors have read and agreed to the published version of the manuscript.
Funding
This work was supported by funds from the Special Project of Shinshu University Research Center of the Social System and discretionary research expenses of the Dean of the Faculty of Agriculture.
Institutional Review Board Statement
The study was conducted according to the guidelines of the Declaration of Helsinki, and approved by the Human Ethics Sub-Committee of Faculty of Economics and Law, Shinshu university, date of approval; 10 June 2021.
Informed Consent Statement
Informed consent was obtained from all subjects involved in the study.
Data Availability Statement
The data are not publicly available due to this data was obtained under conditions that are not intended to be published.
Acknowledgments
The authors thank all the survey respondents for their participation in the study. We also thank Shotaro Maruhashi for his dedicated support.
Conflicts of Interest
The authors declare no conflict of interest.
Appendix A
The objective variable in this paper used the mean value of the following answer score of Questions 4–18: change in the average stress scores (compared to the pre-outbreak one).
The answers were selected from the following five levels: (1) Much less than before, (2) Less than before, (3) No difference, (4) More than before, (5) Much more than before.
1. I feel active, 2. I’m full of energy, 3. I feel lively, 4. I feel angry, 5. I’m frustrated, 6. I feel grumpy, 7. I feel very tired, 8. I’m fatigued, 9. I feel heavy, 10. I’m nervous, 11. I feel uneasy, 12. I feel gloomy, 13. It’s a pain doing anything, 14. I can’t concentrate, 15. I don’t feel well, 16. I can’t concentrate on my work, 17. I feel sad, 18. I feel dizzy, 19. I have pain in my joints, 20. My back hurts, 21. My eyes are tired, 22. I feel a pounding/I have shortness of breath, 23. I have a bad gastrointestinal condition, 24. I have no appetite, 25. I have constipation or diarrhea, 26. I don’t sleep well.
References
- Coronavirus (COVID-19) Tokyo, Google News. Available online: https://news.google.com/covid19/map?hl=en-US&gl=US&ceid=US%3Aen&mid=%2Fm%2F07dfk (accessed on 12 March 2021).
- Coronavirus (COVID-19) New York City, Google News. Available online: https://news.google.com/covid19/map?hl=en-US&gl=US&ceid=US%3Aen&mid=%2Fm%2F02_286 (accessed on 12 March 2021).
- Amsterdam COVID-19 Cases, Deaths, and Recovered, Corona Locator Netherlands. Available online: https://www.fast-trackcities.org/cities/amsterdam-covid (accessed on 12 March 2021).
- COVID-19 Daily Deaths, National Health Service England. Available online: https://www.england.nhs.uk/statistics/statistical-work-areas/covid-19-daily-deaths/ (accessed on 12 March 2021).
- Kissler, S.M.; Tedijanto, C.; Goldstein, E.; Grad, Y.H.; Lipsitch, M. Projecting the transmission dynamics of SARS-CoV-2 through the postpandemic period. Science 2020, 368, 860–868. [Google Scholar] [CrossRef] [PubMed]
- Coping with Stress, U.S. Department of Health & Human Services. Available online: https://www.cdc.gov/coronavirus/2019-ncov/daily-life-coping/managing-stress-anxiety.html (accessed on 14 May 2021).
- A New Covid-19 Crisis: Domestic Abuse Rises Worldwide, The New York Times. Available online: https://www.nytimes.com/2020/04/06/world/coronavirus-domestic-violence.html (accessed on 14 May 2021).
- Zhi, X.; Lu, L.; Pu, Y.; Meng, A.; Zhao, Y.; Cheng, F.; Jiang, J.; Xu, J.L.; Zeng, Y. Investigation and analysis of psychological stress and professional identity of nursing students during COVID-19 pandemic. IJEB 2020, 58, 426–432. [Google Scholar]
- Mo, Y.; Deng, L.; Zhang, L.; Lang, Q.; Liao, C.; Wang, N.; Qin, M.; Huang, H. Work stress among Chinese nurses to support Wuhan in fighting against COVID-19 epidemic. J. Nurs. Manag. 2020, 28, 1002–1009. [Google Scholar] [CrossRef] [PubMed]
- Lai, J.; Ma, S.; Wang, Y.; Cai, Z.; Hu, J.; Wei, N.; Wu, J.; Du, H.; Chen, T.; Li, R.; et al. Factors associated with mental health outcomes among health care workers exposed to coronavirus disease 2019. JAMA Netw. Open 2020, 3, e203976. [Google Scholar] [CrossRef] [PubMed]
- Xiao, S.; Luo, D.; Xiao, Y. Survivors of COVID-19 are at high risk of posttraumatic stress disorder. Glob. Health Res. Policy 2020, 5, 1–3. [Google Scholar] [CrossRef] [PubMed]
- Wang, C.; Zhao, H. The impact of COVID-19 on anxiety in Chinese university students. Front. Psychol. 2020, 11, 1168. [Google Scholar] [CrossRef] [PubMed]
- Yuan, S.; Liao, Z.; Huang, H.; Jiang, B.; Zhang, X.; Wang, Y.; Zhao, M. Comparison of the indicators of psychological stress in the population of Hubei Province and non-endemic provinces in China during two weeks during the coronavirus disease 2019 (COVID-19) Outbreak in February 2020. Med. Sci. Monit. 2020, 26, e923767. [Google Scholar] [CrossRef]
- Baxter, D.; Casady, C.B. A coronavirus (COVID-19) triage framework for (sub)national public–private partnership (PPP) programs. Sustainability 2020, 12, 5253. [Google Scholar] [CrossRef]
- Cirrincione, L.; Plescia, F.; Ledda, C.; Rapisarda, V.; Martorana, D.; Moldovan, R.E.; Theodoridou, K.; Cannizzaro, E. COVID-19 pandemic: Prevention and protection measures to be adopted at the workplace. Sustainability 2020, 12, 3603. [Google Scholar] [CrossRef]
- Buselli, R.; Baldanzi, S.; Corsi, M.; Chiumiento, M.; Del Lupo, E.; Carmassi, C.; Dell’Osso, L.; Cristaudo, A. Psychological Care of Health Workers during the COVID-19 Outbreak in Italy: Preliminary report of an occupational health department (AOUP) responsible for monitoring hospital staff condition. Sustainability 2020, 12, 5039. [Google Scholar] [CrossRef]
- Vagni, M.; Maiorano, T.; Giostra, V.; Pajardi, D. Hardiness, stress and secondary trauma in Italian healthcare and emergency workers during the COVID-19 pandemic. Sustainability 2020, 12, 5592. [Google Scholar] [CrossRef]
- Obrad, C. Constraints and consequences of online teaching. Sustainability 2020, 12, 6982. [Google Scholar] [CrossRef]
- Capone, V.; Caso, D.; Donizzetti, A.R.; Procentese, F. University student mental well-Being during COVID-19 outbreak: What are the relationships between information seeking, perceived risk and personal resources related to the academic context? Sustainability 2020, 12, 7039. [Google Scholar] [CrossRef]
- Szromek, A.R.; Wolniak, R. Job satisfaction and problems among academic staff in higher education. Sustainability 2020, 12, 4865. [Google Scholar] [CrossRef]
- Espino-Díaz, L.; Fernandez-Caminero, G.; Hernandez-Lloret, C.M.; Gonzalez-Gonzalez, H.; Alvarez-Castillo, J.L. Analyzing the impact of COVID-19 on education professionals. Toward a paradigm shift: ICT and Neuroeducation as a Binomial of Action. Sustainability 2020, 12, 5646. [Google Scholar] [CrossRef]
- Molino, M.; Ingusci, E.; Signore, F.; Manuti, A.; Giancaspro, M.L.; Russo, V.; Zito, M.; Cortese, C.G. Wellbeing costs of technology use during Covid-19 remote working: An Investigation using the Italian translation of the technostress creators scale. Sustainability 2020, 12, 5911. [Google Scholar] [CrossRef]
- Shiwaku, H.; Doi, S.; Miyajima, M.; Matsumoto, Y.; Fujino, J.; Hirai, N.; Jitoku, D.; Takagi, S.; Tamura, T.; Maruo, T.; et al. Novel brief screening scale, Tokyo Metropolitan Distress Scale for Pandemic (TMDP), for assessing mental and social stress of medical personnel in COVID-19 pandemic. Psychiatry Clin. Neurosci. 2020, 75, 24–25. [Google Scholar] [CrossRef]
- Grover, R.; Dua, P.; Juneja, S.; Chauhan, L.; Agarwal, P.; Khurana, A. “Depression, anxiety and stress” in a cohort of registered practicing ophthalmic surgeons, post lockdown during COVID-19 pandemic in India. Ophthalmic Epidemiol. 2020, 1–8. [Google Scholar] [CrossRef]
- Mo, Y.; Deng, L.; Zhang, L.; Lang, Q.; Pang, H.; Liao, C.; Wang, N.; Tao, P.; Huang, H. Anxiety of nurses to support Wuhan in fighting against COVID-19 epidemic and its correlation with work stress and social support. J. Clin. Nurs. 2020, 30, 397–405. [Google Scholar] [CrossRef]
- Alan, H.; Bacaksiz, F.E.; Sen, H.T.; Eskici, G.T.; Gumus, E.; Seren, A.K.H. “I’m a hero, but horizontal ellipsis”: An evaluation of depression, anxiety, and stress levels of frontline healthcare professionals during COVID-19 pandemic in Turkey. Persp. Psych. Care 2020. [Google Scholar] [CrossRef] [PubMed]
- Song, M. Psychological stress responses to COVID-19 and adaptive strategies in China. World Dev. 2020, 136, 105107. [Google Scholar] [CrossRef] [PubMed]
- Liao, C.; Guo, L.; Zhang, C.; Zhang, M.; Jiang, W.; Zhong, Y.; Lin, Q.; Liu, Y. Emergency stress management among nurses: A lesson from the COVID-19 outbreak in China-A cross-sectional study. J. Clin. Nurs. 2020, 30, 433–442. [Google Scholar] [CrossRef] [PubMed]
- Murat, M.; Köse, S.; Savaşer, S. Determination of stress, depression and burnout levels of front-line nurses during the COVID-19 pandemic. Int. J. Ment. Health Nurs. 2020. [Google Scholar] [CrossRef]
- Miller, J.J.; Cooley, M.E.; Mihalec-Adkins, B.P. Examining the Impact of COVID-19 on Parental Stress: A Study of Foster Parents. Child Adol. Soc. Work 2020, 1–10. [Google Scholar] [CrossRef]
- Xu, Y.; Wu, Q.; Jedwab, M.; Levkoff, S.E. Understanding the relationships between parenting stress and mental health with grandparent kinship caregivers’ risky parenting behaviors in the time of COVID-19. J. Fam. Violence 2020, 1–13. [Google Scholar] [CrossRef]
- Cusinato, M.; Iannattone, S.; Spoto, A.; Poli, M.; Moretti, C.; Gatta, M.; Miscioscia, M. Stress, resilience, and well-being in Italian children and their parents during the COVID-19 pandemic. Int. J. Environ. Res. Public Health 2020, 17, 8297. [Google Scholar] [CrossRef] [PubMed]
- Abdoli, A. The COVID-19 stress may influence on the sex ratio at birth. J. Matern. Fetal Neonatal Med. 2020, 1–6. [Google Scholar] [CrossRef] [PubMed]
- Medina-Jimenez, V.; Bermudez-Rojas, M.D.L.L.; Murillo-Bargas, H.; Rivera-Camarillo, A.C.; Muñoz-Acosta, J.; Ramirez-Abarca, T.G.; Esparza-Valencia, D.M.; Angeles-Torres, A.C.; Lara-Avila, L.; Hernandez-Muñoz, V.A.; et al. The impact of the COVID-19 pandemic on depression and stress levels in pregnant women: A national survey during the COVID-19 pandemic in Mexico. J. Matern. Fetal Neonatal Med. 2020, 1–3. [Google Scholar] [CrossRef] [PubMed]
- Rodríguez-Hidalgo, A.J.; Pantaleón, Y.; Dios, I.; Falla, D. Fear of COVID-19, Stress, and anxiety in university undergraduate students: A predictive model for depression. Front. Psychol. 2020, 11, 3041. [Google Scholar] [CrossRef] [PubMed]
- Jiang, D. Perceived stress and daily well-being during the COVID-19 outbreak: The moderating role of age. Front. Psychol. 2020, 11. [Google Scholar] [CrossRef] [PubMed]
- Procentese, F.; Capone, V.; Caso, D.; Donizzetti, A.R.; Gatti, F. Academic community in the face of emergency situations: Sense of responsible togetherness and sense of belonging as protective factors against academic stress during COVID-19 Outbreak. Sustainability 2020, 12, 9718. [Google Scholar] [CrossRef]
- Ballivian, J.; Alcaide, M.L.; Cecchini, D.; Jones, D.L.; Abbamonte, J.M.; Cassetti, I. Impact of COVID–19-related stress and lockdown on mental health among people living with HIV in Argentina. J. Acquir. Immune Defic. Syndr. 2020, 85, 475–482. [Google Scholar] [CrossRef] [PubMed]
- Rosengard, J.L.; Donato, J.; Ferastraoaru, V.; Zhao, D.; Molinero, I.; Boro, A.; Gursky, J.; Correa, D.J.; Galanopoulou, A.S.; Hung, C.; et al. Seizure control, stress, and access to care during the COVID-19 pandemic in New York City: The patient perspective. Epilepsia 2020. [Google Scholar] [CrossRef]
- Lahav, Y. Psychological distress related to COVID-19–the contribution of continuous traumatic stress. J. Affect. Disord. 2020, 277, 129–137. [Google Scholar] [CrossRef] [PubMed]
- Mazza, M.; Attanasio, M.; Pino, M.C.; Masedu, F.; Tiberti, S.; Sarlo, M.; Valenti, M. Moral decision-making, stress, and social cognition in frontline workers vs. population groups during the COVID-19 pandemic: An explorative study. Front. Psychol. 2020, 11, 3228. [Google Scholar] [CrossRef] [PubMed]
- Dahmen, J.; Bäker, L.; Breuer, F.; Homrighausen, K.; Pommerenke, C.; Stiepak, J.K.; Poloczek, S. COVID-19 Stress test for ensuring emergency healthcare: Strategy and response of emergency medical services in Berlin. Anaesthesist 2020. [Google Scholar] [CrossRef]
- Silva, L.R.B.; Seguro, C.S.; De Oliveira, C.G.A.; Santos, P.O.S.; Oliveira, J.C.M.; Souza Filho, L.F.M.; de Paula Júnior, C.A.; Gentil, P.; Rebelo, A.C.S. Physical inactivity is associated with increased levels of anxiety, depression and stress in Brazilians during the COVID-19 pandemic: A cross-sectional study. Front. Psychiatry 2020, 11, 1257. [Google Scholar] [CrossRef]
- Jiang, W.; Ren, Z.; Yu, L.; Tan, Y.; Shi, C. A network analysis of post-traumatic stress disorder symptoms and correlates during the CoViD-19 pandemic. Front. Psychiatry 2020, 11, 568037. [Google Scholar] [CrossRef] [PubMed]
- Ferreira, R.J.; Cannon, C.; Buttell, F. COVID-19: Immediate predictors of individual resilience. Sustainability 2020, 12, 6495. [Google Scholar] [CrossRef]
- Uehara, M.; Fujii, M.; Kobayashi, K. A model of stress change under the first COVID-19 pandemic among the general public in Japanese major cities and rural areas. Sustainability 2021, 13, 1207. [Google Scholar] [CrossRef]
- Pumberger, M.; Schömig, F.; Haffer, H.; Mehl, J.; Duda, G.N. Stress test: Translational research during COVID-19 pandemic. J. Cachexia Sarcopenia Muscle 2020, 11, 1385–1387. [Google Scholar] [CrossRef] [PubMed]
- Bodecka, M.; Nowakowska, I.; Zajenkowska, A.; Rajchert, J.; Kaźmierczak, I.; Jelonkiewicz, I. Gender as a moderator between Present-Hedonistic time perspective and depressive symptoms or stress during COVID-19 lock-down. Personal. Individ. Differ. 2020, 168, 110395. [Google Scholar] [CrossRef] [PubMed]
- Boyraz, G.; Legros, D.N.; Tigershtrom, A. COVID-19 and traumatic stress: The role of perceived vulnerability, COVID-19-related worries, and social isolation. J. Anxiety Disord. 2020, 76, 102307. [Google Scholar] [CrossRef] [PubMed]
- Liu, S.; Lithopoulos, A.; Zhang, C.Q.; Garcia-Barrera, M.A.; Rhodes, R.E. Personality and perceived stress during COVID-19 pandemic: Testing the mediating role of perceived threat and efficacy. Personal. Individ. Differ. 2020, 168, 110351. [Google Scholar] [CrossRef] [PubMed]
- Quittkat, H.L.; Düsing, R.; Holtmann, F.-J.; Buhlmann, U.; Svaldi, J.; Vocks, S. Perceived impact of Covid-19 across different mental disorders: A study on disorder-specific symptoms, psychosocial stress and behavior. Front. Psychol. 2020, 11, 586246. [Google Scholar] [CrossRef]
- Van Gorp, M.; Maurice-Stam, H.; Teunissen, L.C.; van de Peppel–van der Meer, W.; Huussen, M.; Schouten-van Meeteren, A.Y.; Grootenhuis, M.A. No increase in psychosocial stress of Dutch children with cancer and their caregivers during the first months of the COVID-19 pandemic. Pediatric Blood Cancer 2020, 68, e28827. [Google Scholar] [PubMed]
- Probst, T.; Budimir, S.; Pieh, C. Depression in and after COVID-19 lockdown in Austria and the role of stress and loneliness in lockdown: A longitudinal study. J. Affect. Disord. 2020, 277, 962–963. [Google Scholar] [CrossRef]
- World City Populations 2021. Available online: https://worldpopulationreview.com/world-cities (accessed on 19 March 2021).
- Coronavirus (COVID-19), City of Amsterdam. Available online: https://www.amsterdam.nl/en/coronavirus/covid19/ (accessed on 19 March 2021).
- Coronavirus (COVID-19) National Lockdown: Stay at Home. Available online: https://www.bromley.gov.uk/info/200154/coronavirus_covid%E2%80%9119/1461/coronavirus_covid-19_national_lockdown_stay_at_home (accessed on 19 March 2021).
- The Health Protection (Coronavirus, Restrictions) (England) Regulations 2020. Available online: https://en.wikipedia.org/wiki/The_Health_Protection_(Coronavirus,_Restrictions)_(England)_Regulations_2020 (accessed on 19 March 2021).
- A Timeline of UK Lockdown Measures Since the Pandemic Began. Available online: https://www.expressandstar.com/news/uk-news/2021/01/04/a-timeline-of-uk-lockdown-measures-since-the-pandemic-began/ (accessed on 19 March 2021).
- State of Emergency Declared to Prevent Spread of the Novel Coronavirus. Available online: https://corona.go.jp/en/ (accessed on 19 March 2021).
- Abe Declares Coronavirus Emergency over in Japan. Available online: https://english.kyodonews.net/news/2020/05/a1f00cf165ae-japan-poised-to-end-state-of-emergency-over-coronavirus-crisis.html (accessed on 19 March 2021).
- COVID-19 Pandemic in New York City. Available online: https://en.wikipedia.org/wiki/COVID-19_pandemic_in_New_York_City#Stay-at-home_order (accessed on 19 March 2021).
- A Historical Timeline of COVID-19 in New York City. Available online: https://www.investopedia.com/historical-timeline-of-covid-19-in-new-york-city-5071986 (accessed on 19 March 2021).
- What’s Closed? What’s Mandatory? How Tri-State COVID-19 Action Affects Daily Life. Available online: https://www.nbcnewyork.com/news/coronavirus/everything-tri-state-gov-officials-are-doing-to-control-spread-and-ease-concerns-of-covid-19/2314762/ (accessed on 19 March 2021).
- Hardt, J. A new questionnaire for measuring quality of life—the Stark QoL. Health Qual. Life Outcomes 2015, 13, 174. [Google Scholar] [CrossRef]
- Inada, S.; Yoshiuchi, K.; Park, S.; Aoyagi, Y. Trajectories of objectively measured physical activity and mood states in older Japanese adults: Longitudinal data from the Nakanojo Study. Biopsychosoc. Med. 2021, 15, 1–6. [Google Scholar] [CrossRef] [PubMed]
- Oishi, S.; Cha, Y.J.; Schimmack, U. The Social Ecology of COVID-19 Cases and Deaths in New York City: The Role of Walkability, Wealth, and Race. Soc. Psychol. Personal. Sci. 2021. [Google Scholar] [CrossRef]
- Nakaya, M.; Oshio, A.; Kaneko, H. Correlations for Adolescent Resilience Scale with Big Five Personality traits. Psychol. Rep. 2006, 98, 927–930. [Google Scholar] [CrossRef] [PubMed]


Publisher’s Note: MDPI stays neutral with regard to jurisdictional claims in published maps and institutional affiliations. |
© 2021 by the authors. Licensee MDPI, Basel, Switzerland. This article is an open access article distributed under the terms and conditions of the Creative Commons Attribution (CC BY) license (https://creativecommons.org/licenses/by/4.0/).