Abstract
In Amazonian Ecuador, land-use change from tropical rainforest to different productive purposes is leading to irreversible situations from an environmental perspective. The objective of this paper was to highlight the significance of the biological components in the soils in Amazonian Ecuador, and the importance of considering biological soil quality indexes when assessing environmental impacts in the soils of tropical Pan-Amazonian areas. Since the literature on the subject is dispersed and inaccessible, a bibliographic review was conducted, with the aim of compiling protocols and proposals for practical utilization. We compiled tables, including specific indicators from the biological point of view. We present the available methods for assessing the sustainability of Amazonian territories through the analysis of soil quality. Our contribution facilitates an edaphic perspective to be taken into account in decision-making processes for sustainable territorial development.
1. Introduction
In territorial development planning processes, decision-making is an important point to consider, especially in areas where irreversible situations are occurring, as is the case of land-use change from tropical rainforest to different productive purposes in Amazonian Ecuador. Soil is an irreplaceable natural resource, with complex and sensitive functionality; living beings in soil play a fundamental role as indicators of soil status or disturbance. The objective of this paper is to highlight the significance of the biological components in the soils in Amazonian Ecuador, and the importance of considering biological soil quality indexes when assessing environmental impacts in the soils of tropical Pan-Amazonian areas. Since literature on the subject is dispersed and inaccessible, it was decided to address this bibliographic review with the aim of compiling protocols and proposals for practical utilization.
2. Methodology
For the purpose of this paper, bibliographic research was carried out using online databases retrieved from the Library Service of the University of Extremadura (Spain). The most commonly consulted scientific databases were: Web of Science, Scopus, Google Scholar, Science Direct, Dialnet, Cyberthesis, and Mendeley. All searches were carried out between September 2019 and January 2020. There was no exclusion of any time period in the search and no language restrictions were applied. The keywords used were “biological indicators” and “soils”, “soil quality”, “tropical soil”, “sustainability” and “soil”, “soil biolog*”. Articles before 1999 were only considered if there were no related papers published after the date. Studies that assessed biological soil quality were included, as well as studies on the sustainability of the Amazon region of Ecuador, regarding the proper use of land and the development of sustainable production systems. A critical reading of full texts and/or complete abstract was made in order to select the most valuable information; part of this appears in the tables and groupings according to the focus of the research. Finally, a synthesis document was elaborated, which was structured as shown in Figure 1.
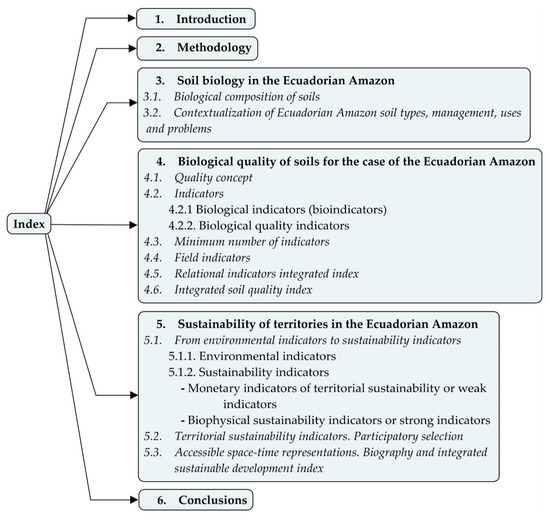
Figure 1.
Structural index of this review.
3. Soil Biology in the Ecuadorian Amazon
3.1. Biological Composition of Soils
Soil is a dynamic and non-renewable live system whose condition and operation are crucial for food production and the preservation of environmental quality, and it is a key element to assess sustainability [1,2,3]. From the biological perspective, soil is a habitat where a large number of organisms reside, grouping in communities of fauna, bacteria, fungi, and algae, which interact with each other, performing important functions [4]. The fauna of the soil includes a variety of organisms of different species and sizes—the most diverse group being arthropods [5]. Depending on their diameter or length, they are usually classified as macrofauna, > 2 mm; mesofauna, 0.1–2 mm; and microfauna, < 0.1 mm [4,5,6,7]. The invertebrates that make up the macrofauna participate as engineers in the formation of the different properties of the soil, in the crushing of plant matter, and some as predators [8]. The abundance, composition, and diversity vary from one land use to another [6]. They depend on soil management [9]. The organisms that make up the mesofauna are called microengineers. They improve the physical properties of the soil and break down organic matter (OM) on a small scale [10]. They participate in the formation of edaphic microstructures as catalysts of microbial activity [7]. Invertebrates are the most abundant component of microfauna, with a high species richness. They are considered the most important predators of bacteria and fungi [4,10].
All of them constitute the soil biota that is summarized in Table 1, which shows a classification according to the size of the main groups and the main functions that they are known to carry out in the soil.

Table 1.
Organisms that constitute the soil biota and their main functions. Source: own elaboration based on [4,6,7].
3.2. Contextualization of Ecuadorian Amazon Soil Types, Management, Uses, and Problems
The Ecuadorian Amazon constitutes 45% of the National territory, occupying 115,613 km2, extending from the Andean mountain foothills, with the appearance of transitional forests at 1300 m.a.s.l., to the east of the Amazonian plain, forming less than 2% of the Amazon River basin. The average rainfall fluctuates between 2000 and 5000 mm annually, with a temperature of 24 °C during the year, which constitutes a warm damp climate [27,28].
The Ecuadorian Amazon has been referred to as “the most important source of fresh water and biodiversity” for its global climate regulatory function as a greenhouse gas sink [29]. It is made up of six provinces: Sucumbíos, Orellana, Napo, Pastaza, Morona Santiago, and Zamora Chinchipe (Figure 2), which have a variety of soil types, from the Andes to soil derived from volcanic ash with specific characteristics [27,30,31]. Due to the geological and influence of meteorological factors, poorly developed soils appear with acidic pH, that are susceptible to erosion due to high rainfall, low fertility and nutrient availability, the presence of toxic aluminum for plants, and high moisture retention [27,31,32].
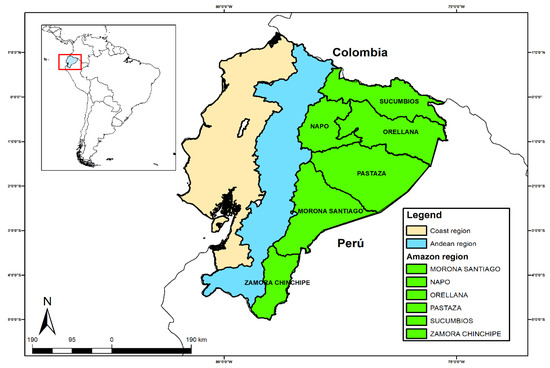
Figure 2.
Political map of the Amazon region of Ecuador.
According to the American Soil Taxonomy (USDA) system, the soils present in the Ecuadorian Amazon belong to the typological units that are collected in Table 2, prepared from information compiled by the SIGAGRO (Geographic and Agricultural Information System) of the Ministry of Agriculture Livestock Aquaculture and Fisheries of Ecuador [31,32,33]. The most representative soils of the Amazon territory are those of order inceptisol, entisol, histosol, and mollisol [34,35].
Table 2.
Taxonomic classification of soils in the Ecuadorian Amazon, based on [31,32,33].
Due to the biological richness and endemism of the Ecuadorian Amazon, it is one of the largest ecological reserves, with a high potential to provide ecosystem services to local populations. Being subject to high rates of deforestation and changes in use affects the biodiversity, soil, and water, as basic components of an ecosystem, causing the decrease or loss of possible ecosystem goods and services [29,36].
In tropical regions, the change from forests to pastures and agricultural production, on the one hand, leads to losses in terms of fertility, quality, and biodiversity in the soils, and on the other hand, implies the addition of nutrients and amendments to meet the demand for crops; hence, to promote a change in the productive matrix with a sustainable vision, the best strategy is the implementation of agroforestry or silvopastoral systems [2,30,36,37]. This confirms that the Ecuadorian Amazon is not suitable for intensive agricultural activity, but for productive systems similar to the forest [31]. The most common systems are described below.
Silvopastoral systems: Due to the dependence of part of the Amazonian population on livestock activity, it has been necessary to generate production models similar to the forest (silvopastoral systems) [34]. This consists of combining the use of trees, pastures, and animals to increase production, which at the same time brings other benefits, such as wood, biodiversity conservation, carbon fixation, and the protection of water basins and soil [27]. These systems represent a sustainable alternative, which responds satisfactorily to the socio-economic reality of tropical countries, mainly with regard to food demand [38]. In the Ecuadorian Amazon, with colonization, the forests were intervened and used for timber resources, and the establishment of pastures and small orchards [37]. Livestock has turned soils into degraded lands, dependent on mechanization and agrochemicals [35]. Despite this problem, there is an interest in understanding the state of those soils, and implementing strategies or systems compatible with the environment, soil, edaphic life, and livestock farmers [3]. The adoption of silvopastoral systems has increased the biomass in the soil surface, the level of OM in the surface horizon, and thereby the availability and recycling of nutrients, hence improving the soil structural index [1,27,30]. On the other hand, the grass influences the system; for example, long-cycle gramalote grass (Axonopus scoparius) does not affect the soil, but forms associations with short-cycle pastures, such as honey grass (Setaria plendida), Amazonian kikuyo (Brachiaria humidicola), dallis (Brachiaria decumbens), or elephant grass (Pennisetum purpureum), in which they can produce important erosion and soil degradation processes [1].
Crops: In the Ecuadorian Amazon, many agricultural projects have been promoted with African palm, coffee, cacao, rice, and grassland, from which extensive (monoculture) crops have originated that involve the deforestation of large-scale virgin forest. Projects that expanded the agricultural frontier for state support (credits) [34]. Incentives for planting African palm and palmito, mainly, have caused significant losses in biological biodiversity and vegetation, altering the multifunctionality that ecosystems play [7,34]. The management techniques used in monocultures affect the soil community and make them dependent on external inputs [7], without neglecting the deterioration and degradation of soils that are of little interest to large producers, whose only interest lies in the profitability and economic benefits that they can obtain.
On the other hand, there are polycultures or chakras, which have developed Amazonian populations for family subsistence. The chakras are implanted within the forests, occupying small areas, and include some natural plant species. In addition, they open a variety of crops, such as cassava, banana, Chinese potato, naranjilla, sugarcane, as well as fruit trees of chontaduro, guaba, papaya, and wild grapes, naturally [37], without neglecting the variety of medicinal plants. The ideology is to maintain a balance between the chakras and nature without altering the structure, the life that inhabits the area, or the soil.
Agroforestry systems: In Amazonian ecosystems, they fulfil important functions. These systems improve the relationships between the soil, water, and air components of the ecosystem [36,39]. When linking crops, such as cocoa or coffee, the damage caused to the soil is minimal. The constant addition of litter and root development that increase the soil’s OM produces conditions similar to those of a natural forest [1,27]. The similarity of conditions of these systems with forests allows the development of processes, such as recycling, fixation, and mineralization of nutrients [36]. They prevent the implantation of monocultures and the impacts of deforestation. At the same time, they generate other economic inputs for producers, such as wood production, firewood, wild fruits; together with environmental services, such as the reduction of greenhouse gases, carbon sequestration, and protection of natural resources (soil, air, water) [38]. They serve as habitats for plant and animal species, from microorganisms, vertebrates, and amphibians of the soil, to large mammals and birds [37,39].
In Ecuador and tropical regions in general, the conversion of forests to agricultural and livestock systems is the most important reason for land-use change [40]. These changes lead to the alteration and loss of biodiversity, and mainly to deterioration of the soil [27,31].
Forests: The Amazon is characterized by its lush vegetation, and for having soils with a superficial horizon rich in OM. These data led us to mistakenly think that they were fertile lands. After several investigations in deforested areas, it has been proven that Amazonian lands are not very fertile. They become impoverished quickly in the absence of organic remains provided by the vegetation cover [39]. In Amazonian soils, despite the low availability of nutrients, forests have adapted to weathering and washing conditions, capturing the nutrients generated by the decomposition of the OM directly with their surface roots [34].
In Ecuador, oil activity is indirectly responsible for the current state of Amazonian forests [41]. With the appearance of oil companies, agricultural and livestock activities have positioned themselves as being the main and majority use of the Amazon region [37,42]. Currently, institutions and research centers are developing projects aimed at the sustainable use of natural resources [39]. These projects are associated with environmentally friendly management systems and practices that benefit the Amazonian community. In the Ecuadorian Amazon, most forests that are not part of the National System of Protected Areas of Ecuador (SNAP) or some protective forest are degraded either by the selective extraction of species or because they are secondary forests [42].
4. Biological Quality of Soils for the Case of the Ecuadorian Amazon
4.1. Quality Concept
Soil, water, and air quality are the components of environmental quality, but if we focus explicitly on soil resources, the quality is more complex to define due to its variety of components [43], and the enormous amount of interrelationships between its components. Chemical, physical, and biological parameters can be analyzed and integrated to form a soil quality index that allows comparisons between different uses or management practices [44]. Soil quality is usually focused on agricultural production [45], but is also a critical component in the maintenance of sustainability [38], and human and environmental health [44]. A soil’s quality is defined “as its ability to function within an ecosystem; to sustain or improve animal or plant productivity; to maintain and control environmental quality, and to support the habitability and health of man” [46].
The biological component is of great importance in assessing the management of land uses. This allows the implementation of agro-ecological management that favors agricultural production and biodiversity [38]. Some authors consider that for a soil to be considered high quality, it must meet criteria related to respiration, biomass, and its microbial activity [47], which correspond to biological parameters.
From a general point of view, the quality of the soils of the Ecuadorian Amazon is marked by fine clay textures, with good granular structure, on the surface horizon [36]. It has high OM content of low quality, low fertility, and acidic pH that limit the availability of nutrients, such as phosphorus and leaching of changeable bases (potassium, calcium, and magnesium), limiting its use [39,48,49]. A very thin superficial horizon with intense biological activity due to the accumulation of OM, and the presence of humidity, influences biogeochemical behavior [27]: phosphorus deficiency, the presence of sulfur, changeable bases [27,36], and high levels of iron and aluminum fixation [50]. As phosphorus is a critical macronutrient [19], low levels of native phosphorus represent one of the biggest obstacles to food production. In general, the dark colors on the ground are associated with OM and high biological activity [49], and reddish colors are associated with ferric minerals [1,48]; a characteristic behavior of Amazonian soils.
Consequently, when talking about soil quality, the most important thing is to know if the focus is from the point of view of agricultural productivity, or environmental or human health. In addition, the quality can refer to the physical, chemical, or biological components of the soil. It is much more frequent that indicators are considered for the evaluation of the quality of the soil. In the context of the Amazon, biological indicators or bioindicators are very useful.
4.2. Indicators
An indicator is a parameter that allows for the verification of the soil’s situation in relation to its state of conservation, pollution, productivity, or any other characteristic that provides information regarding its current and potential status [9,39,43]. These indicators are classified into four categories: visual, physical, chemical, and biological indicators to assess the quality of a soil [38].
Visual indicators are obtained with field visits, farmers’ perceptions, and local knowledge. These are based on observations and interpretations, such as the exposure of the subsoil, the color of the soil, the presence of gullies and weeds, the flooding, runoff, or poor vegetation development—all of these aspects are indications of alterations in soil quality [43,51,52]. Physical indicators are related to the structure of the soil, as is the case for porosity, bulk density, penetration resistance, water retention capacity, hydraulic conductivity, aggregate size, depth, and texture. These mainly reflect the limitations of root growth, seedling sprouting, infiltration, or movement of water within the soil profile, transfer and cycling of nutrients [38,51]. Chemical indicators include soil–plant properties, such as water quality and the availability of water, and nutrients for plants and microorganisms. Among the most common are pH, electrical conductivity, organic matter content, cation exchange capacity, and nutrients (total N, total phosphorus and potassium) [38,43,50].
Finally, biological indicators are related to the decomposition and incorporation of animal and plant residues in the soil by living organisms, controlling the supply of nutrients and humus to the ecosystem [53]. These indicators are based on soil respiration, microbial biomass, the amount of species and groups of edaphic fauna, as well as tests on enzymatic activities [54]. They act as early (microbiological and biochemical) signals of soil degradation or improvement due to their sensitivity [38,53]. The close relationship of the quality of the soil with the functions developed by the edaphic life has made them valuable indicators of disturbance, based on both their functions and their diversity, density, and abundance [38]. When the indicator is a living being, it is called a biological indicator, or bioindicator.
4.2.1. Biological Indicators (Bioindicators)
An edaphic bioindicator is every living being that responds easily to external (soil) stimuli through changes at the organism level [47]. Bioindicators need to belong to large, diverse taxonomic groups, of wide geographical and ecological distribution [6,27]. They must be easy to handle, visible at any time of the year, with easy reproduction, and be abundant and preferably sedentary. Depending on the presence/absence of changes against these soil variations (stimuli), bioindicators are called sensitive or tolerant [6,12,39].
We present below the most representative organisms of soil biota, considered to be bioindicators, with a special focus on the context of the Ecuadorian Amazon described in Section 3.1. The information and descriptions as functions, characteristics, and functionalities of each group are summarized as Supplementary Material S1. Table 3 shows the applicability of some more representative organisms as edaphic bioindicators, depending on their abundance or absence.
Table 3.
Organisms used as edaphic bioindicators.
4.2.2. Biological Quality Indicators
These are parameters that serve to evaluate processes carried out by living beings in the soil, such as the transfer of nutrients from the soil to the plant, the dissolution of minerals that live in the mother rock, the mineralization of the OM, the stabilization of the soil structure that produces the OM, the cohesion of aggregates, and/or the formation of galleries that aerate and give porosity to the soil. As long as they can be measured, they can provide information on the condition and operation of the soil [38]. Table 4 summarizes the most important indicators, which we describe below.
Table 4.
Biological quality indicators for Amazonian soils.
Organic matter (OM): the availability of OM is one of the main components of the soil. It is directly related to the different properties [36,47], such as the influence of temperature and humidity, which condition the mineralization in the microbial phase of the soil [30].
Organic carbon (OC) largely depends on the availability of OM and land use [3,60]. It is part of the different soil processes and is a source of food for edaphic organisms [3]. In pastures and crops, OC decreases by 65% compared to the forest [60], due to the low production of OM. It is among the five best carbon sinks [47].
Particulate organic matter refers to the youngest and most active portion of the OM. It is a reservoir of nutrients for the flora and fauna of the soil. It acts by increasing water carrying capacity and stabilizing aggregates. An analysis of this parameter allows the prediction of short-term nutrient availability [50,53].
Organic phosphorus is an important macronutrient for the functionality of plants. In tropical areas, availability limits plant growth [19], being one of the most sensitive nutrients in tropical soils [53].
Potentially mineralizable nitrogen is the amount of organic N in the soil that is transformed into soluble inorganic forms, such as NH4+ and NO3−, by microbial action. It is directly associated with the availability of OM and for its sensitivity it is considered as an indicator of nitrogen production or nitrogen contribution of a soil [53].
Microbial biomass (MB) is determined by the quantity and quality of OM that, at the same time, depends on the use of soil. Microbial characteristics are considered quality indicators [62]. Therefore, when MB is high, it indicates microbial diversity and an optimal environment. However, if they are at low levels, it is a sign of some kind of pollution [62] or due to changes in land use [61].
Carbon from microbial biomass (CMB) is related to the addition of OM to the soil. It indicates the biochemical and microbiological activity of soils. When it is high, it is considered an indicator of soil fertility [3]. It provides knowledge on the abundance and population structure of microorganisms, and is obtained from the difference between samples with C extracted and samples without C extracted [62], according to the fumigation-extraction method with chloroform. CMB is considered an indicator of soil quality [47,60].
Nitrogen from the microbial biomass (NMB), as well as CMB, depends on the MB and the amount of available OM [60]. It is obtained from the difference between fumigated (N extracted) and non-fumigated samples [62], according to the method of fumigation-extraction with chloroform. Actual NMB scores, similarly to CMB, are determined by the conversion factor (mineralized fraction for C and N) [61,62], applied to the general formula that determines the MB.
Soil respiration refers to the production of CO2 as a result of microbial activity, roots, and macro and micro fauna. It is measured under anaerobic conditions and provides information on mineralizable substrates [47]. The larger the population, the greater the amount of CO2. It also relates to the size of plant waste, litter, and biota in general [53], considered as an index of biological activity.
Metabolic or microbial ratio is the index of the relationship between growth and state of latency of BM. It measures the microbial change of the soil with respect to environmental limitations due to changes in use. An increase indicates unfavorable conditions for soil microbes (microbial stress) [60,64].
Geometric measurement of enzymatic activity (GMEa) is a common index to integrate data and information from various enzymes [54] and know the meaning of the enzymatic activity of a soil. Some authors [54,60,63] consider it a good index to estimate the quality of the soil. It can be related to physicochemical and biological properties.
Molecular markers—molecular techniques are capable of differentiating fungal microbial biomass, according to primers that are designed from the 16S and 18S rDNA genes [47]. The genomic study of soils from DNA shows the genetic potential to produce certain enzymes, motivating the study of RNA. These techniques show real information on the state of the soil and the environmental conditions to which microorganisms are subjected [47,65]. The genome of bacteria provides signals when there is some kind of impact on the soil. Currently, the determination of indicators of soil quality is based on the DNA and RNA of the species of soil organisms. It has great potential, speed, and provides more informative measurements of biota [43].
Enzymatic activity: Table 5 synthesizes some types of enzymatic activity that can be evaluated in soil samples. Their activity is affected by the change of land use, especially in the surface layer [47]. Low concentrations of enzyme activity indicate inactivity of microorganisms. High concentrations indicate the high decomposition of the OM and microbial activity [62]. In tropical soils, the marked variations are probably due to acidity [3], which are considered land degradation indicators, after deforestation [30,60], specifically, fertility and quality indicators [60,63]. Some research in Amazonian soils considers that enzymatic activity indicates ecological changes resulting from land use [62]. According to [54], these activities (Table 5) are the most sensitive indicators to assess the effects of restoration practices and effects of land use change.
Table 5.
Types of enzymatic activity that can be evaluated in soil samples.
4.3. Minimum Number of Indicators
In many cases, the limiting factor for measuring the soil quality through indicators is the cost, especially if biological parameters are included. Therefore, the total indicators contemplated to analyze the quality of the soil, at the initiative of several researchers, should be reduced to a minimum set of data [43].
The number of selected indicators usually varies between six and eight, and those that show the most relevant variations are chosen [43]. The selection and validation depends on the sensitivity and response to climatic changes, as well as their accessibility (sampling) [58]. The objectives of the investigation are also considered in selecting indicators [43].
The criterion for the selection of biological quality indicators is the score awarded by recognized researchers, frequency of use, reproducibility (essential aspect), and topicality in publications [43]. Under the reference framework set forth in Section 3.2 and Section 4.2, a possible set of indicators applicable to the soil context of the Ecuadorian Amazon is proposed in Table 6.
Table 6.
Example of a minimum number of indicators of soil biological quality. Source: [43].
4.4. Field Indicators
A project at the European level has developed simple and easy-to-use tools for farmers. The GROW Observatory project aims to provide services to citizens and non-profit science [66]. On the one hand, it allows for the measuring of soil parameters at high spatial resolution in large geographic areas. However, it has also opted for visual evaluations of soil in the field, a technique that is being implemented worldwide and is considered sensitive enough to assess the structure of a soil [1]. Most of the methods are based on observations of soil structure, and its relationship with crop productivity [66]. Other authors have affirmed that the visual evaluation of the soil is not sufficient to determine its state, the state of an ecosystem, or the services it provides [43]. They suggest that the indicators be preferably quantitative variables and propose the use of qualitative variables as valid and useful when there is no quantitative information, or when the costs of quantifiable parameters are high [38].
Studies in tropical soils of Venezuela have shown a strong relationship between visual evaluation scores, physical properties, and soil quality indicators measured in the laboratory [1]. Some variables taken into consideration in the visual evaluation are: (a) texture (tape method); (b) structure, by direct macromorphological observation and using a reference table (granular, laminar, or blocose); (c) depth of horizon (measured in the field); (d) color (Munsell table); (e) soil erosion (presence or absence of grooves); (f) slope (clinometer); and (g) height (GPS). Some authors have also proposed texture as an observable parameter in the field [27,67,68]. To understand the variation and to be able to relate the scores of the variables, they adjusted the data to a common numerical scale, facilitating interpretation.
However, the guiding approaches that are still provided by farmers or people who work the land strengthen knowledge through on-site practice (real time) [38]. They have the ability to measure the status of any agency or community. They manage to hold a discussion with researchers, relating practice to theory [43,58]. For example, the health of the soil can be determined from observations in the soil, plants, presence of animals, and water quality, and then related to laboratory analysis.
4.5. Relational Indicators Integrated Index
A correct evaluation of the soils takes into account the behavior and functionality of the organisms that inhabit it. Morphology, seasonality, and degree of sensitivity are also part of the evaluation process [7], showing the state of the soil. Some examples of relational indicators are shown in Table 7; they indicate sensitivity or adaptability depending on their densities.
Table 7.
Examples of relational indicators.
4.6. Integrated Soil Quality Index
The Integrated Soil Quality Index is an integrated index based on a combination of indicators. This index clearly reflects the environmental quality of the soil and facilitates the comparison between different uses and management practices (same or different type of soil). In the countries of the Amazon, such as Brazil, Colombia, and Peru, its potential has been proven. It is obtained from the sum of three subscripts (physical, chemical, biological) of quality [44]. This index is developed in three steps: first, there is the selection of appropriate indicators, based on accessibility, ease of measurement, and sensitivity; second, the selected indicators are scored (more is better, optimal value and less is better); third, the integrated quality index is developed using a linear or additive model, combining the score of the indicators.
According to the attributes of the soil and the score, the indicators are grouped into subscripts of soil quality. In each subscript, the indicators are valued by the number of times each score is reached. The subscripts are divided by the number of indicators they contemplate, to integrate them (sum of subscripts) and normalize the equation of the integrated index [44]. It is important to avoid underestimating soil disciplines.
5. Sustainability of Territories in the Ecuadorian Amazon
In Ecuador, the expansion of the agricultural frontier and deforestation for livestock purposes involves intervention and destruction of natural forests and virgin forests, causing socio-environmental impacts in the Amazon Region, in which 52% of land is forests and 17.5% of the area is used for agricultural activity [69]. With the emergence of livestock as a source of income for the population [37], a variety of perennial and annual pastures have been established as monocultures that are part of livestock systems adapted to the conditions of the region. These affect the Amazonian soils, because more than 50% of the livestock areas are in the process of degradation, with a break in the water balance of the basins and an increase in greenhouse gases [27,69,70]. Similar results have been reported for other tropical regions because of livestock and agricultural intensification [71].
The damage caused to the ground after deforestation varies according to the use that occurs later [27]. Converting deforested spaces into areas of agroforestry arrangement with tree species (coffee, cocoa, rubber) that represent management practices aligned with the potential use of the region means minimal damage to the soil [27,35]. The conditions of a natural forest are reproduced in terms of the interception of the drops, decrease in runoff, litter deposition, and control of the water erosion process. In contrast, the danger of erosion by crops, whether annual or perennial, is very significant at the beginning of the cycle, when the soil is left unprotected from its cover. In this sense, silvopastoral systems play a multifunctional role. Their adoption implies favorable changes in various components and agroecological processes [72]. The coverage offered by tree and litter species can activate soil biology, increase the level of OM, improve fertility and its optimization [35]. In addition, they can reduce soil degradation processes, such as water erosion, compaction, or waterlogging [27].
Based on the aforementioned factors, it is necessary to determine variables that contribute to improving soil quality and avoiding degradation processes from a systematic view, considering the soil resource as a fundamental component of farm-level production [27], with the implementation of sustainable or less aggressive management practices with the environment [47]. In this sense, the need arises to develop indices and indicators that measure, spatially and temporarily, the sustainability of a territory, and through permanent monitoring, encourage adequate and precise management of natural resources [73]. One of the main resources is land, which requires rational management through agricultural policies and practices aimed at forming sustainable agricultural systems [47].
The greater the knowledge of the wealth of resources, cultural diversity, and ecosystems that make up the Amazonian territory, the more the state will be a correct administration [27]. To meet the needs of the current population and improve their quality of life, economic, ecological, and social sustainability are required. Economic sustainability implies taking charge of global costs, such as the reproduction of nature and benefits, including the integral management of ecosystems. Ecological sustainability refers to the use of the natural system in an integral way, within the restrictions and potential of its homeostatic mechanisms. Social sustainability means a social orientation of production that uses and respects the identity of cultures and promotes the broadest participation of society in fundamental development decisions [74].
5.1. From Environmental Indicators to Sustainability Indicators
5.1.1. Environmental Indicators
According to the Organization for Economic Cooperation and Development (OECD), an Environmental Indicator is a variable that has been socially endowed with an added meaning derived from its own scientific configuration, in order to synthetically reflect a social concern, with respect to the environment, and insert it coherently in the decision-making process [75]. Environmental management and investment that is oriented towards the sustainable use, research, conservation, mitigation, and restoration of natural resources involve various topics, such as habits, anthropic modes of production and consumption, demand and use of natural resources, generation and use of solid and liquid waste, use of technologies and types of energy in the production of goods and services, and problems with pollutants that are part of climate change.
In Ecuador, the territorial approach of the current “National Development Plan 2017–2021” has tried to approach the reality of the value of environmental damage and the economy for social and environmental improvement [76]. The plan stipulates that Ecuador will fully assume the protection and guarantee of the rights of nature, responsible management of natural resources, protection of biodiversity and soil, and implementation of responses to climate change, which guarantees the good living of rural communities [76].
However, in the Ecuadorian Amazon, the application of sustainable territorial development policies and strategies has not advanced as expected [27]. The appropriation and mismanagement of natural resources is not the same in all communities, nor is the degree of impact due to environmental impacts; hence, ecological-distributive conflicts and environmental injustices arise [77]. These conflicts are valued in different languages. For example, affected communities may request internalization of externalities and monetary compensation, arguing that the natural environment has great ecological, landscape, and sacred value, or that resources are excluded from the market by international provisions that protect indigenous groups and nationalities. The point is that the monetary dimension is the key point in any dialogue or conflict that involves interests of large companies in natural areas of interest [77].
5.1.2. Sustainability Indicators
Sustainability indicators arise by expanding the role of environmental indicators, integrating the four dimensions associated with the concept of sustainable development [78].
The economic indicator refers to the physical and objective basis of the process of growth and maintenance of the stock of natural resources incorporated into productive activities, setting criteria for renewable natural resources, for which the utilization rate should be equivalent to that of resource recomposition. For non-renewable natural resources, the utilization rate must be equivalent to the replacement of the resource in the production process based on the time planned for its depletion.
The environmental indicator is related to the ability of nature to absorb and recompose to anthropogenic aggressions, making use of the above reasoning, where the rates of waste emission as a result of economic activity must equal those of regeneration, which are determined for the resilience of an ecosystem.
The social objective is to improve the quality of life of the population in countries with serious problems of inequality and social exclusion. The basic criteria should be: distributive justice, in the case of distribution of goods and services; and the universalization of coverage for global education, health, housing, and social security policies.
The policy is linked to the process of building citizenship and seeks to incorporate the population into the process of development and decision-making.
From the Ecological Economy [79], the concepts of weak sustainability and strong sustainability have been defined according to the assessment of ecological damage and resource depletion [77]. The sustainability indicators that are explained below correspond to them.
Monetary Indicators of Territorial Sustainability or Weak Indicators
Monetary indicators of territorial sustainability evaluate the percentage of income and expenses that could be considered true income and loss of assets, respectively, from the sale and acquisition of products that meet the needs of a region, with the aim of reaching agreed monetary valuations of amortization of natural resources and environmental services [80,81]. They include [74,80]:
- The gross domestic product (GDP) green, which indicates economic growth, taking into account environmental consequences;
- The GDP ecologically corrected, which takes into account the valuation of non-renewable reserves. In the case of an exhaustion of the resource, there is a replacement of the natural capital;
- The Sustainable Economic Welfare Index (IBES), which corrects conventional measures of private final consumption (expenditure), considering social and environmental factors;
- The Patrimonial Accounts, which exist in order to include environmental variables in the production matrix.
These indicators do not contemplate some issues, such as irreversible damage to the environmental system and its accumulation, alterations of natural resource reserves, the diversity of units in the environmental system, and arbitrary monetary valuations [79].
Biophysical Sustainability Indicators or Strong Indicators
Biophysical sustainability indicators are oriented to evaluate the impact of socio-economic activity on the environment. For this type of indicator, it is not easy to compare situations. Their objective is didactic, not research, and the information on how to calculate them is restricted [80]. Some of them are [81]:
- Ecological backpack, which indicates efficiency in the use of matter and energy per unit of product. Its purpose is to assess whether there is a dematerialization of the economy over time;
- The ecological footprint, which allows the estimation of the environmental deficit of a given territory, highlighting the impact that a human group has on ecosystems in relation to resource consumption and waste generation. This measure reports the dependence of a community on the functioning (productivity) of ecosystems, regardless of whether it is outside their domain. It allows the monitoring of the impact of human actions, and it should be noted that the agglomeration (cities) demonstrates the dependence on ecosystems and the environment [77];
- The environmental space, which refers to the quantity and availability of renewable and non-renewable natural resources in relation to the levels of contamination allowed without harming future generations’ use of natural resources.
On a global level, the practical utility of these indicators in decision-making is limited. However, at the national, regional, or local level, they serve as instruments that can contribute to environmental planning and management [81].
5.2. Territorial Sustainability Indicators: Participatory Selection
The term “socio-environmental sustainability” refers to a dynamic balance between society and nature, as a result of a set of actions carried out with an integral vision of development processes. Part of the context and reality that it considers is the importance of not neglecting history, needs, conflicts, and potentialities. By analyzing the meaning of socio-environmental sustainability, it enables the creation of relationships within and between local communities, projecting an equitable use of resources in the short, medium, and long term [82], as well as the conservation of biodiversity, along with the participation of social actors. Within this context, territorial indicators allow the articulation of sustainability objectives and provide information on the state of the society–nature relationship. Its importance is based on the fact that it is formulated in a unique and unrepeatable context at a social, administrative, and territorial level. The information and relationships established between selected variables will be driven by local managers [79]. The criteria to consider for the design of indicators are [81]:
- -
- Political relevance, indicating aspects of collective interest and that are easily executed as concrete public actions;
- -
- Feasibility that the analysis, collection, and processing is within reach of the community;
- -
- Ease of interpretation; previous knowledge on the part of the actors to be understood and direct; the greater the value, the greater the sustainability;
- -
- Validity; effectiveness of the purposes;
- -
- Consistency with direct or indirect measurement (reality), without variations in time and space;
- -
- Comparability; allowing decisions, differentiating situations, and establishing typologies;
- -
- Synthetic, robust, or integrative; holistic as a parameter, inclusive in a small number of 59 reasonably added variables, with the possibility of disaggregation at local levels;
- -
- Systemic; capable of integrating into a social monitoring system;
- -
- Participatory; the allowance of the indicator to be involved in its own definition, analysis, and interpretation;
- -
- Visionary or predictive; able to relate what is measured with community values, about a desirable future.
Any sustainability requirement is translated into an indicator [78,83]. Among the indicators proposed for the socio-environmental dimension and territorial sustainability, due to the impact of the establishment of productive activities that involve change of use and sustainable management of the soil, the Land Quality Indicators stand out [84]. The development and use of these indicators can influence the decision-making and planning of territorial development at the farm level or production units, to avoid the possibility that the rehabilitation of soil quality at a regional level does not show positive results. In this, the participatory selection of indicators is applied [27,84]. Soil quality is an integral part of achieving sustainable agriculture [30].
In the Amazon region, this perspective is intended to curb the impacts produced locally by deforestation, as a result of agricultural and livestock practices that expand day by day and influence the ability of soils to offer food security for rural populations [85]. Therefore, the proposed edaphological indicators are adapted to local needs. An example of the evaluation of sustainability using the methodology of participatory selection of indicators in production units according to four dimensions is summarized in Table A1 of the Appendix A. The example corresponds to the case of the Ecuadorian Amazon [69], and includes economic, cultural, and political aspects, since agricultural production also depends on them.
Direct measurements and observations of morphological parameters at the field level are a very useful tool. They allow an understanding of the operation and performance of the soil in the natural environment, and how it is affected by human intervention [60,69]. At the same time, they allow tracking or monitoring. Several authors [52,69,86] have selected the following: the morphology of the soil with observable attributes in the field (in surface or in the profile), the conditions of the environment, the behavior and development of the plants, and the response of the soil to management practices or changes in the use of the earth. The attributes described above include composition, soil structure, soil organization, color, root distribution, porosity, evidence of carbonates and iron, and clay and soil consistency. Other authors also proposed texture as an observable attribute in the field [27,67,68], as the OM content is based on the amount of litter and fresh and decomposing plant debris. This pair of parameters contributes in large proportions to the availability of nutrients and good physical and biological condition. Another main ecosystem service is the carbon storage potential [27]. In addition, it has been corroborated that the scores generated by the visual method in the field maintain a close relationship with those obtained in the laboratory based on quality indicators.
5.3. Accessible Space–Time Representations. Biography and Integrated Sustainable Development Index
For decision-making regarding sustainable territorial development, all types of information, data, experiences, or knowledge are raised from the highest level (national level) to the community and individual levels. A trend analysis is the best option obtain a (future) view of certain variables and indicators. Indicators that focus on sustainable development, and that contribute to self-regulated sustainability, serve as a solid basis for decision-making at each level [73], giving way to the development of an instrument of didactic work. Through an image, the degree of sustainable development of an area or unit of analysis (territory where strategies, policies, and investments will be implemented) can be represented and estimated, symbolizing the state of sustainability. An instrument called Biogram consists of a web image and the integrated sustainable development index.
The Biogram is a representation of a multidimensional diagram and indexes. It represents the performance of the unit of analysis, through the use of selected indicators, which allow overestimation or underestimation of the degree (development status) of sustainable development [73], on a chart. At the same time, it makes it possible to carry out a comparative analysis between the different dimensions and the possible existing conflicts. It results from the complement between the graph and the integrated sustainable development index, which allow for a quantification of the performance of the unit of analysis. To understand the information easily, the methodology standardizes or transforms the value of the indicators to a common scale (between 0 and 1), facilitating comparative analysis. In the spider web image (Figure 3a), each radius (axis) represents a calculation indicator. By methodological definition, the value of each indicator will vary between 0 and 1, with the minimum and maximum performance, respectively. Therefore, the greater the shaded area, the greater the performance of the unit of analysis.
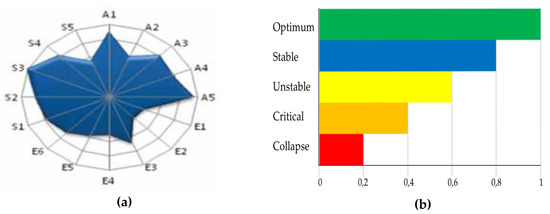
Figure 3.
(a) Biogram and (b) system status representation, based on [73].
The graphic representation provides knowledge on the individual performance of each dimension, showing an approximation of the degree of stability, and at the same time comparing the performance between units. The possibility of identifying the imbalances of an analysis unit in the image allows the location of the dimensions that need new policies or investments to correct the situation [73]. The Biogram uses five colors (Figure 3b) to characterize the state of sustainable development of the analysis units. When the shading red, it is less than 0.2, and it indicates a high probability of system collapse. Levels between 0.2 and 0.4 are represented by an orange color, and indicate a critical situation. Yellow shading, corresponding to levels of 0.4 to 0.6, indicates system instability. Levels between 0.6 and 0.8, shown in blue, represent system stability. The green color, for levels of 0.8 to 1, is the optimal system situation [73].
The methodology, on the one hand, allows for analyzing the evolution of an analysis unit in two moments (different years), and on the other, for comparing the situation of two units for the same moment (different places). One of the advantages of using this methodology is that it adapts to the characteristics of territories based on the needs and peculiarities. From the score of the indicators, information can be obtained on the progress of the proposed objectives (social, economic, environmental, and political). It shows a synthesis of the reality of the territories in a simple but understandable way for the population.
6. Conclusions
In conclusion, this work has clearly highlighted the importance of the study of the biological component of Amazonian soils. We have developed tables that include specific indicators from the biological point of view. In addition, we showed the available methods for assessing the sustainability of Amazonian territories through the analysis of soil quality. Our contribution facilitates the need for the edaphic perspective to be taken into account in decision-making processes for sustainable territorial development.
Supplementary Materials
The following are available online at https://www.mdpi.com/2071-1050/12/7/3007/s1.
Author Contributions
Conceptualization, J.L.-M.; methodology, T.R.-T.; data curation, T.H.-L.; writing—original draft preparation, T.H.-L. & J.B.-S.; writing—review and editing, T.H.-L. & J.B.-S.; supervision, J.L.-M.; project administration, J.L.-M.; funding acquisition, T.R.-T. All authors have read and agreed to the published version of the manuscript.
Funding
This research was funded by “Ayudas para la realización de actividades de investigación y desarrollo tecnológico, de divulgación y de transferencia de conocimiento por los grupos de investigación de Extremadura” Junta de Extremadura, Fondo Europeo de Desarrollo Regional. GR-18169. Becas Internacionales Master Alianza Convocatoria 2019–2020, Junta de Extremadura—Universidad de Extremadura.
Acknowledgments
Isidro González Calatrava, Biblioteca Central de la Universidad de Extremadura, Robinson Herrera-Feijoo.
Conflicts of Interest
The authors declare no conflict of interest
Appendix A
An evaluation of socio-environmental sustainability, and a proposal for a demonstration case selected in the Ecuadorian Amazon [69], with the indicators applied, are summarized in Table A1. The study concludes that, at the level of production units, each dimension presents critical levels, but with more economic and political limitations. According to the authors, the indicators that should be improved are the number of agroecological practices, crop diversification, productive diversification, management capacity, production level, net income, input costs, labor cost, marketing strategies, marketing strategy savings, production financing, institutional support, and state programs related to production units.
Table A1.
Sustainability evaluation through indicators in production units of the Province of Napo, Ecuadorian Amazonia, based on [69].
Table A1.
Sustainability evaluation through indicators in production units of the Province of Napo, Ecuadorian Amazonia, based on [69].
| Indicators Applied to the Production Units (UP) with Their Respective Score Level, in the Province of Napo, Ecuador | ||
|---|---|---|
| Dimension | Indicators | Optimum Level |
| Environmental | Number of agroecological practices used | At least five must be agroecological, with ecological principles, such as association of crops, polycultures, cover, silvopastoral, and agroforestry systems |
| Crop diversification | At least four types of crops | |
| Productive diversification | At least four productive activities | |
| Integral fertility: | ||
| - Texture | Franco, clay loam | |
| - Soil structure | Granular | |
| - Soil color | Dark brown or black | |
| - Apparent density | Less than 1.2 Mg·m−3 | |
| - Total porosity | Greater than 50% | |
| - pH | 5.5 to 7 | |
| - Organic material (%) | Greater than 3% | |
| - Nutrient availability (N, P, K, Ca, Mg) | Medium to high content | |
| - Biological activity | Abundant (wildlife is displayed on the ground) | |
| - Presence of erosion | Protected soil, without cracking | |
| Socio-cultural | Number of people incorporated to the UP | All family members have active participation |
| Workforce | At least 60% are familiar | |
| Task Distribution | Agreements are distributed equally | |
| Organization and management capacity | The UP is able to solve internal problems, keeps track of expenses, production and sales | |
| UP external administrative unit | Low, based on self-management | |
| Sense of belonging to the UP | High | |
| Acceptance of new practices | Willing to agroecological practices | |
| Waste disposal, recycling | Focusses on a specific area, apply recycling | |
| Time of dedication to the UP | More than 60% | |
| Economic | UP production level | Self-supply and sale of surplus |
| Acceptance of products (quality, price) | High | |
| Monthly net income in the UP | More than four minimum wages | |
| Agricultural input costs | 70% of inputs are produced in the UP | |
| Labor costs | 70% are members of the UP | |
| Marketing strategies | It has at least two strategies that give added value to the product | |
| Savings strategy | At least one strategy for eventualities | |
| Production financing | The unit is self-financing | |
| Politics | State programs related to the UP (Chakra, livestock) | More than three programs associated with the UP |
| Acceptance level of state programs | At least apply two programs or benefit from one | |
| Institutional support to the UP | At least three institutions supporting the UP | |
| Development of new skills and knowledge for productive work in the UP | All members have acquired new skills and knowledge, through courses and practical process workshops | |
| Level of participation or governance and associativity | UP members attend calls, technical tables, workshops, there is a predisposition | |
References
- Bravo, C.; Torres, B.; Alemán, R.; Marín, H.; Durazno, G.; Navarrete, H.; Gutiérrez, E.T.; Tapia, A. Indicadores morfológicos y estructurales de calidad y potencial de erosión del suelo bajo diferentes usos de la tierra en la Amazonía ecuatoriana. An. Geogr. Univ. Complut. 2017, 37, 247–264. [Google Scholar] [CrossRef]
- Pfenning, L.H.; Abreu, L.M. Hongos del suelo saprófitos y patógenos de plantas. In Manual de Biología de Suelos Tropicales; Instituto Nacional de Ecologiía: México city, Mexico, 2000; pp. 243–280. ISBN 978-607-790-831-9. [Google Scholar]
- Cherubin, M.R.; Karlen, D.L.; Franco, A.L.C.; Cerri, C.E.P.; Tormena, C.A.; Cerri, C.C. A Soil Management Assessment Framework (SMAF) evaluation of Brazilian sugarcane expansion on soil quality. Soil Sci. Soc. Am. J. 2016, 80, 215–226. [Google Scholar] [CrossRef]
- Moreira, F.M.S.; Huising, J.E.; Bignell, D.E. Manual de Biologia de Suelos Tropicales: Muestreo y Caracterizacion de la Biodiversidad Bajo Suelo; Instituto Nacional de Ecologiía: México city, Mexico, 2012; ISBN 9786077908319.
- Moldenke, A.R. Arthropods. Methods of soil analysis. Soil Sci. Soc. Am. J. 1994, 42, 517. [Google Scholar]
- Cabrera, G. La macrofauna edáfica como indicador biológico del estado de conservación/perturbación del suelo. Resultados obtenidos en Cuba. Pastos Y Forrajes 2012, 35, 349–363. [Google Scholar]
- Socarrás, A. Mesofauna edáfica: Indicador biológico de la calidad del suelo. Pastos Y Forrajes 2013, 36, 5–13. [Google Scholar]
- Cabrera, G.; Robaina, N.; Ponce de Leon, D. Composicion funcional de la macrofauna edafica en cuatro usos de la tierra en las provincias de Artemisa y Mayabeque, Cuba. Pastos Y Forrajes 2011, 34, 313–330. [Google Scholar]
- Bonilla, C.; Gómez, E.; Sánchez, M. El Suelo: Los Organismos Que lo Habitan; Universidad Nacional de Colombia: Palmira, Colombia, 2002; Volume 5. [Google Scholar]
- Coyne, M. Microbiología del Suelo: Un Enfoque Exploratorio; Paraninfo: Madrid, Spain, 2000; ISBN 84-283-2648-7. [Google Scholar]
- Chamorro, W.R.; Gallo, F.O.; Delgado, S.; Enríquez, S.I.; Guasumba, V.; López-Iborra, G. Los escarabajos estercoleros (Coleoptera: Scarabaeidae: Scarabaeinae) del Bosque Protector Oglán Alto, Pastaza, Ecuador. Biota Colomb. 2019, 20, 34–49. [Google Scholar] [CrossRef]
- Jones, D.T.; Eggleton, P. Sampling termite assemblages in tropical forests: Testing a rapid biodiversity assessment protocol. J. Appl. Ecol. 2000, 37, 191–203. [Google Scholar] [CrossRef]
- González, G.; Zou, X.; Borges, S. Earthworm abundance and species composition in abandoned tropical croplands: Comparisons of tree plantations and secondary forests. Pedobiologia (Jena) 1996, 40, 385–391. [Google Scholar]
- García-Álvarez, A.; Bello, A. Diversidad de los organismos de suelo y transformaciones de la materia orgánica. In Proceedings of the International Conference Soil Compost Eco-Biology, León, España, 15–17 September 2004; pp. 211–212. [Google Scholar]
- Cares, J.E.; Huang, S.P. Nematodos del Suelo. Man. Biol. Suelos Trop. 2012, 5, 163–176. [Google Scholar]
- Traunspurger, W.; Reiff, N.; Krashevska, V.; Majdi, N.; Scheu, S. Diversity and distribution of soil micro-invertebrates across an altitudinal gradient in a tropical montane rainforest of Ecuador, with focus on free- living nematodes. Pedobiol. J. Soil Ecol. 2017, 62, 28–35. [Google Scholar] [CrossRef]
- Ruiz, P.; Rojas, K.; Sieverding, E. La distribución geográfica de los hongos de micorriza arbuscular: Una prioridad de investigación en la Amazonía peruana. Espac. Y Desarro. 2011, 23, 47–63. [Google Scholar]
- Alemán, R.; Reyes, H.; Bravo, C. Libro de Memorias: Simposio Internacional Sobre Manejo Sostenible de Tierras y Seguridad Alimentaria—Ecuador 2017; Alemán-Pérez, R., Reyes-Morán, H., Bravo-Medina, C., Eds.; Universidad Estatal Amazónica: Puyo, Pastaza-Ecuador, 2017; ISBN 978-9942-932-22-8. [Google Scholar]
- Bagyaraj, J.D.; Stürmer, S.L. Hongos micorrizógenos arbusculares (HMA). In Manual de Biología de Suelos Tropicales; Instituto Nacional de Ecología: México city, Mexico, 2012; pp. 217–242. [Google Scholar]
- Carey, J.C.; Fulweiler, R.W. The terrestrial silica pump. PLoS ONE 2012, 7, e52. [Google Scholar] [CrossRef] [PubMed]
- Stanek-Tarkowska, J.; Noga, T. Diversity of diatoms (Bacillariophyceae) in the soil. Inż. Ekol. 2012, 30, 287–296. [Google Scholar]
- Hallmann, C. Biodiversity of Terrestrial Algal Communities from Soil and Air-Exposed Substrates Using a Molecular Approach. Ph.D. Thesis, Georg-August-University School of Science, Gottinghem, Germany, 2015. [Google Scholar]
- Maistro, S.; Broady, P.; Andreoli, C.; Negrisolo, E. Xanthophyceae. In Handbook of the Protists: Second Edition; Springer International Publishing: Berlin/Heidelberg, Germany, 2017; pp. 407–434. ISBN 9783319281490. [Google Scholar]
- Bérard, A.; Dorigo, U.; Humbert, J.F.; Martin-Laurent, F. Microalgae community structure analysis based on 18S rDNA amplification from DNA extracted directly from soil as a potential soil bioindicator. Agronomie 2005, 25, 285–291. [Google Scholar] [CrossRef]
- Moreira, F.M.S. Bacterias formadoras de nódulos en leguminosas. In Manual de Biología de Suelos Tropicales: Muestro y Caracterización de la Biodiversidad Bajo Suelo; Instituto Nacional de Ecologiía: México city, Mexico, 2012; pp. 177–216. [Google Scholar]
- Corrales Morales, M.; Villalobos, K.; Rodríguez Rodríguez, A.; Muñoz Simón, N.; Umaña-Castro, R. Identificación y caracterización molecular de cianobacterias tropicales de los géneros Nostoc, Calothrix, Tolypothrix y Scytonema (Nostocales: Nostocaceae), con posible potencial biotecnológico. UNED Res. J. 2017, 9, 280–288. [Google Scholar] [CrossRef]
- Bravo, C.; Benítez, D.; Vargas Burgos, J.; Alemán, R.; Torres, B.; Marín, H. Caracterización socio-ambiental de unidades de producción agropecuaria en la Región Amazónica Ecuatoriana: Caso Pastaza y Napo. Rev. Amaz. Cienc. Y Tecnol. 2015, 4, 3–31. [Google Scholar]
- Bravo-Velásquez, E. Apuntes Sobre la Biodiversidad del Ecuador; Abya-Yala, Editorial Universitaria: Cuenca, Ecuador, 2013; ISBN 978-9978-10-153-7. [Google Scholar]
- López, V.; Espíndola, F.; Callles, J.; Ulloa, J. Amazonía Ecuatoriana Bajo Presión; Eco Ciencia: Quito, Ecuador, 2013. [Google Scholar]
- Izquierdo, I.; Caravaca, F.; Alguacil, M.M.; Roldan, A. Changes in physical and biological soil quality indicators in a tropical crop system (Havana, Cuba) in response to different agroecological management practices. Environ. Manag. 2003, 32, 639–645. [Google Scholar] [CrossRef]
- Diaz, A. Caracterización de los suelos de la Amazonía ecuatoriana. In Agroforestería Sostenible en la Amazonía Ecuatoriana, N° 2, Fragilidad de los Suelos en la Amazonía Ecuatoriana y Potenciales Alternativas Agroforestales Para el Manejo Sostenible; INIAP-Estación Experimental Central Amazónica: Joya de los Sachas, Ecuador, 2018; pp. 33–40. ISBN 978-9942-36-039-7. [Google Scholar]
- Rodríguez-Achung, F.; Bendayán-Acosta, L.; Rojas-Rodríguez, C.; Calle-Barco, C. Los suelos de la región del Amazonas segun unidades fisiográficas. Folia Amaz. 2006, 3, 7–20. [Google Scholar] [CrossRef]
- MAG, (Ministerio de Agricultura y Ganadería) Memoria Explicativa del Mapa de Órdenes de Suelos del Ecuador. Available online: http://metadatos.sigtierras.gob.ec/pdf/MEMORIA_MAPA_DE_ORDENES_DE_SUELOS_MAG_SIGTIERRAS.pdf (accessed on 16 February 2020).
- Vargas, Y.; Nicolalde, J.; Calero, A.; Vizuete, O. ¿Por qué son frágiles los suelos de la Amazonía ecuatoriana? In Agroforestería Sostenible en la Amazonía Ecuatoriana, N° 2, Fragilidad de los Suelos en la Amazonía Ecuatoriana y Potenciales Alternativas Agroforestales Para el Manejo Sostenible; INIAP-Estación Experimental Central Amazónica: Joya de los Sachas, Ecuador, 2018; pp. 61–68. ISBN 978-9942-36-039-7. [Google Scholar]
- Nieto, C.; Caicedo, C. Análisis reflexivo sobre el desarrollo agropecuario sostenible en la Amazonía Ecuatoriana, INIAP—EECA. Iniap 2012, 102, 24–50. [Google Scholar]
- Bravo, C.; Ramírez, A.; Marín, H.; Torres, B.; Alemán, R.; Torres, R.; Navarrete, H.; Changoluisa, D. Factores asociados a la fertilidad del suelo en diferentes usos de la tierra de la Región Amazónica Ecuatoriana. Rev. Electron. Vet. 2017, 18, 1–16. [Google Scholar]
- Torres, B.; Starnfeld, F.; Vargas, J.C.; Ramm, G.; Chapalbay, R.; Rios, M.; Gómez, A.; Torricelli, Y.; Jurrius, I.; Tapia, A.; et al. Gobernanza Participativa en la Amazonía del Ecuador: Recursos Naturales y Desarrollo Sostenible; Manthra: Quito, Ecuador, 2014. [Google Scholar]
- Vallejo Quintero, V.E. Importancia y utilidad de la evaluación de la calidad de suelos a través del componente microbiano: Experiencias en sistemas silvopastoriles. Colomb. For. 2013, 16, 83–99. [Google Scholar] [CrossRef]
- Tapia-Báez, R.G. Diversidad de Escarabajos Copronecrófagos y Estado de Consevación de la Microcuenca del Río Pindo; Universisdad Tecnológica Equinoccial: Quito, Ecuador, 2015. [Google Scholar]
- Bravo, C.; Torres, B.; Alemán, R.; Changoluisa, D.; Marín, H.; Reyes, H.; Navarrete, H. Soil structure and carbon sequestration as ecosystem services under different land uses in the Ecuadorian Amazon Region. MOL2NET 2017, 3, 1–8. [Google Scholar]
- Palacios, W.; Malessa, U. Situación de las Comunidades Productoras Forestales de la Amazonía Ecuatoriana: Obstáculos y Oportunidades Para Comercializar Madera Legal; TRAFFIC, Oficina regional America del Sur: Quito, Ecuador, 2010. [Google Scholar]
- Camacho, D.C. Esquemas de pagos por servicios ambientales para la conservación de cuencas hidrográficas en el Ecuador. Investig. Agrar. Sist. Y Recur. For. 2008, 17, 1354–1366. [Google Scholar]
- Bünemann, E.K.; Bongiorno, G.; Bai, Z.; Creamer, R.E.; De Deyn, G.; De Goede, R.; Fleskens, L.; Geissen, V.; Kuyper, T.W.; Mäder, P.; et al. Soil quality—A critical review. Soil Biol. Biochem. 2018, 120, 105–125. [Google Scholar] [CrossRef]
- Leite Chaves, H.M.; Concha Lozada, C.M.; Gaspar, R.O. Soil quality index of an Oxisol under different land uses in the Brazilian savannah. Geoderma Reg. 2017, 10, 183–190. [Google Scholar] [CrossRef]
- Andrews, S.S.; Karlen, D.L.; Mitchell, J.P. A comparison of soil quality indexing methods for vegetable production systems in Northern California. Agric. Ecosyst. Environ. 2002, 90, 25–45. [Google Scholar] [CrossRef]
- Doran, J.W.; Parkin, T.B. Defining Soil Quality for Sustainable Environment; Soil Science Society of America: Madison, WI, USA, 1994; ISBN 0-89118-807-X. [Google Scholar]
- Cañizares-Gonzales, R. Potencial para el Secuestro de Carbono y la protección de la biodiversidad bacteriana de prácticas agrícolas sostenibles en suelos de Olivar. In Diseño y Aplicación de Tecnologías “Ómicas”; Universidad de Granada: Granada, España, 2011. [Google Scholar]
- Custode, E.; Sourdat, M. Paisajes y suelos de la Amazonia ecuatoriana: Entre la conservaci6n y la explotaci6n. Cultura 1986, 24, 325–339. [Google Scholar]
- Gardi, C.; Angelini, M.; Barceló, S.; Comerma, J.; Cruz-Gaistardo, C.; Encina-Rojas, A.; Jones, A.; Krasilnikov, P.; Mendonça-Santos, M.L.; Montanarella, L.; et al. Atlas de Suelos de América Latina y el Caribe, Comisión Europea-Oficina de Publicaciones de la Union Europea, L2995; Comisión Europea: Luxembourg, 2014; ISBN 978-92-79-25599-1. [Google Scholar]
- Simpson, R.J.; Stefanski, A.; Marshall, D.J.; Moore, A.D.; Richardson, A.E. Management of soil phosphorus fertility determines the phosphorus budget of a temperate grazing system and is the key to improving phosphorus efficiency. Agric. Ecosyst. Environ. 2015, 212, 263–277. [Google Scholar] [CrossRef]
- Navarrete Segueda, A.; Vela Correa, G.; Lopez, J.; Rodriguez, M.D.L. Naturaleza y utilidad de los indicadores de calidad del suelo. Contactos 2011, 80, 29–37. [Google Scholar]
- Pulido Moncada, M.; Gabriels, D.; Lobo, D.; Rey, J.C.; Cornelis, W.M. Visual field assessment of soil structural quality in tropical soils. Soil Tillage Res. 2014, 139, 8–18. [Google Scholar] [CrossRef]
- Toledo, D.M.; Arzuaga, S.A.; Galantini, J.A.; Vazquez, S. Indicadores e Índices biológicos de calidad de suelo en sistemas forestales. Cienc. del Suelo 2018, 36, 1–12. [Google Scholar]
- Hinojosa, M.B.; García-Ruíz, R.; Benjamín, V.; Carreira, J.A. Microbiological rates and enzyme activities as indicators of functionality ´ llar toxic spill in soils affected by the Aznalco. Soil Biol. Biochem. 2004, 36, 1637–1644. [Google Scholar] [CrossRef]
- Lavelle, P.; Dangerfield, M.; Fragoso, C.; Eschenbrenner, V.; Lopez-Hernandez, D.; Pashanasi, B.; Brussaard, L. The relationship between soil macrofauna and tropical soil fertility. In The Biological Management of Tropical Soil Fertility; Woomer, P.L., Swift, M.J., Eds.; Wiley: Chichester, UK, 1994; pp. 137–169. [Google Scholar]
- Enagbonma, B.J.; Babalola, O.O. Environmental sustainability: A review of termite mound soil material and its bacteria. Sustainability 2019, 11, 3847. [Google Scholar] [CrossRef]
- Cole, L.; Bradford, M.A.; Shaw, P.J.A.; Bardgett, R.D. The abundance, richness and functional role of soil meso- and macrofauna in temperate grassland-A case study. Appl. Soil Ecol. 2006, 33, 186–198. [Google Scholar] [CrossRef]
- Ahmad-Wani, S.; Ahmad-Wani, M.; Ahmad-Sheikh, A.; Chand, S. Microbiological-Indicators with potential for evaluating soil quality. Int. J. Curr. Microbiol. Appl. Sci. 2017, 6, 831–839. [Google Scholar] [CrossRef][Green Version]
- Delgado-Baquerizo, M.; Oliverio, A.M.; Brewer, T.E.; Benavent-González, A.; Eldridge, D.J.; Bardgett, R.D.; Maestre, F.T.; Singh, B.K.; Fierer, N. A global atlas of the dominant bacteria found in soil. Science 2018, 359, 320–325. [Google Scholar] [CrossRef]
- Raiesi, F.; Beheshti, A. Microbiological indicators of soil quality and degradation following conversion of native forests to continuous croplands. Ecol. Indic. 2015, 50, 173–185. [Google Scholar] [CrossRef]
- Vance, E.D.; Brookes, P.C.; Jenkinson, D.S. An extraction method for measuring soil microbial biomass carbon. Soil Biol. Biochem. 1987, 19, 703–707. [Google Scholar] [CrossRef]
- Maharjan, M.; Sanaullah, M.; Razavi, B.S.; Kuzyakov, Y. Effect of land use and management practices on microbial biomass and enzyme activities in subtropical top-and sub-soils. Appl. Soil Ecol. 2017, 113, 22–28. [Google Scholar] [CrossRef]
- Paz-Ferreiro, J.; Gascó, G.; Gutiérrez, B.; Méndez, A. Soil biochemical activities and the geometric mean of enzyme activities after application of sewage sludge and sewage sludge biochar to soil. Biol. Fertil. Soils 2012, 48, 511–517. [Google Scholar] [CrossRef]
- Anderson, T.-H.; Domsch, K.H. The metabolic quotient for CO2 (qCO2) as a specific activity parameter to assess the effects of environmental conditions, such as ph, on the microbial biomass of forest soils. Soil Biol. Biochem. 1993, 25, 393–395. [Google Scholar] [CrossRef]
- Ramírez, M.; López-Piñeiro, A.; Peña, D.; Nunes, J.R.; Albarrán, Á.; Muñoz, A.; Gama, J.; Loures, L. Seasonal and interannual fluctuation of the microbial soil community in a maize field under long-term conservation agriculture management. Sustainability 2017, 9, 778. [Google Scholar] [CrossRef]
- GROW Observatory GROW Food. GROW Soil. GROW Science. Available online: https://growobservatory.org/ (accessed on 31 October 2019).
- Power, A.G. Ecosystem services and agriculture: Tradeoffs and synergies. Philos. Trans. R. Soc. B Biol. Sci. 2010, 365, 2959–2971. [Google Scholar] [CrossRef]
- Viana, R.M.; Ferraz, J.B.S.; Neves, A.F.; Vieira, G.; Pereira, B.F.F. Soil quality indicators for different restoration stages on Amazon rainforest. Soil Tillage Res. 2014, 140, 1–7. [Google Scholar] [CrossRef]
- Bravo, C.; Marín, H.; Marrero, P.; Ruiz, M.; Torres, B.; Navarrete, H.; Durazno, G.; Changoluisa, D. Evaluación de la sustentabilidad mediante indicadores en unidades de producción de la provincia de Napo, Amazonia Ecuatoriana. Bioagro 2017, 29, 23–36. [Google Scholar]
- Vargas-Burgos, J.C.; Benítez, D.; Ríos, S.; Torres, A.; Navarrete, H.; Andino, M.; Quinteros, R. Ordenamiento de razas bovinas en los ecosistemas amazónicos. Estudio de caso provincia Pastaza. Rev. Amaz. Cienc. Y Tecnol. 2013, 2, 133–146. [Google Scholar]
- Ramachandran-Nair, P.K.; Mohan-Kumar, B.; Nair, V.D. Agroforestry as a strategy for carbon sequestration. J. Plant Nutr. Soil Sci. 2009, 172, 10–23. [Google Scholar] [CrossRef]
- Altieri, M.A.; Nicholls, C.I. Agroecología y resiliencia al cambio climatico: Principios y consideraciones metodológicas. Agroecología 2013, 8, 7–20. [Google Scholar]
- Sepúlveda, S.; Chavarría, H.; Rojas, P. Metodología Para Estimar el Nivel de Dsarrollo Sostenible en Los Territorios Rurales (El Biograma); Costa Rica: San José, CA, USA, 2008; ISBN 978-92-9039-872-1.
- Sejenovich, H. Manual de Cuentas Patrimoniales; Programa de las Naciones Unidas para el Medio Ambiente: Nairobi, Kenya, 1996; p. 234. [Google Scholar]
- Sancho-Perez, A.; Garcia-Mesanat, G. What does an indicator indicate? Comparative analysis in tourist destinations. Tour. Anal. Mag. 2006, 2, 69–85. [Google Scholar]
- SENPLADES. Plan Nacional de Desarrollo 2017–2021-Toda una Vida; SENPLADES: Quito, Ecuador, 2017.
- Martínez-Alier, J. Los conflictos ecológicos-distributivos y los indicadores de Sustentabilidad. Polis Rev. Latinoam. 2006, 13, 21–30. [Google Scholar]
- Guimarães, R. Tierra de sombras: Desafíos de la sustentabilidad y del desarrollo territorial y local ante la globalización corporativa. Ser. Medio Ambient. Y Desarro. 2003, 67, 62. [Google Scholar]
- Rueda, S. Metabolismo y Complejidad del Sistema Urbano a la Luz de la Ecologia; Ciudades Para un Futuro Mas Sostenible: Madrid, Spain, 1997. [Google Scholar]
- Achkar, M. Indicadores de Sustentabilidad [Sustainability Indexes]; Ordenamiento Ambiental del Territorial [Environmental Planning Territorial]: México city, Mexico, 2005; pp. 55–70. [Google Scholar]
- Rossi, E. Indicadores Territoriales de Sustentabilidad Socio-Ambiental Aplicados al Turismo, Tesis de Maestría; Universidad Nacional de Mar del Plata: Mar del Plata, Argentina, 2015. [Google Scholar]
- Hernández-Hernández, M.R.; Morros, M.E.; Bravo-Medina, C.A.; Pérez, Z.; Herrera-Díaz, P.E.; Ojeda-Hernández, A.; Morales, J.; Birbe-Fernández, B.O. La integración del conocimiento local y científico en el manejo sostenible de suelos en agroecosistemas de sabanas. Interciencia 2011, 36, 104–112. [Google Scholar]
- Sarandón, S.J. El desarrollo y uso de indicadores para evaluar la sustentabilidad de los agroecosistemas. Agroecol. El Camino Para Agric. Sustentable 2002, 20, 393–414. [Google Scholar]
- Reardón, J.A.; Alemán-Perez, R. Agroecology and the development of indicators of food sovereignty in Cuban food systems. Sustain. Agric. 2010, 34, 907–922. [Google Scholar] [CrossRef]
- Astier-Calderón, M.; Maass-Moreno, M.; Etchevers-Barra, J. Derivación de indicadores de calidad de suelos en el contexto de la agricultura sustentable derivation of soil quality indicators in the context of sustainable agriculture. Agrociencia 2002, 36, 605–620. [Google Scholar]
- Casanova, E. Introducción a la Ciencia del Suelo; Universidad Central de Venezuela: Caracas, Venezuela, 2005. [Google Scholar]
© 2020 by the authors. Licensee MDPI, Basel, Switzerland. This article is an open access article distributed under the terms and conditions of the Creative Commons Attribution (CC BY) license (http://creativecommons.org/licenses/by/4.0/).