Sustainable Innovation Governance: An Analysis of Regional Innovation with a Super Efficiency Slack-Based Measure Model


Abstract
1. Introduction
2. Literature Review
2.1. Sustainable Innovation Governance
2.2. Research on Innovation Efficiency
3. Methods
3.1. Super Efficiency DEA-SBM Model
3.2. Indicators Selection and Data Sources
3.3. Regression Model
4. Empirical Results
4.1. Efficiency Evaluation Results
4.2. Analysis of Innovation Efficiency Changes
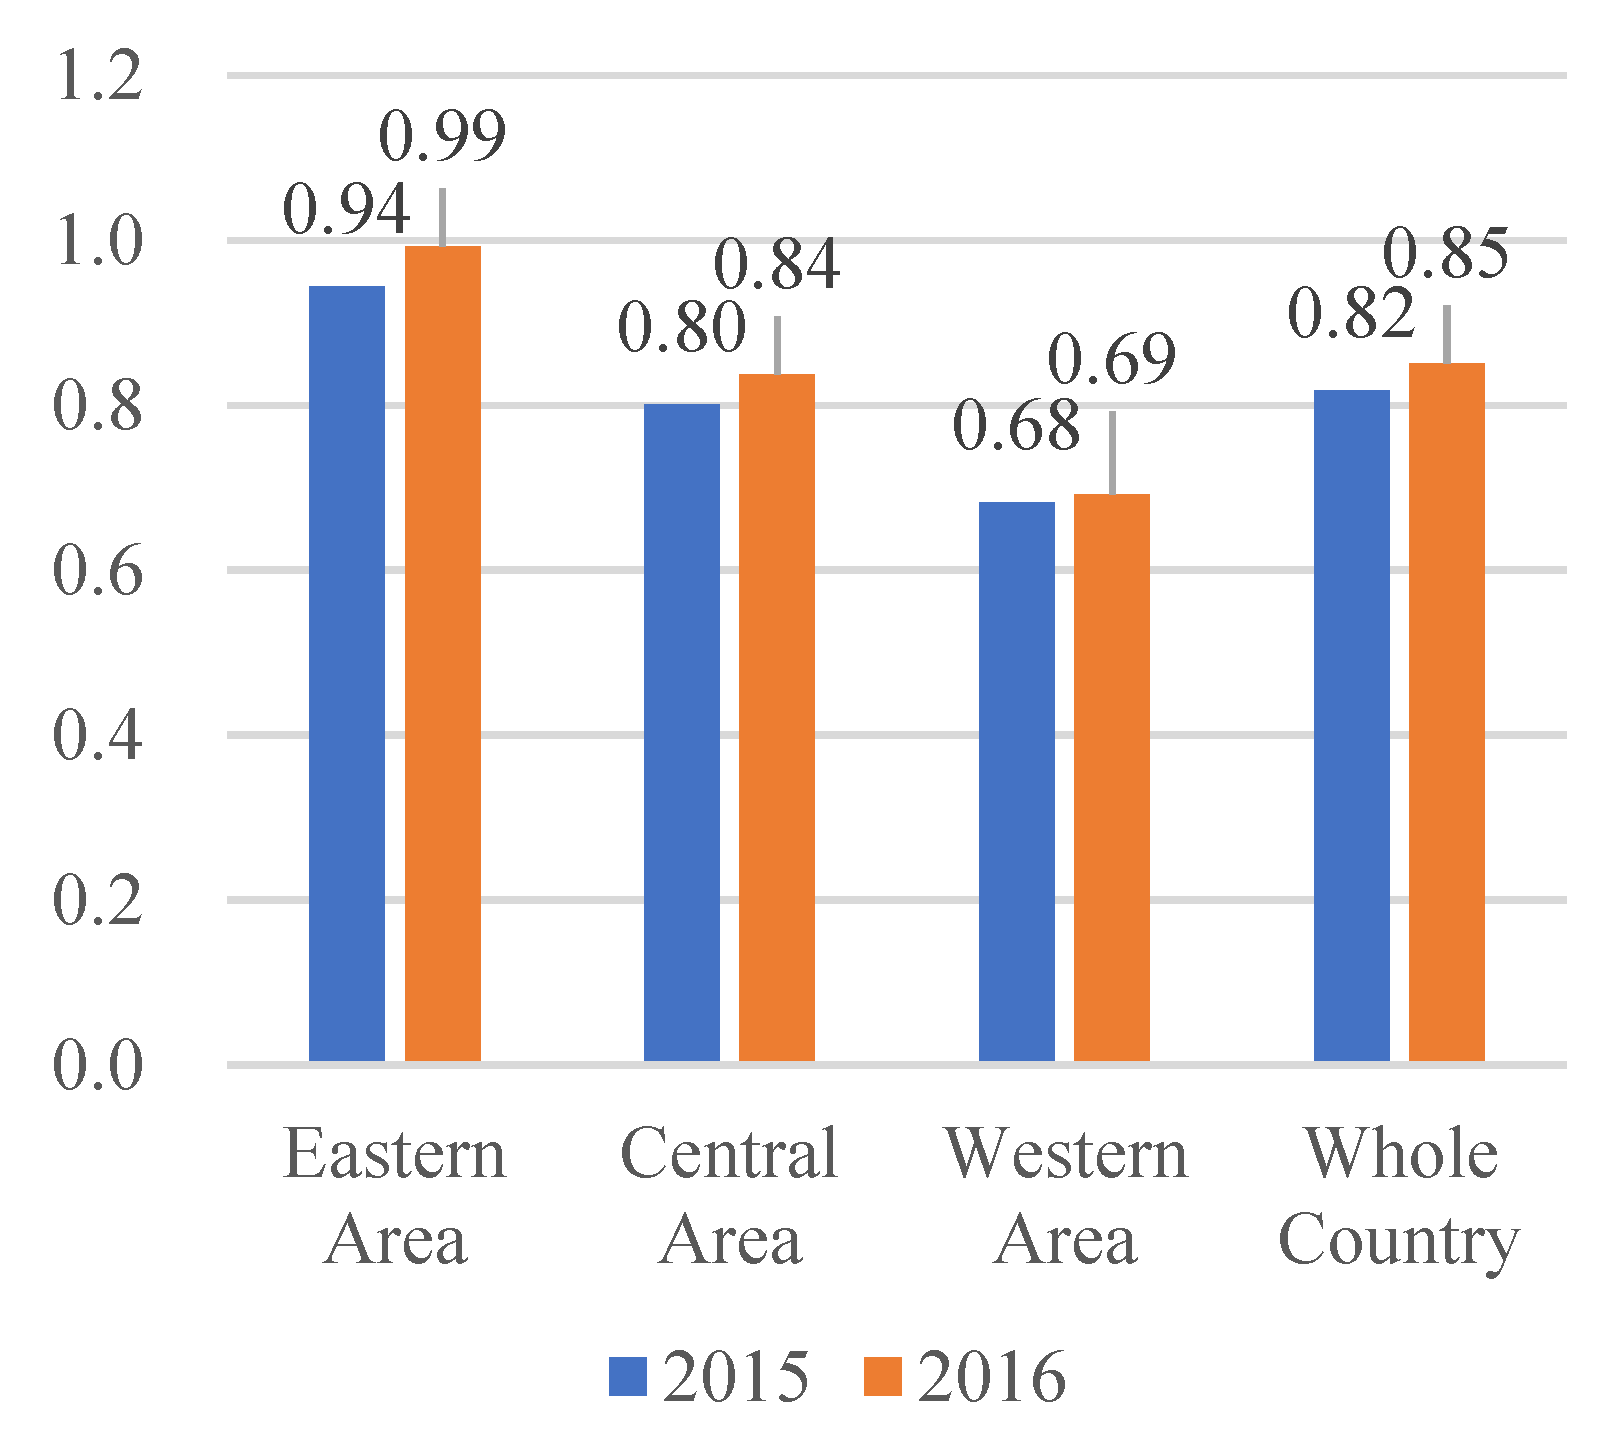
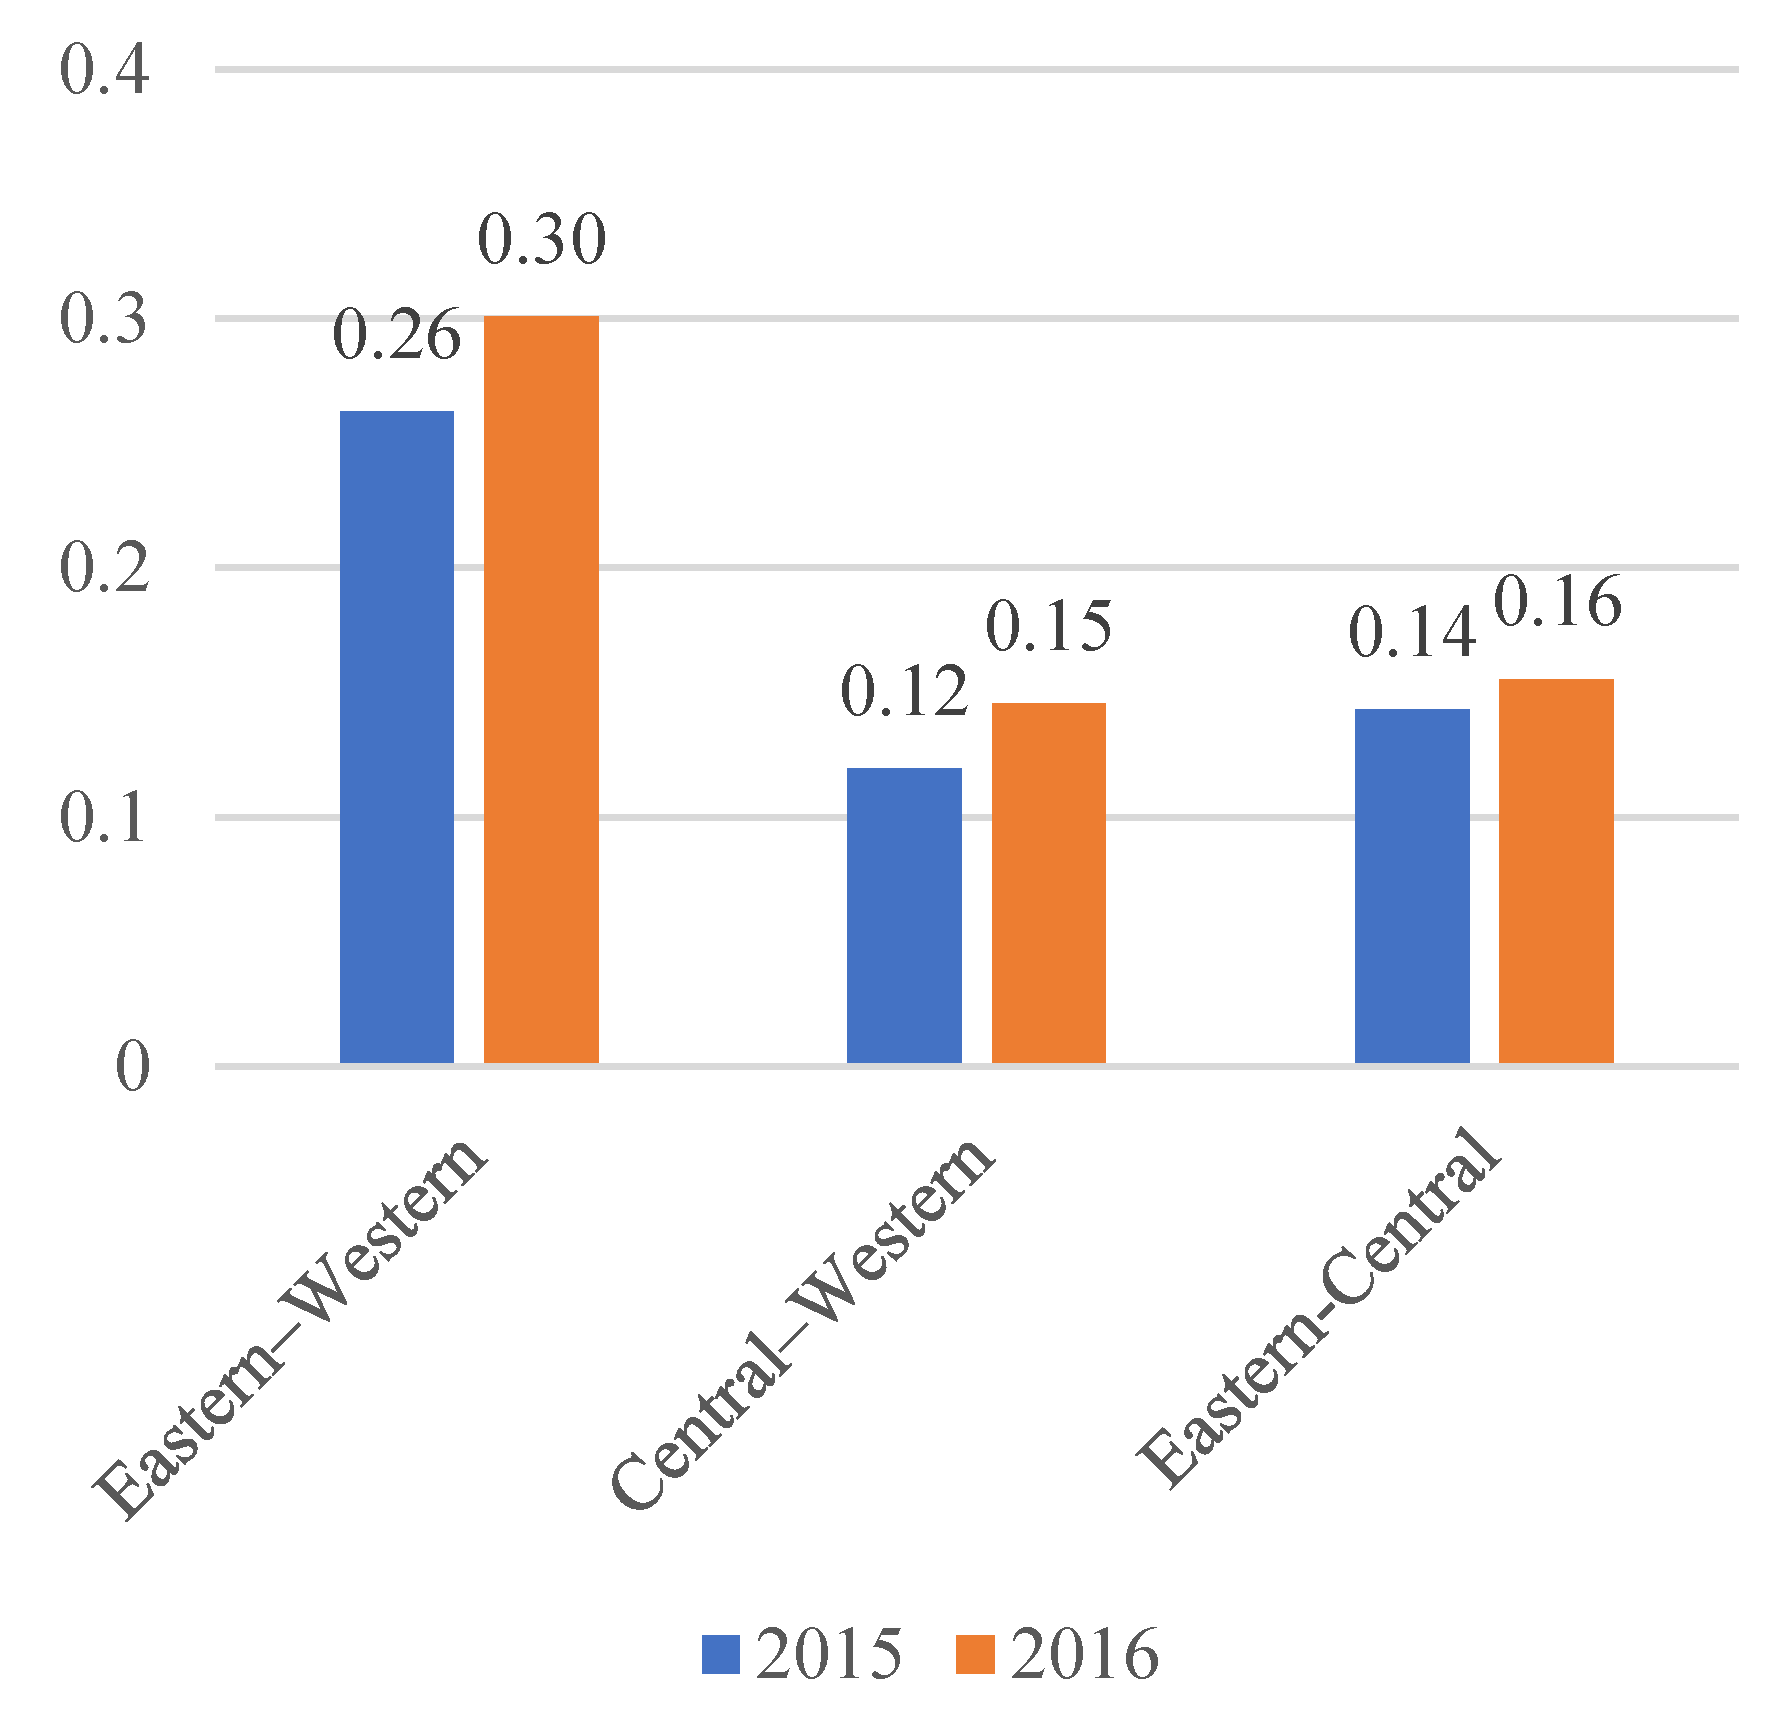
4.3. Regional Comparative Analysis
4.4. Influence Factors Analysis
5. Discussions
5.1. Hypotheses
5.2. Contribution to Theory
5.3. Contribution to Practice
5.4. Limitations
5.5. Future Research
6. Conclusions and Implications
Author Contributions
Funding
Acknowledgments
Conflicts of Interest
References
- Nill, J.; Kemp, R. Evolutionary approaches for sustainable innovation policies: From niche to paradigm? Res. Policy 2009, 38, 668–680. [Google Scholar] [CrossRef]
- Yam, R.C.M.; Guan, J.C.; Pun, K.F.; Tang, E.P.Y. An audit of technological innovation capabilities in chinese firms: Some empirical findings in Beijing, China. Res. Policy 2004, 33, 1123–1140. [Google Scholar] [CrossRef]
- Li, Z.; Li, J.; He, B. Does foreign direct investment enhance or inhibit regional innovation efficiency? Chin. Manag. Stud. 2018, 12, 35–55. [Google Scholar] [CrossRef]
- Bai, J. On Regional Innovation Efficiency: Evidence from Panel Data of China’s Different Provinces. Reg. Stud. 2013, 47, 773–788. [Google Scholar] [CrossRef]
- Tian, X.; Wang, J. Research on Spatial Correlation in Regional Innovation Spillover in China Based on Patents. Sustainability 2018, 10, 3090. [Google Scholar] [CrossRef]
- Chen, K.; Guan, J. Measuring the Efficiency of China’s Regional Innovation Systems: Application of Network Data Envelopment Analysis (DEA). Reg. Stud. 2012, 46, 355–377. [Google Scholar] [CrossRef]
- Feng, C.; Wang, M. The heterogeneity of China’s pathways to economic growth, energy conservation and climate mitigation. J. Clean. Prod. 2019, 228, 594–605. [Google Scholar] [CrossRef]
- Yu, Y.; Qian, T.; Du, L. Carbon productivity growth, technological innovation, and technology gap change of coal-fired power plants in China. Energy Policy 2017, 109, 479–487. [Google Scholar] [CrossRef]
- Zhang, W.; Pan, X.; Yan, Y.; Pan, X. Convergence analysis of regional energy efficiency in china based on large-dimensional panel data model. J. Clean. Prod. 2017, 142, 801–808. [Google Scholar] [CrossRef]
- Broekel, T. Collaboration Intensity and Regional Innovation Efficiency in Germany—A Conditional Efficiency Approach. Ind. Innov. 2012, 19, 155–179. [Google Scholar] [CrossRef]
- Holley, C.; Lecavalier, E. Energy governance, energy security and environmental sustainability: A case study from Hong Kong. Energy Policy 2017, 108, 379–389. [Google Scholar] [CrossRef]
- Salvioni, D.; Gennari, F.; Bosetti, L. Sustainability and Convergence: The Future of Corporate Governance Systems? Sustainability 2016, 8, 1203. [Google Scholar] [CrossRef]
- Husted, B.W.; Sousa-Filho, J.M.D. The impact of sustainability governance, country stakeholder orientation, and country risk on environmental, social, and governance performance. J. Clean. Prod. 2017, 155, 93–102. [Google Scholar] [CrossRef]
- Rajesh, R. Exploring the sustainability performances of firms using environmental, social, and governance scores. J. Clean. Prod. 2020, 247, 119600. [Google Scholar] [CrossRef]
- Zhao, Z.-Q.; He, B.-J.; Li, L.-G.; Wang, H.-B.; Darko, A. Profile and concentric zonal analysis of relationships between land use/land cover and land surface temperature: Case study of Shenyang, China. Energy Build. 2017, 155, 282–295. [Google Scholar] [CrossRef]
- He, B.-J.; Zhao, D.-X.; Zhu, J.; Darko, A.; Gou, Z.-H. Promoting and implementing urban sustainability in China: An integration of sustainable initiatives at different urban scales. Habitat. Int. 2018, 82, 83–93. [Google Scholar] [CrossRef]
- De Guimarães, J.C.F.; Severo, E.A.; Felix Júnior, L.A.; Da Costa, W.P.L.B.; Salmoria, F.T. Governance and quality of life in smart cities: Towards sustainable development goals. J. Clean. Prod. 2020, 253, 119926. [Google Scholar] [CrossRef]
- Hussain, N.; Rigoni, U.; Orij, R.P. Corporate Governance and Sustainability Performance: Analysis of Triple Bottom Line Performance. J. Bus. Ethics 2016, 149, 411–432. [Google Scholar] [CrossRef]
- Lombardi, R.; Cano-Rubio, M.; Trequattrini, R.; Fuentes-Lombardo, G. Exploratory evidence on anticorruption activities in the Spanish context: A sustainable governance approach. J. Clean. Prod. 2020, 249, 119424. [Google Scholar] [CrossRef]
- Ioppolo, G.; Cucurachi, S.; Salomone, R.; Saija, G.; Shi, L. Sustainable Local Development and Environmental Governance: A Strategic Planning Experience. Sustainability 2016, 8, 180. [Google Scholar] [CrossRef]
- Blendinger, G.; Michalski, G. Long-Term Competitiveness Based on Value Added Measures as Part of Highly Professionalized Corporate Governance Management of German Dax 30 Corporations. J. Compet. 2018, 10, 5–20. [Google Scholar] [CrossRef]
- Mahmood, M.; Orazalin, N. Green governance and sustainability reporting in Kazakhstan’s oil, gas, and mining sector: Evidence from a former USSR emerging economy. J. Clean. Prod. 2017, 164, 389–397. [Google Scholar] [CrossRef]
- Schrobback, P.; Meath, C. Corporate sustainability governance: Insight from the Australian and New Zealand port industry. J. Clean. Prod. 2020, 255, 120280. [Google Scholar] [CrossRef]
- Shin, J.; Kim, C.; Yang, H. The Effect of Sustainability as Innovation Objectives on Innovation Efficiency. Sustainability 2018, 10, 1966. [Google Scholar] [CrossRef]
- Lupova-Henry, E.; Dotti, N.F. Governance of sustainable innovation: Moving beyond the hierarchy-market-network trichotomy? A systematic literature review using the ‘who-how-what’ framework. J. Clean. Prod. 2019, 210, 738–748. [Google Scholar] [CrossRef]
- Naciti, V. Corporate governance and board of directors: The effect of a board composition on firm sustainability performance. J. Clean. Prod. 2019, 237, 117727. [Google Scholar] [CrossRef]
- Wang, W.; Yu, B.; Yan, X.; Yao, X.; Liu, Y. Estimation of innovation’s green performance: A range-adjusted measure approach to assess the unified efficiency of China’s manufacturing industry. J. Clean. Prod. 2017, 149, 919–924. [Google Scholar] [CrossRef]
- Chen, C.; Han, J.; Fan, P. Measuring the Level of Industrial Green Development and Exploring Its Influencing Factors: Empirical Evidence from China’s 30 Provinces. Sustainability 2016, 8, 153. [Google Scholar] [CrossRef]
- Cooke, P. Regional innovation systems: Competitive regulation in the new Europe. Geoforum 1992, 23, 365–382. [Google Scholar] [CrossRef]
- Cooke, P.; Boekholt, P.; Schall, N.; Schienstock, G. Regional innovation systems: Concepts, analysis and typology. In Proceedings of the EU-RESTPOR Conference Global Comparison of Regional RTD and Innovation Strategies for Development and Cohesion, Brussels, Belgium, 19 September 1996; pp. 19–21. [Google Scholar]
- Cooke, P.; Gomez Uranga, M.; Etxebarria, G. Regional innovation systems: Institutional and organisational dimensions. Res. Policy 1997, 26, 475–491. [Google Scholar] [CrossRef]
- Baregheh, A.; Rowley, J.; Sambrook, S. Towards a multidisciplinary definition of innovation. Manag. Decis. 2009, 47, 1323–1339. [Google Scholar] [CrossRef]
- Saunila, M.; Ukko, J.; Rantala, T. Sustainability as a driver of green innovation investment and exploitation. J. Clean. Prod. 2018, 179, 631–641. [Google Scholar] [CrossRef]
- Hellström, T. Dimensions of environmentally sustainable innovation: The structure of eco-innovation concepts. Sustain. Dev. 2007, 15, 148–159. [Google Scholar] [CrossRef]
- Yuan, B.; Xiang, Q. Environmental regulation, industrial innovation and green development of Chinese manufacturing: Based on an extended CDM model. J. Clean. Prod. 2018, 176, 895–908. [Google Scholar] [CrossRef]
- Fernández Fernández, Y.; Fernández López, M.A.; Olmedillas Blanco, B. Innovation for sustainability: The impact of R&D spending on CO2 emissions. J. Clean. Prod. 2018, 172, 3459–3467. [Google Scholar]
- Ramanathan, R.; He, Q.; Black, A.; Ghobadian, A.; Gallear, D. Environmental regulations, innovation and firm performance: A revisit of the Porter hypothesis. J. Clean. Prod. 2017, 155, 79–92. [Google Scholar] [CrossRef]
- Hansen, E.G.; Grosse-Dunker, F.; Reichwald, R. Sustainability Innovation Cube—A Framework to Evaluate Sustainability-Oriented Innovations. Int. J. Innov. Manag. 2011, 13, 683–713. [Google Scholar] [CrossRef]
- Liu, X.; Guo, P.; Guo, S. Assessing the eco-efficiency of a circular economy system in China’s coal mining areas: Emergy and data envelopment analysis. J. Clean. Prod. 2019, 206, 1101–1109. [Google Scholar] [CrossRef]
- Li, K.; Song, M. Green Development Performance in China: A Metafrontier Non-Radial Approach. Sustainability 2016, 8, 219. [Google Scholar] [CrossRef]
- Wei, Y.-M.; Chen, H.; Chyong, C.K.; Kang, J.-N.; Liao, H.; Tang, B.-J. Economic dispatch savings in the coal-fired power sector: An empirical study of China. Energy Econ. 2018, 74, 330–342. [Google Scholar] [CrossRef]
- Gu, W.; Zhao, X.; Yan, X.; Wang, C.; Li, Q. Energy technological progress, energy consumption, and CO2 emissions: Empirical evidence from China. J. Clean. Prod. 2019, 236, 117666. [Google Scholar] [CrossRef]
- Farrell, M.J. The Measurement of Productive Efficiency. J. R. Stat. Soc. Ser. A 1957, 120, 253–290. [Google Scholar] [CrossRef]
- Hall, B.H.; Griliches, Z.; Hausman, J.A. Patents and R and D: Is There a Lag? Int. Econ. Rev. 1986, 27, 265. [Google Scholar] [CrossRef]
- Acs, Z.J.; Anselin, L.; Varga, A. Patents and innovation counts as measures of regional production of new knowledge. Res. Policy 2002, 31, 1069–1085. [Google Scholar] [CrossRef]
- Chen, C.-M.; Delmas, M.A.; Lieberman, M.B. Production frontier methodologies and efficiency as a performance measure in strategic management research. Strateg. Manag. 2015, 36, 19–36. [Google Scholar] [CrossRef]
- Lee, H.Y.; Park, Y.T. An international comparison of R&D efficiency: DEA approach. Asian J. Technol. Innov. 2005, 13, 207–222. [Google Scholar]
- Sharma, S.; Thomas, V.J. Inter-country R&D efficiency analysis: An application of data envelopment analysis. Scientometrics 2008, 76, 483–501. [Google Scholar]
- Guan, J.; Chen, K. Modeling macro-R&D production frontier performance: An application to Chinese province-level R&D. Scientometrics 2009, 82, 165–173. [Google Scholar]
- Karadayi, M.A.; Ekinci, Y. Evaluating R&D performance of EU countries using categorical DEA. Technol. Anal. Strateg. 2018, 31, 227–238. [Google Scholar]
- Wang, X.; Wu, Q.; Majeed, S.; Sun, D. Fujian’s Industrial Eco-Efficiency: Evaluation Based on SBM and the Empirical Analysis of lnfluencing Factors. Sustainability 2018, 10, 3333. [Google Scholar] [CrossRef]
- He, B.; Wang, J.; Wang, J.; Wang, K. The Impact of Government Competition on Regional R&D Efficiency: Does Legal Environment Matter in China’s Innovation System? Sustainability 2018, 10, 4401. [Google Scholar]
- Dai, X.; Wu, J.; Yan, L. A Spatial Evolutionary Study of Technological Innovation Talents’ Sticky Wages and Technological Innovation Efficiency Based on the Perspective of Sustainable Development. Sustainability 2018, 10, 4201. [Google Scholar] [CrossRef]
- Chen, K.; Kou, M.; Fu, X. Evaluation of multi-period regional R&D efficiency: An application of dynamic DEA to China’s regional R&D systems. Omega 2018, 74, 103–114. [Google Scholar]
- Anderson; Stejskal, Diffusion Efficiency of Innovation among EU Member States: A Data Envelopment Analysis. Economies 2019, 7, 34. [CrossRef]
- Belgin, O. Analysing R&D efficiency of Turkish regions using data envelopment analysis. Technol. Anal. Strateg. 2019, 31, 1341–1352. [Google Scholar]
- Cao, S.; Feng, F.; Chen, W.; Zhou, C. Does market competition promote innovation efficiency in China’s high-tech industries? Technol. Anal. Strateg. 2019, 32, 429–442. [Google Scholar] [CrossRef]
- Hong, J.; Hong, S.; Wang, L.; Xu, Y.; Zhao, D. Government grants, private R&D funding and innovation efficiency in transition economy. Technol. Anal. Strateg. 2015, 27, 1068–1096. [Google Scholar]
- Hou, B.; Hong, J.; Wang, H.; Zhou, C. Academia-industry collaboration, government funding and innovation efficiency in Chinese industrial enterprises. Technol. Anal. Strateg. 2018, 31, 692–706. [Google Scholar] [CrossRef]
- Qin, X.; Du, D. Measuring universities’ R&D performance in China’s provinces: A multistage efficiency and effectiveness perspective. Technol. Anal. Strateg. 2018, 30, 1392–1408. [Google Scholar]
- Yang, F.; Cheng, Y.; Yao, X. Influencing factors of energy technical innovation in China: Evidence from fossil energy and renewable energy. J. Clean. Prod. 2019, 232, 57–66. [Google Scholar] [CrossRef]
- Wicki, S.; Hansen, E.G. Green technology innovation: Anatomy of exploration processes from a learning perspective. Bus. Strategy. Environ. 2019, 28, 970–988. [Google Scholar] [CrossRef] [PubMed]
- Luo, Q.; Miao, C.; Sun, L.; Meng, X.; Duan, M. Efficiency evaluation of green technology innovation of China’s strategic emerging industries: An empirical analysis based on Malmquist-data envelopment analysis index. J. Clean. Prod. 2019, 238, 117782. [Google Scholar] [CrossRef]
- Li, X. China’s regional innovation capacity in transition: An empirical approach. Res. Policy 2009, 38, 338–357. [Google Scholar] [CrossRef]
- Lin, S.; Sun, J.; Marinova, D.; Zhao, D. Evaluation of the green technology innovation efficiency of China’s manufacturing industries: DEA window analysis with ideal window width. Technol. Anal. Strateg. 2018, 30, 1166–1181. [Google Scholar] [CrossRef]
- Broekel, T.; Rogge, N.; Brenner, T. The innovation efficiency of German regions—A shared-input DEA approach. Rev. Reg. Res. 2017, 38, 77–109. [Google Scholar] [CrossRef]
- Zhang, J.; Liu, Y.; Chang, Y.; Zhang, L. Industrial eco-efficiency in China: A provincial quantification using three-stage data envelopment analysis. J. Clean. Prod. 2017, 143, 238–249. [Google Scholar] [CrossRef]
- Chakraborty, P.; Chatterjee, C. Does environmental regulation indirectly induce upstream innovation? New evidence from India. Res. Policy 2017, 46, 939–955. [Google Scholar] [CrossRef]
- Ambec, S.; Cohen, M.A.; Elgie, S.; Lanoie, P. The Porter Hypothesis at 20: Can Environmental Regulation Enhance Innovation and Competitiveness? Rew. Environ. Econ. Policy 2013, 7, 2–22. [Google Scholar] [CrossRef]
- Rennings, K.; Rammer, C. The Impact of Regulation-Driven Environmental Innovation on Innovation Success and Firm Performance. Ind. Innov. 2011, 18, 255–283. [Google Scholar] [CrossRef]
- Sueyoshi, T.; Yuan, Y.; Goto, M. A literature study for DEA applied to energy and environment. Energy Econ. 2017, 62, 104–124. [Google Scholar] [CrossRef]
- Emrouznejad, A.; Yang, G.-l. A survey and analysis of the first 40 years of scholarly literature in DEA: 1978–2016. Socioecon. Plann. Sci. 2018, 61, 4–8. [Google Scholar] [CrossRef]
- Charnes, A.; Cooper, W.W.; Rhodes, E. Measuring the efficiency of decision making units. Eur. J. Oper. Res. 1978, 2, 429–444. [Google Scholar] [CrossRef]
- Seiford, L.M.; Zhu, J. Modeling undesirable factors in efficiency evaluation. Eur. J. Oper. Res. 2002, 142, 16–20. [Google Scholar] [CrossRef]
- Scheel, H. Undesirable outputs in efficiency valuations. Eur. J. Oper. Res. 2001, 132, 400–410. [Google Scholar] [CrossRef]
- Seiford, L.M.; Zhu, J. A response to comments on modeling undesirable factors in efficiency evaluation. Eur. J. Oper. Res. 2005, 161, 579–581. [Google Scholar] [CrossRef]
- Färe, R.; Grosskopf, S. Modeling undesirable factors in efficiency evaluation: Comment. Eur. J. Oper. Res. 2004, 157, 242–245. [Google Scholar] [CrossRef]
- Tone, K. A slacks-based measure of super-efficiency in data envelopment analysis. Eur. J. Oper. Res. 2002, 143, 32–41. [Google Scholar] [CrossRef]
- Yang, T.; Chen, W.; Zhou, K.; Ren, M. Regional energy efficiency evaluation in China: A super efficiency slack-based measure model with undesirable outputs. J. Clean. Prod. 2018, 198, 859–866. [Google Scholar] [CrossRef]
- Guan, J.; Chen, K. Measuring the innovation production process: A cross-region empirical study of China’s high-tech innovations. Technovation 2010, 30, 348–358. [Google Scholar] [CrossRef]
- Liu, Z.; Chen, X.; Chu, J.; Zhu, Q. Industrial development environment and innovation efficiency of high-tech industry: Analysis based on the framework of innovation systems. Technol. Anal. Strateg. 2017, 30, 434–446. [Google Scholar] [CrossRef]
- Chen, X.; Liu, Z.; Zhu, Q. Performance evaluation of China’s high-tech innovation process: Analysis based on the innovation value chain. Technovation 2018, 74–75, 42–53. [Google Scholar] [CrossRef]
- Wang, K.; Wei, Y.-M.; Zhang, X. A comparative analysis of China’s regional energy and emission performance: Which is the better way to deal with undesirable outputs? Energy Policy 2012, 46, 574–584. [Google Scholar] [CrossRef]
- Jiang, J.; Ye, B.; Xie, D.; Li, J.; Miao, L.; Yang, P. Sector decomposition of China’s national economic carbon emissions and its policy implication for national ETS development. Renew. Sustain. Energy Rev. 2017, 75, 855–867. [Google Scholar] [CrossRef]
- Zhang, Y.-J.; Peng, Y.-L.; Ma, C.-Q.; Shen, B. Can environmental innovation facilitate carbon emissions reduction? Evidence from China. Energy Policy 2017, 100, 18–28. [Google Scholar] [CrossRef]
- Wang, K.; Wei, Y.-M.; Zhang, X. Energy and emissions efficiency patterns of Chinese regions: A multi-directional efficiency analysis. Appl. Energy 2013, 104, 105–116. [Google Scholar] [CrossRef]
- Li, H.; Mu, H.; Zhang, M.; Gui, S. Analysis of regional difference on impact factors of China’s energy—Related CO2 emissions. Energy 2012, 39, 319–326. [Google Scholar] [CrossRef]
- McDonald, J. Using least squares and tobit in second stage DEA efficiency analyses. Eur. J. Oper. Res. 2009, 197, 792–798. [Google Scholar] [CrossRef]
- Nahra, T.A.; Mendez, D.; Alexander, J.A. Employing super-efficiency analysis as an alternative to DEA: An application in outpatient substance abuse treatment. Eur. J. Oper. Res. 2009, 196, 1097–1106. [Google Scholar] [CrossRef]
- Bai, Y.; Song, S.; Jiao, J.; Yang, R. The impacts of government R&D subsidies on green innovation: Evidence from Chinese energy-intensive firms. J. Clean. Prod. 2019, 233, 819–829. [Google Scholar]
- Song, M.; Wang, S.; Sun, J. Environmental regulations, staff quality, green technology, R&D efficiency, and profit in manufacturing. Technol. Forecast. Soc. 2018, 133, 1–14. [Google Scholar]
- Wang, K.; Miao, N.-N.; Xue, K.-K. Does the technology background of the Party Committee Secretary affect firm’s innovation efficiency? Evidence from listed state-owned enterprises in China. Technol. Anal. Strateg. 2019, 1–14. [Google Scholar] [CrossRef]
- Howell, A. ‘Indigenous’ innovation with heterogeneous risk and new firm survival in a transitioning Chinese economy. Res. Policy 2015, 44, 1866–1876. [Google Scholar] [CrossRef]


| Variable Name | Variable Symbol | Explanation | Data Sources |
|---|---|---|---|
| Government funding | GOV | The share of government funding in intramural R&D expenditure of industrial enterprises | China Statistical Yearbook on Science and Technology |
| Technology market maturity | TEC | The ratio of technology market turnover to regional GDP (gross domestic product) | China Statistical Yearbook |
| Industrial structure | IND | The ratio of secondary industry’s outputs to regional GDP | China Statistical Yearbook |
| Environmental regulations | ER | The ratio of completed investment in treatment of industrial pollution to regional GDP | China Statistical Yearbook on Environment |
| Inputs and Outputs | Variable | Unit | Year | Mean | Median | Std. dev. | Min | Max |
|---|---|---|---|---|---|---|---|---|
| Inputs | Research and development (R&D) personnel full-time equivalent | man-year | 2015 | 87,941.567 | 47,113.000 | 114,658.077 | 1285.000 | 441,304.000 |
| 2016 | 90,076.067 | 48,323.000 | 117,232.908 | 1750.000 | 451,885.000 | |||
| R&D expenditure | 10,000 yuan | 2015 | 3,337,890.933 | 2,117,330.000 | 4,165,905.936 | 65,029.000 | 15,205,497.000 | |
| 2016 | 3,606,677.419 | 2,370,531.630 | 4,528,636.543 | 77,055.318 | 16,572,478.303 | |||
| New product development projects | item | 2015 | 10,875.667 | 5948.000 | 15,242.423 | 121.000 | 57,204.000 | |
| 2016 | 13,061.600 | 8001.500 | 18,761.858 | 126.000 | 66,843.000 | |||
| Desirable outputs | Inventions application | piece | 2015 | 9565.733 | 4251.000 | 14,935.162 | 285.000 | 68,168.000 |
| 2016 | 10,687.133 | 4896.000 | 17,532.130 | 267.000 | 86,724.000 | |||
| New product sales | 10,000 yuan | 2015 | 57,538,158.768 | 32,249,944.849 | 76,875,798.012 | 375,097.459 | 283,459,673.033 | |
| 2016 | 61,104,658.339 | 36,141,288.993 | 81,672,698.842 | 982,837.842 | 333,624,190.504 | |||
| Undesirable outputs | SO2 emissions | 10,000 tons | 2015 | 36.744 | 30.315 | 24.646 | 1.700 | 113.450 |
| 2016 | 29.169 | 25.610 | 19.210 | 1.430 | 73.910 | |||
| CO2 emissions | 10,000 tons | 2015 | 41,983.906 | 33,290.580 | 31,106.795 | 4243.483 | 131,314.896 | |
| 2016 | 43,086.715 | 34,832.106 | 32,158.029 | 3435.557 | 126,571.486 |
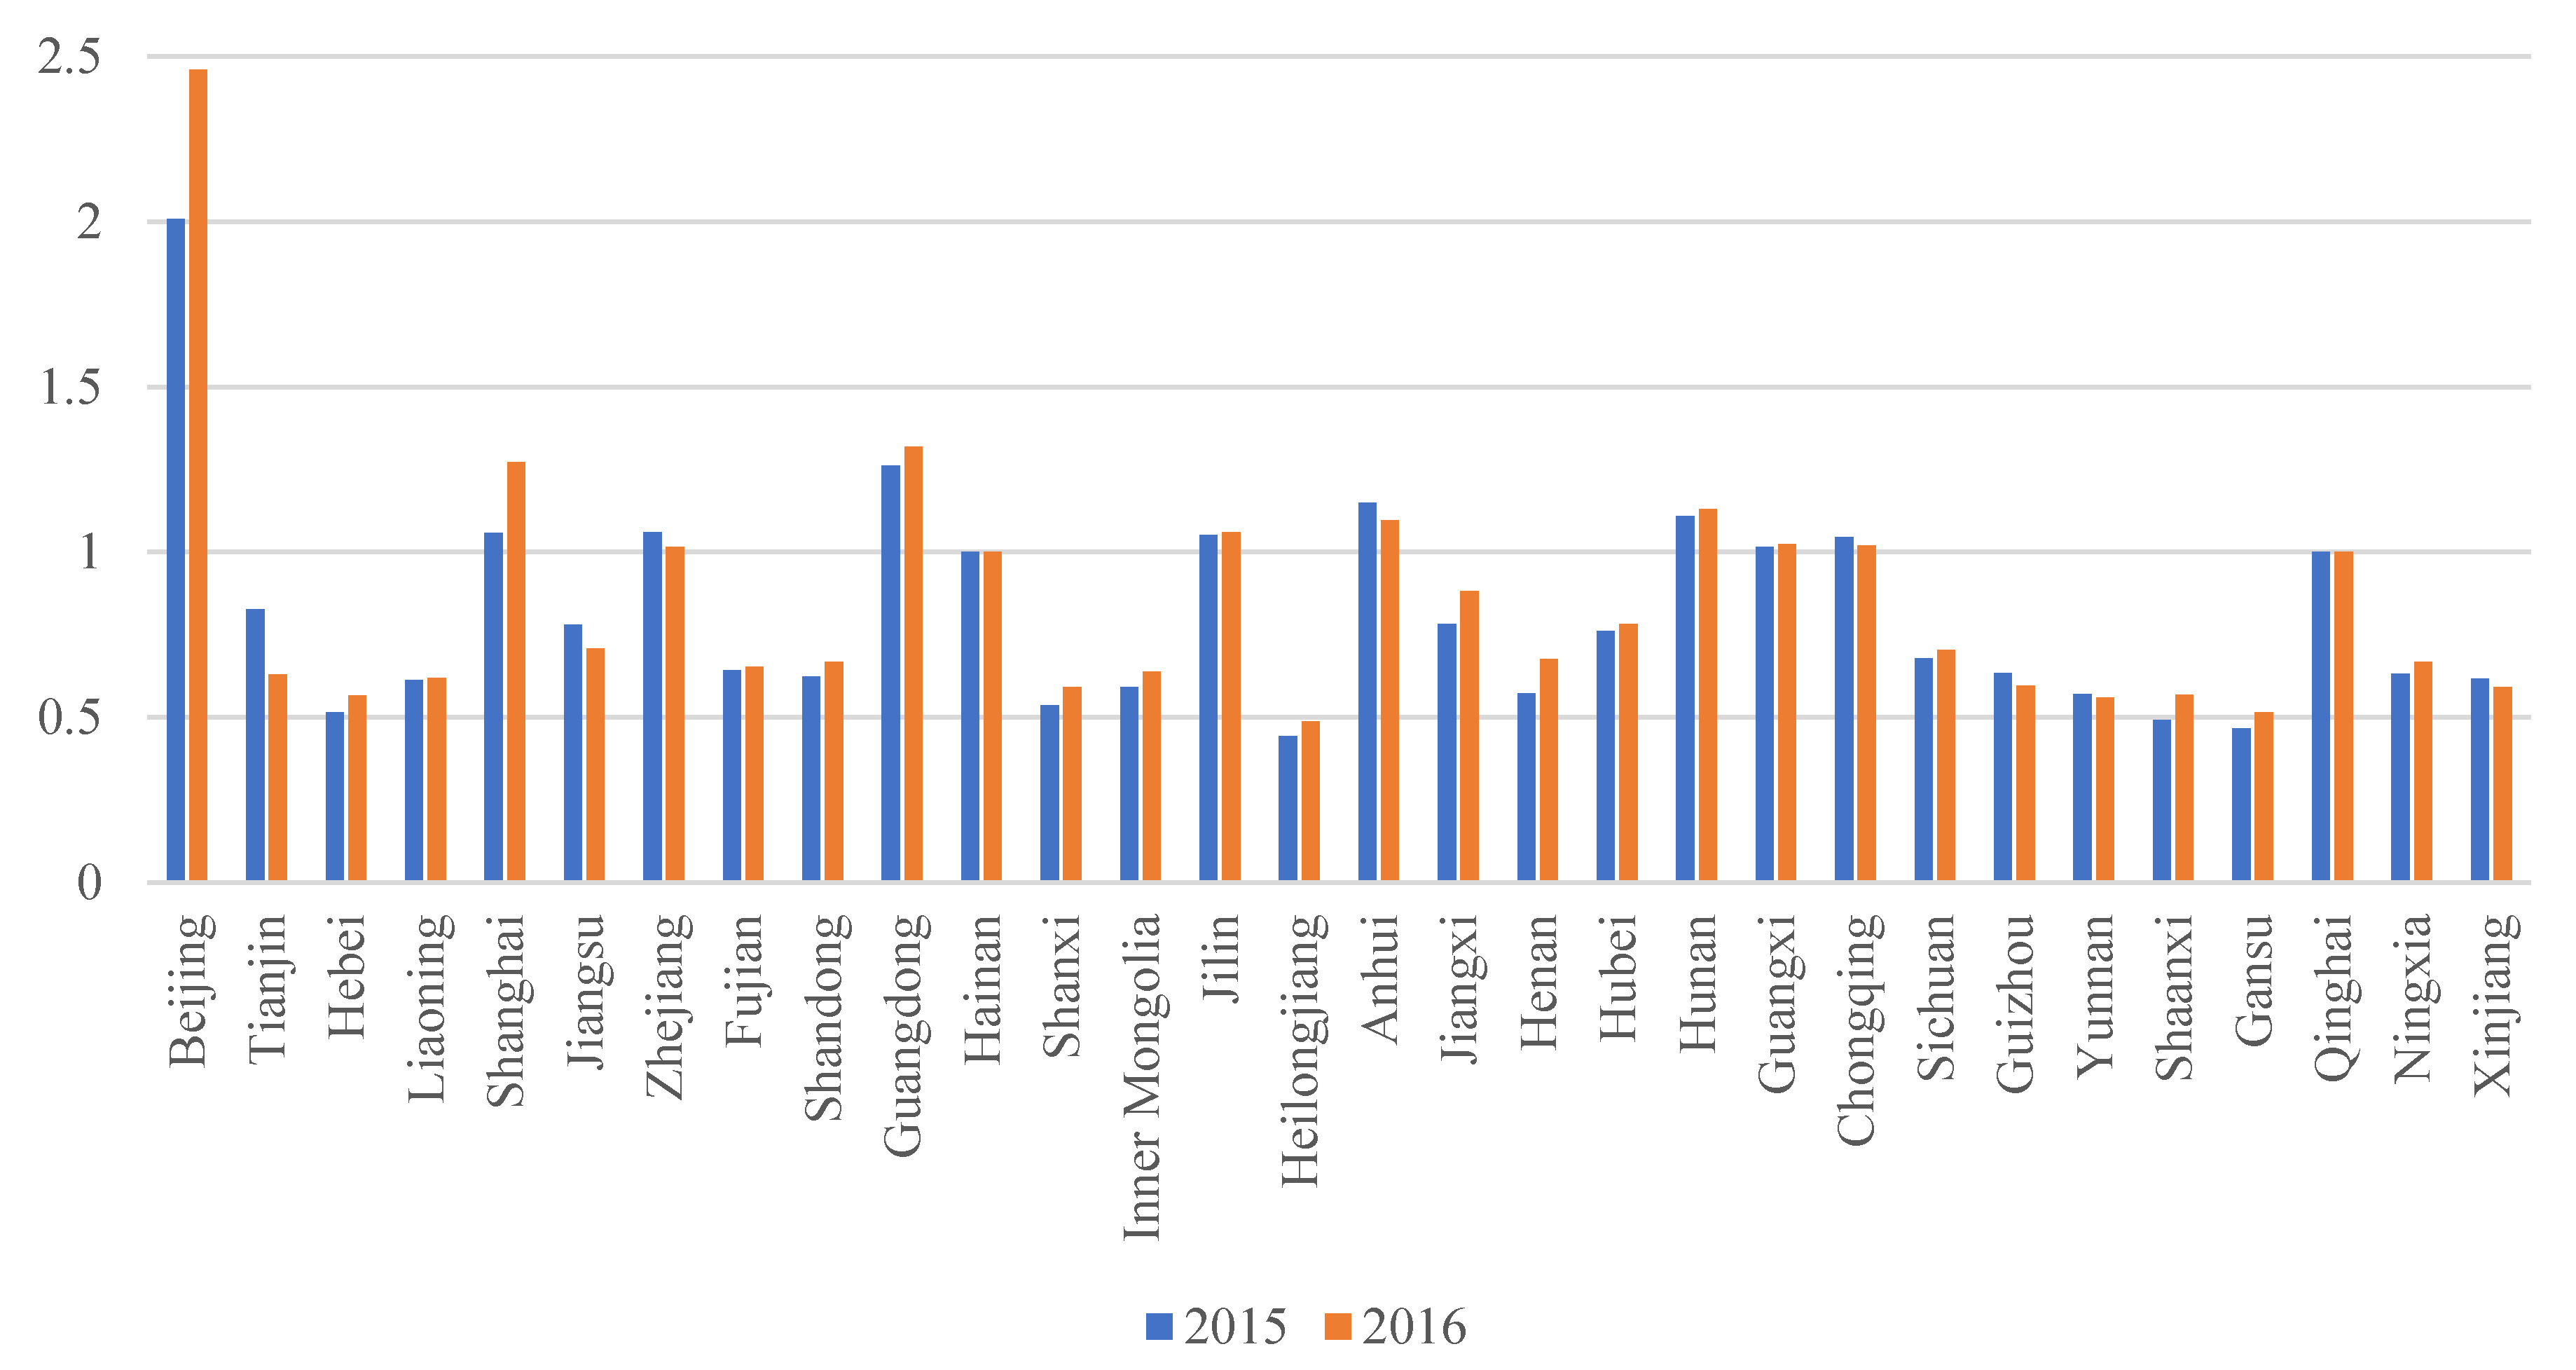
| DMU | 2015 | 2016 | DMU | 2015 | 2016 |
|---|---|---|---|---|---|
| Beijing | 2.007 | 2.460 | Anhui | 1.149 | 1.096 |
| Tianjin | 0.827 | 0.629 | Jiangxi | 0.782 | 0.882 |
| Hebei | 0.516 | 0.566 | Henan | 0.572 | 0.676 |
| Liaoning | 0.613 | 0.619 | Hubei | 0.761 | 0.783 |
| Shanghai | 1.057 | 1.273 | Hunan | 1.110 | 1.131 |
| Jiangsu | 0.779 | 0.707 | Guangxi | 1.015 | 1.023 |
| Zhejiang | 1.060 | 1.017 | Chongqing | 1.045 | 1.020 |
| Fujian | 0.643 | 0.653 | Sichuan | 0.679 | 0.704 |
| Shandong | 0.624 | 0.669 | Guizhou | 0.634 | 0.595 |
| Guangdong | 1.261 | 1.320 | Yunnan | 0.570 | 0.559 |
| Hainan | 1.000 | 1.000 | Shaanxi | 0.493 | 0.569 |
| Shanxi | 0.536 | 0.593 | Gansu | 0.466 | 0.516 |
| Inner Mongolia | 0.591 | 0.638 | Qinghai | 1.000 | 1.000 |
| Jilin | 1.053 | 1.059 | Ningxia | 0.632 | 0.667 |
| Heilongjiang | 0.443 | 0.487 | Xinjiang | 0.617 | 0.591 |
| DMU | 2015 | 2016 | DMU | 2015 | 2016 |
|---|---|---|---|---|---|
| Beijing | 1 | 1 | Anhui | 3 | 5 |
| Tianjin | 12 | 21 | Jiangxi | 13 | 12 |
| Hebei | 27 | 27 | Henan | 24 | 16 |
| Liaoning | 22 | 22 | Hubei | 15 | 13 |
| Shanghai | 6 | 3 | Hunan | 4 | 4 |
| Jiangsu | 14 | 14 | Guangxi | 9 | 7 |
| Zhejiang | 5 | 9 | Chongqing | 8 | 8 |
| Fujian | 17 | 19 | Sichuan | 16 | 15 |
| Shandong | 20 | 17 | Guizhou | 18 | 23 |
| Guangdong | 2 | 2 | Yunnan | 25 | 28 |
| Hainan | 10 | 10 | Shaanxi | 28 | 26 |
| Shanxi | 26 | 24 | Gansu | 29 | 29 |
| Inner Mongolia | 23 | 20 | Qinghai | 10 | 10 |
| Jilin | 7 | 6 | Ningxia | 19 | 18 |
| Heilongjiang | 30 | 30 | Xinjiang | 21 | 25 |
| Coef. | Std. Err. | t | |
|---|---|---|---|
| GOV | −0.008 * | 0.003 | −2.600 |
| TEC | 0.099 *** | 0.099 | 6.740 |
| IND | −0.008 | 0.005 | −1.450 |
| ER | −0.043 | 0.040 | −1.070 |
| _cons | 1.270 *** | 0.268 | 4.730 |
| R-squared | 0.539 | ||
| Adj R-squared | 0.506 | ||
| Root MSE | 0.249 | ||
| F | 16.100 | ||
| Prob. > F | 0.000 |
| Variable | VIF | 1/VIF |
|---|---|---|
| GOV | 1.670 | 0.598 |
| TEC | 1.590 | 0.628 |
| IND | 1.590 | 0.630 |
| ER | 1.010 | 0.985 |
| Mean VIF | 1.470 |
© 2020 by the authors. Licensee MDPI, Basel, Switzerland. This article is an open access article distributed under the terms and conditions of the Creative Commons Attribution (CC BY) license (http://creativecommons.org/licenses/by/4.0/).
Share and Cite
Xu, K.; Loh, L.; Chen, Q. Sustainable Innovation Governance: An Analysis of Regional Innovation with a Super Efficiency Slack-Based Measure Model. Sustainability 2020, 12, 3008. https://doi.org/10.3390/su12073008
Xu K, Loh L, Chen Q. Sustainable Innovation Governance: An Analysis of Regional Innovation with a Super Efficiency Slack-Based Measure Model. Sustainability. 2020; 12(7):3008. https://doi.org/10.3390/su12073008
Chicago/Turabian StyleXu, Kai, Lawrence Loh, and Qiang Chen. 2020. "Sustainable Innovation Governance: An Analysis of Regional Innovation with a Super Efficiency Slack-Based Measure Model" Sustainability 12, no. 7: 3008. https://doi.org/10.3390/su12073008
APA StyleXu, K., Loh, L., & Chen, Q. (2020). Sustainable Innovation Governance: An Analysis of Regional Innovation with a Super Efficiency Slack-Based Measure Model. Sustainability, 12(7), 3008. https://doi.org/10.3390/su12073008