Spatial–Temporal Evolution and Correlation Analysis of Ecosystem Service Value and Landscape Ecological Risk in Wuhu City


Abstract
1. Introduction
2. Materials and Methods
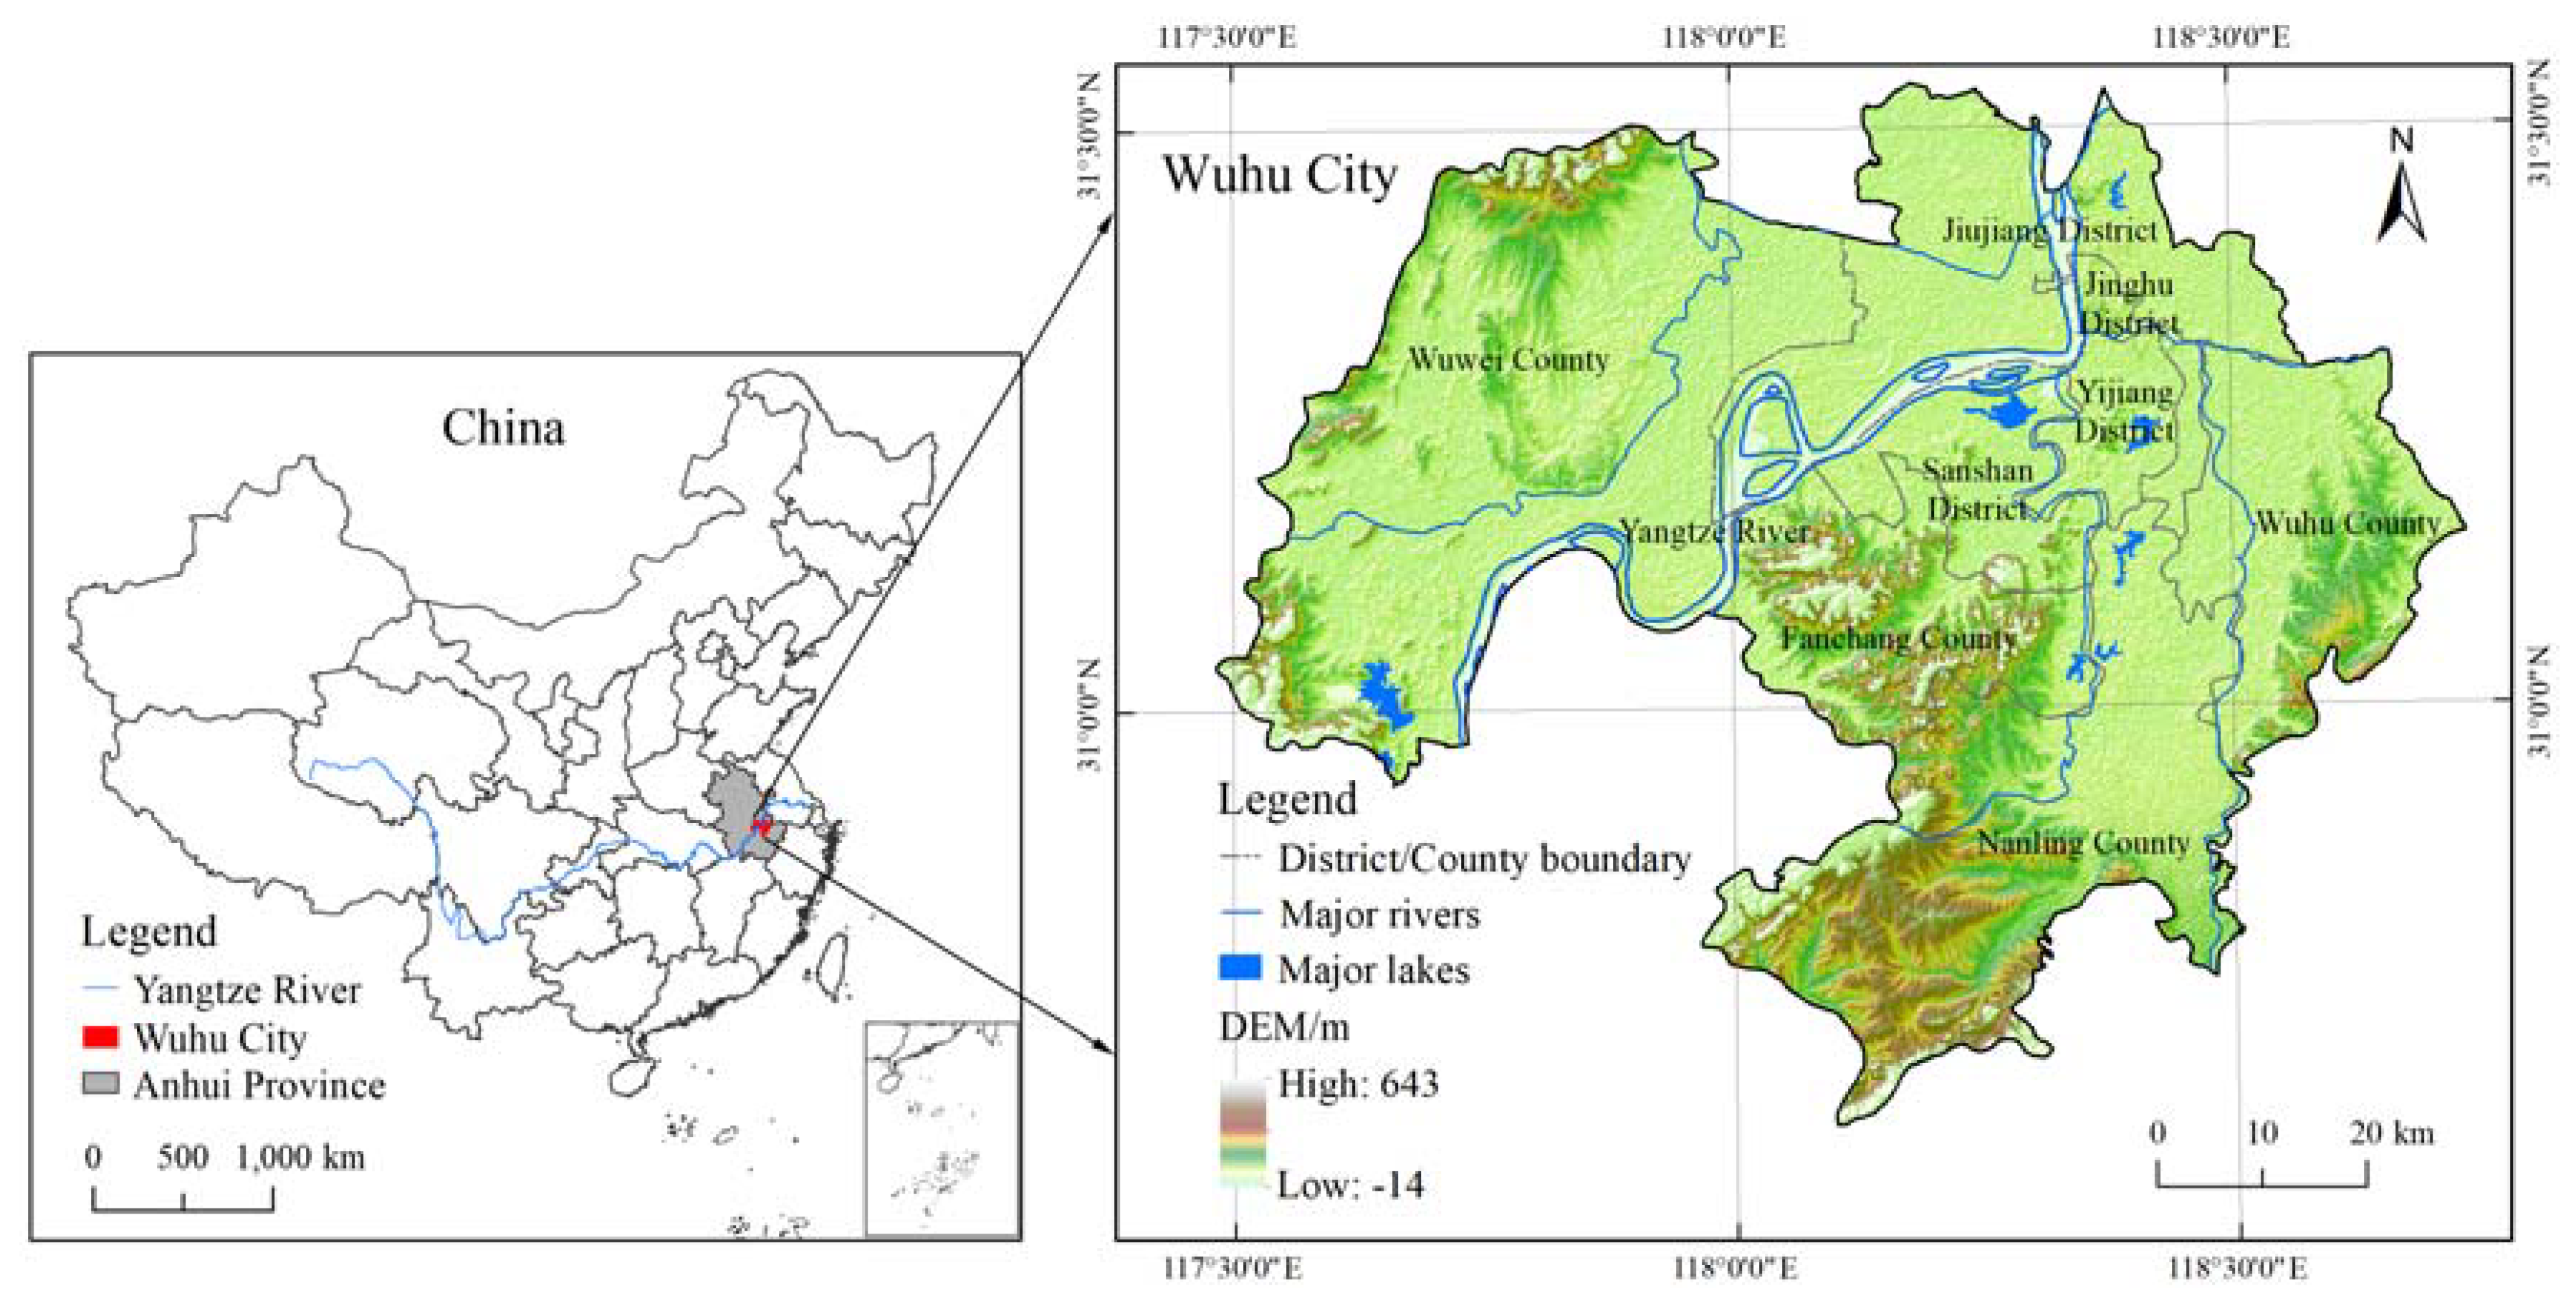
2.1. Study Area
2.2. Data Sources and Processing
2.3. Research Methods
2.3.1. Calculation of Ecosystem Service Value
2.3.2. Calculation of Ecological Risk
2.3.3. Bivariate Spatial Autocorrelation Model
3. Results
3.1. Characteristic Analysis of Ecosystem Service Value
3.1.1. Changes in Various and Individual Ecological Services Value
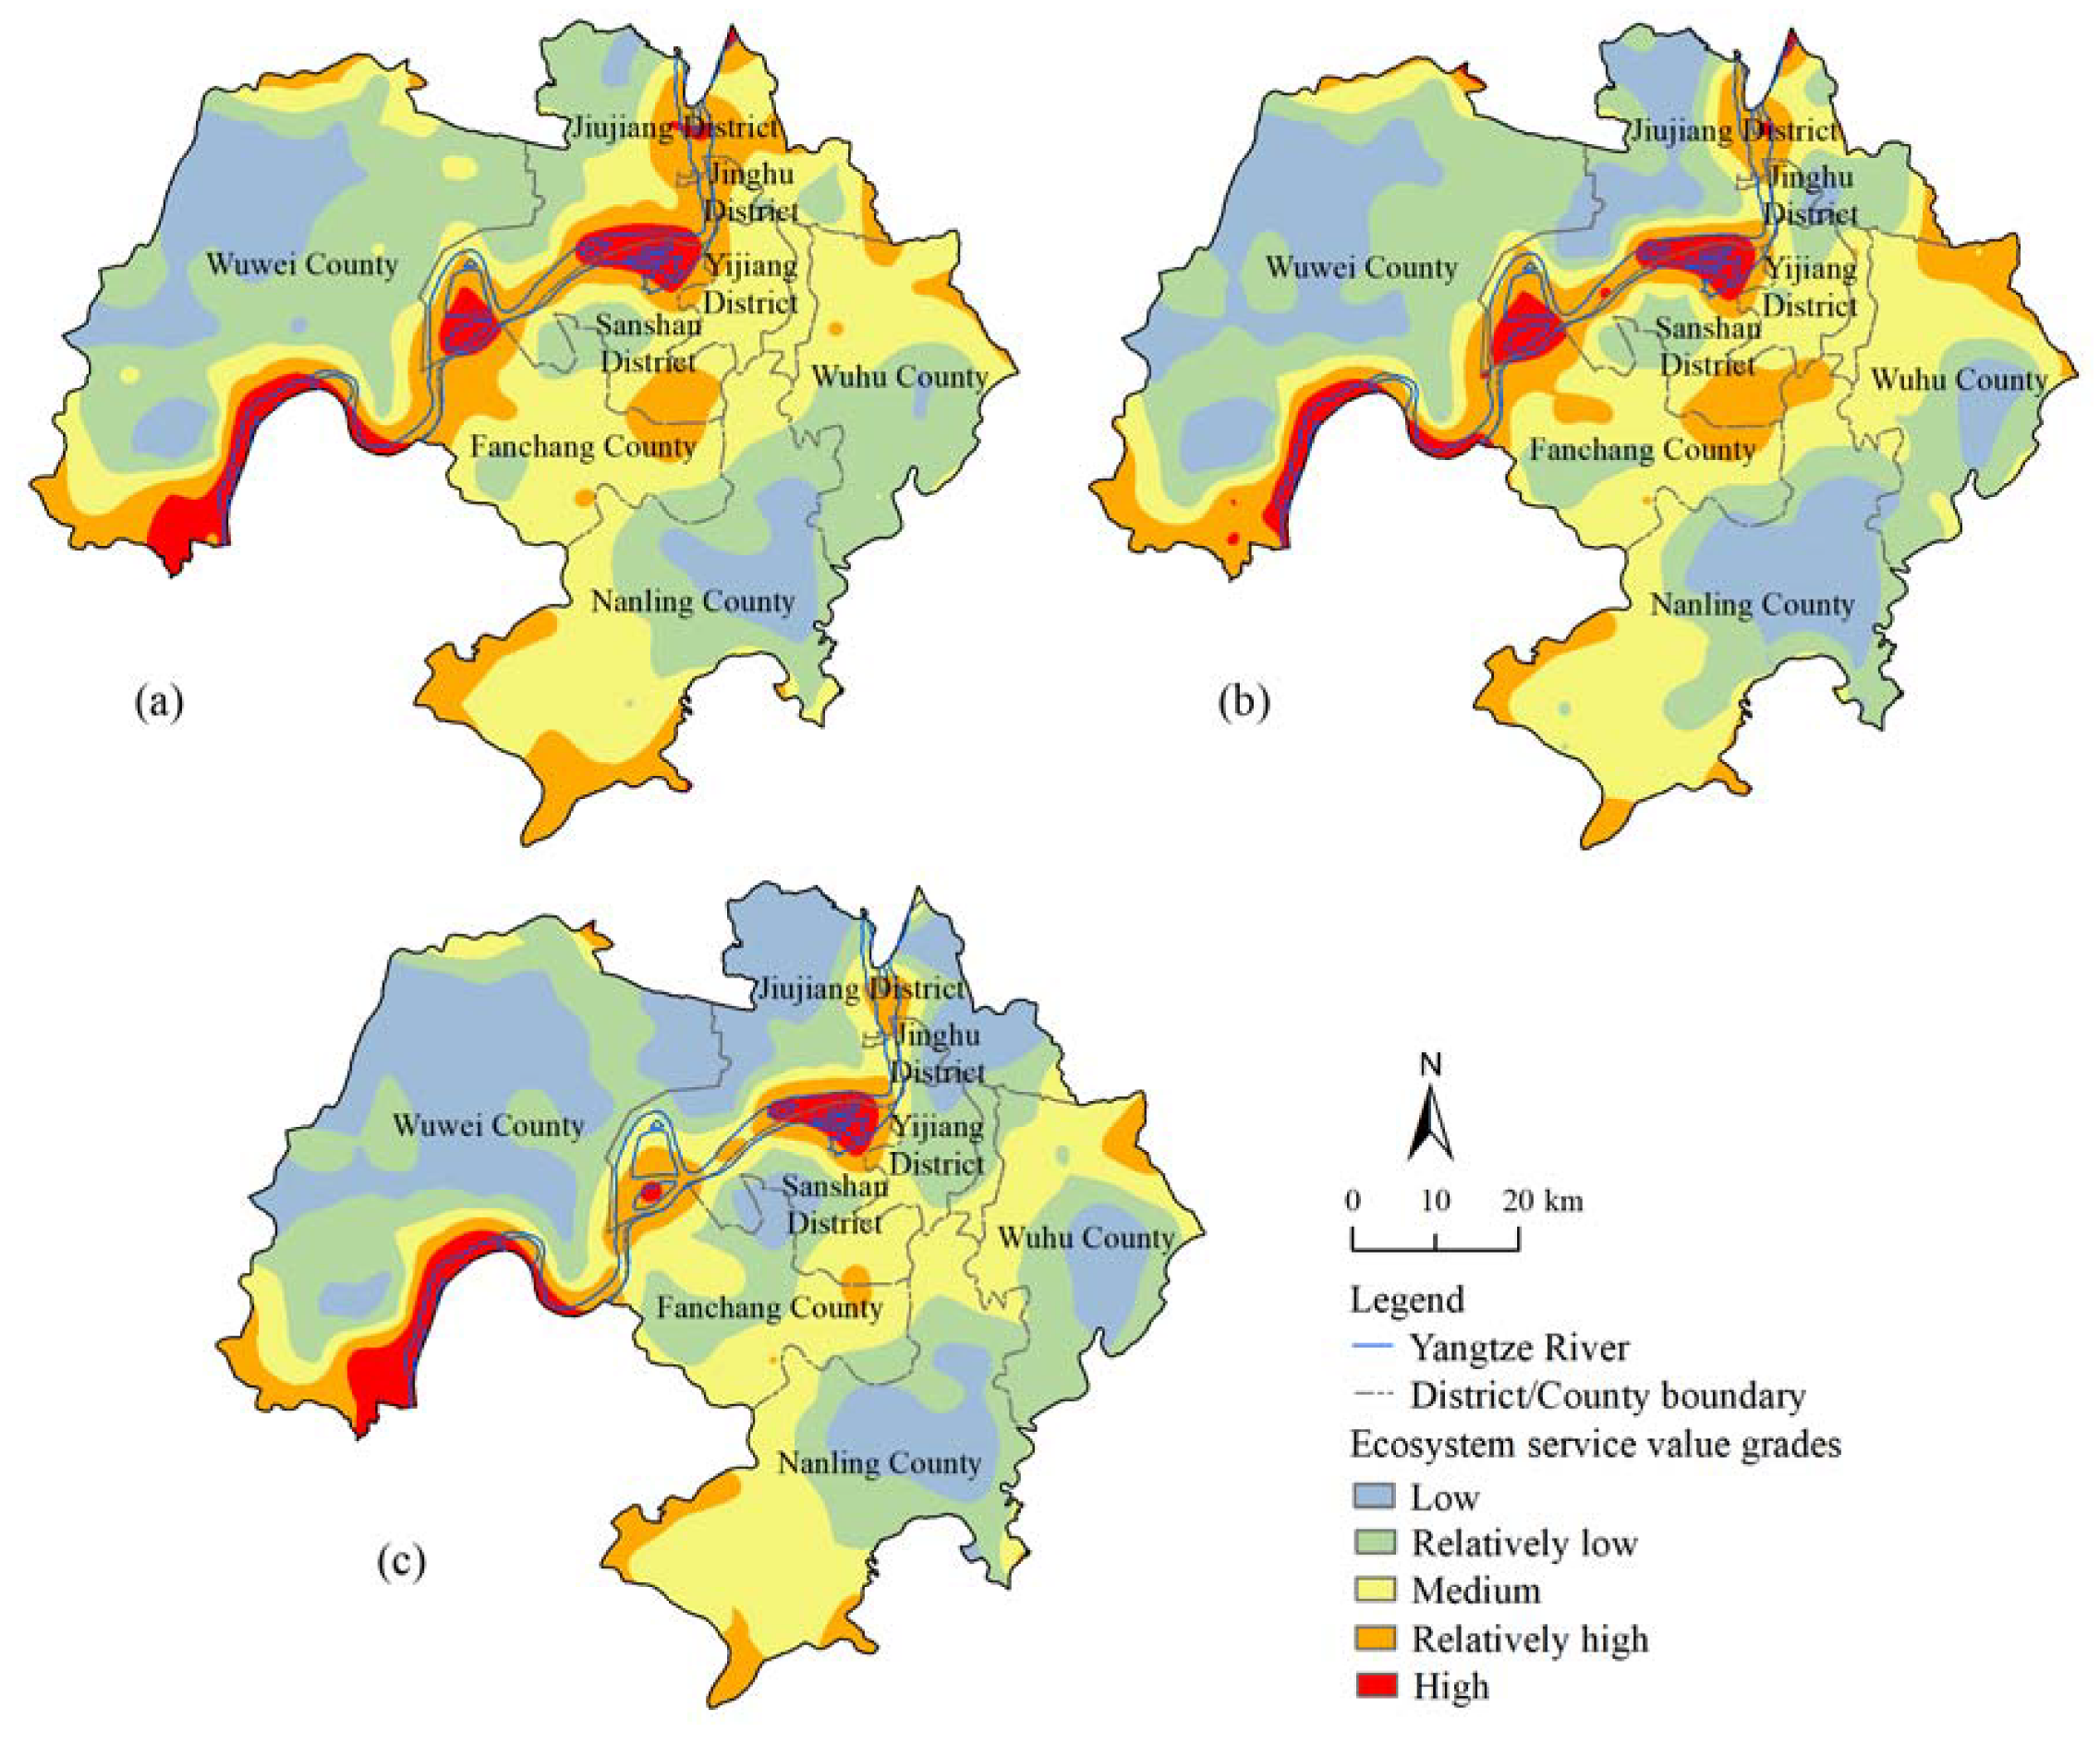
3.1.2. Spatial Pattern of the Total Ecological Service Value per Unit Area
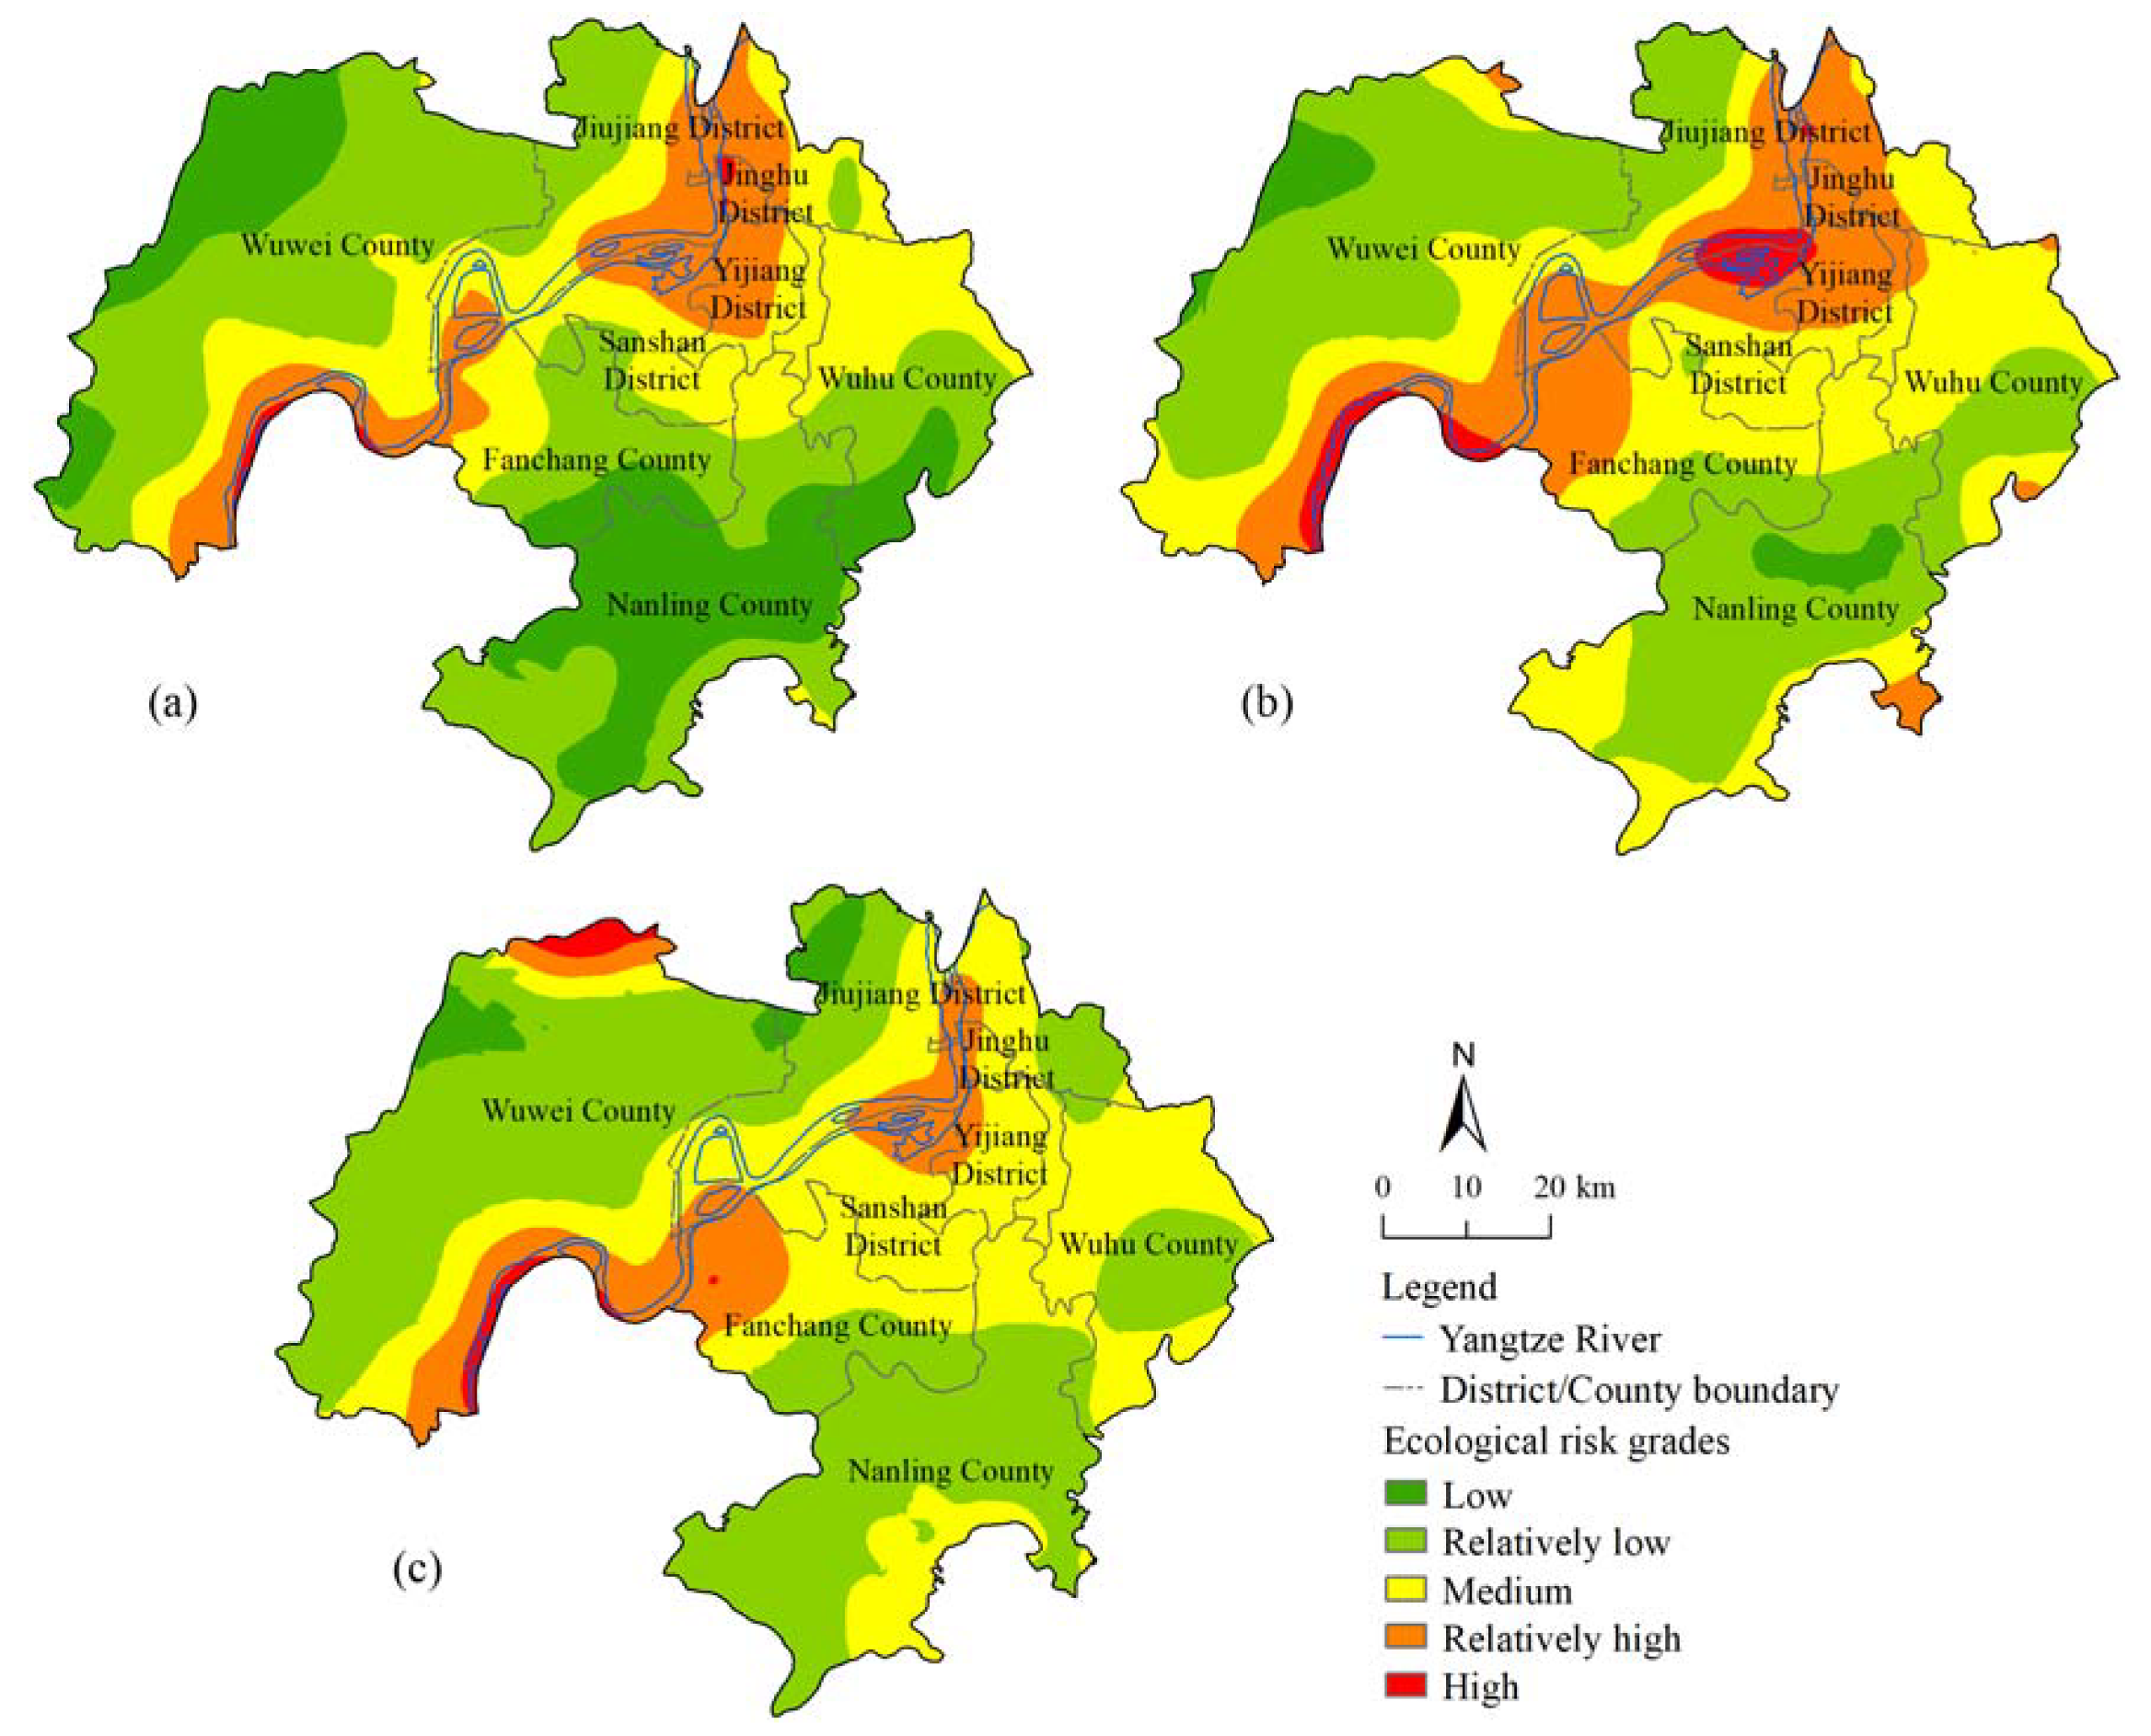
3.2. Characteristic Analysis of Ecological Risk
3.3. Correlation Analysis of Ecosystem Service Value and Ecological Risk
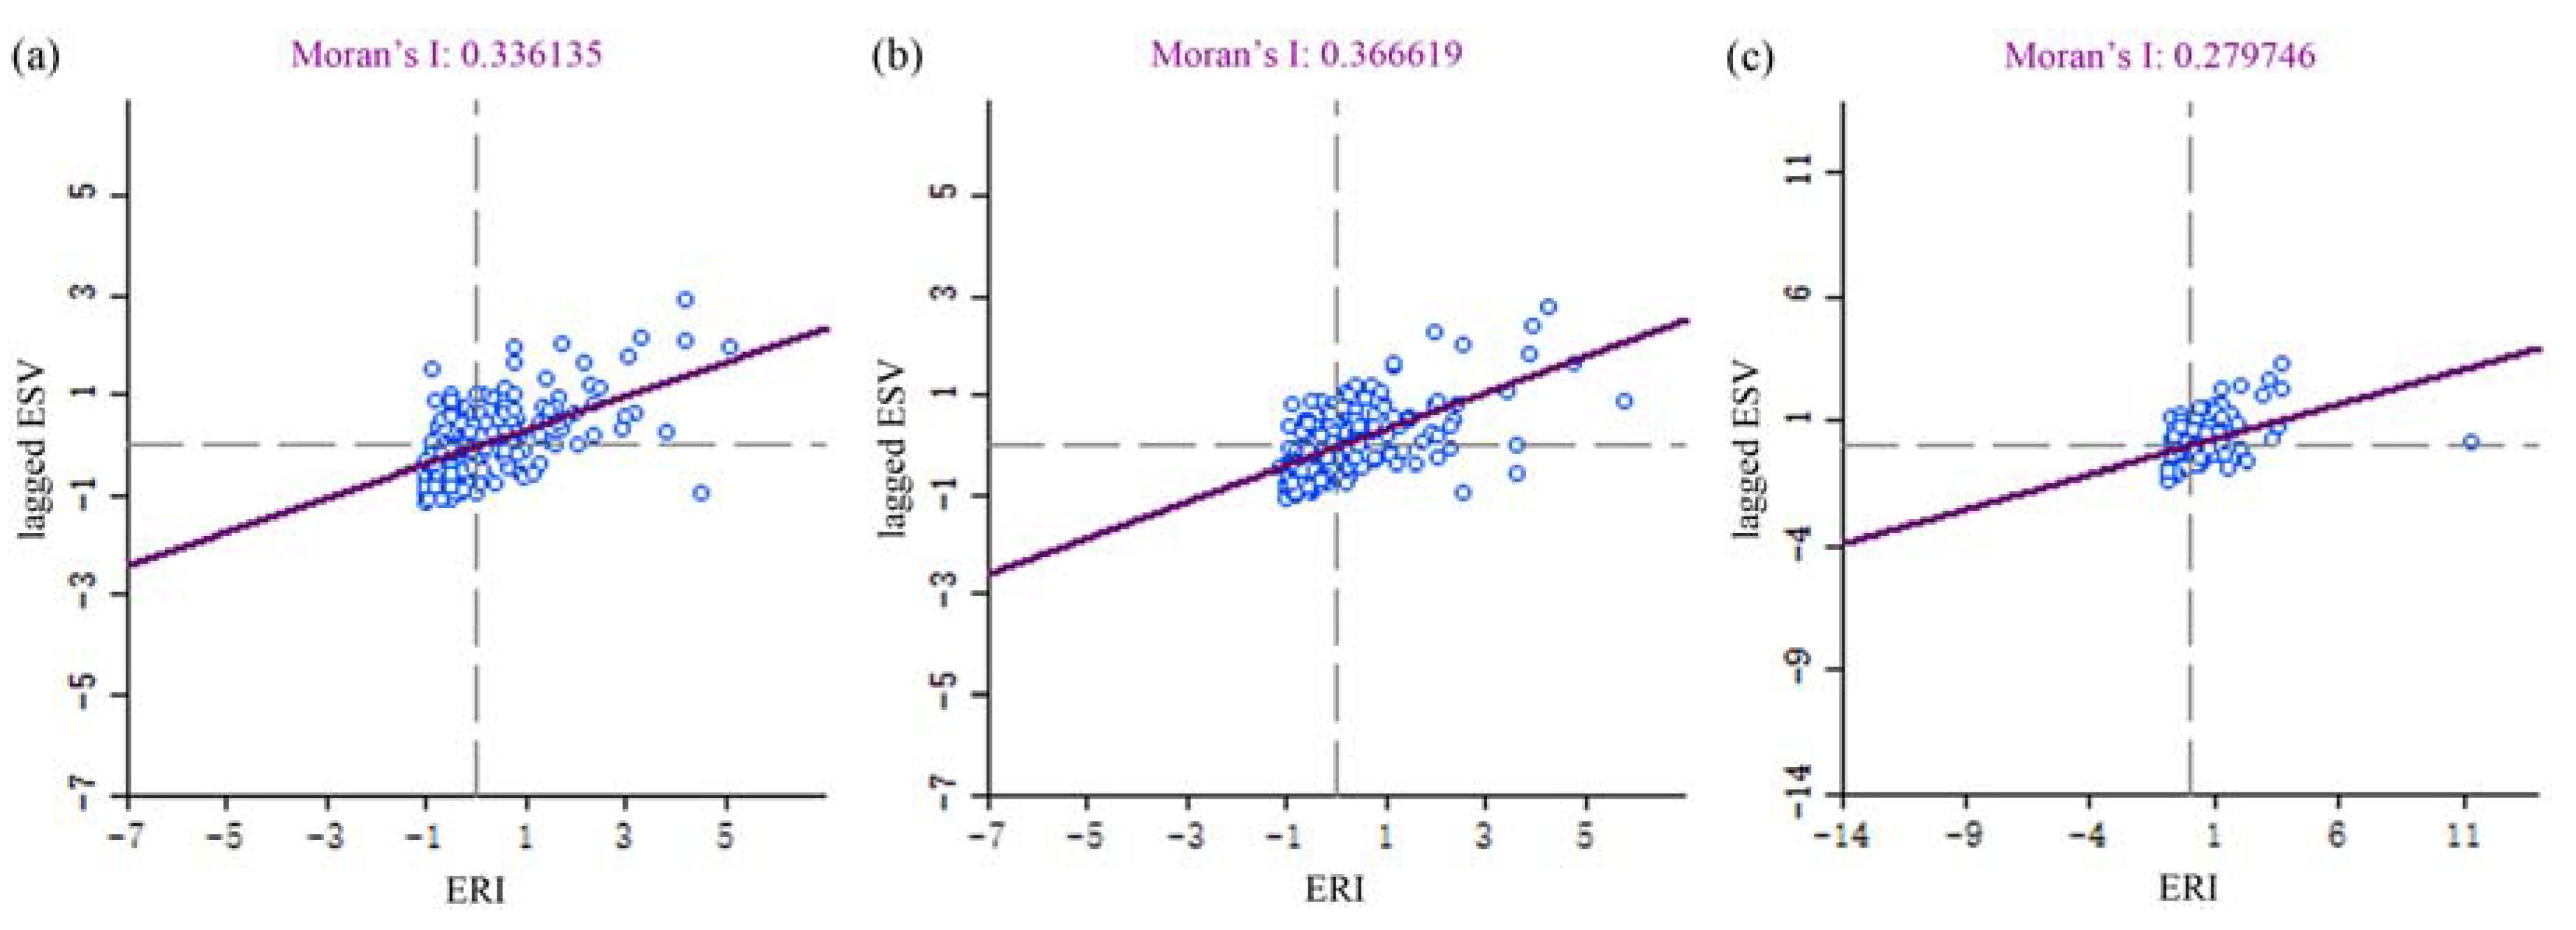
3.3.1. Bivariate Global Spatial Autocorrelation
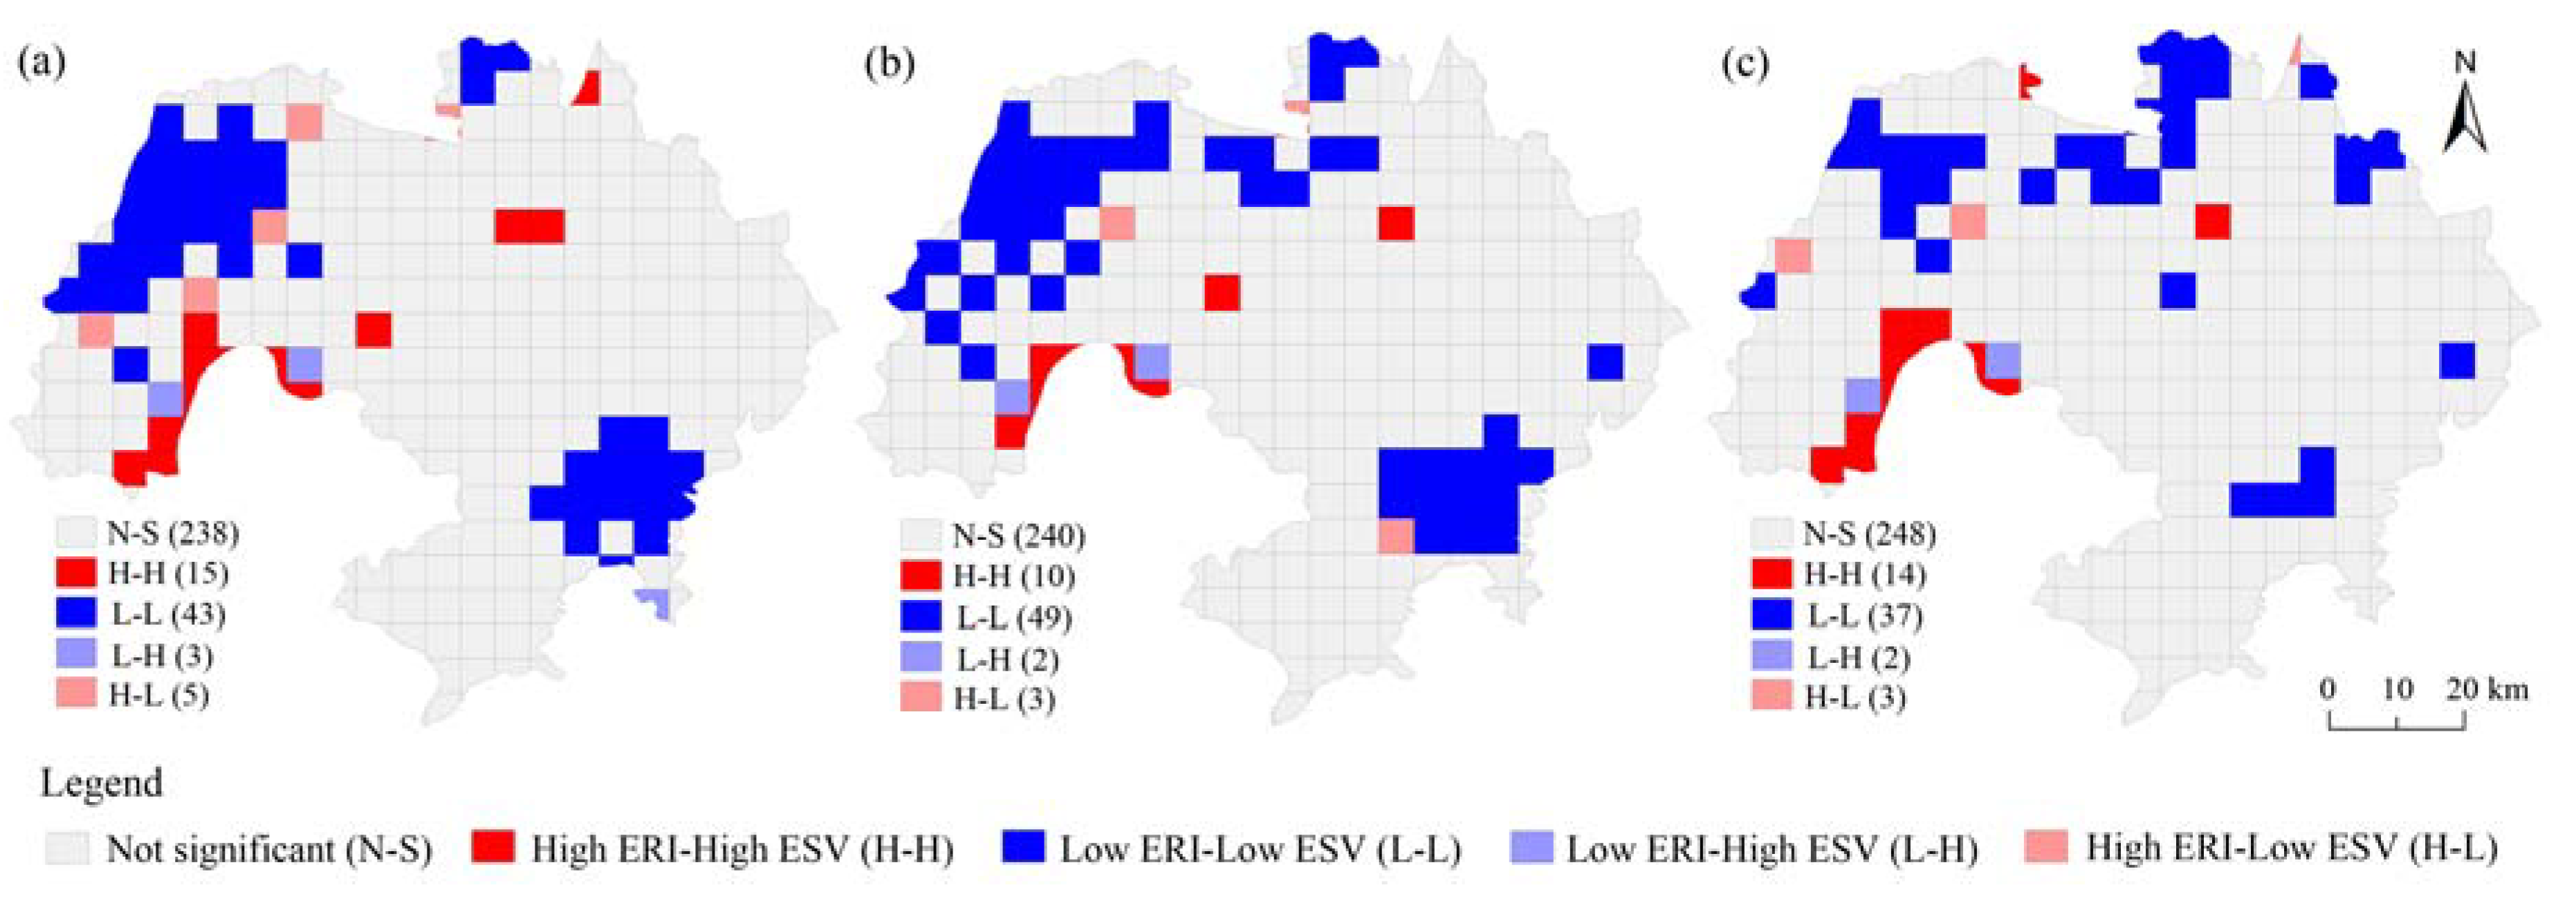
3.3.2. Bivariate Local Space Autocorrelation
4. Discussion
5. Conclusions
Author Contributions
Funding
Conflicts of Interest
References
- Costanza, R.; D’Arge, R.; DeGroot, R.; Farberk, S.; Grasso, M.; Hannon, B.; Limburg, K.; Naeem, S.; O’Neill, R.V.; Paruelo, J.; et al. The value of the world’s ecosystem services and natural capital. Nature 1997, 387, 253–260. [Google Scholar] [CrossRef]
- Costanza, R.; DeGroot, R.; Sutton, P.; Van der Ploeg, S.; Anderson, S.J.; Kubiszewski, I.; Farber, S.; Turner, R.K. Changes in the global value of ecosystem services. Glob. Environ. Chang. 2014, 26, 152–158. [Google Scholar] [CrossRef]
- Daily, G.C. Nature’s services: Societal dependence on natural ecosystems. Pacific Conserv. Biol. 1997, 6, 220–221. [Google Scholar] [CrossRef][Green Version]
- Bratman, G.N.; Anderson, C.B.; Berman, M.G.; Cochran, B.; de Vries, S.; Flanders, J.; Folke, C.; Frumkin, H.; Gross, J.J.; Hartig, T.; et al. Nature and mental health: An ecosystem service perspective. Sci. Adv. 2019, 5, eaax0903. [Google Scholar] [CrossRef] [PubMed]
- De Groot, R.S.; Wilson, M.A.; Boumans, R.M.J. A typology for description, classification and valuation of ecosystem functions, goods and services. Ecol. Econ. 2002, 41, 393–408. [Google Scholar] [CrossRef]
- Millennium Ecosystem Assessment (MEA). Ecosystems and Human Well-Being: Current State and Trends; Island Press: Washington, DC, USA, 2005. [Google Scholar]
- Egoh, B.; Rouget, M.; Reyers, B.; Knight, A. Integrating ecosystem services into conservation assessments: A review. Ecol. Econ. 2007, 63, 714–721. [Google Scholar] [CrossRef]
- Sven, L.; Carolin, K.; Angela, L.; Ralf, S. Analysis of historic changes in regional ecosystem service provisioning using land use data. Ecol. Indic. 2011, 11, 676–687. [Google Scholar] [CrossRef]
- Xie, G.D.; Lu, C.X.; Leng, Y.F.; Zheng, D.; Li, S.C. Ecological assets valuation of the Tibetan plateau. J. Nat. Resour. 2003, 18, 189–196. [Google Scholar] [CrossRef]
- Wang, B.; Lu, S.W. Evaluation of economic forest ecosystem services in China. Chin. J. Appl. Ecol. 2009, 20, 417–425. [Google Scholar] [CrossRef]
- Wang, W.J.; Guo, H.C.; Chuai, X.W.; Dai, C. The impact of land use change on the temporospatial variations of ecosystems services value in China and an optimized land use solution. Environ. Sci. Policy 2014, 44, 62–72. [Google Scholar] [CrossRef]
- Costanza, R. Ecosystem health and ecological engineering. Ecol. Eng. 2012, 45, 24–29. [Google Scholar] [CrossRef]
- Hope, B.K. An examination of ecological risk assessment and management practices. Environ. Int. 2006, 32, 983–995. [Google Scholar] [CrossRef] [PubMed]
- Piet, G.J.; Knights, A.M.; Jongbloed, R.H.; Tamis, J.E.; De Vries, P.; Robinson, L.A. Ecological risk assessments to guide decision-making: Methodology matters. Environ. Sci. Policy 2017, 68, 1–9. [Google Scholar] [CrossRef]
- Peng, J.; Dang, W.X.; Liu, Y.X.; Zong, M.L.; Hu, X.X. Review on landscape ecological risk assessment. Acta Geogr. Sin. 2015, 70, 664–677. [Google Scholar] [CrossRef]
- Deepika, M.; Mohammad, A.M.; Shalini, R.; Kumar, J.P. Spatio-temporal variations in landscape ecological risk related to road network in the Central Himalaya. Hum. Ecol. Risk Assess. 2020. [Google Scholar] [CrossRef]
- Cao, Q.W.; Zhang, X.W.; Ma, H.K.; Wu, J.S. Review of landscape ecological risk and an assessment framework based on ecological services: ESRISK. Acta Geogr. Sin. 2018, 73, 843–855. [Google Scholar] [CrossRef]
- Xie, H.L.; Wang, P.; Huang, H.S. Ecological risk assessment of land use change in the Poyang Lake eco-economic zone, China. Int. J. Environ. Res. Public Health 2013, 10, 328–346. [Google Scholar] [CrossRef]
- Perrodin, Y.; Boillot, C.; Angerville, R.; Donguy, G.; Emmanuel, E. Ecological risk assessment of urban and industrial systems: A review. Sci. Total Environ. 2011, 409, 5162–5176. [Google Scholar] [CrossRef]
- Goldstein, J.H.; Caldarone, G.; Duarte, T.K.; Ennaanay, D.; Hannahs, N.; Mendoza, G.; Polasky, S.; Wolny, S.; Daily, G.C. Integrating ecosystem-service tradeoffs into land-use decisions. Proc. Natl. Acad. Sci. USA 2012, 109, 7565–7570. [Google Scholar] [CrossRef]
- Chen, F.; Li, H.B.; Zhang, A.L. Ecological risk assessment based on terrestrial ecosystem services in China. Acta Geogr. Sin. 2019, 74, 432–445. [Google Scholar] [CrossRef]
- Liao, J.F.; Jia, Y.Q.; Tang, L.N.; Huang, Q.L.; Wang, Y.Y.; Huang, N.; Hua, L.Z. Assessment of urbanization-induced ecological risks in an area with significant ecosystem services based on land use/cover change scenarios. Int. J. Sust. Dev. World Ecol. 2017, 25, 448–457. [Google Scholar] [CrossRef]
- Dong, T.; Xu, W.H.; Zheng, H.; Xiao, Y.; Kong, L.Q.; Ouyang, Z.Y. A framework for regional ecological risk warning based on ecosystem service approach: A case study in Ganzi, China. Sustainability 2018, 10, 2699. [Google Scholar] [CrossRef]
- Liu, S.H.; Wang, D.Y.; Lei, G.P.; Li, H.; Li, W.B. Elevated risk of ecological land and underlying factors associated with rapid urbanization and overprotected agriculture in Northeast China. Sustainability 2019, 11, 6203. [Google Scholar] [CrossRef]
- Fan, J.H.; Wang, Y.; Zhou, Z.; You, N.S.; Meng, J.J. Dynamic ecological risk assessment and management of land use in the Middle Reaches of the Heihe River based on landscape patterns and spatial statistics. Sustainability 2016, 8, 536. [Google Scholar] [CrossRef]
- Xie, G.D.; Zhang, C.X.; Zhang, L.M.; Chen, W.H.; Li, S.M. Improvement of the evaluation method for ecosystem service value based on per unit area. J. Nat. Resour. 2015, 30, 1243–1254. [Google Scholar] [CrossRef]
- Chen, W.X.; Zhao, H.B.; Li, J.F.; Zhu, L.J.; Wang, Z.Y.; Zeng, J. Land use transitions and the associated impacts on ecosystem services in the Middle Reaches of the Yangtze River Economic Belt in China based on the geo-informatic Tupu method. Sci. Total Environ. 2020, 701, 134690. [Google Scholar] [CrossRef] [PubMed]
- Kindu, M.; Schneider, T.; Teketay, D.; Knoke, T. Changes of ecosystem service values in response to land use/land cover dynamics in Munessa–Shashemene landscape of the Ethiopian highlands. Sci. Total Environ. 2016, 547, 137–147. [Google Scholar] [CrossRef] [PubMed]
- Zhou, S.Y.; Chang, J.; Hu, T.H.; Luo, P.J.; Zhou, H.X. Spatiotemporal variations of land use and landscape ecological risk in a resource-based city, from rapid development to recession. Pol. J. Environ. Stud. 2020, 29, 475–490. [Google Scholar] [CrossRef]
- Liu, Y.C.; Liu, Y.X.; Li, J.L.; Lu, W.Y.; Wei, X.L.; Sun, C. Evolution of landscape ecological risk at the optimal scale: A case study of the open coastal wetlands in Jiangsu, China. Int. J. Environ. Res. Public Health 2018, 15, 1691. [Google Scholar] [CrossRef] [PubMed]
- Tian, P.; Gong, H.B.; Ye, M.Y.; Shi, X.L.; Wang, L.J.; Liu, R.Q.; Tong, C. Landscape pattern change and ecological risk assessment of the continental coast of the East China Sea. Mar. Sci. Bull. 2018, 37, 695–706. [Google Scholar] [CrossRef]
- Xu, X.G.; Lin, H.P.; Fu, Z.Y.; Bu, R.C. Regional ecological risk assessment of wetland in the Huanghe River Delta. Acta Sci. Nat. Univ. Pekin. 2001, 37, 111–120. [Google Scholar] [CrossRef]
- Dale, V.H.; Brown, S.; Haeuber, R.A.; Hobbs, N.T.; Huntly, N.; Naiman, R.J.; Riebsame, W.E.; Turner, M.G.; Valone, T.J. Ecological principles and guidelines for managing the use of land. Ecol. Appl. 2000, 10, 639–670. [Google Scholar] [CrossRef]
- Anselin, L. Local indicators of spatial association—LISA. Geogr. Anal. 1995, 27, 93–115. [Google Scholar] [CrossRef]
- Ord, J.K.; Getis, A. Local spatial autocorrelation statistics: Distributional issues and an application. Geogr. Anal. 1995, 27, 286–306. [Google Scholar] [CrossRef]
- Wartenberg, D. Multivariate spatial correlation: A method for exploratory geographical analysis. Geogr. Anal. 1985, 17, 263–283. [Google Scholar] [CrossRef]
- Anselin, L.; Syabri, I.; Smirnov, O. Visualizing multivariate spatial correlation with dynamically linked windows. In New Tools for Spatial Data Analysis, Proceedings of the Specialist Meeting, Santa Barbara, CA, USA, 22 June 2002; Anselin, L., Rey, S., Eds.; University of California: Santa Barbara, CA, USA, 2012. [Google Scholar]
- Souris, M.; Bichaud, L. Statistical methods for bivariate spatial analysis in marked points. Examples in spatial epidemiology. Spat. Spatiotemporal Epidemiol. 2011, 2, 227–234. [Google Scholar] [CrossRef]
- Cheng, Z.H. The spatial correlation and interaction between manufacturing agglomeration and environmental pollution. Ecol. Indic. 2016, 61, 1024–1032. [Google Scholar] [CrossRef]
- Tian, P.; Li, J.L.; Gong, H.B.; Pu, R.L.; Cao, L.D.; Shao, S.Y.; Shi, Z.Q.; Feng, X.L.; Wang, L.J.; Liu, R.Q. Research on land use changes and ecological risk assessment in Yongjiang River Basin in Zhejiang Province, China. Sustainability 2019, 11, 2817. [Google Scholar] [CrossRef]
- Haase, D.; Schwarz, N.; Strohbach, M.; Kroll, F.; Seppelt, R. Synergies, trade-offs, and losses of ecosystem services in urban regions: An integrated multiscale framework applied to the Leipzig-Halle Region, Germany. Ecol. Soc. 2012, 17, 22. [Google Scholar] [CrossRef]
- Bennett, E.M.; Peterson, G.D.; Gordon, L.J. Understanding relationships among multiple ecosystem services. Ecol. Lett. 2009, 12, 1394–1404. [Google Scholar] [CrossRef]
- Polasky, S.; Nelson, E.; Pennington, D.; Johnson, K.A. The impact of land-use change on ecosystem services, biodiversity and returns to landowners: A case study in the State of Minnesota. Environ. Resour. Econ. 2011, 48, 219–242. [Google Scholar] [CrossRef]
- Fu, B.J.; Wang, S.; Su, C.H.; Martin, F. Linking ecosystem processes and ecosystem services. Curr. Opin. Environ. Sust. 2013, 5, 4–10. [Google Scholar] [CrossRef]


| Service Function | Cultivated Land | Forest Land | Wetland | Bare Land | |||||
|---|---|---|---|---|---|---|---|---|---|
| E. | Value (US$/ha) | E. | Value (US$/ha) | E. | Value (US$/ha) | E. | Value (US$/ha) | ||
| Provisioning services | Food production | 1.00 | 369.43 | 0.10 | 36.94 | 0.20 | 73.89 | 0.01 | 3.69 |
| Raw materials | 0.10 | 36.94 | 2.60 | 960.53 | 0.04 | 14.78 | 0 | 0 | |
| Regulating services | Gas regulation | 0.50 | 184.72 | 3.50 | 1293.02 | 0.90 | 332.49 | 0 | 0 |
| Climate reservation | 0.89 | 328.80 | 2.70 | 997.47 | 8.78 | 3243.64 | 0 | 0 | |
| Water conservation | 0.60 | 221.66 | 3.20 | 1182.19 | 17.94 | 6627.66 | 0.03 | 11.08 | |
| Waste treatment | 1.64 | 605.87 | 1.31 | 483.96 | 18.18 | 6716.33 | 0.01 | 3.69 | |
| Supporting services | Soil conversation | 1.46 | 539.37 | 3.90 | 1440.80 | 0.86 | 317.71 | 0.02 | 7.39 |
| Biodiversity conservation | 0.71 | 262.30 | 3.26 | 1204.36 | 2.50 | 923.59 | 0.34 | 125.61 | |
| Cultural services | Aesthetic landscape | 0.01 | 3.69 | 1.28 | 472.88 | 4.95 | 1828.70 | 0.01 | 3.69 |
| Total | 6.91 | 2552.80 | 21.85 | 8072.16 | 54.35 | 20078.79 | 0.42 | 155.16 | |
| Name | Calculation Formula | Description and Ecological Significance |
|---|---|---|
| Landscape fragmentation index Ci | Reflects the degree of landscape fragmentation; the higher the value is, the lower the internal stability of the landscape unit is, and the greater the corresponding ecological risk [31] | |
| Landscape isolation index Ni | Reflects the separation degree of patch individual distribution in landscape types. Higher Ni values indicate more dispersed landscape distribution and a higher degree of fragmentation [32] | |
| Landscape dominance index Di | Reflects the influence of patches on landscape pattern formation and change. Higher Di values indicate a greater ecological risk [32] | |
| Landscape disturbance index Si | Reflects the degree of ecosystem interference in different landscapes caused by hazards or land use activities [33] | |
| Landscape vulnerability index Fi | Obtained by normalization of expert scores | Represents the sensitivity of different landscape types to external interference, and the higher the value is, the greater the ecological risk [33] |
| Landscape Type | 1995 | 2005 | 2016 | |||
|---|---|---|---|---|---|---|
| Area (km2) | Proportion (%) | Area (km2) | Proportion (%) | Area (km2) | Proportion (%) | |
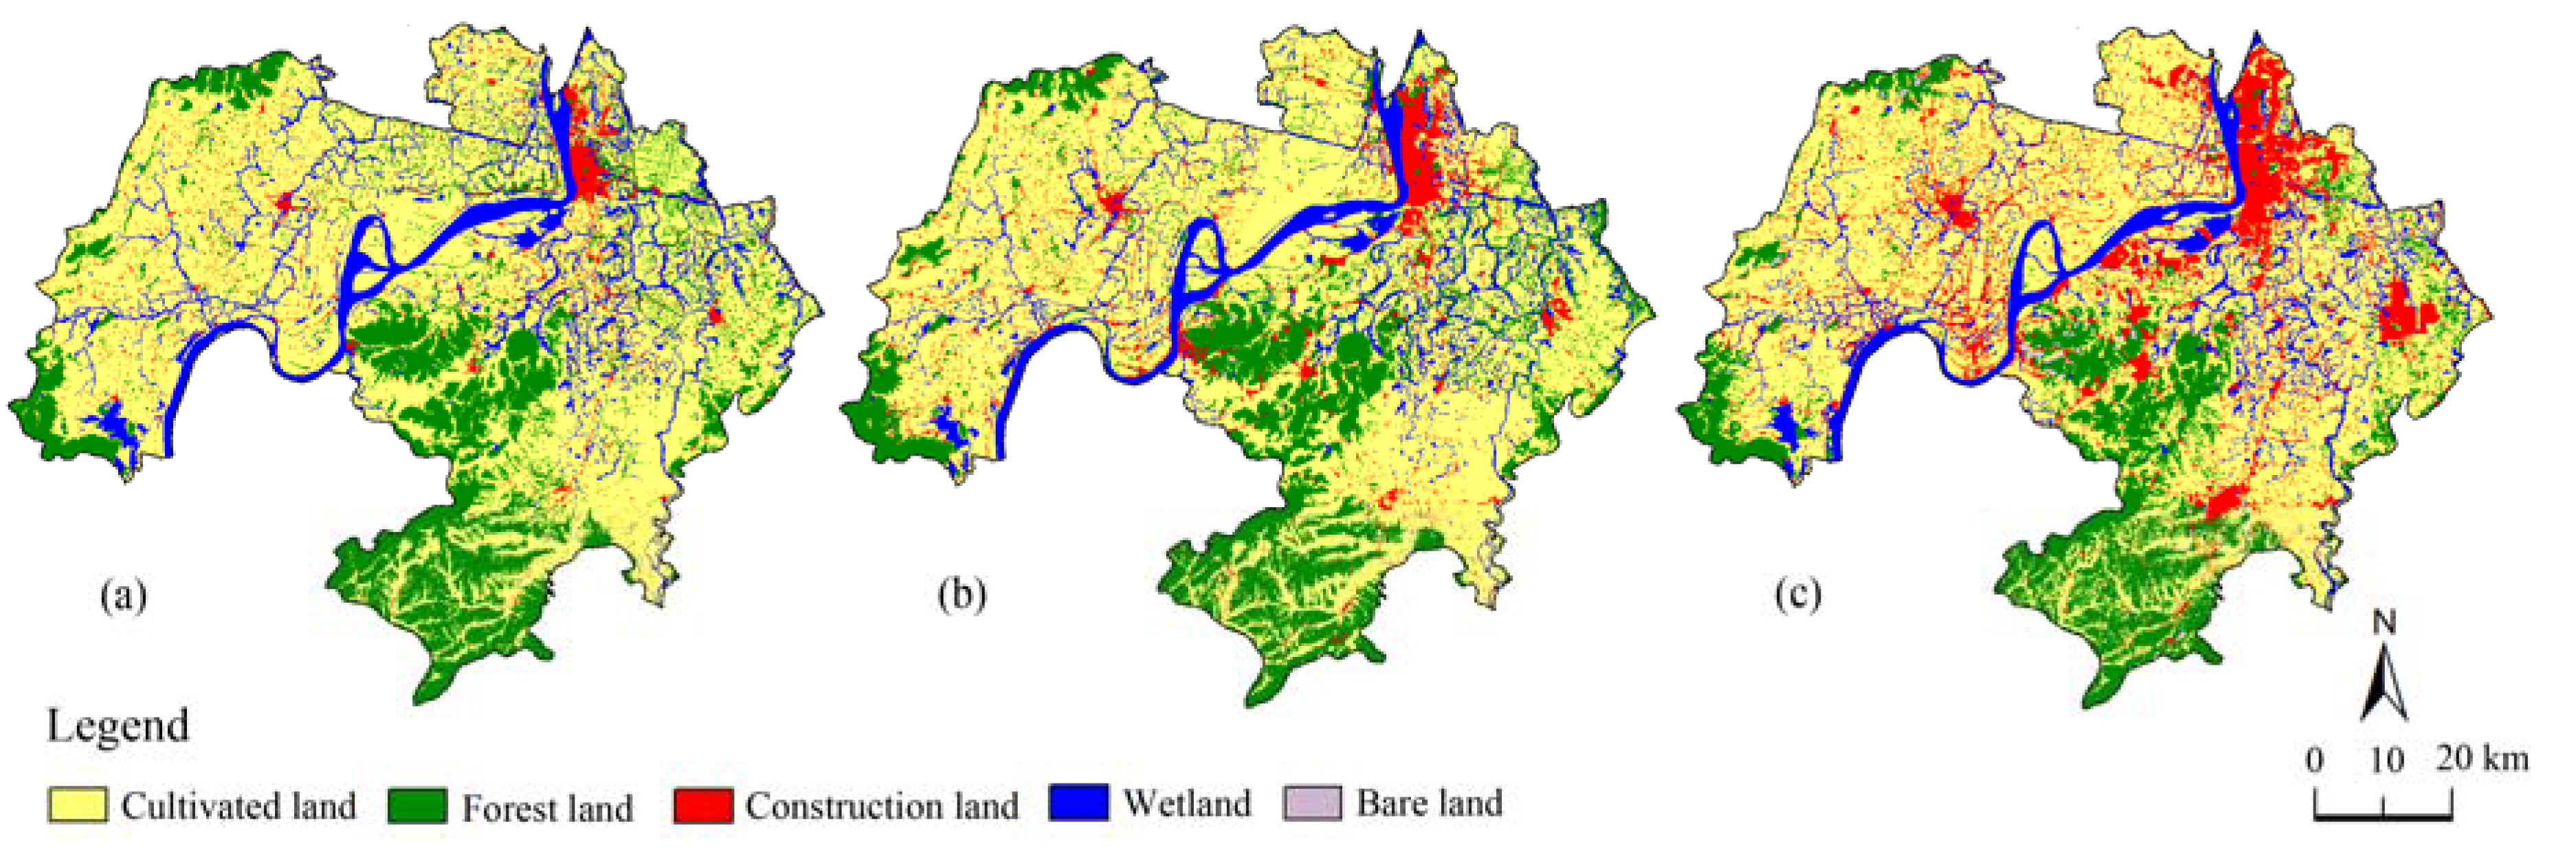
| Cultivated land | 3778.91 | 62.77 | 3731.24 | 61.98 | 3490.12 | 57.97 |
| Forest land | 1331.79 | 22.12 | 1293.40 | 21.48 | 1072.52 | 17.82 |
| Construction land | 255.97 | 4.25 | 396.54 | 6.59 | 814.75 | 13.53 |
| Wetland | 650.62 | 10.81 | 591.64 | 9.83 | 610.22 | 10.14 |
| Bare land | 2.88 | 0.05 | 7.35 | 0.12 | 32.56 | 0.54 |
| Landscape Type | ESV in Each Year (Million US$) | 1995–2005 | 2005–2016 | 1995–2016 | ||
|---|---|---|---|---|---|---|
| 1995 | 2005 | 2016 | Change Rate (%) | Change Rate (%) | Change Rate (%) | |
| Cultivated land | 964.68 | 952.51 | 890.96 | −1.26 | −6.46 | −7.64 |
| Forest land | 1075.04 | 1044.06 | 865.76 | −2.88 | −17.08 | −19.47 |
| Wetland | 1306.36 | 1187.95 | 1225.24 | −9.06 | 3.14 | −6.21 |
| Bare land | 0.04 | 0.11 | 0.51 | 155.03 | 342.97 | 1029.70 |
| Total | 3346.13 | 3184.63 | 2982.46 | −4.83 | −6.35 | −10.87 |
| Types of Ecosystem Services | ESV in Each Year (Million US$) | 1995–2005 | 2005–2016 | 1995–2016 | |||
|---|---|---|---|---|---|---|---|
| First | Secondary | 1995 | 2005 | 2016 | Change Rate (%) | Change Rate (%) | Change Rate (%) |
| Provisioning services | Food production | 149.33 | 147.00 | 137.42 | −1.56 | −6.52 | −7.98 |
| Raw materials | 142.84 | 138.89 | 116.81 | −2.77 | −15.90 | −18.22 | |
| Subtotal | 292.18 | 285.89 | 254.24 | −2.15 | −11.07 | −12.99 | |
| Regulating services | Gas regulation | 263.64 | 255.83 | 223.44 | −2.96 | −12.66 | −15.25 |
| Climate regulation | 468.13 | 443.60 | 419.67 | −5.24 | −5.40 | −10.35 | |
| Water conservation | 672.42 | 627.74 | 608.62 | −6.64 | −3.05 | −9.49 | |
| Waste treatment | 730.38 | 686.03 | 673.22 | −6.07 | −1.87 | −7.83 | |
| Subtotal | 2134.57 | 2013.21 | 1924.95 | −5.69 | −4.38 | −9.82 | |
| Supporting services | Soil conservation | 416.38 | 406.41 | 362.19 | −2.39 | −10.88 | −13.02 |
| Biodiversity conservation | 319.64 | 308.38 | 277.48 | −3.52 | −10.02 | −13.19 | |
| Subtotal | 736.02 | 714.79 | 639.67 | −2.89 | −10.51 | −13.09 | |
| Cultural services | Aesthetic landscape | 183.35 | 170.74 | 163.61 | −6.88 | −4.17 | −10.77 |
| Grade | Area Ratio (%) | 1995–2005 | 2005–2016 | 1995–2016 | |||||
|---|---|---|---|---|---|---|---|---|---|
| 1995 | 2005 | 2016 | Area Change (km2) | Variation (%) | Area Change (km2) | Variation (%) | Area Change (km2) | Variation (%) | |
| Low ESV | 11.80 | 20.68 | 28.15 | 534.89 | 7.53 | 449.75 | 3.28 | 984.64 | 6.60 |
| Relatively low ESV | 33.24 | 31.10 | 31.72 | −128.96 | −0.64 | 37.51 | 0.18 | −91.45 | −0.22 |
| Medium ESV | 33.99 | 29.96 | 27.92 | −242.69 | −1.19 | −122.75 | −0.62 | −365.44 | −0.85 |
| Relatively high ESV | 16.49 | 14.63 | 8.85 | −112.18 | −1.13 | −348.13 | −3.59 | −460.31 | −2.21 |
| High ESV | 4.48 | 3.63 | 3.36 | −51.06 | −1.89 | −16.38 | −0.68 | −67.44 | −1.19 |
| Grade | Area Ratio (%) | 1995–2005 | 2005–2016 | 1995–2016 | |||||
|---|---|---|---|---|---|---|---|---|---|
| 1995 | 2005 | 2016 | Area Change (km2) | Variation (%) | Area Change (km2) | Variation (%) | Area Change (km2) | Variation (%) | |
| Low ERI | 23.16 | 3.89 | 2.83 | −1160.27 | −8.32 | −63.63 | −2.47 | −1223.89 | −4.18 |
| Relatively low ERI | 39.80 | 39.63 | 49.52 | −10.47 | −0.04 | 595.93 | 2.27 | 585.45 | 1.16 |
| Medium ERI | 23.70 | 34.93 | 35.11 | 675.88 | 4.74 | 10.84 | 0.05 | 686.72 | 2.29 |
| Relatively high ERI | 12.92 | 19.07 | 11.53 | 370.22 | 4.76 | −454.38 | −3.60 | −84.16 | −0.52 |
| High ERI | 0.42 | 2.49 | 1.01 | 124.64 | 49.67 | −88.76 | −5.39 | 35.88 | 6.81 |
| Year | Grade | Grade | ||||
|---|---|---|---|---|---|---|
| Low | Relatively Low | Medium | Relatively High | High | ||
| 1995–2005 | Low | 224.36 | 971.02 | 191.66 | 7.45 | 0 |
| Relatively low | 9.86 | 1383.23 | 966.50 | 36.96 | 0 | |
| Medium | 0 | 31.84 | 931.06 | 464.35 | 0 | |
| Relatively high | 0 | 0 | 13.90 | 630.70 | 133.58 | |
| High | 0 | 0 | 0 | 8.94 | 16.15 | |
| 2005–2016 | Low | 70.25 | 163.97 | 0 | 0 | 0 |
| Relatively low | 100.35 | 2003.92 | 240.18 | 31.41 | 10.23 | |
| Medium | 0 | 768.82 | 1298.99 | 15.93 | 19.39 | |
| Relatively high | 0 | 45.30 | 574.80 | 524.51 | 3.80 | |
| High | 0 | 0 | 0 | 122.17 | 27.56 | |
© 2020 by the authors. Licensee MDPI, Basel, Switzerland. This article is an open access article distributed under the terms and conditions of the Creative Commons Attribution (CC BY) license (http://creativecommons.org/licenses/by/4.0/).
Share and Cite
Jia, Y.; Tang, X.; Liu, W. Spatial–Temporal Evolution and Correlation Analysis of Ecosystem Service Value and Landscape Ecological Risk in Wuhu City. Sustainability 2020, 12, 2803. https://doi.org/10.3390/su12072803
Jia Y, Tang X, Liu W. Spatial–Temporal Evolution and Correlation Analysis of Ecosystem Service Value and Landscape Ecological Risk in Wuhu City. Sustainability. 2020; 12(7):2803. https://doi.org/10.3390/su12072803
Chicago/Turabian StyleJia, Yanyan, Xiaolan Tang, and Wei Liu. 2020. "Spatial–Temporal Evolution and Correlation Analysis of Ecosystem Service Value and Landscape Ecological Risk in Wuhu City" Sustainability 12, no. 7: 2803. https://doi.org/10.3390/su12072803
APA StyleJia, Y., Tang, X., & Liu, W. (2020). Spatial–Temporal Evolution and Correlation Analysis of Ecosystem Service Value and Landscape Ecological Risk in Wuhu City. Sustainability, 12(7), 2803. https://doi.org/10.3390/su12072803