Life Cycle Analysis of a Geothermal Power Plant: Comparison of the Environmental Performance with Other Renewable Energy Systems

 ,
, 
 ,
,  and
and
Abstract

1. Introduction
2. Materials and Method
2.1. Life Cycle Analysis (LCA)
- Goal and scope definition: In this phase, the goal of the study, the system boundaries, the quality requisites of the data sources are described, and the functional unit of the analysis is specified.
- Life cycle inventory analysis (LCI): The purpose of this phase is to collect the input/output data pertinent to the system studied; generally robust and reliable LCIs are built on primary data, that is to say specific data that highly characterize the system under study.
- Life cycle impact assessment (LCIA): This phase evaluates the significant potential environmental impacts using the LCI results; the process involves associating inventory data with specific environmental impact categories and the calculation of indicator values using accepted characterization factors.
- Life cycle interpretation: It is the final phase of an LCA study in which the results of the LCI and LCIA steps are presented and discussed; interpretation includes conclusions and recommendations adapted to the goal and scope of the study.
2.2. Case Studies
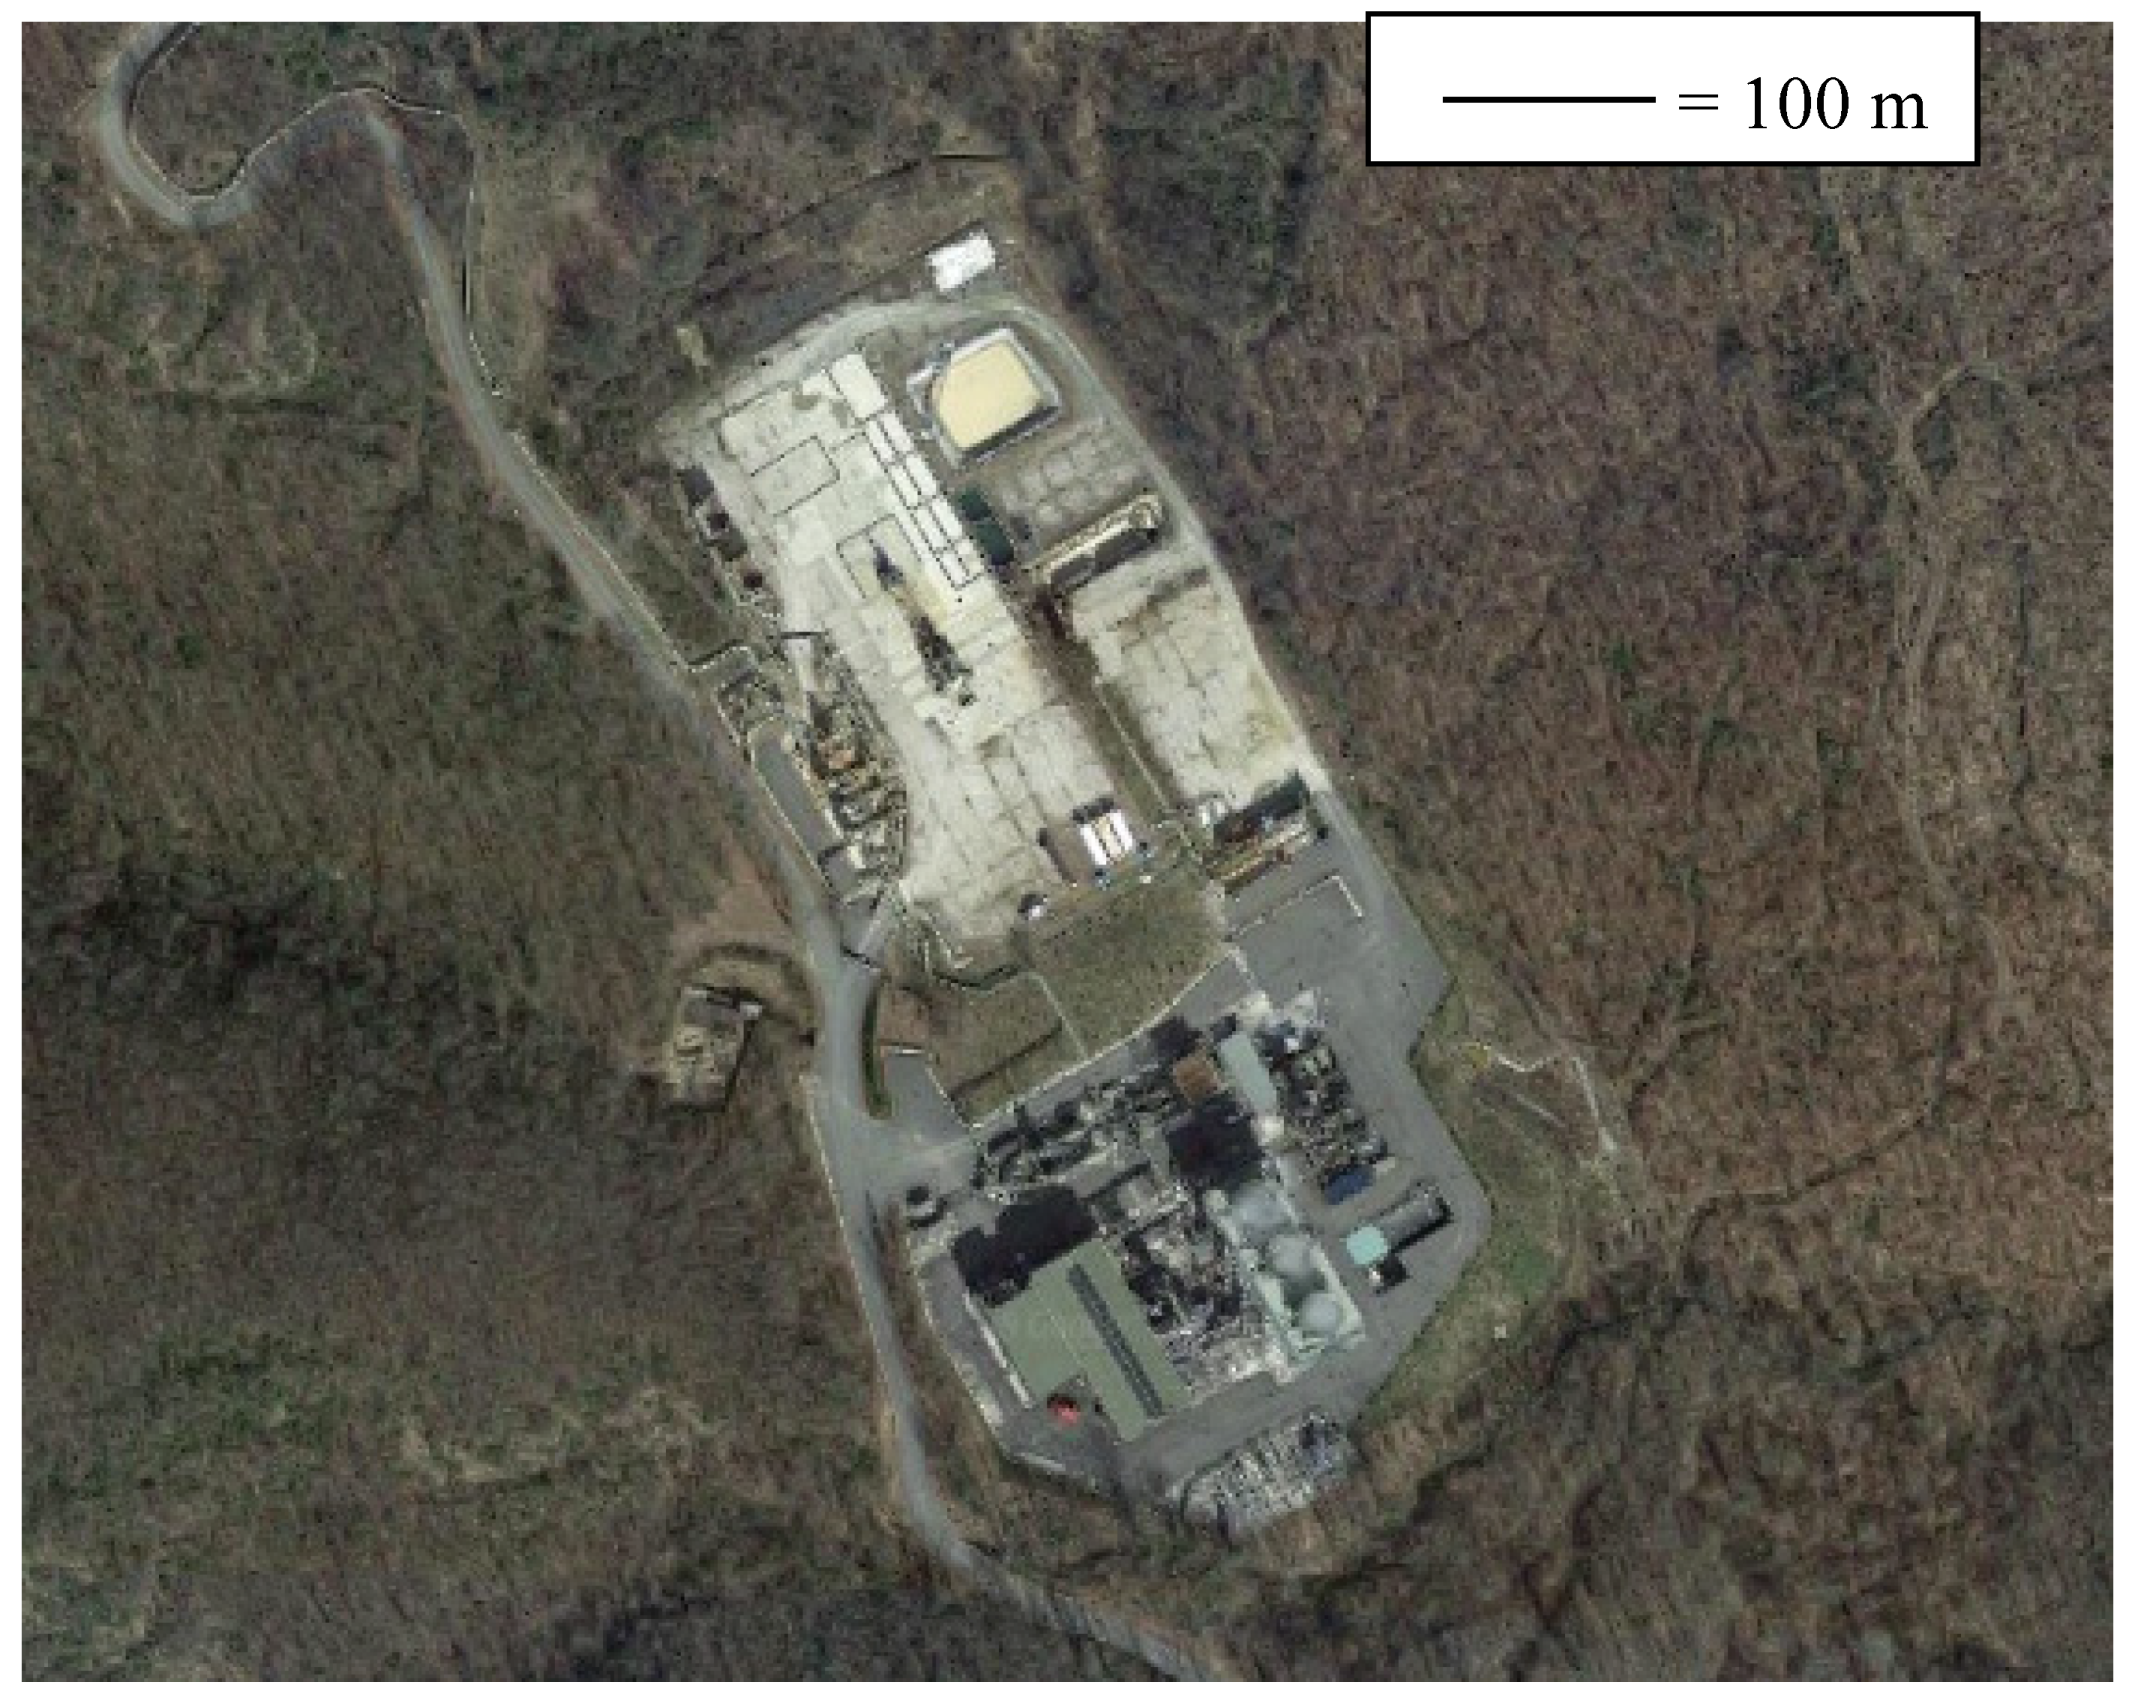
2.2.1. Chiusdino Geothermal Power Plant
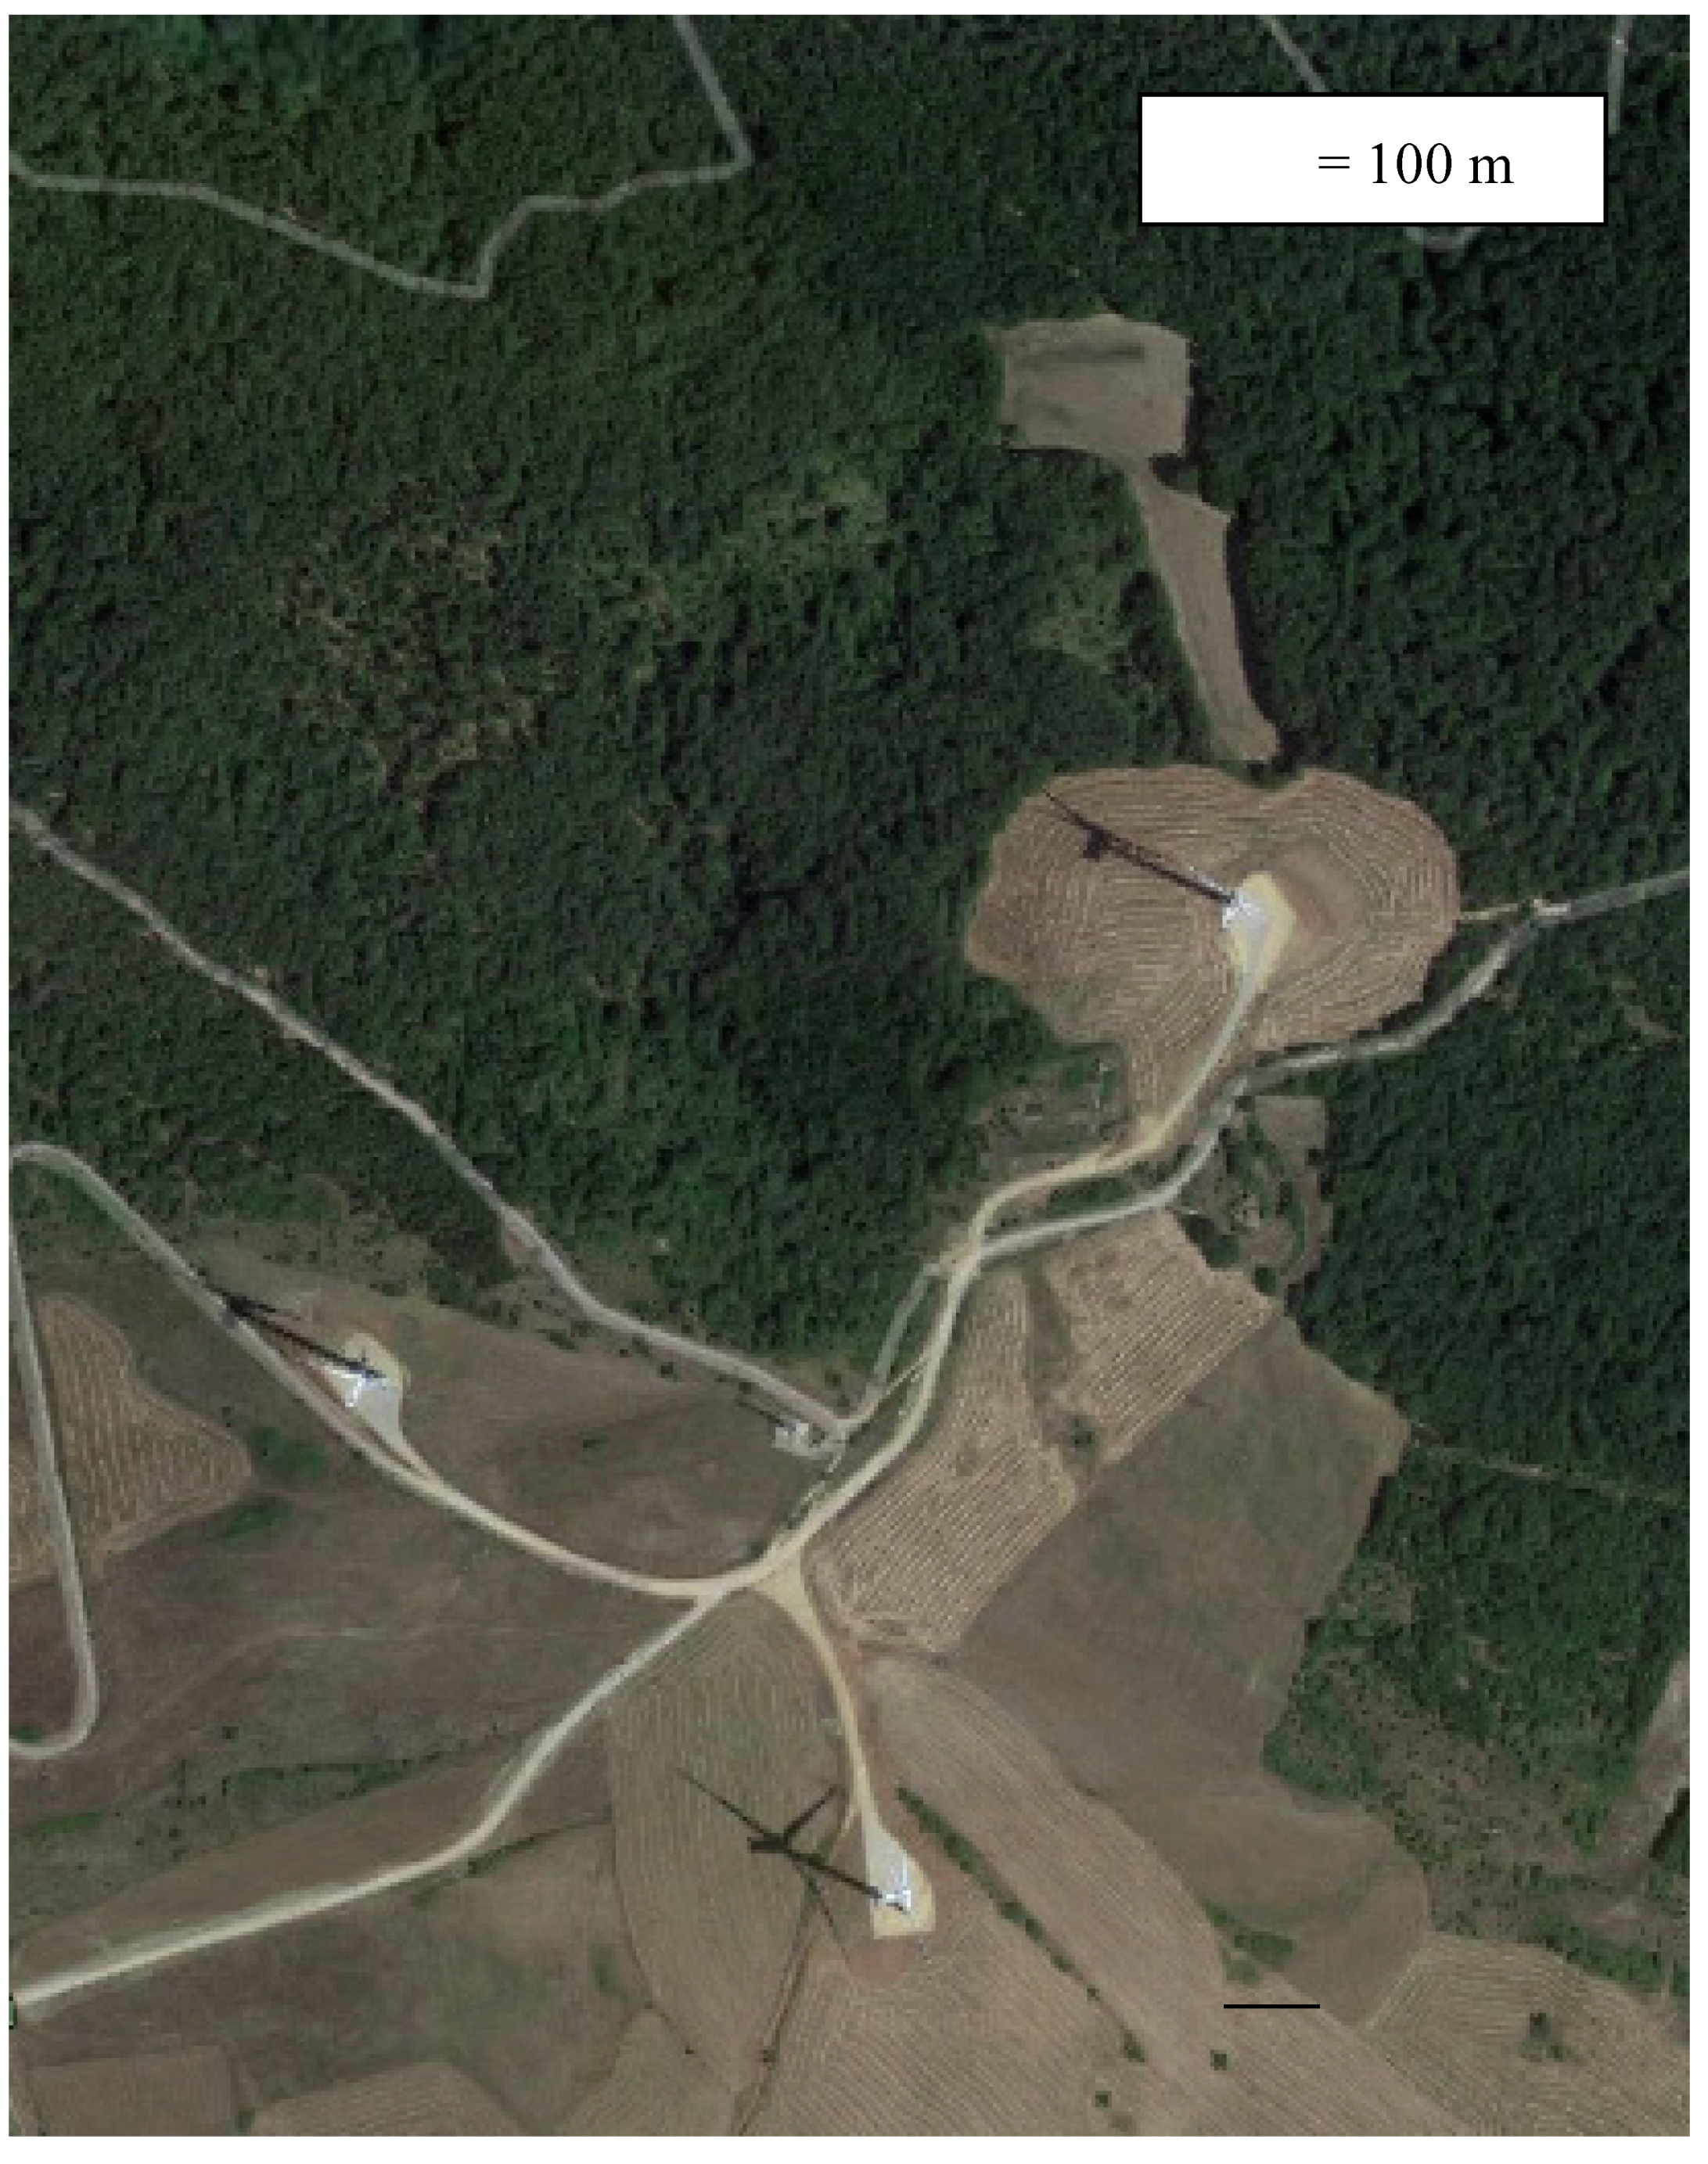
2.2.2. Pietragalla Wind Farm
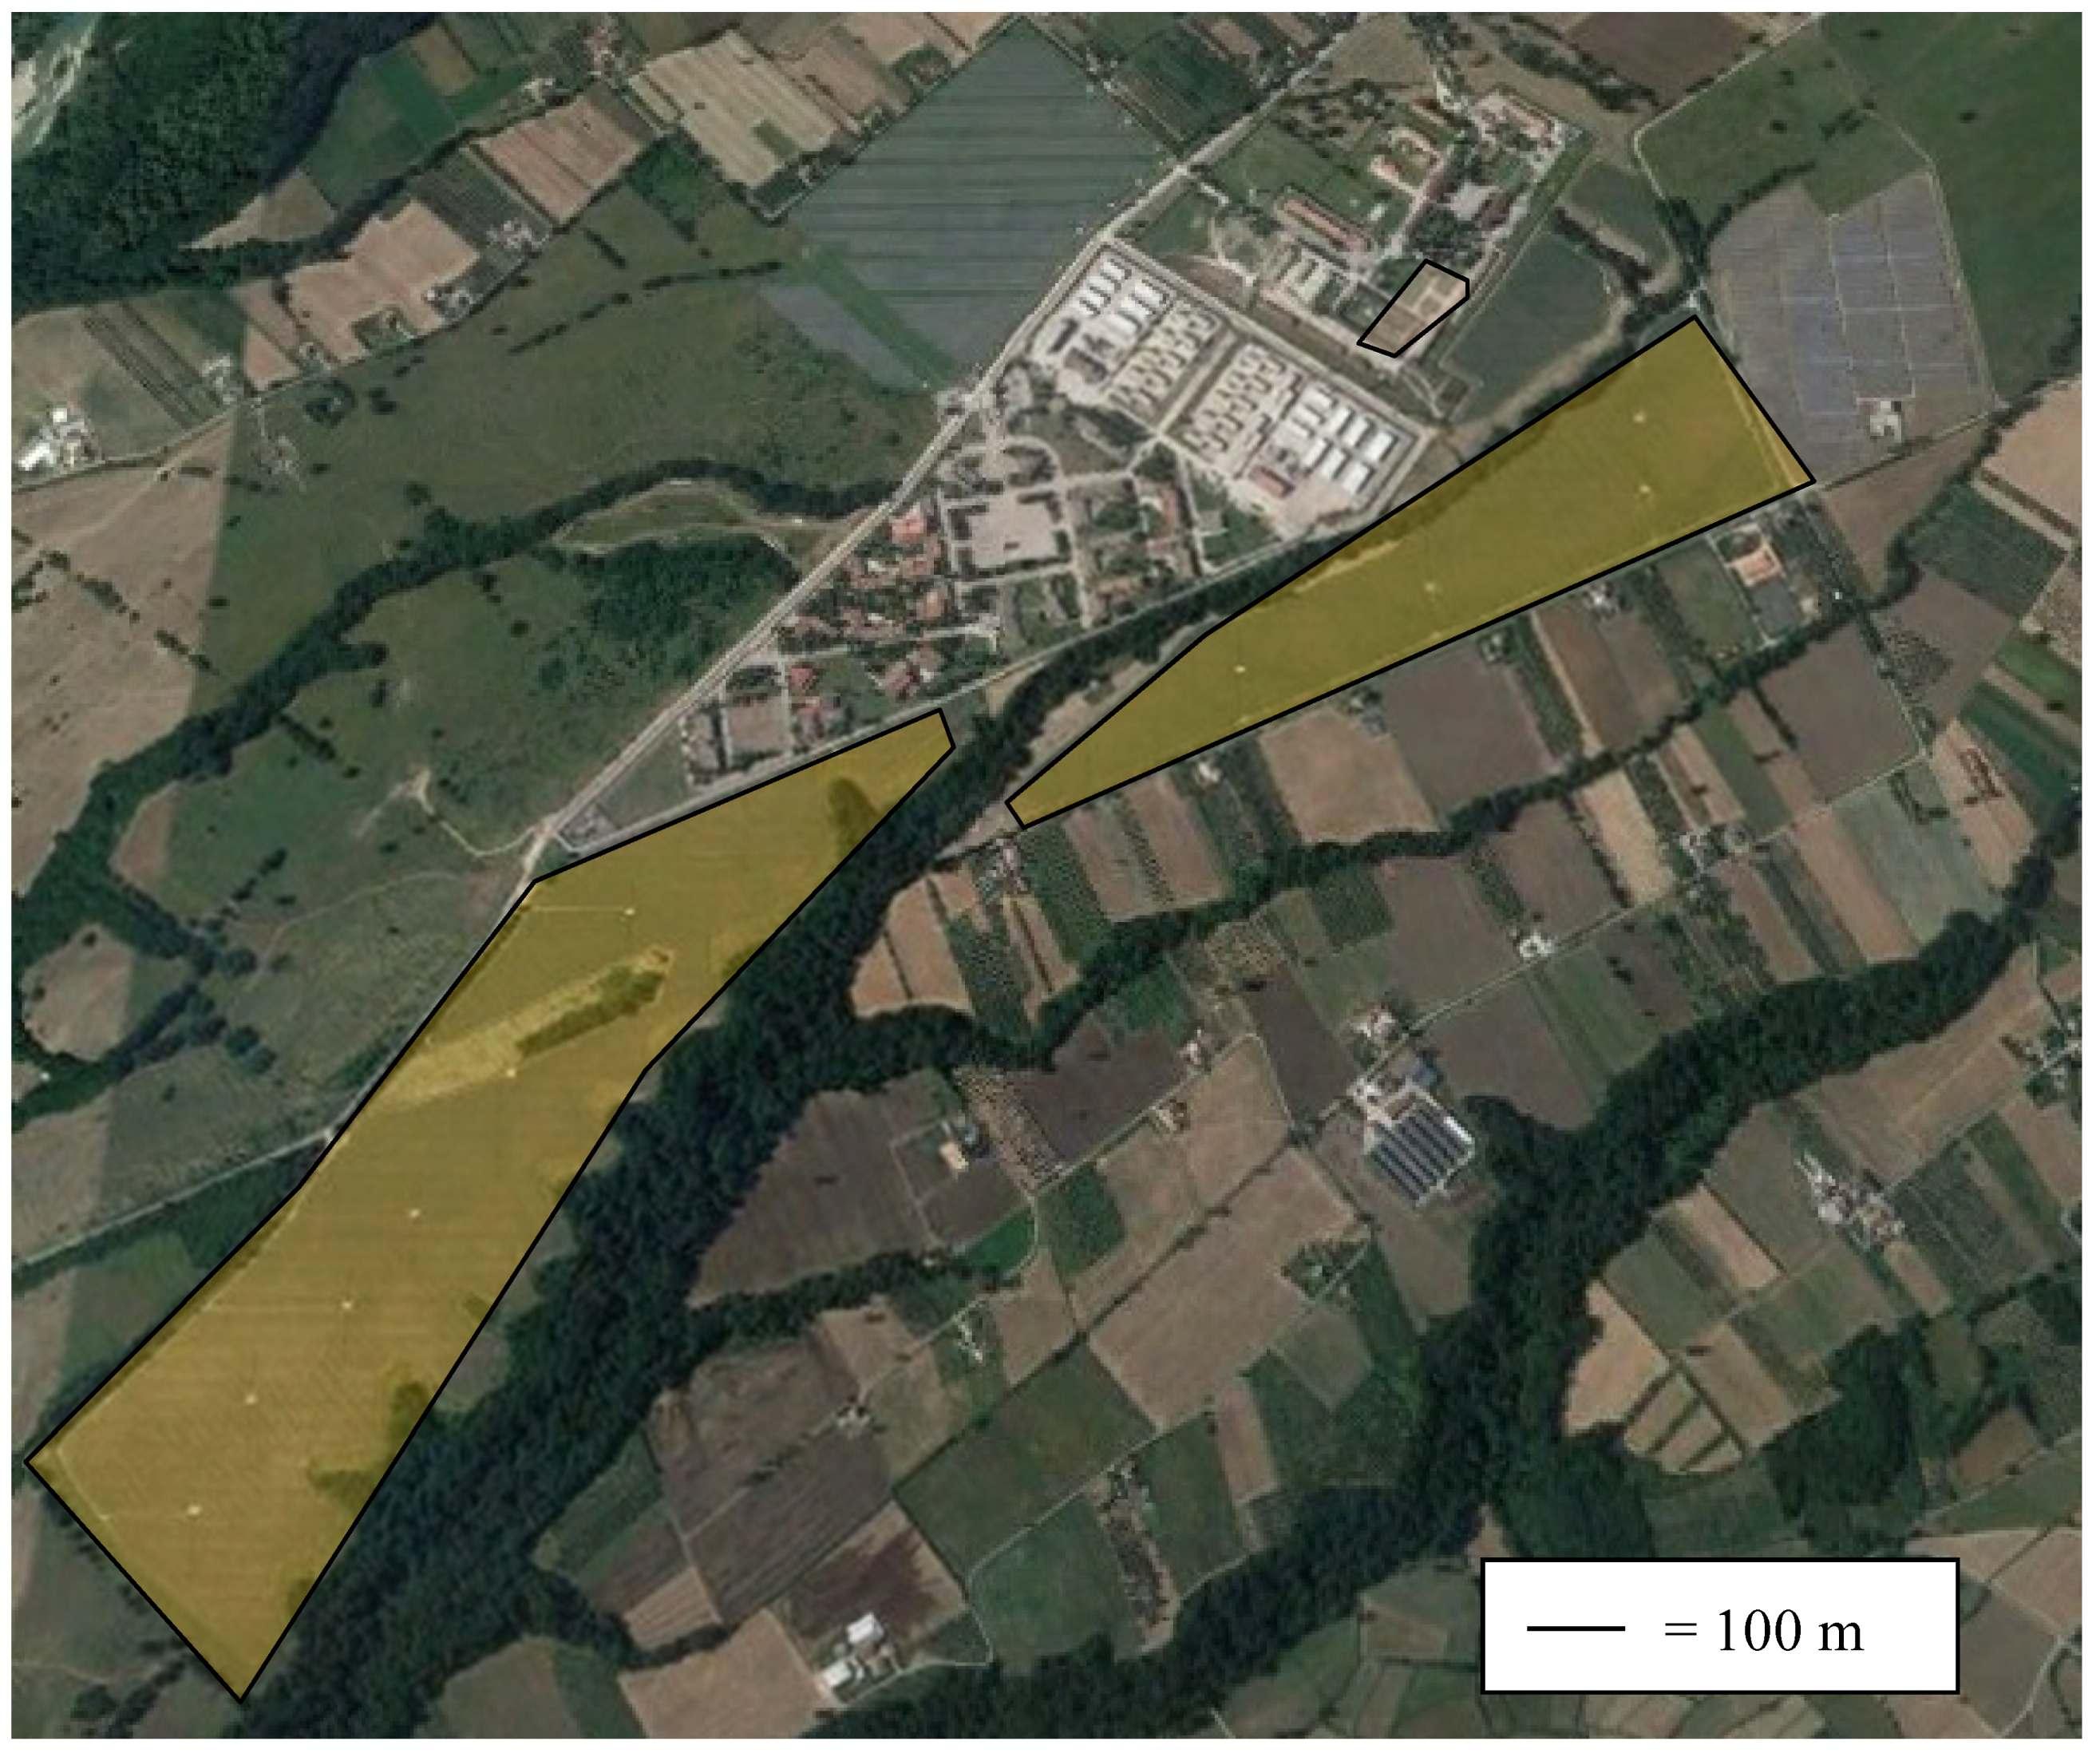
2.2.3. Serre Persano Difesa Servizi (DS) Photovoltaic Solar Plant
3. Results and Discussion
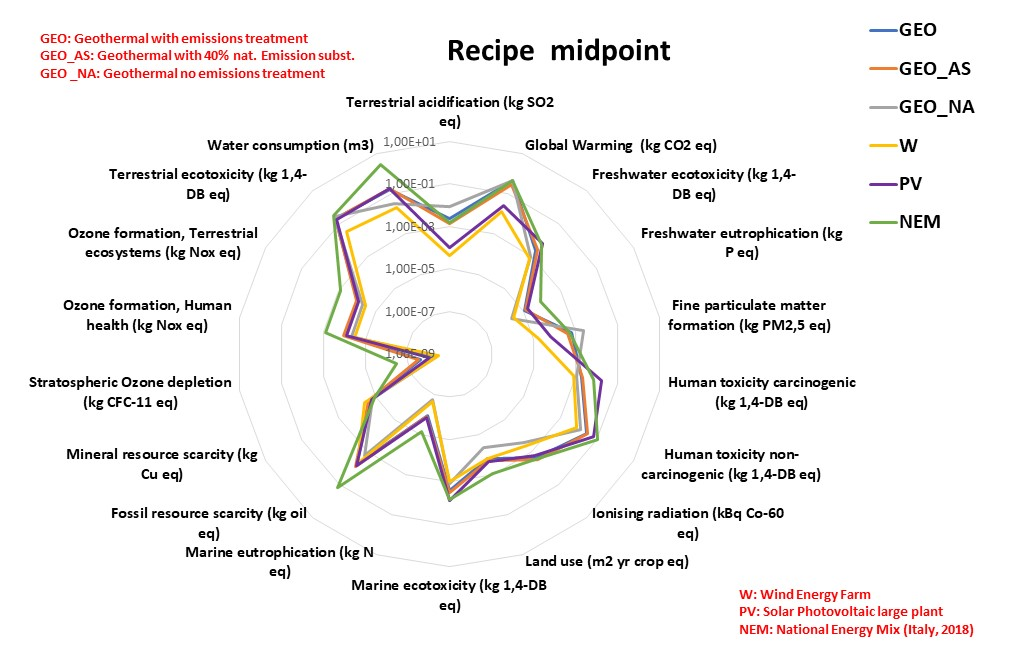
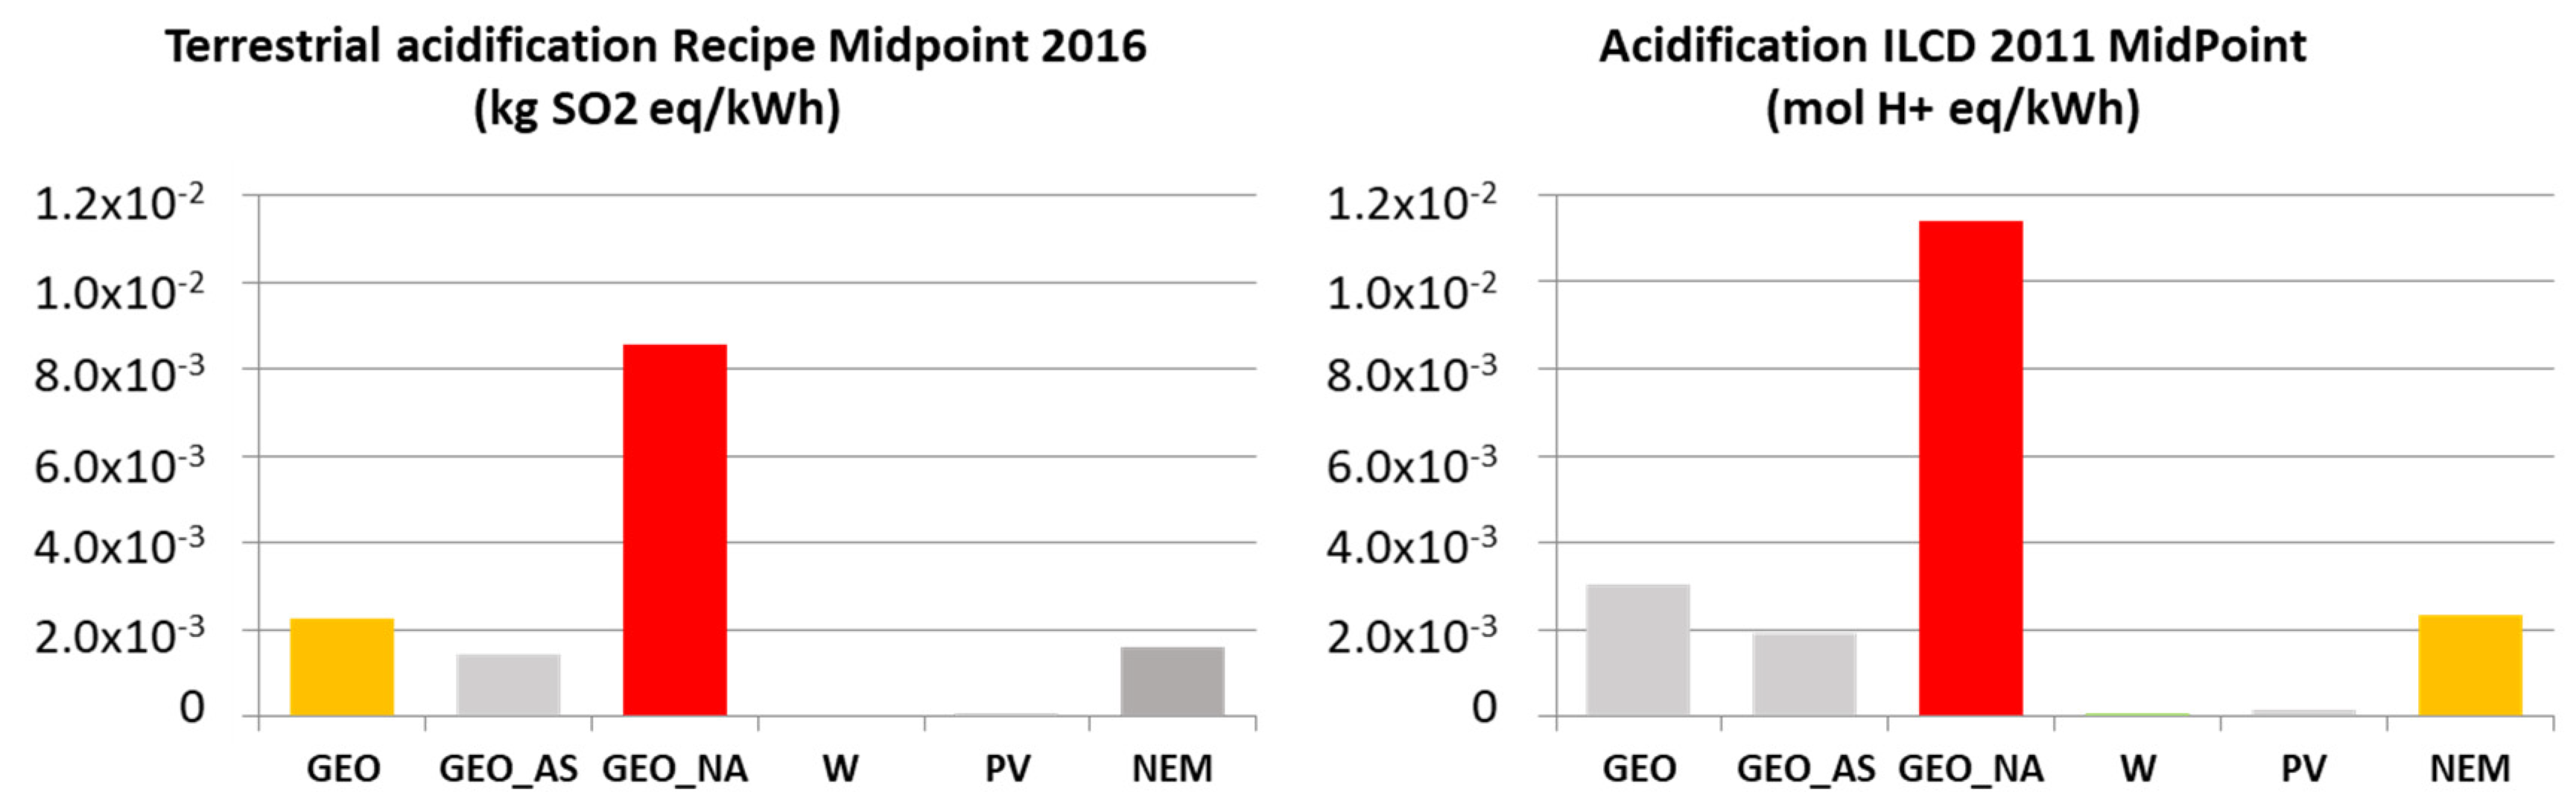
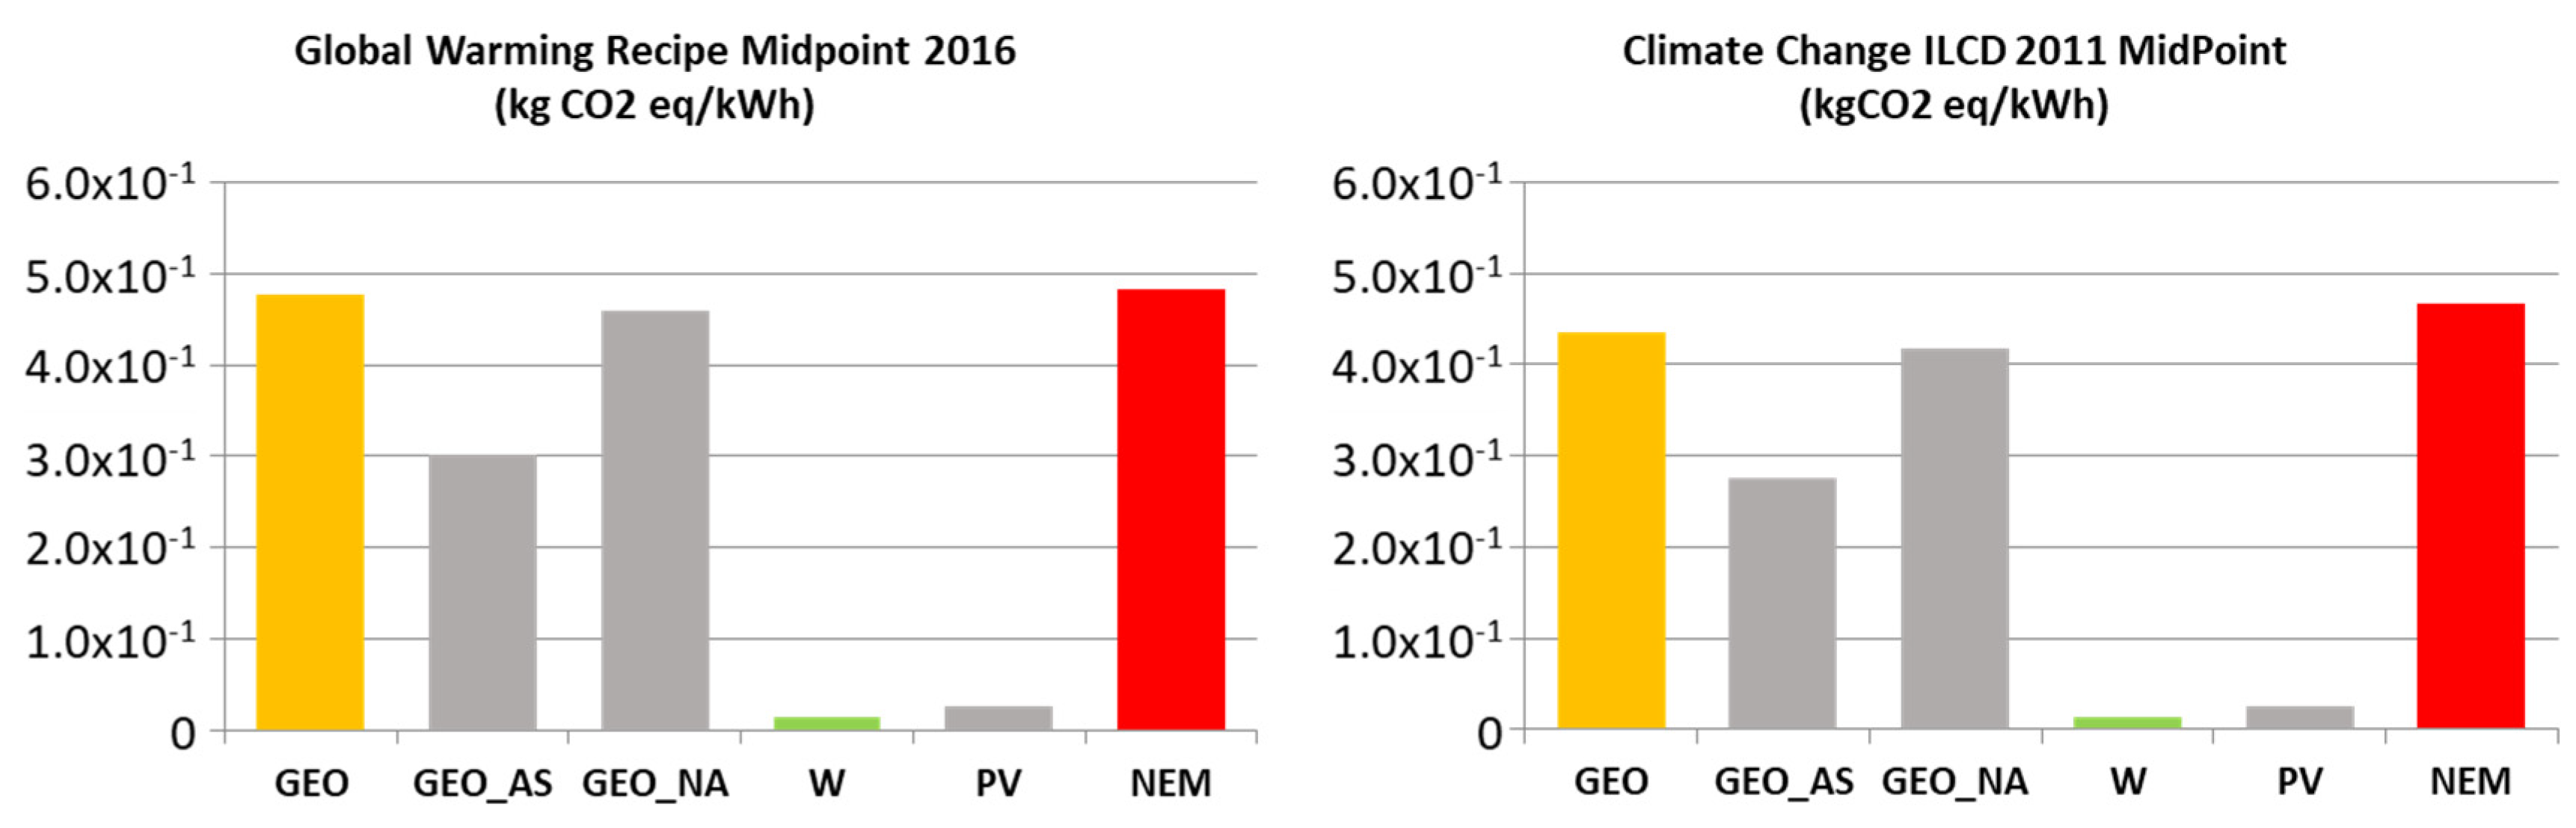
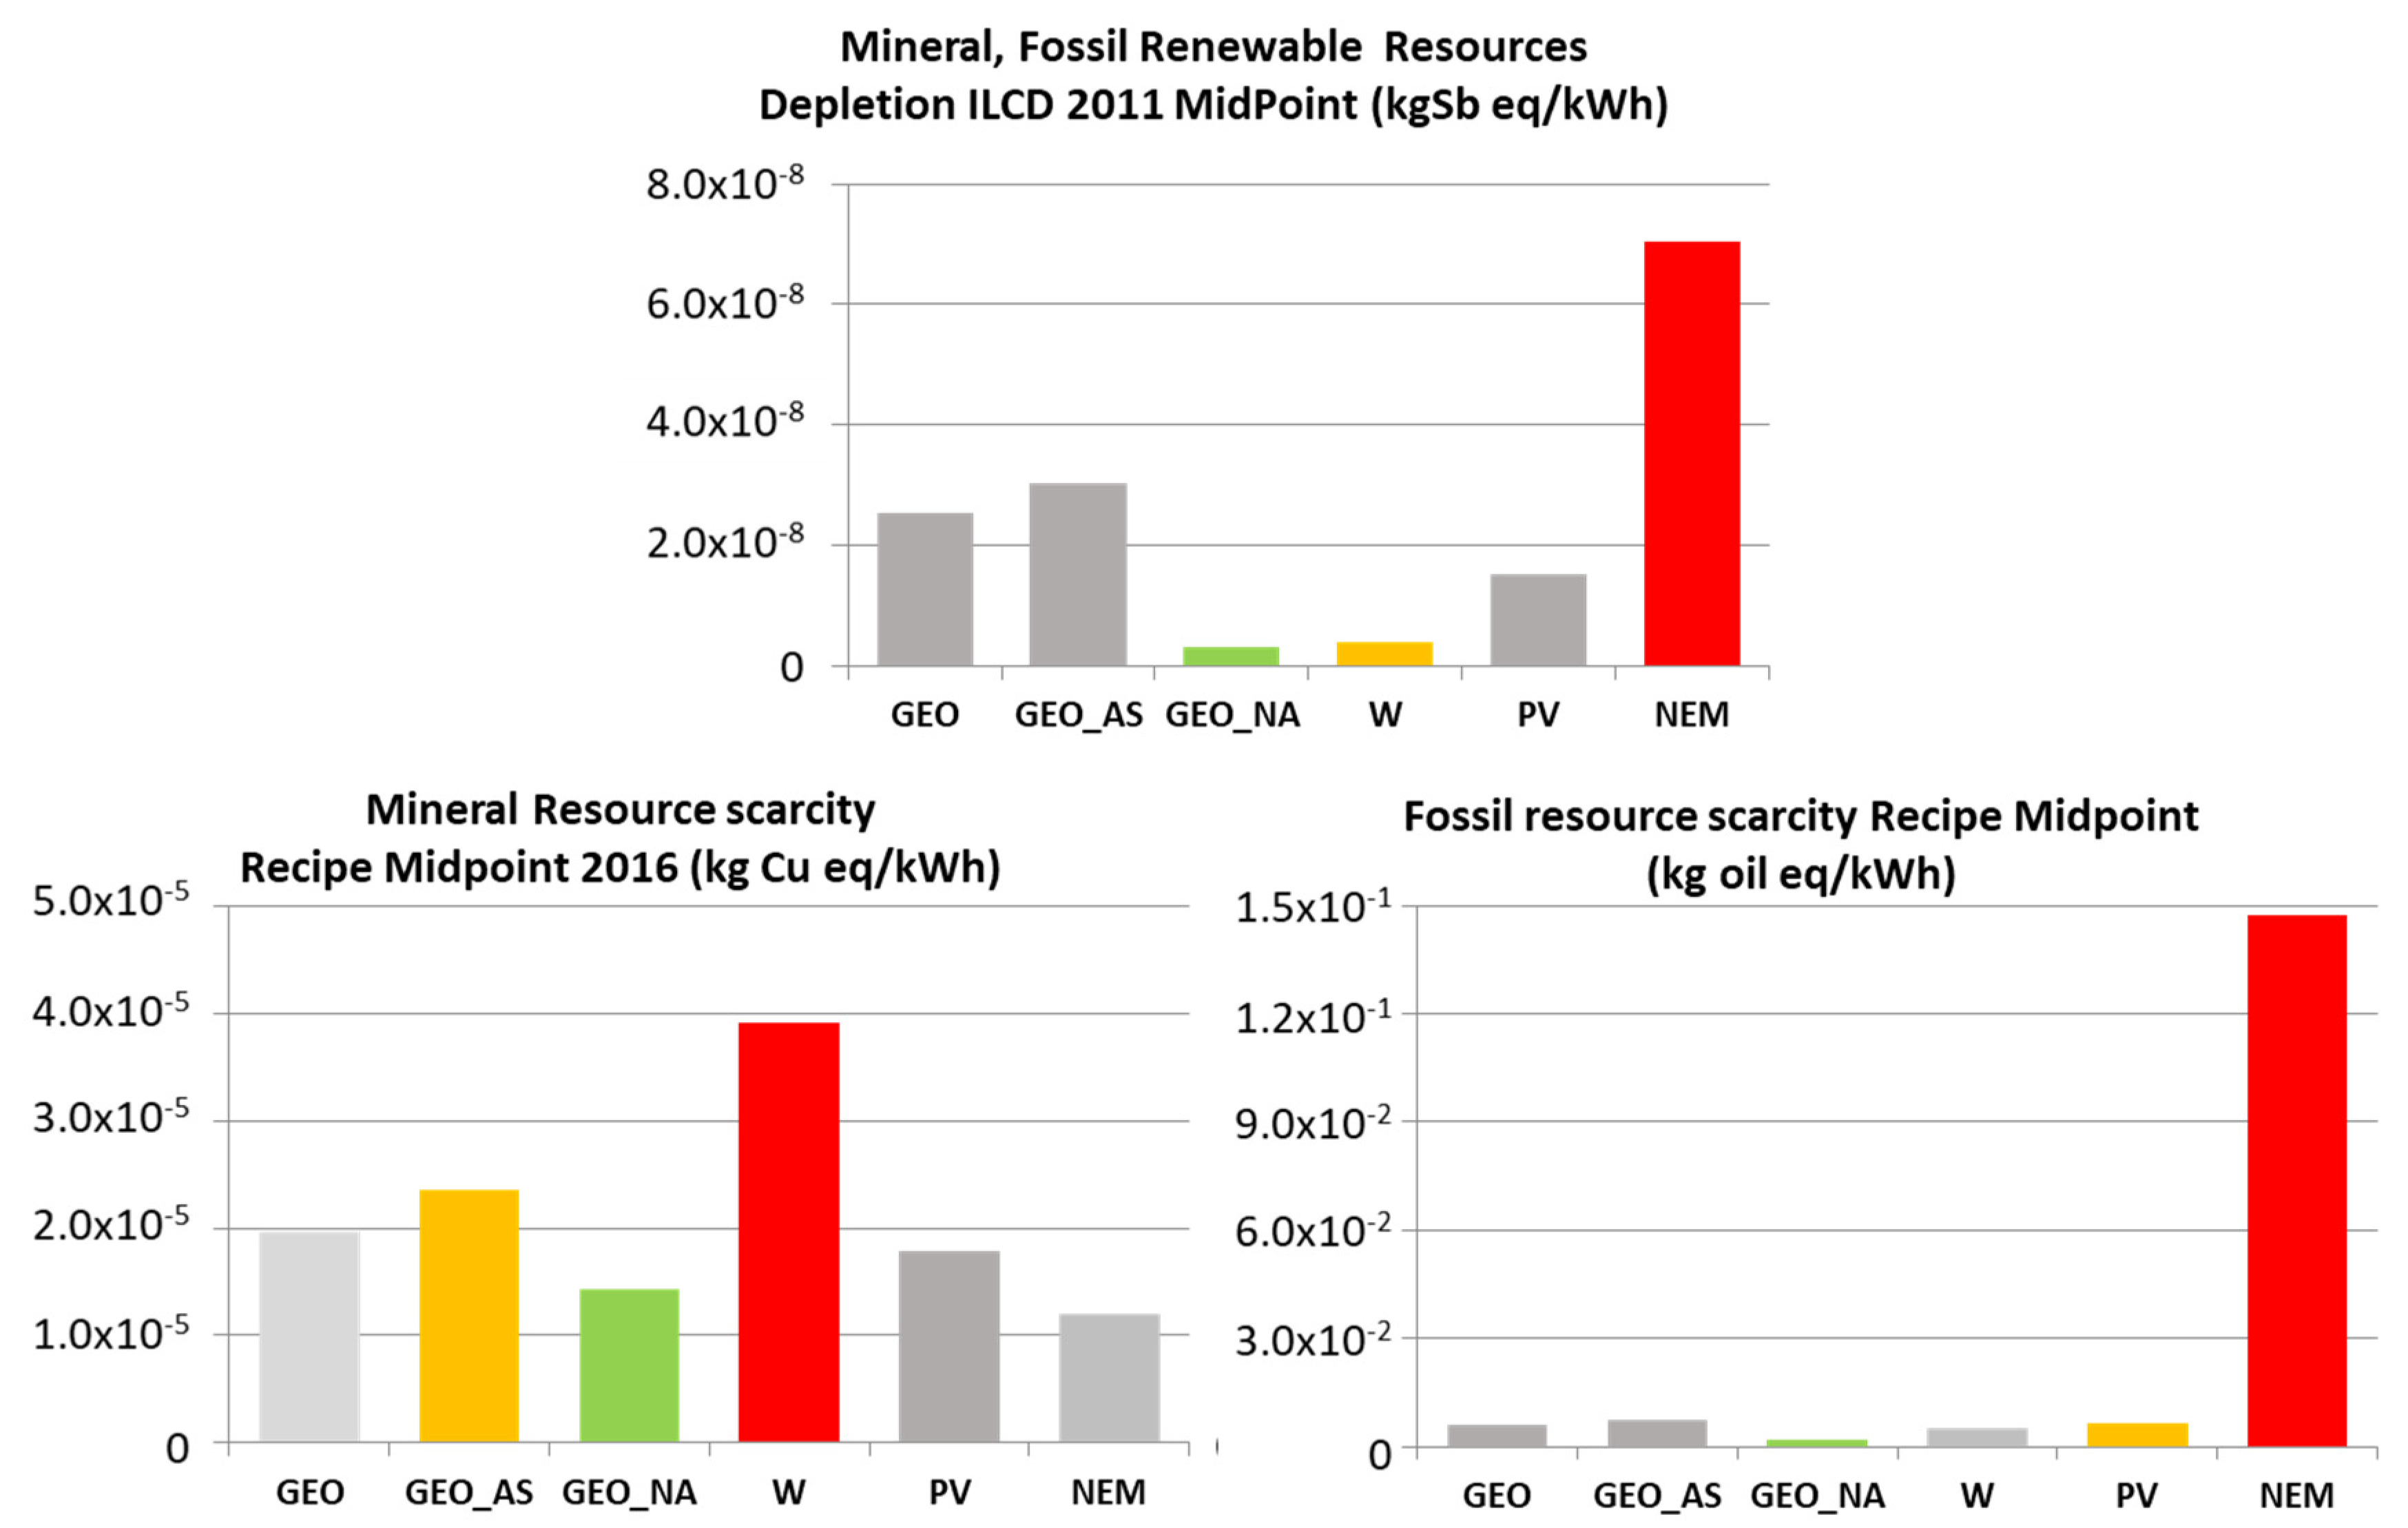
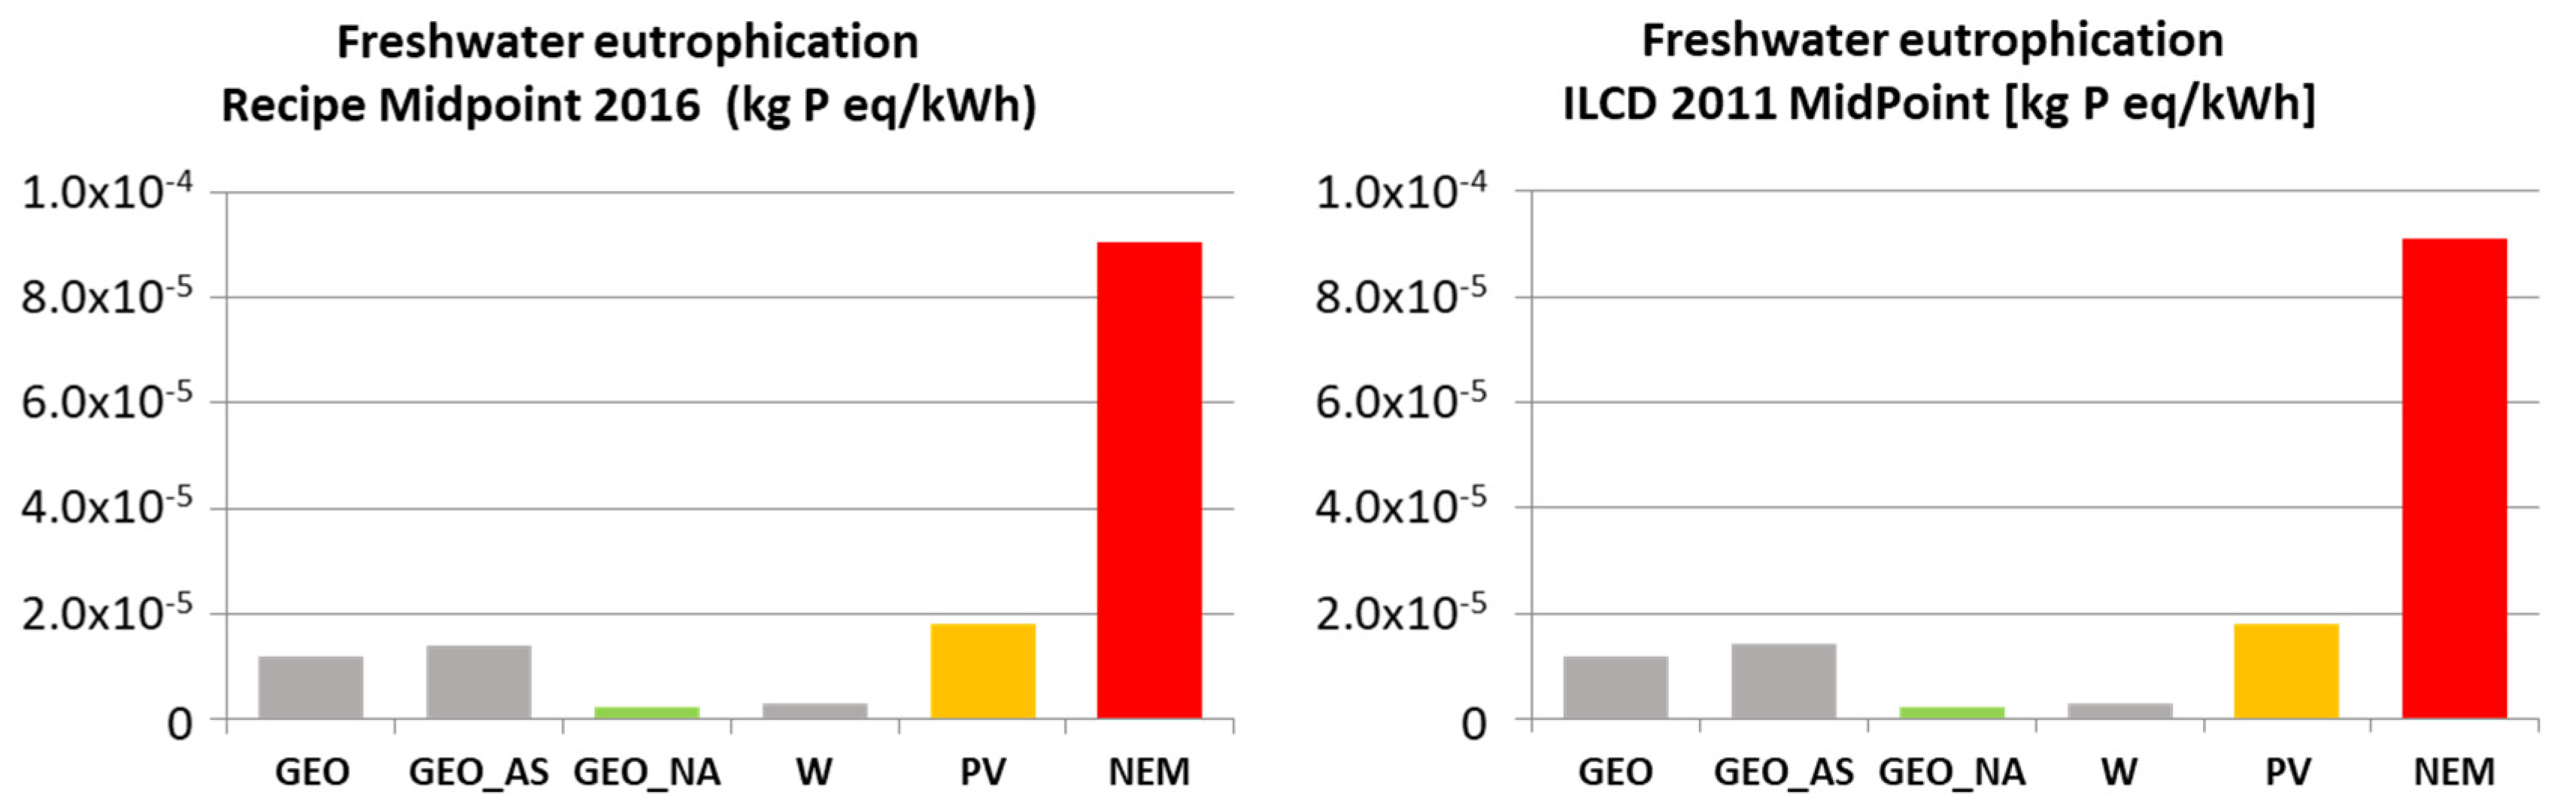
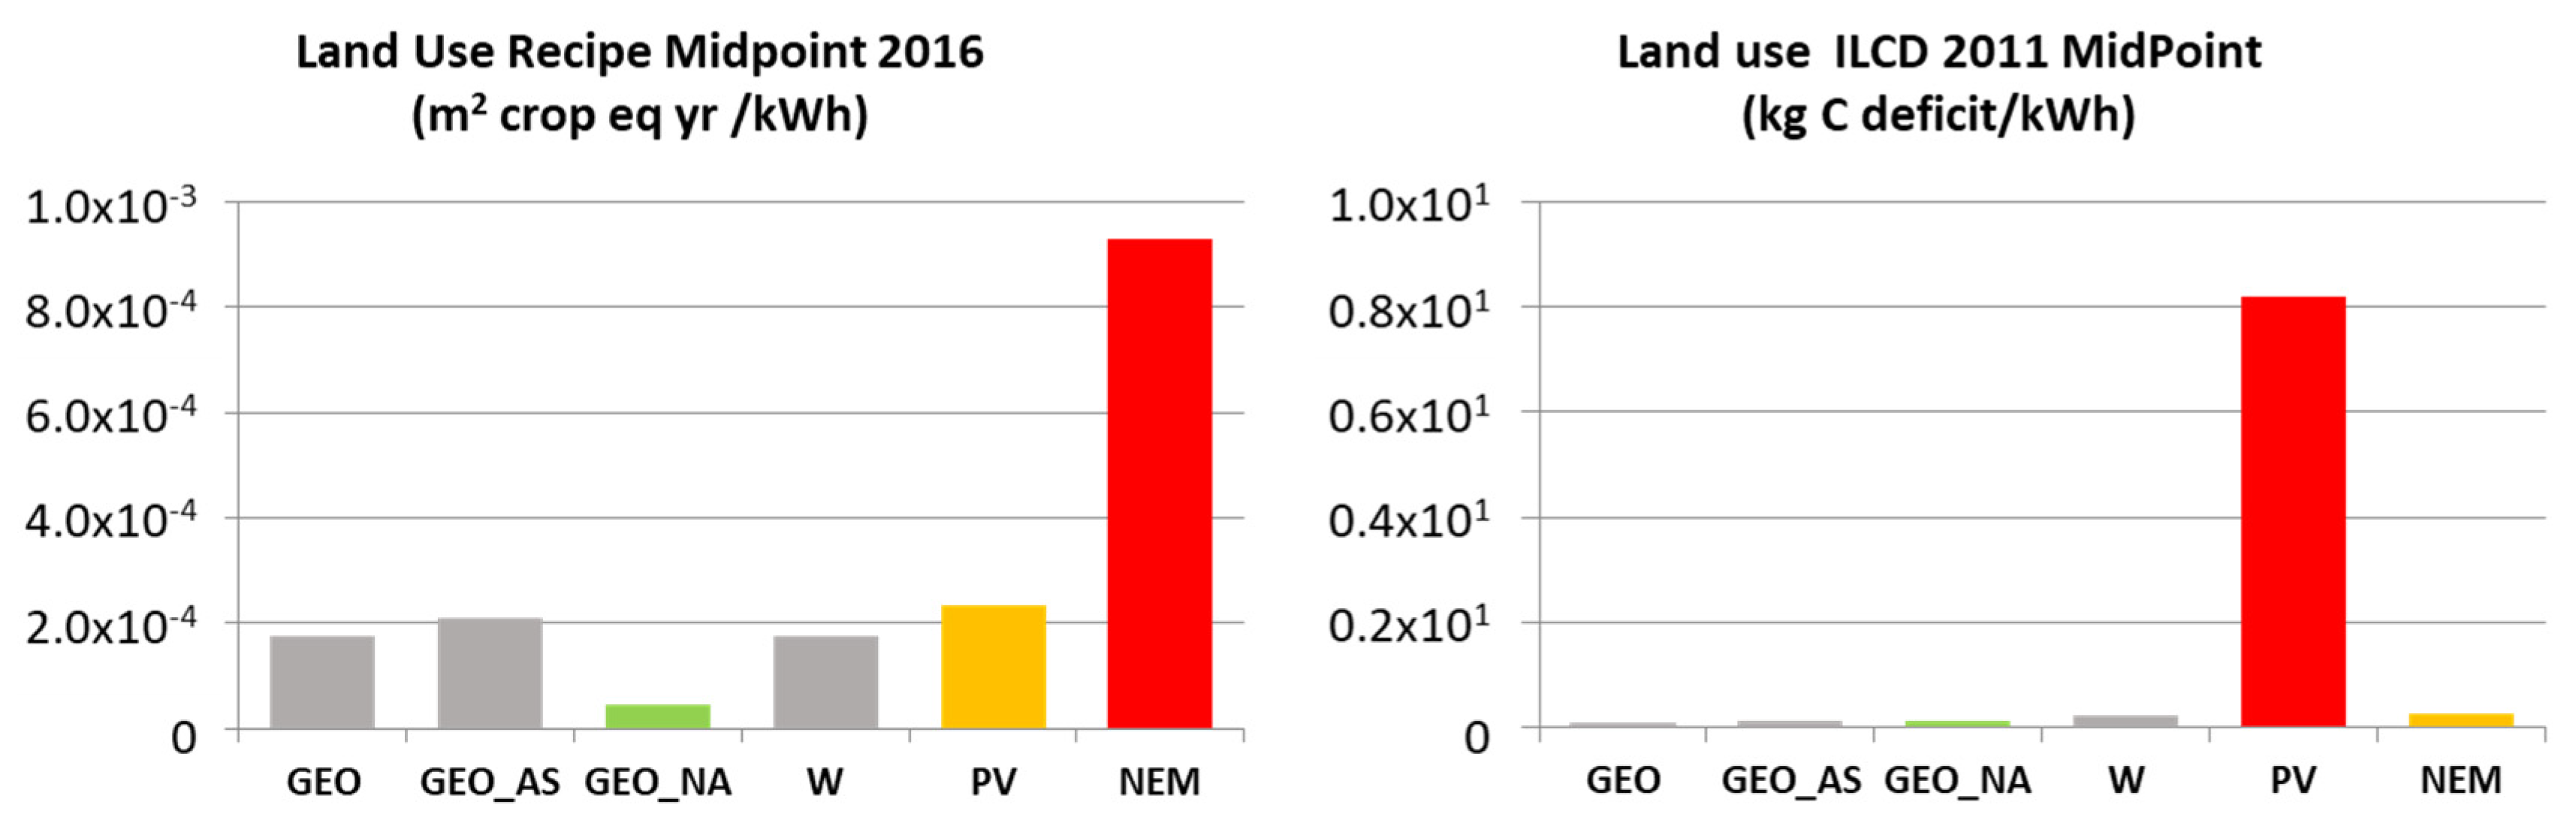
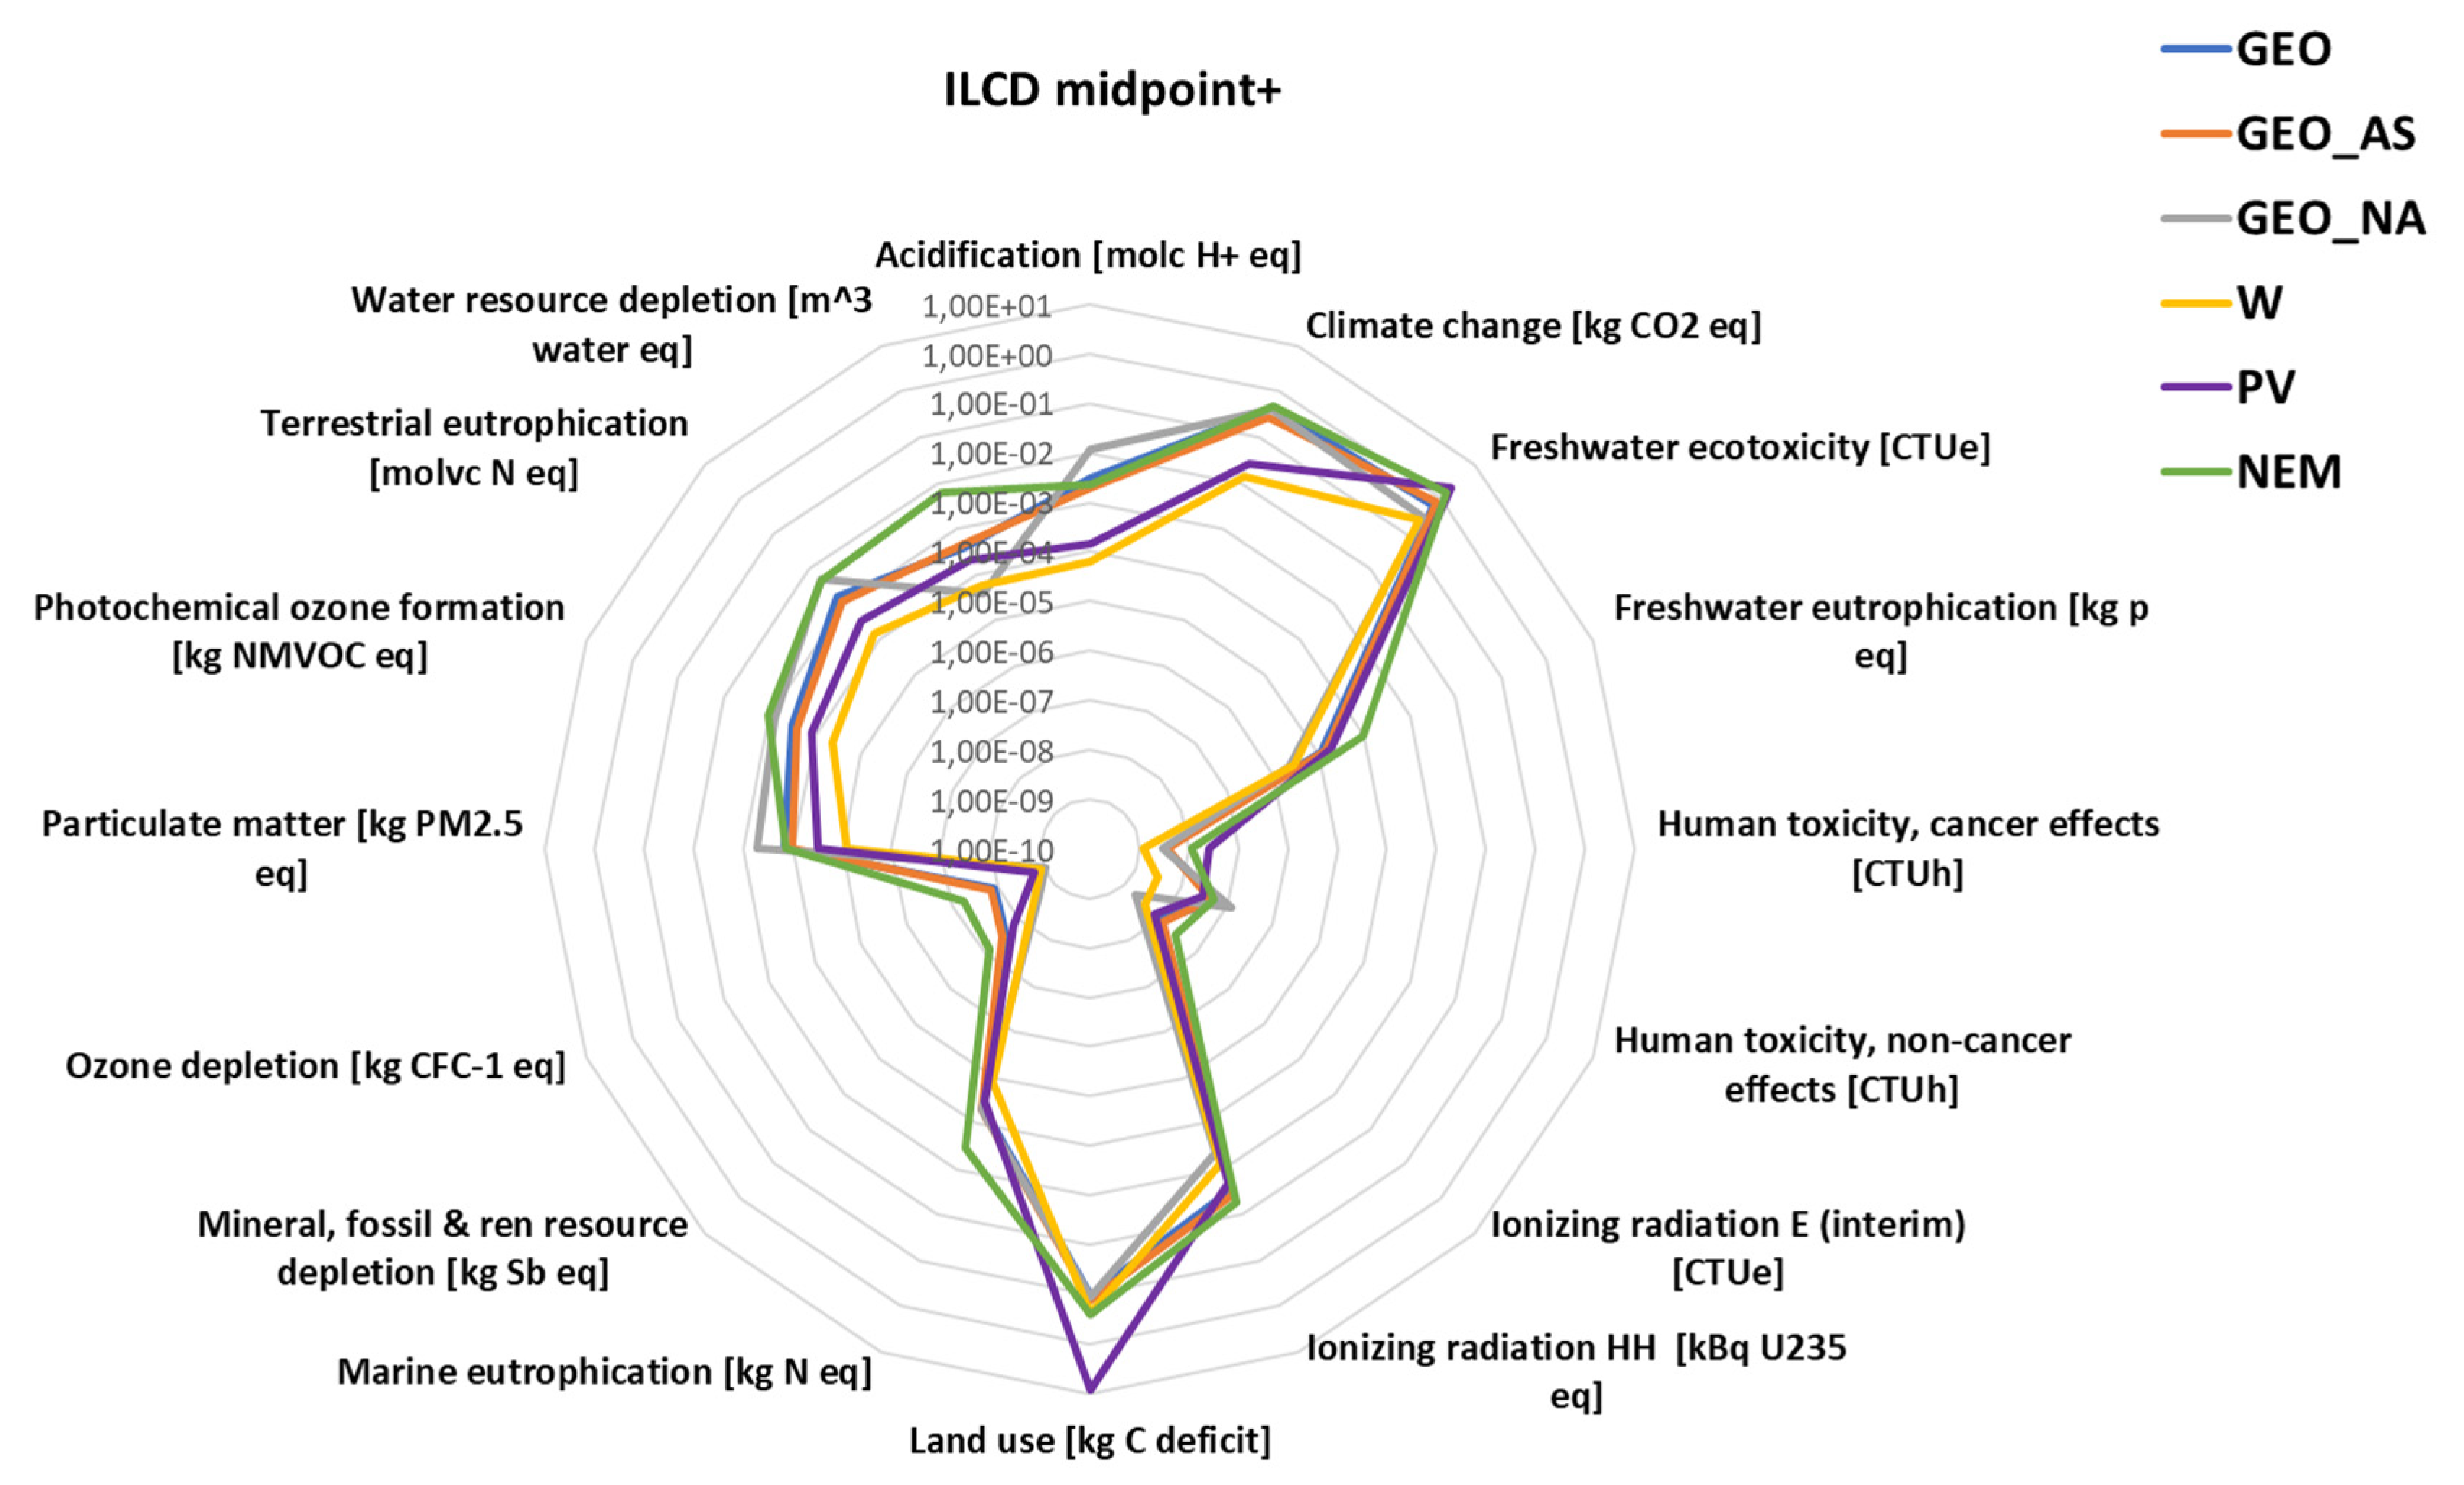
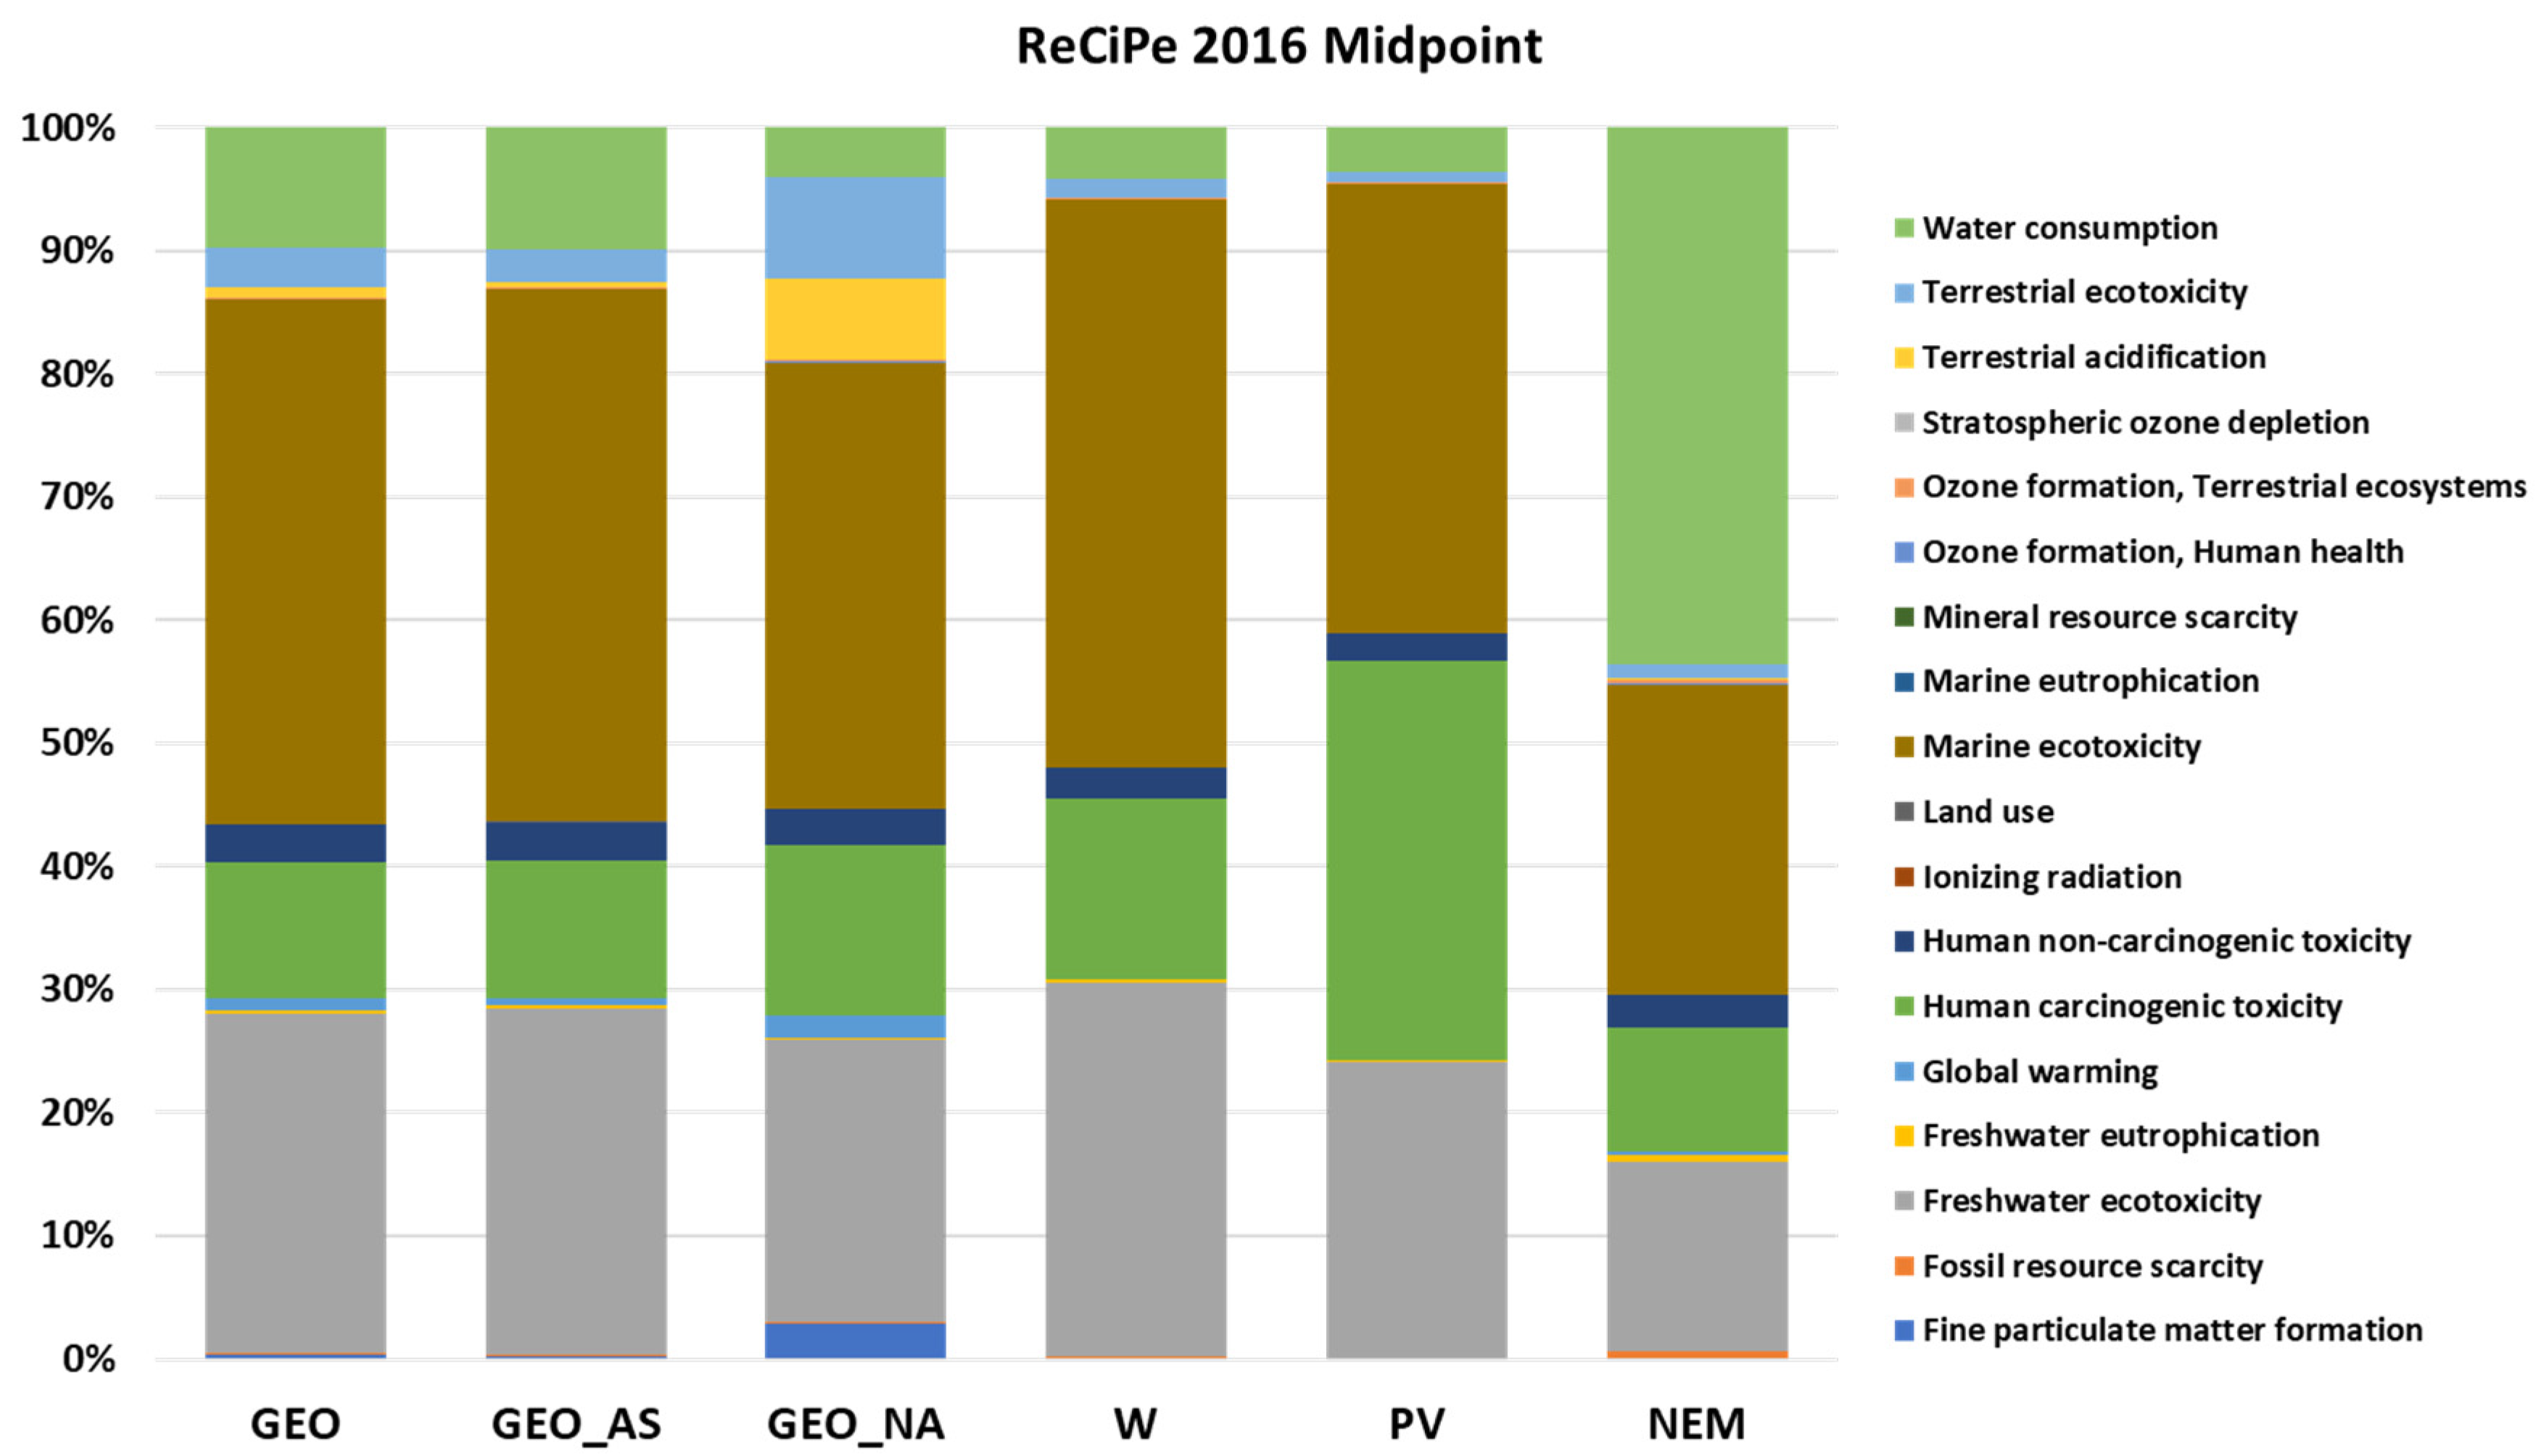
3.1. Life Cycle Impact Assessment at Midpoint Level: ILCD 2011 Midpoint+ versus ReCiPe 2016
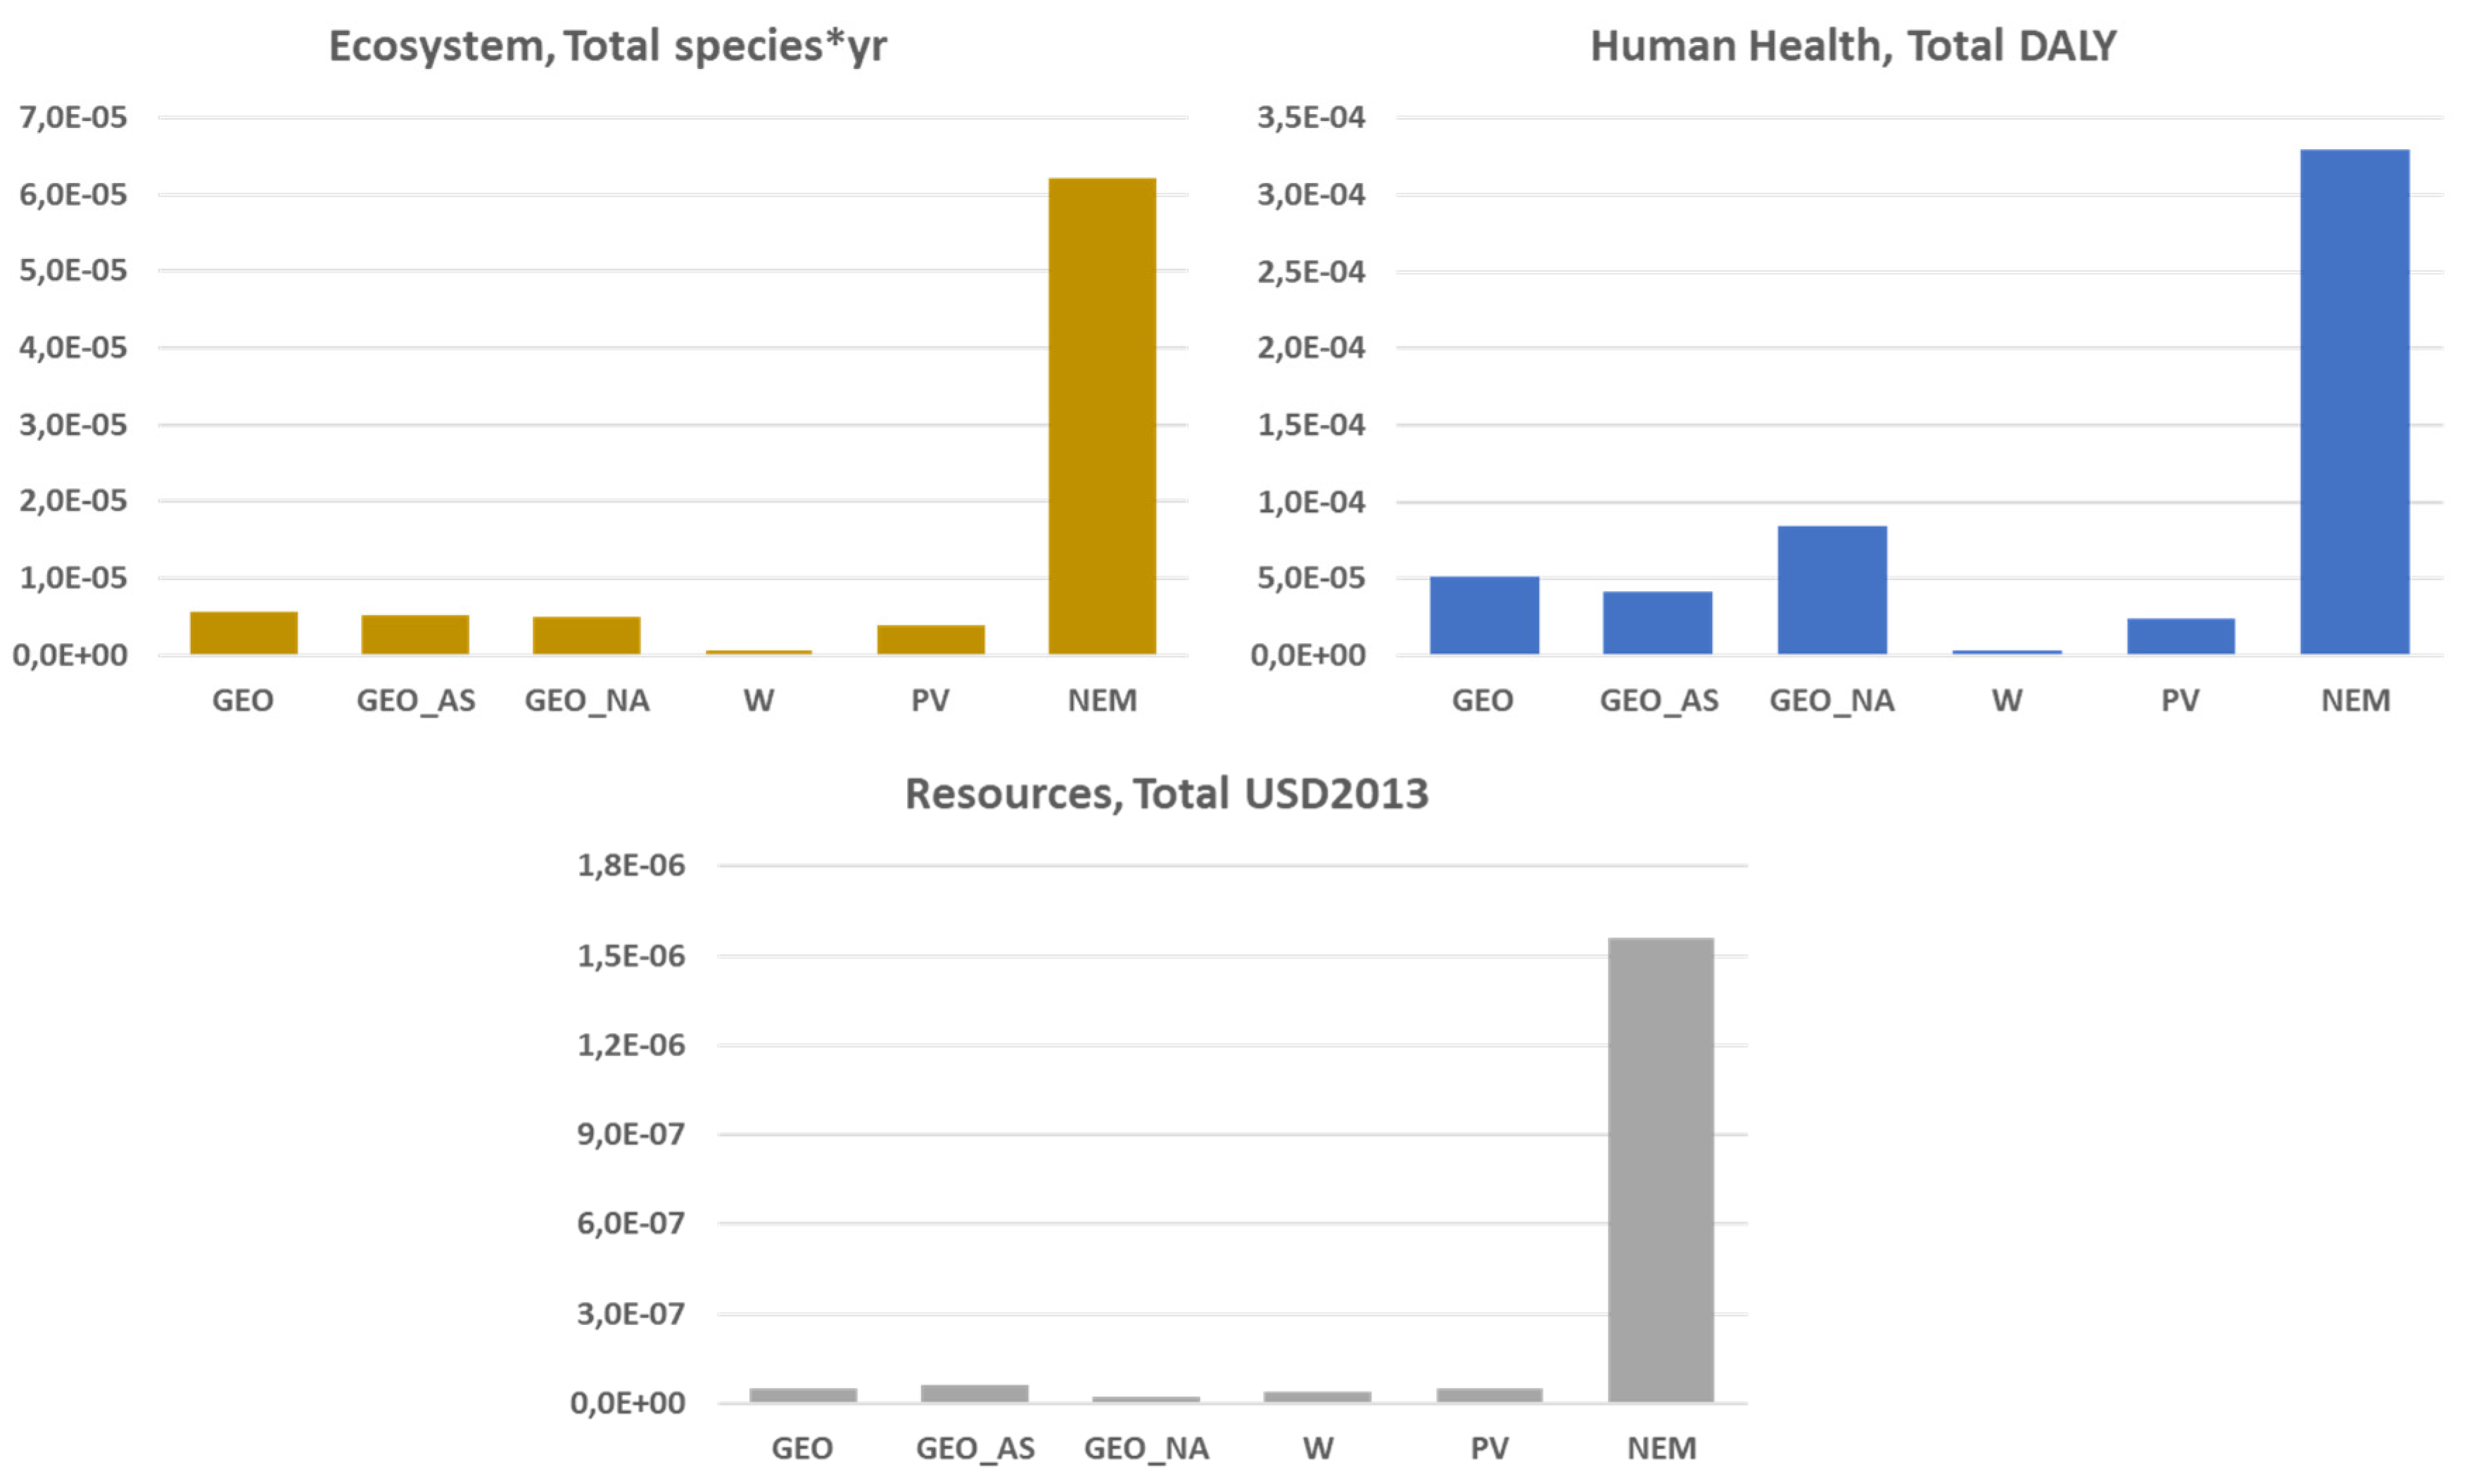
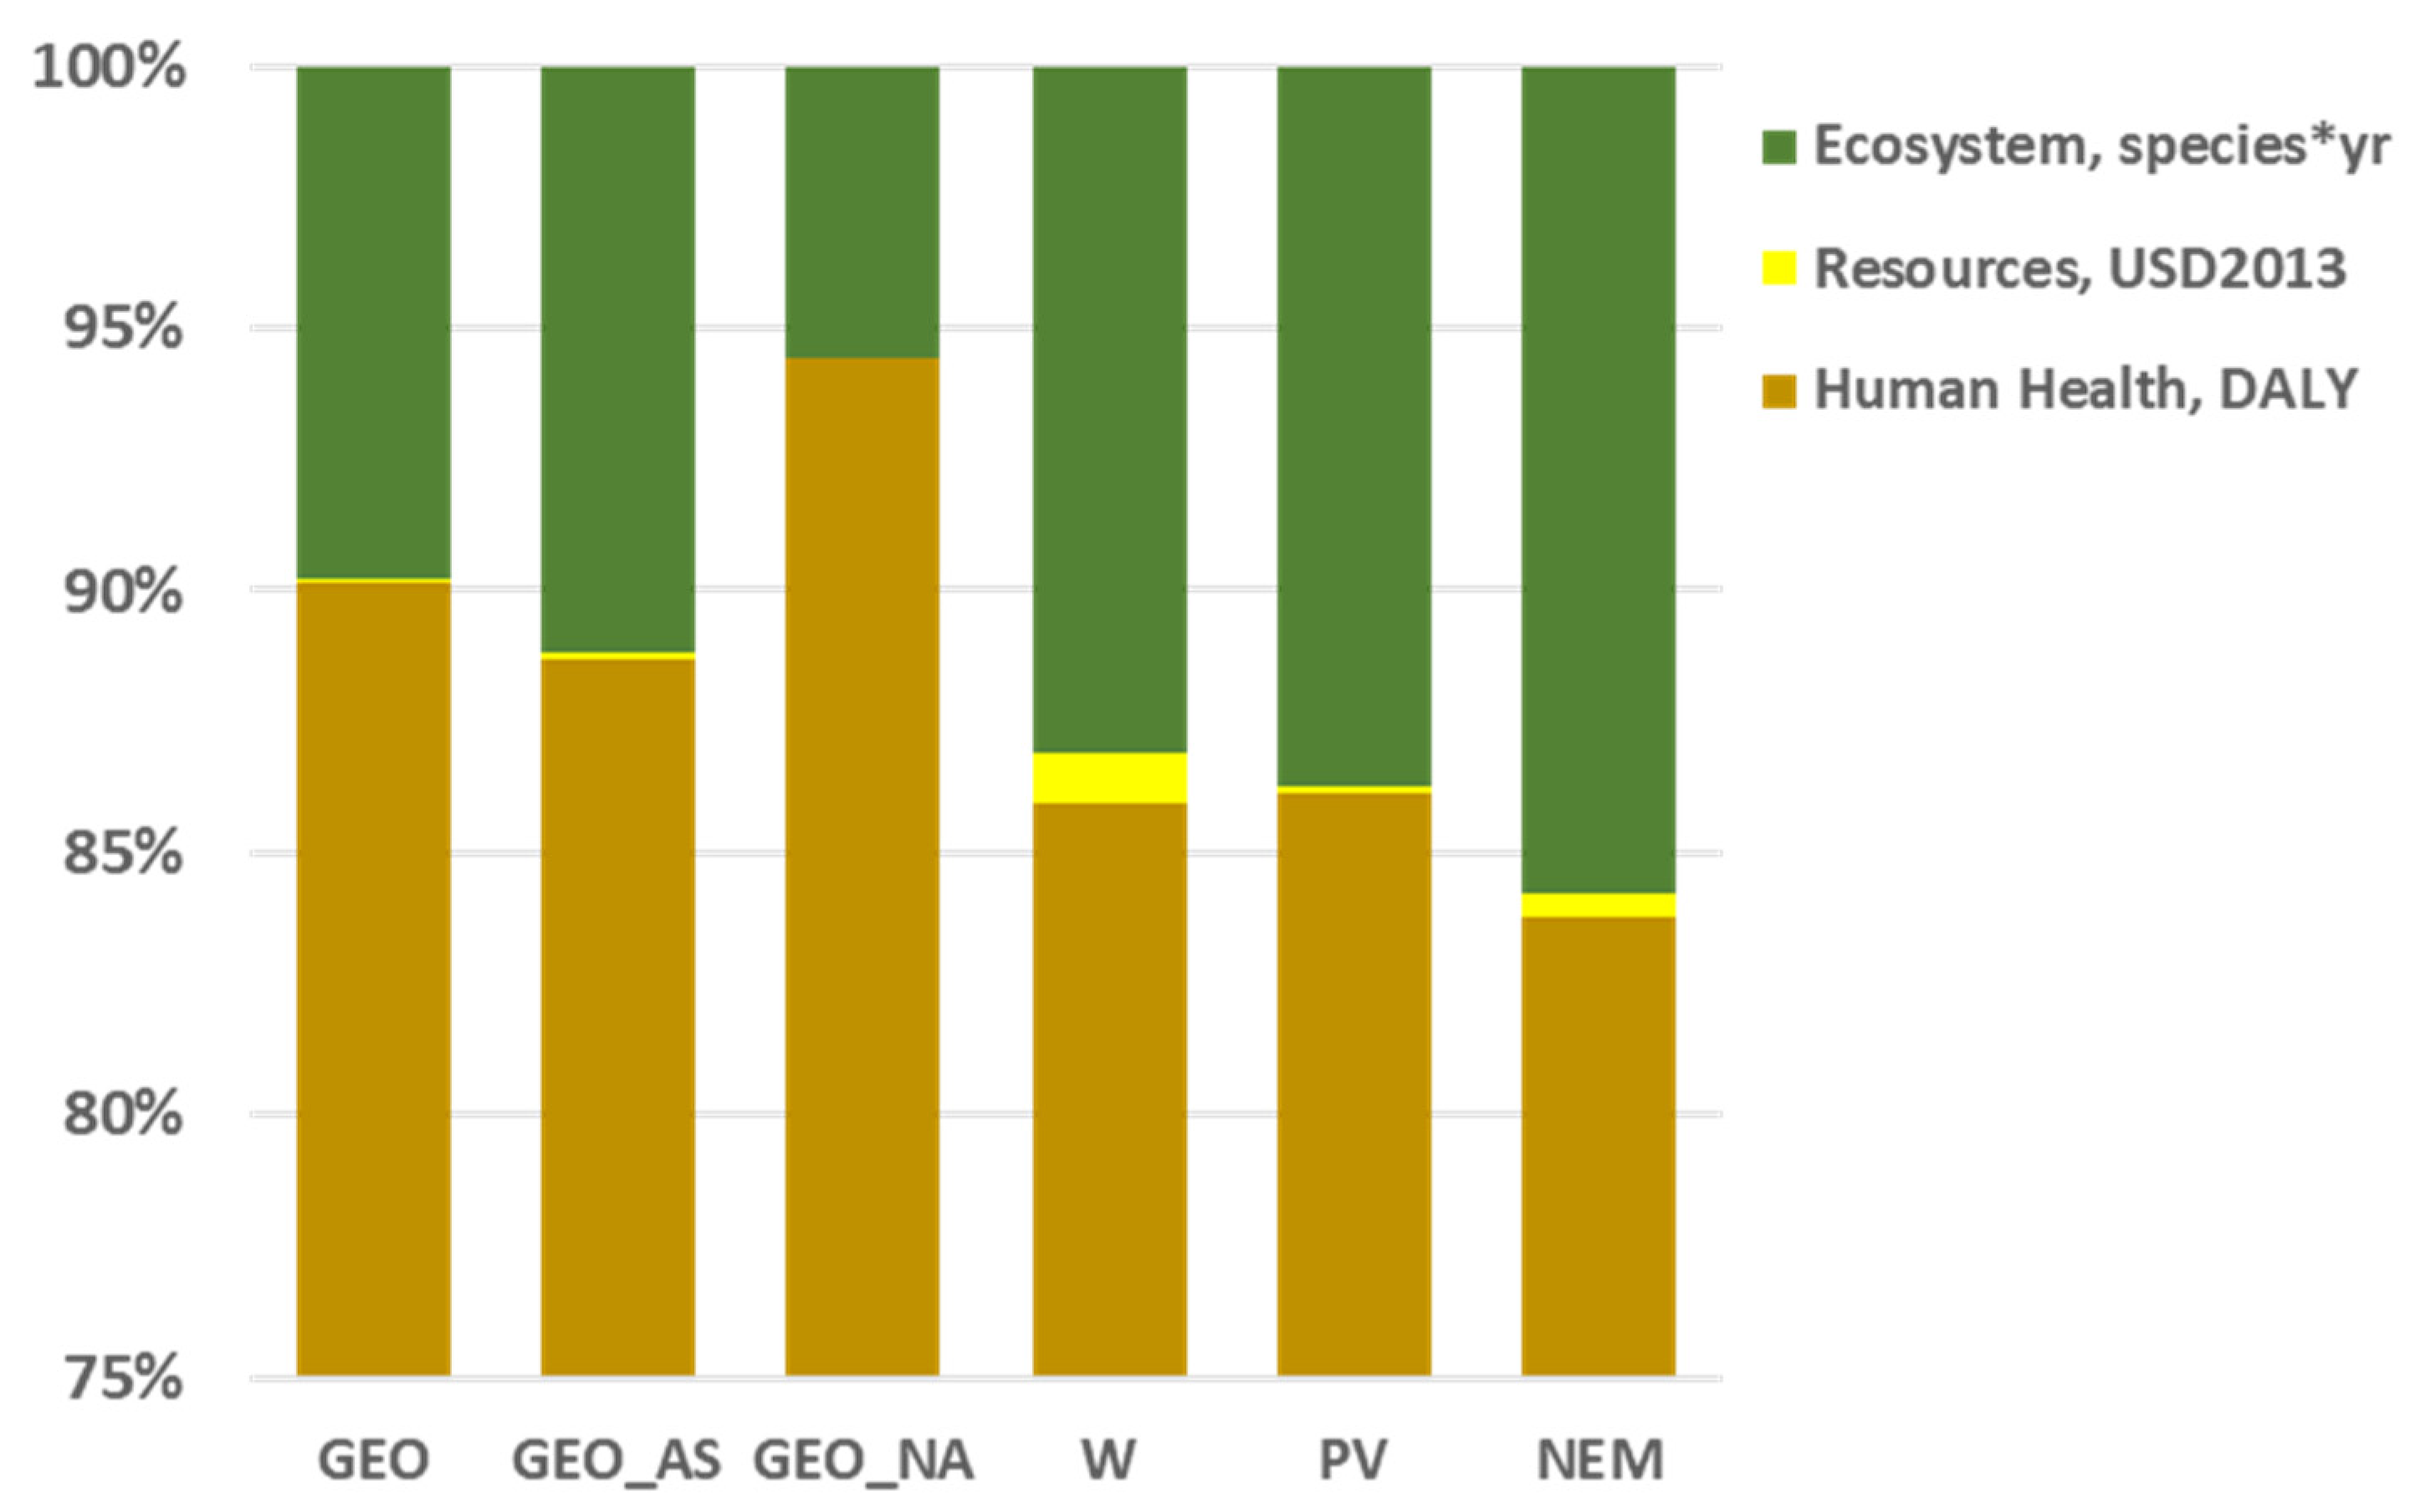
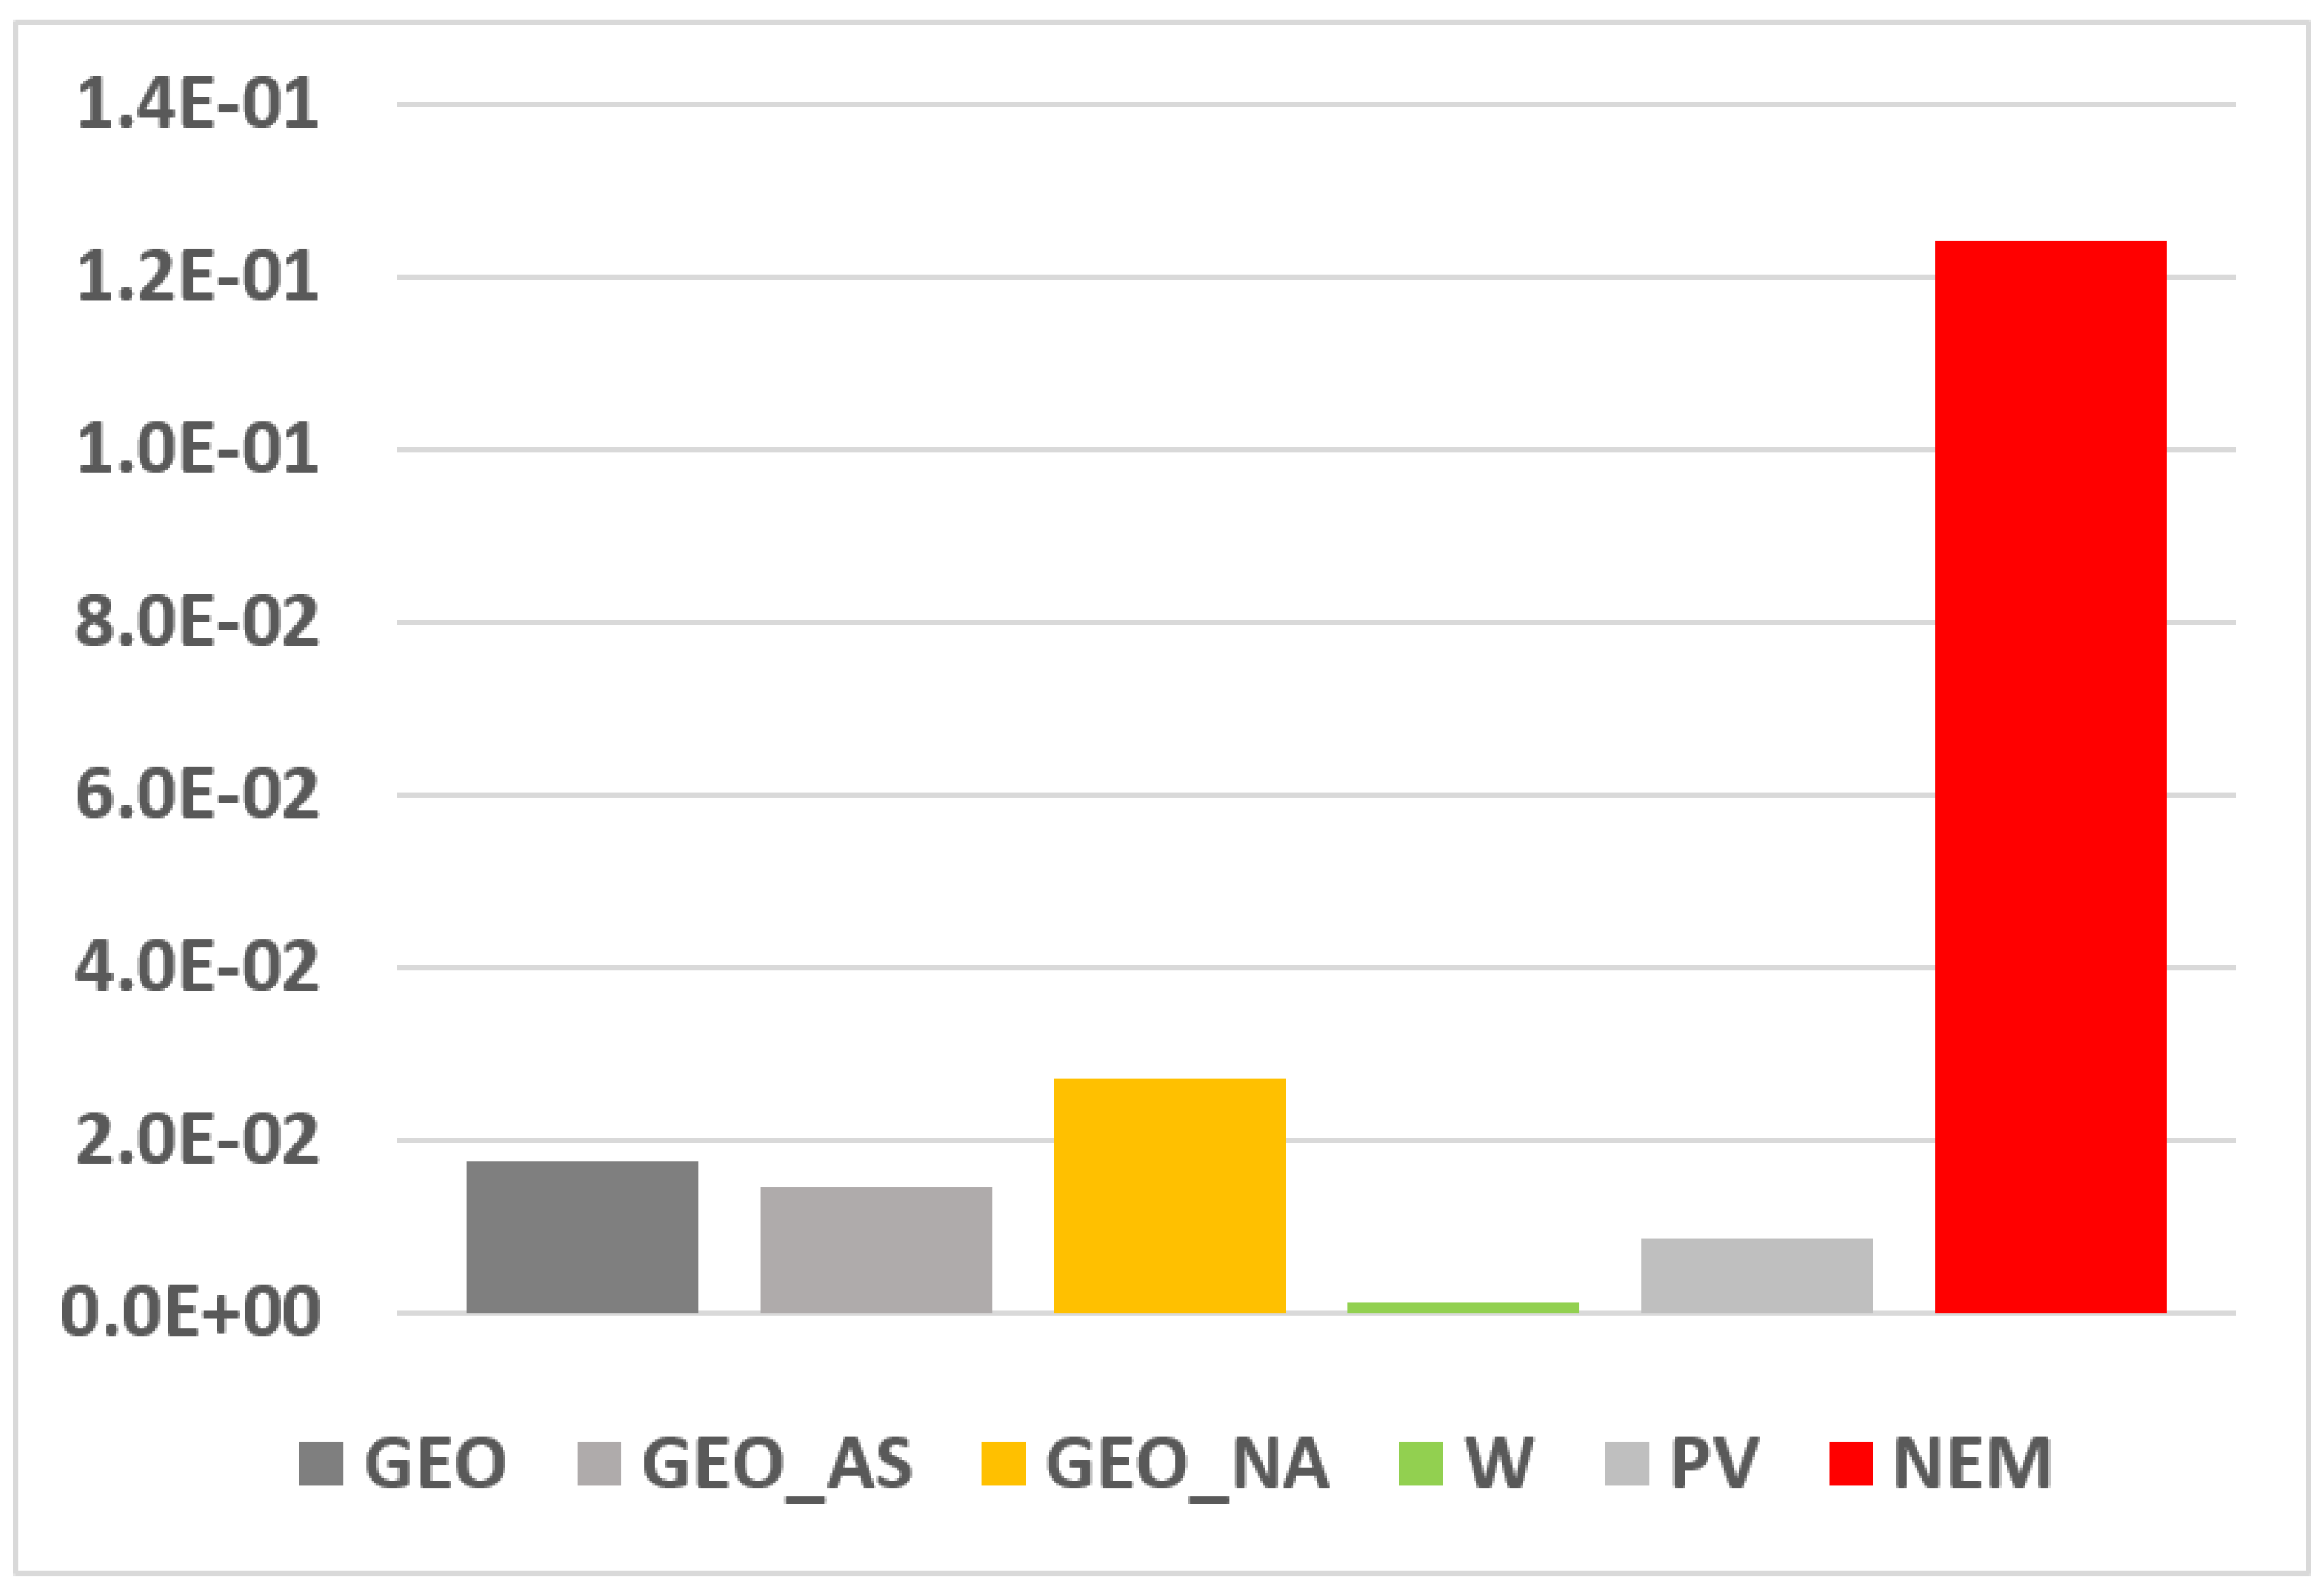
3.2. Impact Assessment at the Endpoint Level: ReCiPe 2016 Normalized and Weighted Results
4. Conclusions
Author Contributions
Funding
Acknowledgments
Conflicts of Interest
Symbols/Acronyms
| AP | Acidification Potential |
| CED | Cumulative Energy Demand |
| EGS | Engineered Geothermal System |
| EP | Eutrophication Potential |
| GEO | Geothermal with AMIS® process |
| GEO_AS | Geothermal with AMIS® process treatment plus a 40% substitution of natural emissions |
| GEO_NA | Geothermal without AMIS® process |
| GWh/yr | Giga Watt-hour per year |
| H | Hierarchist Cultural Perspective (Endpoint) |
| GWP | Greenhouse Warming Potential |
| Hrs/yr | Hours per year |
| LCA | Life Cycle Analysis |
| LCI | Life-Cycle Inventory |
| LCIA | Life Cycle Impact Assessment |
| MWe | MegaWatt electric |
| MWth | MegaWatt thermal |
| NCG | Non-Condensable Gases |
| PV | Photovoltaic |
| RES | Renewable Energy Source |
| VRE | Variable Renewable Energy |
| W | Wind |
Appendix A. Life Cycle Inventory Data for the Chiusdino 1 Power Plant

| Name | Chiusdino 1 | |
|---|---|---|
| Location | 43°09’37.0” N 11°03’49.9” E | |
| Construction start date | Dec-2010 | |
| Expected life | 30 | yrs |
| Geothermal reservoir | Metamorphic | |
| Reservoir depth | 3–4.5 | km |
| Land occupation | 11,000 | m2 |
| Type of geothermal resource | Steam | |
| Production technology | Natural draft | |
| Electrical generation technology | Flash and condensation | |
| Cooling system | Evaporative towers | |
| End-use of energy | Electricity | |
| Installed capacity | ||
| Electrical | 20 | MWe |
| Operating capacity | ||
| Electrical | 18 | MWe |
| Expected annual decay rate | 0 | % per year |
| Net annual production | ||
| Electricity delivered to the grid | 151.2 | GWh |
| Capacity factor | 8400 | h |
| Out of order | 18 | h/yr |
| Average pressure at the wellhead | 15.74 | bar |
| Average temperature at the wellhead | 199.61 | °C |
| Overall flow rate | 36.1 | kg/s |
| Condenser temperature | 25 | °C |
| Reinjection | ||
| Temperature | 25 | °C |
| Pressure | Atmospheric | |
| Liquid phase, % of the total from the wells | 30% | |
| Gas phase | 0% | |
| Composition of the geothermal fluid | ||
| Dissolved gasses (NCG) mass fraction | 4.00% | |
| CO2 | 5100 | kg/h |
| CO | 0.4 | kg/h |
| CH4 | 79 | kg/h |
| H2S | 90 | kg/h |
| NH3 | 11.6 | kg/h |
| Hg | 5.6 | g/h |
| Trace elements | ||
| As | 0.042 | mg/L |
| B | - | mg/L |
| Sb | - | mg/L |
| Se | - | mg/L |
| Rn | - | Bq/m3 |
| NCG emissions treatment system (AMIS) | ||
| H2S removal efficiency | 99.8% | |
| Hg removal efficiency | 82.2% | |
| NH3 removal efficiency | 87% | |
| CO2 removal efficiency | 0% | |
| B removal efficiency | 99% | |
| As removal efficiency | 99% |
| Drilling | ||
| Production wells | 5 | |
| Average depth | 3818 | m |
| Reinjection wells (equivalent) | 2 | |
| Average depth | 3000 | m |
| Drilling time | 146 | days per well |
| Diesel fuel consumption for generator set (total) | 1,970,950 | l |
| Diesel fuel consumption—construction works, per well | 309,734 | l |
| Wells casing and cementing | ||
| Production wells | ||
| Steel | 1,458,476 | kg |
| Portland cement | 1,737,190 | kg |
| Bentonite | 832,324 | kg |
| Silica sand | 503,976 | kg |
| Lignosulfonates | 11,454 | kg |
| Perlite | 38,180 | kg |
| NaOH | 1,282,848 | kg |
| HCl | 328,348 | l |
| Oli and lubricants | 91,632 | kg |
| Excavations | 1925 | m3 |
| Drilling mud | 2,103,718 | kg |
| Reinjection wells (equivalent) | ||
| Steel | 228,971 | kg |
| Portland cement | 272,972 | kg |
| Bentonite | 130,600 | kg |
| Silica sand | 79,047 | kg |
| Lignosulfonates | 0 | kg |
| Perlite | 5814 | kg |
| NaOH | 188,426 | kg |
| HCl | 13,358 | l |
| Oli and lubricants | 14,457 | kg |
| Excavations | 2,931,364,589 | m3 |
| Drilling mud | 320,351 | kg |
| Drilling Platform | ||
| Occupied surface | 10,000 | m2 |
| Portland cement | 1,230,000 | kg |
| Aluminum | 9000 | kg |
| Steel | 43,000 | kg |
| Sand | 1,937,000 | kg |
| Plastic | 1250 | kg |
| Excavation | 1790 | m3 |
| Fills | 2150 | m3 |
| Steam adduction pipeline | ||
| Total length | 2758 | m |
| Steel for supports and foundations | 163,736 | |
| Steel for piping | 313,398 | kg |
| Portland cement | 493.680 | m3 |
| Aluminum | 12,962.6 | kg |
| Rock wool insulation | 130,177.6 | kg |
| Excavations | 468.86 | m3 |
| Fills | 468.86 | m3 |
| Condensate Pipeline | ||
| Total length | 5,000 | m |
| Plastics | 36,565 | kg |
| Powerhouse Equipment | ||
| Turbine and Alternator | ||
| Number of turbines | 1 | |
| Rated Power | 20 | MWe |
| Type | Ansaldo TUVA 20 MW 2nd generation | |
| Expected Life * | 25 | years |
| Number of alternators | 1 | |
| Rated Power | 23 | MWA |
| Type | Ansaldo | |
| Expected Life * | >25 | years |
| Cast iron | 13,400 | kg |
| Copper | 4000 | kg |
| Iron-nickel-chromium alloy | 1000 | kg |
| Rock wool | 4400 | kg |
| Chromium steel 18/8 | 9800 | kg |
| Steel, low-alloyed | 600 | kg |
| Steel, unalloyed | 76,400 | kg |
| Compressors | ||
| Number of compressors | 1 | |
| Capacity | 5 | t/h |
| Type | Modified F. Tosi centrifugal unit | |
| Expected Life * | 25 | yrs |
| Aluminum | 5680 | kg |
| Cast iron | 12,120 | kg |
| Steel, unalloyed | 8080 | kg |
| Copper | 16,200 | kg |
| Condenser | ||
| Number of condensers | 1 | |
| Rated Power | 20 | MW |
| Type | Ansaldo/ENEL | |
| Expected Life | 30 | yrs |
| Chromium steel 18/8 | 68,250 | kg |
| Intercooler | ||
| Chromium steel 18/8 | 18,000 | kg |
| Cooling towers | ||
| Number of cells | 3 | |
| Type | Hamon cooling tower | |
| Main material | PSRV | |
| Expected Life | 25 | yrs |
| Steel piping | 8190 | kg |
| Plastic piping | 81,900 | kg |
| Fiberglass | 90,220 | kg |
| Copper | 150 | kg |
| Cast iron | 450 | kg |
| Gas treatment system | ||
| Type | AMIS 1 unit | |
| Main material | Stainless steel 316L | |
| Capacity (max flow rate) | 5000 | kg/h |
| Expected Life | 30 | years |
| Sorbent (Selenium for Hg) | 4000 | kg |
| Catalyst (Titanium for H2S) | 9000 | kg |
| Aluminum | 500 | kg |
| Chromium steel 18/8 | 11,500 | kg |
| Building | ||
| Portland cement | 637,500 | kg |
| Diesel fuel for construction works | 195,500 | l |
| Excavations | 8,500 | m3 |
| Plastic pipes | 637,500 | kg |
| Fills | 17,944,960 | kg |
| Aluminum | 810 | kg |
| Steel, low-alloyed | 170,000 | kg |
| Accessories | ||
| Copper | 30,000 | kg |
| Plastic pipes | 15,000 | kg |
| Chromium steel 18/8 | 150,000 | kg |
| Steel, low-alloyed | 220,000 | kg |
| Emissions-to-Air | ||
| CO2 | 5100 | kg/h |
| CO | 0.4 | kg/h |
| H2S | 18.4 | kg/h |
| CH4 | 79.3 | kg/h |
| NH3 | 1.5 | kg/h |
| Hg | 1.1 | g/h |
| As | 2.8 | mg/h |
| Se | 0.4 | g/h |
| Machinery maintenance | ||
| Lubricants | 25,000 | kg |
| Waste mineral oil | 25,000 | kg |
| Iron-nickel-chromium alloy | 5375 | kg |
| Chromium steel 18/8 | 3500 | kg |
| Waste steel | 8875 | kg |
| Fluid treatment | ||
| NaOH | 2,500,000 | kg/yr |
| Wells Abandonment (per well) | ||
|---|---|---|
| Expected time | 10 | days |
| Diesel fuel consumption | 25,000 | l |
| Portland cement | 25,000 | kg |
| Inert | 5000 | kg |
| Steel | 0 | kg |
| Water | 0 | l |
Appendix B. Life Cycle Inventory Data for the Pietragalla Wind Farm
| Name | Potenza Pietragalla | |
|---|---|---|
| Location | 40.776954, 15.837555 | |
| Construction start date | 2005 | |
| Expected life | 30 | years |
| Land occupation | 1,500,000 | m2 |
| Production technology | HAWT Repower MM92 | |
| Electrical generation technology | Generator at the summit MV at ground HV at substation | |
| End-use of energy | Electricity | |
| Installed capacity | ||
| Electrical | 18 | MWe |
| Operating capacity | ||
| Electrical | 18 | MWe |
| Expected annual decay rate for the electrical power | 0 | % per yr |
| Net annual production | ||
| Electricity delivered to the grid | 25.2 | GWh |
| Capacity factor (at 18 MWe) | 1400 | h |
| Out of order (per year) | 50 | h |
| Resource characteristics | ||
| Mean power density (at 100 m) | 1041 | W/m2 |
| Maximum average wind speed (at 100 m) | 9.32 | m/s |
| Pitches and Logistic Surfaces | ||
| Excavations | 75,000 | m3 |
| Fills | 11,250 | m3 |
| Steel | 430,272 | kg |
| Cement | 3339 | m3 |
| Occupied surface | 20,305 | m2 |
| Wood | 324 | m2 |
| Diesel fuel for excavations | 37,500 | l |
| Cable-Ducts | ||
| Total length | 15,000 | m |
| Aluminum | 19,660 | kg |
| Copper | 6560 | kg |
| Optical fiber | 15,000 | m |
| Excavations | 7015 | m3 |
| Fills | 1960 | m3 |
| Diesel fuel for excavations | 3510 | l |
| Occupied surface | 7500 | m2 |
| Horizontal Axis Wind Turbine (HWAT) | ||
| Number of HAWT | 9 | |
| Rated power | 2 | MW |
| Description | Repower MM92 | |
| Expected life | 30 | years |
| Diesel fuel for construction works | 14,400 | l |
| Tower | ||
| Steel | 146,500 | kg |
| Copper | 6480 | kg |
| Rotor Blades | ||
| Steel | 1620 | kg |
| Fiberglass | 6480 | kg |
| Nacelle | ||
| Steel | 56,520 | kg |
| Copper | 5600 | kg |
| Fiberglass | 2780 | kg |
| Hub | ||
| Steel | 17,000 | kg |
| Viability (Road Constructions) | ||
| Excavations | 24,784 | m3 |
| Fills | 700,800 | kg |
| Asphalt | 8190 | m3 |
| Diesel fuel for construction works | 13,000 | l |
| Substation | ||
| Steel | 36,800 | kg |
| Fills | 1220 | m3 |
| PEAD tubing | 1260 | kg |
| Cement | 970 | m3 |
| Pre-cast concrete | 16.4 | m3 |
| Copper | 5000 | kg |
| Aluminum | 1500 | kg |
| Diesel | 1000 | l |
| Occupied surface | 2620 | m2 |
| Lubricating oil | 202,500 | kg |
| Waste mineral oils | 202,500 | kg |
| Steel, chromium 18/8 | 999,000 | kg |
| Steel, low alloyed | 540,000 | kg |
| Iron Scrap | 1,539,000 | kg |
| Diesel for O&M | 54,000 | l |
| Machinery disassemblement | ||
|---|---|---|
| Time (per HAWT—estimate) | 10 | days |
| Diesel for O&M (per HAWT—estimate) | 25,000 | l |
| Steel (per HAWT—95% recycled) | 221,640 | kg |
| Copper (per HAWT—95% recycled) | 12,080 | kg |
| Fiberglass (per HAWT—100% recycled) | 22,220 | kg |
| Cement (per HAWT—left on site) | 371 | m3 |
| Iron for foundation works (per HAWT—95% recycled) | 47,808 | kg |
Appendix C. Life Cycle Inventory data for the Serre Persano DS Photovoltaic Power Plant
| Name | Serre Persano DS | |
|---|---|---|
| Location | 40°34’08.5” N 15°06’10.5” E | |
| Construction start date | 2013 | |
| Expected life | 30 | yrs |
| Land occupation | 770,000 | m2 |
| Electrical generation technology | Photovoltaic generator, inverter for subfield, elevation downstream substation | |
| Module NA F130 G5 | 53,760 | |
| Module NA F135 G6 | 103,796 | |
| Inverter Santerno SUNWAY TG760 1000V TE | 24 | |
| End-use of energy | Electricity | |
| Installed capacity | ||
| Electrical | 21.0 | MWe |
| Operating capacity | ||
| Electrical | 19.53 | MWe |
| Expected annual decay rate | 0.07 | % per year |
| Net annual production | ||
| Electricity delivered to the grid | 29.50 | GWh |
| Capacity factor | 1281 | h |
| Out of order (per year) | 0 | h |
| Resource characteristics | ||
| Global annual radiation on the normal surface | 2131 | kWh/m2 |
| Pitches and Logistic Surfaces | ||
| Excavations | 54,000 | m3 |
| Fills | 1080 | m3 |
| Occupied surface | 770,000 | m2 |
| Diesel for excavations | 30,000 | l |
| Metal Carpentry | ||
| Steel | 10,023,790 | kg |
| Aluminum | 2,594,686 | kg |
| Diesel for construction | 18,135 | l |
| Photovoltaic Modules | ||
| Module NA F130 G5 | 53,760 | |
| Module NA F135 G6 | 103,796 | |
| Electrical Connections | ||
| Copper | 63,125 | kg |
| Aluminum | 1516 | kg |
| Excavations | 2954 | m3 |
| Sand | 29,546 | kg |
| Cement | 1181 | kg |
| Plastic | 18,381 | kg |
| Diesel for construction | 1477 | l |
| Inverter | ||
| Inverter Santerno SUNWAY TG760 1000V TE | 24 | |
| Delivery Cabin | ||
| Precast concrete | 41,000 | kg |
| Portland cement | 272,176 | kg |
| Diesel for construction | 1176 | l |
| Plastic pipes | 1470 | kg |
| Fills | 581,760 | kg |
| Steel | 43,052 | kg |
| Aluminum | 1743 | kg |
| Copper | 5880 | kg |
| Diesel for cleaning machine | 56,270 | l |
| Decarbonised water | 16,881,000 | kg |
| Diesel for disassembly | 341 | l |
| Electricity, medium voltage | 159,716 | kWh |
| Used cable | 29,935 | kg |
| Aluminum scrap for melting | 511,899 | kg |
| Inert material and fill | 2,451,729 | kg |
Appendix D. Synthesis tables of ILCD and ReCiPe Impact Analysis
| GEO | GEO_AS | GEO_NA | W | PV | NEM | |
|---|---|---|---|---|---|---|
| Acidification (molc H+ eq) | 3,04E-03 | 1,92E-03 | 1,14E-02 | 6,30E-05 | 1,50E-04 | 2,34E-03 |
| Climate change (kg CO2 eq) | 4,77E-01 | 3,01E-01 | 4,59E-01 | 1,34E-02 | 2,66E-02 | 4,84E-01 |
| Freshwater ecotoxicity (CTUe) | 2,09E-03 | 2,50E-03 | 8,96E-04 | 7,41E-04 | 5,85E-03 | 5,14E-03 |
| Freshwater eutrophication (kg P eq) | 1,18E-05 | 1,41E-05 | 2,30E-06 | 2,88E-06 | 1,81E-05 | 9,04E-05 |
| Human toxicity, cancer effects (CTUh) | 6,58E-04 | 4,31E-04 | 2,38E-03 | 1,72E-05 | 6,49E-05 | 5,09E-04 |
| Human toxicity, non-cancer effects (CTUh) | 1,89E-03 | 2,26E-03 | 1,21E-03 | 8,09E-04 | 1,78E-02 | 7,62E-03 |
| Ionizing radiation E (interim) (CTUe) | 2,80E-02 | 3,26E-02 | 1,35E-02 | 7,33E-03 | 6,22E-02 | 1,05E-01 |
| Ionizing radiation HH (kBq U235 eq) | 2,31E-03 | 2,77E-03 | 2,53E-04 | 4,28E-04 | 1,64E-03 | 2,71E-03 |
| Land use (kg C deficit) | 1,74E-04 | 2,08E-04 | 4,60E-05 | 1,76E-04 | 2,33E-04 | 9,31E-04 |
| Marine eutrophication (kg N eq) | 2,71E-03 | 3,24E-03 | 1,19E-03 | 9,41E-04 | 7,45E-03 | 7,05E-03 |
| Mineral, fossil & ren resource depletion (kg Sb eq) | 1,13E-06 | 1,36E-06 | 1,85E-07 | 2,27E-07 | 1,50E-06 | 7,19E-06 |
| Ozone depletion (kg CFC-11 e) | 6,15E-03 | 7,37E-03 | 1,68E-03 | 5,17E-03 | 6,53E-03 | 1,47E-01 |
| Particulate matter (kg PM2.5 eq) | 1,97E-05 | 2,36E-05 | 1,42E-05 | 3,90E-05 | 1,79E-05 | 1,21E-05 |
| Photochemical ozone formation (kg NMVOC eq) | 2,41E-08 | 2,89E-08 | 4,00E-09 | 3,36E-09 | 8,91E-09 | 3,37E-07 |
| Terrestrial eutrophication (molvc N eq) | 9,10E-05 | 1,09E-04 | 4,92E-05 | 3,29E-05 | 8,03E-05 | 8,33E-04 |
| Water resource depletion (m3 water eq) | 9,22E-05 | 1,11E-04 | 5,00E-05 | 3,39E-05 | 8,41E-05 | 8,48E-04 |
| GEO | GEO_AS | GEO_NA | W | PV | NEM | |
|---|---|---|---|---|---|---|
| Terrestrial acidification (kg SO2 eq) | 2,27E-03 | 1,42E-03 | 8,58E-03 | 4,15E-05 | 9,68E-05 | 1,58E-03 |
| Global Warming (kg CO2 eq) | 4,77E-01 | 3,01E-01 | 4,59E-01 | 1,34E-02 | 2,66E-02 | 4,84E-01 |
| Freshwater ecotoxicity (kg 1,4-DB eq) | 2,09E-03 | 2,50E-03 | 8,96E-04 | 7,41E-04 | 5,85E-03 | 5,14E-03 |
| Freshwater eutrophication (kg P eq) | 1,18E-05 | 1,41E-05 | 2,30E-06 | 2,88E-06 | 1,81E-05 | 9,04E-05 |
| Fine particulate matter formation (kg PM2,5 eq) | 6,58E-04 | 4,31E-04 | 2,38E-03 | 1,72E-05 | 6,49E-05 | 5,09E-04 |
| Human toxicity carcinogenic (kg 1,4-DB eq) | 1,89E-03 | 2,26E-03 | 1,21E-03 | 8,09E-04 | 1,78E-02 | 7,62E-03 |
| Human toxicity non-carcinogenic (kg 1,4-DB eq) | 2,80E-02 | 3,26E-02 | 1,35E-02 | 7,33E-03 | 6,22E-02 | 1,05E-01 |
| Ionising radiation (kBq Co-60 eq) | 2,31E-03 | 2,77E-03 | 2,53E-04 | 4,28E-04 | 1,64E-03 | 2,71E-03 |
| Land use (m2 yr crop eq) | 1,74E-04 | 2,08E-04 | 4,60E-05 | 1,76E-04 | 2,33E-04 | 9,31E-04 |
| Marine ecotoxicity (kg 1,4-DB eq) | 2,71E-03 | 3,24E-03 | 1,19E-03 | 9,41E-04 | 7,45E-03 | 7,05E-03 |
| Marine eutrophication (kg N eq) | 1,13E-06 | 1,36E-06 | 1,85E-07 | 2,27E-07 | 1,50E-06 | 7,19E-06 |
| Fossil resource scarcity (kg oil eq) | 6,15E-03 | 7,37E-03 | 1,68E-03 | 5,17E-03 | 6,53E-03 | 1,47E-01 |
| Mineral resource scarcity (kg Cu eq) | 1,97E-05 | 2,36E-05 | 1,42E-05 | 3,90E-05 | 1,79E-05 | 1,21E-05 |
| Stratospheric Ozone depletion (kg CFC-11 eq) | 2,41E-08 | 2,89E-08 | 4,00E-09 | 3,36E-09 | 8,91E-09 | 3,37E-07 |
| Ozone formation, Human health (kg NOx eq) | 9,10E-05 | 1,09E-04 | 4,92E-05 | 3,29E-05 | 8,03E-05 | 8,33E-04 |
| Ozone formation, Terrestrial ecosystems (kg NOx eq) | 9,22E-05 | 1,11E-04 | 5,00E-05 | 3,39E-05 | 8,41E-05 | 8,48E-04 |
| Terrestrial ecotoxicity (kg 1,4-DB eq) | 2,10E-01 | 1,98E-01 | 2,67E-01 | 3,09E-02 | 1,82E-01 | 3,18E-01 |
| Water consumption (m3) | 1,60E-01 | 1,92E-01 | 3,38E-02 | 2,18E-02 | 1,90E-01 | 3,15E+00 |
References
- Uihlein, A. JRC Geothermal Power Plant Dataset—Documentation, EUR 29446 EN; JRC Technical Report; Publications Office of the European Union: Luxembourg, 2018. [Google Scholar]
- Di Pippo, R. (Ed.) Geothermal Power Generation; Elsevier Ltd.: Amsterdam, The Netherlands, 2016; ISBN 9780081003442. [Google Scholar]
- Anderson, A.; Rezaie, B. Geothermal technology: Trends and potential role in a sustainable future. Appl. Energy 2019, 248, 18–34. [Google Scholar] [CrossRef]
- Bertani, R. Geothermal power generation in the world 2010–2014 update report. Geothermics 2016, 60, 31–43. [Google Scholar] [CrossRef]
- Lund, J.W.; Boyd, T.L. Direct utilization of geothermal energy 2015 worldwide review. Geothermics 2016, 60, 66–93. [Google Scholar] [CrossRef]
- Trumpy, E.; Bertani, R.; Manzella, A.; Sander, M. The web-oriented framework of the world geothermal production database: A business intelligence platform for wide data distribution and analysis. Renew. Energy 2015, 74, 379–389. [Google Scholar] [CrossRef]
- Barbier, E. Geothermal energy technology and current status: An overview. Renew. Sustain. Energy Rev. 2002, 6, 3–65. [Google Scholar] [CrossRef]
- Lu, S.M. A global review of enhanced geothermal system (EGS). Renew. Sustain. Energy Rev. 2018, 81, 2902–2921. [Google Scholar] [CrossRef]
- Laboratory, I.N. The Future of Geothermal Energy The Future of Geothermal Energy; Massachusetts Institute of Technology All: Idaho Falls, ID, USA, 2006; ISBN 0615134386. [Google Scholar]
- Shortall, R.; Davidsdottir, B.; Axelsson, G. A sustainability assessment framework for geothermal energy projects: Development in Iceland, New Zealand and Kenya. Renew. Sustain. Energy Rev. 2015, 50, 372–407. [Google Scholar] [CrossRef]
- Ciriaco, A.E.; Zarrouq, S.J.; Sakeri, G. Geothermal resource and reserve assessment methodology: Overview, analysis and future directions. Renew. Sustain. Energy Rev. 2020, 119, 109515. [Google Scholar] [CrossRef]
- Sanner, B. Summary of EGC 2019 country update reports on geothermal energy in europe. In Proceedings of the European Geothermal Congress 2019, the Hague, the Netherlands, 11–14 June 2019; p. 18. [Google Scholar]
- Baldacci, A.; Mannari, M.; Sansone, F. Greening of geothermal power: An innovative technology for abatement of hydrogen sulphide and mercury emission. In Proceedings of the World Geothermal Congress 2005, Antalya, Turkey, 24–29 April 2005. [Google Scholar]
- Manzella, A.; Bonciani, R.; Allansdottir, A.; Botteghi, S.; Donato, A.; Giamberini, S.; Lenzi, A.; Paci, M.; Pellizzone, A.; Scrocca, D. Environmental and social aspects of geothermal energy in Italy. Geothermics 2018, 72, 232–248. [Google Scholar] [CrossRef]
- Gestore Servizi Energetici Rapporto Statistico 2017; Gestore Servizi Energetici: Rome, Italy, 2018.
- International Energy Agency. World Energy Outlook; International Energy Agency: Paris, France, 2018. [Google Scholar]
- Shortall, R.; Uihlein, A. Geothermal Energy Technology Development Report 2018, EUR 29917 EN; Publications Office of the European Union: Luxembourg, 2019. [Google Scholar]
- Shortall, R.; Uihlein, A.; Carrara, S. Geothermal Energy Technology Market Report 2018, EUR 29933 EN; Publications Office of the European Union: Luxembourg, 2019. [Google Scholar]
- International Organization for Standardization. ISO 14040:2006—Environmental Management—Life Cycle Assessment—Principles and Framework; ISO: Geneva, Switzerland, 2006. [Google Scholar]
- International Organization for Standardization. For ISO 14044:2006 Environmental Management—Life Cycle Assessment—Requirements and Guidelines; ISO: Geneva, Switzerland, 2006. [Google Scholar]
- Klopffer, W. Life cycle assessment—From the beginning to the current state. Environ. Sci. Pollut. Res. 1997, 4, 223–228. [Google Scholar] [CrossRef]
- European Commission. International Reference Life Cycle Data System (ILCD) Handbook: Framework and Requirements for Life Cycle Impact Assessment Models and Indicators; European Commission: Brussels, Belgium, 2010; ISBN 9789279175398. [Google Scholar]
- Spath, P.L.; Mann, M.K.; Kerr, D.R. Life Cycle Assessment of Coal-fired Power Production; National Renewable Energy Lab.: Golden, CO, USA, 1999.
- Spath, P.L.; Mann, M.K. Life Cycle Assessment of a Natural Gas Combined-Cycle Power Generation System—National Renewable Energy Laboratory—NREL/TP-570-27715; National Renewable Energy Lab.: Golden, CO, USA, 2000.
- Kannan, R.; Leong, K.C.; Osman, R.; Ho, H.K.; Tso, C.P. Gas fired combined cycle plant in Singapore: Energy use, GWP and cost-a life cycle approach. Energy Convers. Manag. 2005, 46, 2145–2157. [Google Scholar] [CrossRef]
- Kim, H.C.; Fthenakis, V.; Choi, J.K.; Turney, D.E. Life cycle greenhouse gas emissions of thin-film photovoltaic electricity generation: Systematic review and harmonization. J. Ind. Ecol. 2012, 16, S110–S121. [Google Scholar] [CrossRef]
- Gerbinet, S.; Belboom, S.; Léonard, A. Life Cycle Analysis (LCA) of photovoltaic panels: A review. Renew. Sustain. Energy Rev. 2014, 38, 747–753. [Google Scholar] [CrossRef]
- Stoppato, A. Life cycle assessment of photovoltaic electricity generation. Energy 2008, 33, 224–232. [Google Scholar] [CrossRef]
- Sherwani, A.F.; Usmani, J.A. Varun Life cycle assessment of solar PV based electricity generation systems: A review. Renew. Sustain. Energy Rev. 2010, 14, 540–544. [Google Scholar] [CrossRef]
- Jungbluth, N. Life cycle assessment of crystalline photovoltaics in the Swiss ecoinvent database. Prog. Photovolt. Res. Appl. 2005, 13, 429–446. [Google Scholar] [CrossRef]
- Koroneos, C.; Stylos, N.; Moussiopoulos, N. LCA of multicrystalline silicon photovoltaic systems. Part 1: Present situation and future perspectives. Int. J. Life Cycle Assess. 2006, 11, 129–136. [Google Scholar] [CrossRef]
- Koroneos, C.; Stylos, N.; Moussiopoulos, N. LCA of multicrystalline silicon photovoltaic systems: Part 2: Application on an island economy. Int. J. Life Cycle Assess. 2006, 11, 183–188. [Google Scholar] [CrossRef]
- Peng, J.; Lu, L.; Yang, H. Review on life cycle assessment of energy payback and greenhouse gas emission of solar photovoltaic systems. Renew. Sustain. Energy Rev. 2013, 19, 255–274. [Google Scholar] [CrossRef]
- Maranghi, S.; Parisi, M.L.; Basosi, R.; Sinicropi, A. Environmental profile of the manufacturing process of perovskite photovoltaics: Harmonization of life cycle assessment studies. Energies 2019, 12, 3746. [Google Scholar] [CrossRef]
- Muteri, V.; Cellura, M.; Curto, D.; Franzitta, V.; Longo, S.; Mistretta, M.; Parisi, M.L. Review on life cycle assessment of solar photovoltaic panels. Energies 2020, 13, 252. [Google Scholar] [CrossRef]
- Raugei, M.; Bargigli, S.; Ulgiati, S. Life cycle assessment and energy pay-back time of advanced photovoltaic modules: CdTe and CIS compared to poly-Si. Energy 2007, 32, 1310–1318. [Google Scholar] [CrossRef]
- Fthenakis, V.M.; Frischknecht, R.; Raugei, M.; Kim, H.C.; Alsema, E.; Held, M.; de Wild Scholten, M. Methodology Guidelines on Life Cycle Assessment of Photovoltaic Electricity; Vol. IEA PVPS T; National Renewable Energy Lab.: Golden, CO, USA, 2016; ISBN 978-3-906042-38-1.
- Raadal, H.L.; Gagnon, L.; Modahl, I.S.; Hanssen, O.J. Life cycle greenhouse gas (GHG) emissions from the generation of wind and hydro power. Renew. Sustain. Energy Rev. 2011, 15, 3417–3422. [Google Scholar] [CrossRef]
- Dolan, S.L.; Heath, G.A. Life cycle greenhouse gas emissions of utility-scale wind power: Systematic review and harmonization. J. Ind. Ecol. 2012, 16, 136–154. [Google Scholar] [CrossRef]
- Mendecka, B.; Lombardi, L. Life cycle environmental impacts of wind energy technologies: A review of simplified models and harmonization of the results. Renew. Sustain. Energy Rev. 2019, 111, 462–480. [Google Scholar] [CrossRef]
- Arvesen, A.; Hertwich, E.G. Assessing the life cycle environmental impacts of wind power: A review of present knowledge and research needs. Renew. Sustain. Energy Rev. 2012, 16, 5994–6006. [Google Scholar] [CrossRef]
- Garrett, P.; Rønde, K. Life cycle assessment of wind power: Comprehensive results from a state-of-the-art approach. Int. J. Life Cycle Assess. 2013, 18, 37–48. [Google Scholar] [CrossRef]
- Ardente, F.; Beccali, M.; Cellura, M.; Lo Brano, V. Energy performances and life cycle assessment of an Italian wind farm. Renew. Sustain. Energy Rev. 2008, 12, 200–217. [Google Scholar] [CrossRef]
- Tremeac, B.; Meunier, F. Life cycle analysis of 4.5 MW and 250 W wind turbines. Renew. Sustain. Energy Rev. 2009, 13, 2104–2110. [Google Scholar] [CrossRef]
- Weinzettel, J.; Reenaas, M.; Solli, C.; Hertwich, E.G. Life cycle assessment of a floating offshore wind turbine. Renew. Energy 2009, 34, 742–747. [Google Scholar] [CrossRef]
- Guezuraga, B.; Zauner, R.; Pölz, W. Life cycle assessment of two different 2 MW class wind turbines. Renew. Energy 2012, 37, 37–44. [Google Scholar] [CrossRef]
- Lacirignola, M.; Blanc, I. Environmental analysis of practical design options for enhanced geothermal systems (EGS) through life-cycle assessment. Renew. Energy 2013, 50, 901–914. [Google Scholar] [CrossRef]
- Sullivan, J.L.; Clark, C.E.; Han, J.; Wang, M. Life-Cycle Analysis Results of Geothermal Systems in Comparison to Other Power Systems; Argonne National Lab.: Argonne, IL, USA, 2010.
- Yu, T.; Looijen, J.M.; van der Meer, F.D.; Willemsen, N. A life cycle assessment based comparison of large & small scale geo-thermal electricity production systems. In Proceedings of the 5th Indonesia International Geothermal Convention & Exhibition, Jacarta, Indonesia, 2–4 August 2017; pp. 2–4. [Google Scholar]
- Bravi, M.; Basosi, R. Environmental impact of electricity from selected geothermal power plants in Italy. J. Clean. Prod. 2014, 66, 301–308. [Google Scholar] [CrossRef]
- Frick, S.; Kaltschmitt, M.; Schröder, G. Life cycle assessment of geothermal binary power plants using enhanced low-temperature reservoirs. Energy 2010, 35, 2281–2294. [Google Scholar] [CrossRef]
- Bayer, P.; Rybach, L.; Blum, P.; Brauchler, R. Review on life cycle environmental effects of geothermal power generation. Renew. Sustain. Energy Rev. 2013, 26, 446–463. [Google Scholar] [CrossRef]
- Ruzzenenti, F.; Bravi, M.; Tempesti, D.; Salvatici, E.; Manfrida, G.; Basosi, R. Evaluation of the environmental sustainability of a micro CHP system fueled by low-temperature geothermal and solar energy. Energy Convers. Manag. 2014, 78, 611–616. [Google Scholar] [CrossRef]
- Parisi, M.L.; Ferrara, N.; Torsello, L.; Basosi, R. Life cycle assessment of atmospheric emission profiles of the Italian geothermal power plants. J. Clean. Prod. 2019, 234, 881–894. [Google Scholar] [CrossRef]
- Eberle, A.; Heath, G.A.; Carpenter Petri, A.C.; Nicholson, S.R. Systematic Review of Life Cycle Greenhouse Gas Emissions from Geothermal Electricity; National Renewable Energy Lab.: Golden, CO, USA, 2017.
- Tomasini-Montenegro, C.; Santoyo-Castelazo, E.; Gujba, H.; Romero, R.J.; Santoyo, E. Life cycle assessment of geothermal power generation technologies: An updated review. Appl. Therm. Eng. 2017, 114, 1119–1136. [Google Scholar] [CrossRef]
- Atilgan, B.; Azapagic, A. Renewable electricity in Turkey: Life cycle environmental impacts. Renew. Energy 2016, 89, 649–657. [Google Scholar] [CrossRef]
- Marchand, M.; Blanc, I.; Marquand, A.; Beylot, A.; Bezelgues-Courtade, S.; Traineau, H. Life cycle assessment of high temperature geothermal energy systems. Proc. World Geotherm. Congr. 2015, 19–25. [Google Scholar]
- Asdrubali, F.; Baldinelli, G.; D’Alessandro, F.; Scrucca, F. Life cycle assessment of electricity production from renewable energies: Review and results harmonization. Renew. Sustain. Energy Rev. 2015, 42, 1113–1122. [Google Scholar] [CrossRef]
- Amponsah, N.Y.; Troldborg, M.; Kington, B.; Aalders, I.; Hough, R.L. Greenhouse gas emissions from renewable energy sources: A review of lifecycle considerations. Renew. Sustain. Energy Rev. 2014, 39, 461–475. [Google Scholar] [CrossRef]
- Pehnt, M. Dynamic life cycle assessment (LCA) of renewable energy technologies. Renew. Energy 2006, 31, 55–71. [Google Scholar] [CrossRef]
- Turconi, R.; Boldrin, A.; Astrup, T. Life cycle assessment (LCA) of electricity generation technologies: Overview, comparability and limitations. Renew. Sustain. Energy Rev. 2013, 28, 555–565. [Google Scholar] [CrossRef]
- Greendelta openLCA. Available online: https://www.greendelta.com/ (accessed on 5 February 2020).
- Ecoinvent. Available online: https://www.ecoinvent.org/ (accessed on 5 February 2020).
- Wernet, G.; Bauer, C.; Steubing, B.; Reinhard, J.; Moreno-Ruiz, E.; Weidema, B. The Ecoinvent Database version 3 (part I): Overview and Methodology. Int. J. Life Cycle Assess. 2016, 21, 1218–1230. [Google Scholar] [CrossRef]
- Huijbregts, M.; Steinmann, Z.J.N.; Elshout, P.M.F.M.; Stam, G.; Verones, F.; Vieira, M.D.M.; Zijp, M.; van Zelm, R. ReCiPe 2016—A harmonized life cycle impact assessment method at midpoint and endpoint level. Int. J. Life Cycle Assess. 2016, 22, 138–147. [Google Scholar] [CrossRef]
- European Commission. Characterisation Factors of the ILCD Recommended Life Cycle Impact Assessment Methods: Database and Supporting Information; European Commission: Brussels, Belgium, 2012; ISBN 9789279227271. [Google Scholar]
- Sala, S.; Benini, L.; Castellani, V.; Vidal Legaz, B.; De Laurentiis, V.; Pant, R. Suggestions for the Update of the Environmental Footprint Life Cycle Impact Assessment: Impacts Due to Resource Use, Water Use, land Use, and Particulate Matter; Publications Office of the European Union: Luxembourg, 2019; ISBN 9789279693359. [Google Scholar]
- Sala, S.; Cerutti, A.K.; Pant, R. Development of a weighting approach for the Environmental Footprint; Publications Office of the European Union: Luxembourg, 2018. [Google Scholar]


| Name | Distance 1, m | Depth, m | Flow Rate, t/h | T, °C | p, bar | NCG 3, % |
|---|---|---|---|---|---|---|
| Montieri 5 2 | 2630 | 3447 | 78.8 | 200.8 | 16.2 | 6.0 |
| Montieri 5A 2 | 2630 | 4137 | 22.4 | 200.9 | 16.1 | 4.2 |
| TravaleSud 1B | 172 | 3361 | 26.4 | 198.6 | 15.5 | 6.1 |
| TravaleSud 1C | 172 | 3713 | 25.2 | 198.9 | 15.4 | 4.5 |
| TravaleSud 1D | 172 | 4432 | 24.5 | 198.8 | 15.4 | 4.5 |
| Emission 1 | Flow Rate, kg/h | Specific Emission, kg/kWh |
|---|---|---|
| CO2 | 5100 | 2.6 × 10⁻¹ |
| CO | 0.4 | 2.0 × 10⁻⁵ |
| H2S | 18.4 | 9.2 × 10⁻⁴ |
| CH4 | 79.3 | 4.0 × 10⁻³ |
| NH3 | 1.5 | 7.5 × 10⁻⁵ |
| Hg | 1.1 × 10⁻³ | 5.5 × 10⁻⁸ |
| As | 2.8 × 10⁻⁶ | 1.4 × 10⁻¹⁰ |
| Se | 4.0 × 10⁻⁴ | 2.0 × 10⁻⁸ |
| Field Name | Modules NAF 130 G5 | Modules NAF 135 G5 | Strings NAF 130 G5 | Strings NAF 135 G5 | Number of Inverters |
|---|---|---|---|---|---|
| Spineto | 26,880 | 51,912 | 1920 | 3708 | 12 |
| Borgo San Lazzaro | 26,880 | 51,884 | 1920 | 3706 | 12 |
| GEO | GEO_AS | GEO_NA | Wind | PV | NEM | |
|---|---|---|---|---|---|---|
| Ecosystems, total species*yr | 5.58 × 10⁻⁶ | 5.25 × 10⁻⁶ | 4.99 × 10⁻⁶ | 4.88 × 10⁻⁷ | 3.76·× 10−6 | 6.20 × 10⁻⁵ |
| Human health, total DALY | 5.15 × 10⁻⁵ | 4.17 × 10⁻⁵ | 8.44 × 10⁻⁵ | 3.20 × 10⁻⁶ | 2.36 × 10⁻⁵ | 3.29 × 10⁻⁴ |
| Resources total USD 2013 | 5.08 × 10⁻⁸ | 6.09 × 10⁻⁸ | 2.02 × 10⁻⁸ | 3.60 × 10⁻⁸ | 4.83 × 10⁻⁸ | 1.56 × 10⁻⁸ |
© 2020 by the authors. Licensee MDPI, Basel, Switzerland. This article is an open access article distributed under the terms and conditions of the Creative Commons Attribution (CC BY) license (http://creativecommons.org/licenses/by/4.0/).
Share and Cite
Basosi, R.; Bonciani, R.; Frosali, D.; Manfrida, G.; Parisi, M.L.; Sansone, F. Life Cycle Analysis of a Geothermal Power Plant: Comparison of the Environmental Performance with Other Renewable Energy Systems. Sustainability 2020, 12, 2786. https://doi.org/10.3390/su12072786
Basosi R, Bonciani R, Frosali D, Manfrida G, Parisi ML, Sansone F. Life Cycle Analysis of a Geothermal Power Plant: Comparison of the Environmental Performance with Other Renewable Energy Systems. Sustainability. 2020; 12(7):2786. https://doi.org/10.3390/su12072786
Chicago/Turabian StyleBasosi, Riccardo, Roberto Bonciani, Dario Frosali, Giampaolo Manfrida, Maria Laura Parisi, and Franco Sansone. 2020. "Life Cycle Analysis of a Geothermal Power Plant: Comparison of the Environmental Performance with Other Renewable Energy Systems" Sustainability 12, no. 7: 2786. https://doi.org/10.3390/su12072786
APA StyleBasosi, R., Bonciani, R., Frosali, D., Manfrida, G., Parisi, M. L., & Sansone, F. (2020). Life Cycle Analysis of a Geothermal Power Plant: Comparison of the Environmental Performance with Other Renewable Energy Systems. Sustainability, 12(7), 2786. https://doi.org/10.3390/su12072786