Article

Coastal Erosion Affecting Cultural Heritage in Svalbard. A Case Study in Hiorthhamn (Adventfjorden)—An Abandoned Mining Settlement

by
Ionut Cristi Nicu
1,*,
Knut Stalsberg
2,
Lena Rubensdotter
3,4,
Vibeke Vandrup Martens
5 and
Anne-Cathrine Flyen
5
1
High North Department, Norwegian Institute for Cultural Heritage Research (NIKU), Fram Centre, N-9296 Tromsø, Norway
2
Geological Survey of Norway (NGU), Fram Centre, N-9296 Tromsø, Norway
3
Geological Survey of Norway (NGU), Torgard, P.O. Box 6315, 7491 Trondheim, Norway
4
Arctic Geology Department, The University Centre in Svalbard (UNIS), P.O. Box 156, 9171 Longyearbyen, Norway
5
Norwegian Institute for Cultural Heritage Research (NIKU), Storgata 2, 0155 Oslo, Norway
*
Author to whom correspondence should be addressed.
Sustainability 2020, 12(6), 2306; https://doi.org/10.3390/su12062306
Submission received: 24 February 2020 / Revised: 12 March 2020 / Accepted: 13 March 2020 / Published: 16 March 2020
(This article belongs to the Special Issue Cultural Heritage and Natural Disasters)

Abstract

:
Hiorthhamn is an abandoned Norwegian coal mining settlement with a loading dock and a lot of industrial infrastructure left in the coastal zone. In this study, changes in the position of 1.3 km of the Hiorthhamn shoreline, which affect cultural heritage, is described for a time-period spanning 92 years (1927–2019). The shoreline positions were established based on a map (1927), orthophotos (2009) and a topographic survey with differential Global Positioning System (GPS) (summer 2019). Detailed geomorphological and surface sediment mapping was conducted to form a framework for understanding shoreline-landscape interaction. The shoreline was divided into three sectors to calculate the erosion/stability/accretion rates by using the DSAS (Digital Shoreline Analysis System) extension of ArcGIS. The DSAS analysis showed very high erosion in Sector 1, while Sectors 2 and 3 showed moderate accretion and moderate erosion, respectively. Sector 1 is geologically composed of easily erodible sorted beach sediments and protected remains from the mining industry such as wrecks of heavy machines, loading carts, wagons and rusty tracks that are directly exposed to coastal erosion. The all-sector average shoreline erosion rate (EPR parameter) for the 92 years period was −0.21 m/year. The high shoreline erosion rates in Sector 1, together with the high potential damage to cultural heritage, supports the urgent need of continued coastal monitoring and sustainable management of cultural heritage in Hiorthhamn.

1. Introduction

Coastal areas of seas and oceans are among the most dynamic landforms and are permanently under threat of change from natural processes and anthropogenic pressure. A significant proportion of the world’s population, at present and throughout history, lives in coastal areas (between 15% and 40%), which are under the direct effects of climatic change-related [1,2] processes such as sea-level rise [3] and changes in the intensity and frequency of storms [4]. Over the last decades, coastal areas have been subjected to increased rates of erosion [5], and this will most likely cause significant economic losses in the future. Arctic coastal areas can experience erosion rates similar to, or higher than, those in temperate regions due to the added influence of thawing permafrost and extreme temperatures.
Coastal areas located at high latitudes are even more affected by the changes in the environment (e.g., air temperatures, major river discharges and open water season length have increased, and storm tracks and intensities are changing) [6]. The Arctic coastal zone is defined as the region both seaward and landward of the coastlines of the Arctic shelf areas, including all archipelagos and islands [7]. Arctic coastal areas can experience erosion rates similar to or higher than those in temperate regions due to the added influence of thawing permafrost and extreme temperatures, even though the erosional processes are usually still limited to a few months per year [6]. Arctic areas have become important hot spots for studying the effects of a changing climate [8], which is felt earlier there than elsewhere on Earth [9]. The present ongoing research focuses on modelling the velocity of glaciers and ice caps [10], land cover and ice-wedge polygon mapping [11,12], the surface morphology of fans [13], retrogressive thaw slumps triggering [14,15], coastal erosion [16], human impact [17], etc. One of the most exposed Arctic areas is Svalbard, which is experiencing amplified climate change when compared to the global average [18,19]. Svalbard’s coastal area is under high pressure from natural [20] and in some area’s anthropogenic changes [21,22].
Studying the physical dynamics of coastal areas is a challenging task with a huge potential to be applied in future coastal management plans and sustainable development of coastal areas. With the technological development, tracking coastal erosion and the associated coastal hazards became easier; new tools are being developed and implemented, along with their integration in GIS (Geographic Information System). Various GIS-based tools have been developed over the years in order to realise different analyses of coastal areas; they have been used in different studies, as follows: XBeach modelling [23], Ntool [24], CERA (Coastal Erosion Risk Assessment) [25], CHW (Coastal Hazard Wheel) [26,27], CESM (Coastal Erosion Susceptibility Model) [28], CVI (Coastal Vulnerability Index) [29], DSAS (Digital Shoreline Analysis System) [30,31,32].
Aside from the economic activities and the local population located on the coast that is under threat from climatic changes, another significant asset is often neglected when studies are made in the coastal areas—cultural heritage. Globally speaking, coastal areas have been used since Prehistory for human settlement, due to their abundance in natural resources needed for survival and development [33]. Coastal cultural heritage represents an important part of cultural resources in the coastal areas [34]; regardless of the location of cultural heritage, on the coasts of the inland shorelines of large man-made reservoirs [35,36], open seas and ocean coastal areas [37,38,39], there is a high risk of erosion [40].
The world’s cultural heritage is under direct threat from climate change [41]. Cultural heritage located in Arctic areas is even in greater danger [42,43], both from natural causes (such as erosion or burial) [44] and the increasing pressure of Arctic tourism [22,45], which has grown especially in Svalbard [46]. Significant efforts are being made to minimise the impact of visitors on the environment and to move the tourist industry towards a sustainable approach [47]. Over the years, the coastal areas of Svalbard have been subject to intense research (Table 1, Figure 1).
Studies that approach the coastal processes affecting cultural heritage sites are of high significance; as cultural heritage in the Arctic is in great danger [61,62,63]. The present study aims to assess and quantify the main changes along an approximately 1.3 km stretch of shoreline located in Hiorthhamn—on the eastern shore of Adventfjorden, Svalbard, where cultural heritage is under threat from coastal erosion. The DSAS tool [64] is implemented to evaluate the erosion and accretion rate of the coastline over time. The quantification of change is complemented with a detailed geological and geomorphological mapping of the affected and adjacent area that will bring new insights in understanding how different substrata and geomorphological processes interact and are affected by coastal processes in a changing Arctic climate. Along with the assessment of coastal erosion, field-based geological mapping was employed, in order to understand the associated geological processes and to map them. The area under interest was chosen within a research project financed by the Research Council of Norway—CULTCOAST [65].

The CULTCOAST Project

CULTural Heritage Sites in COASTal Areas. Monitor, Manage and Preserve Sites and Landscapes under Climate Change and Development Pressure—CULTCOAST is a project financed by the Research Council of Norway (RCN) for the period 2019–2023 under the programme MILJØFORSK [65]. The primary objective of this project is to monitor, manage and preserve cultural heritage sites, environments and landscapes under climate change and development pressure. The project brings together an international multidisciplinary team specialised in the evaluation, assessment, protection and conservation of heritage, from research and education institutions in Norway (Norwegian Institute for Cultural Heritage Research—NIKU; University of South-Eastern Norway—USN; Geological Survey of Norway—NGU; Foundation for Industrial and Technical Research—SINTEF), UK (University of St Andrews), and Russia (Kazan Federal University).

2. Study Area and Cultural Heritage Background
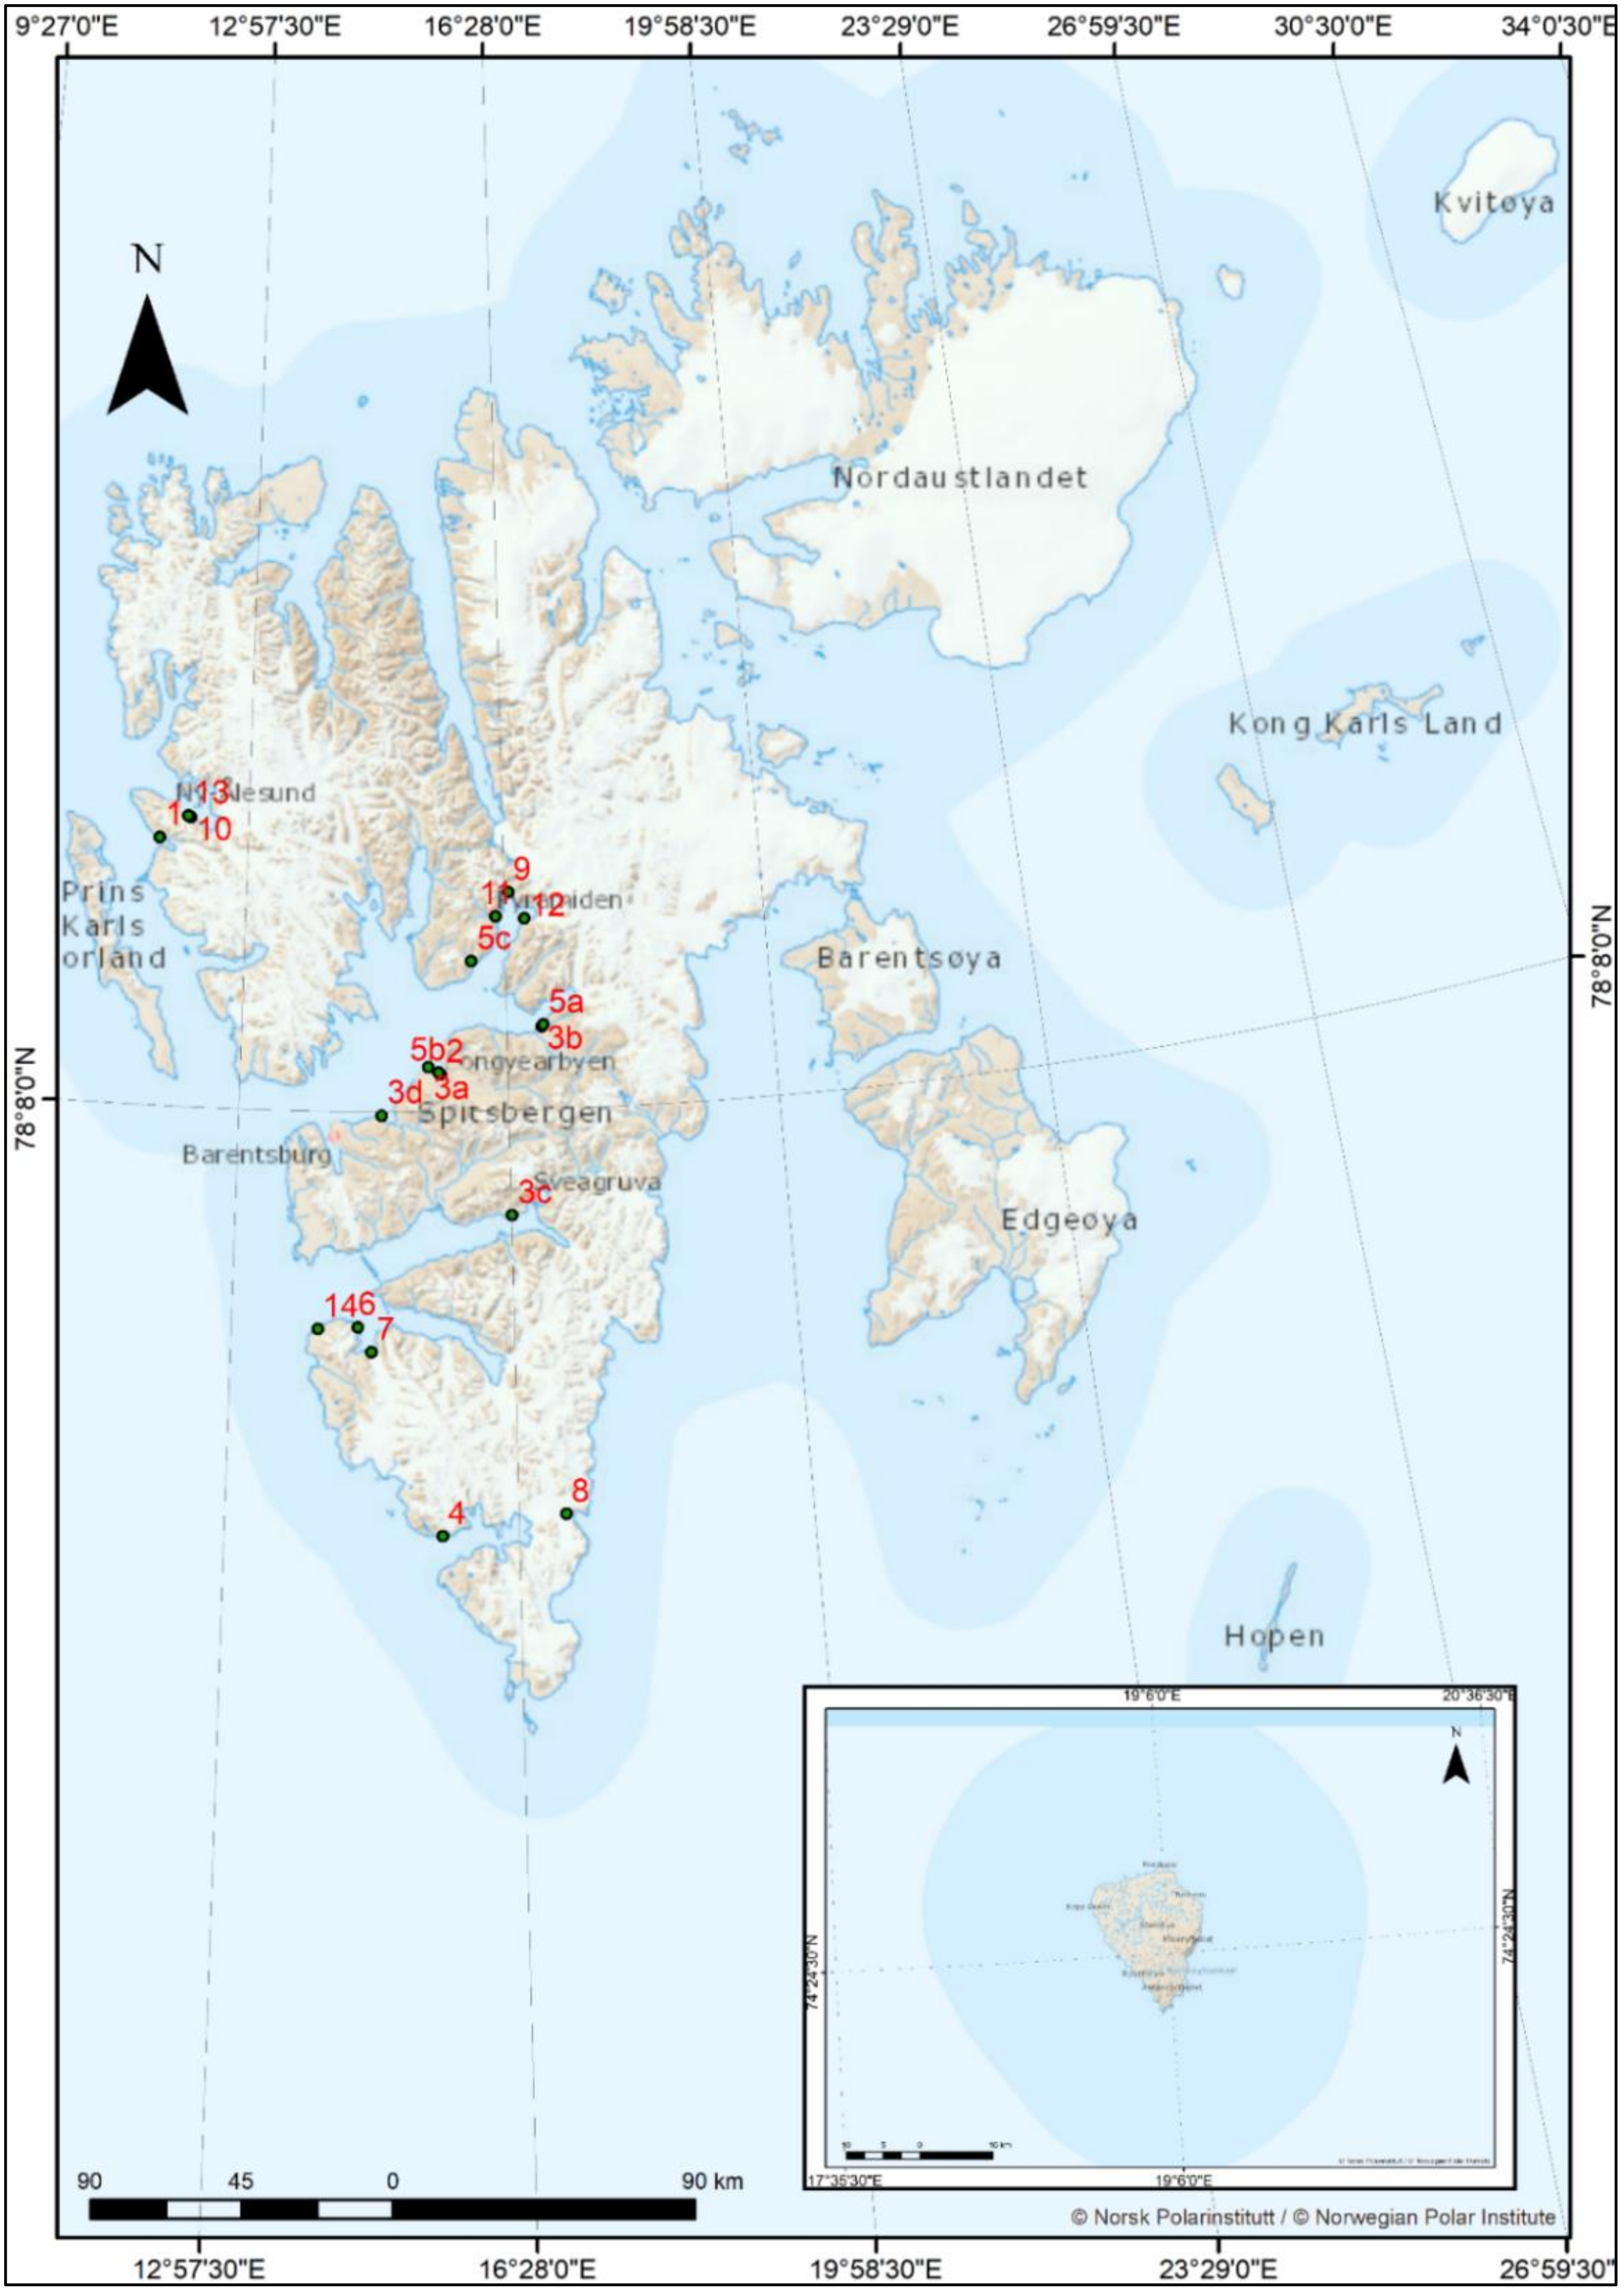
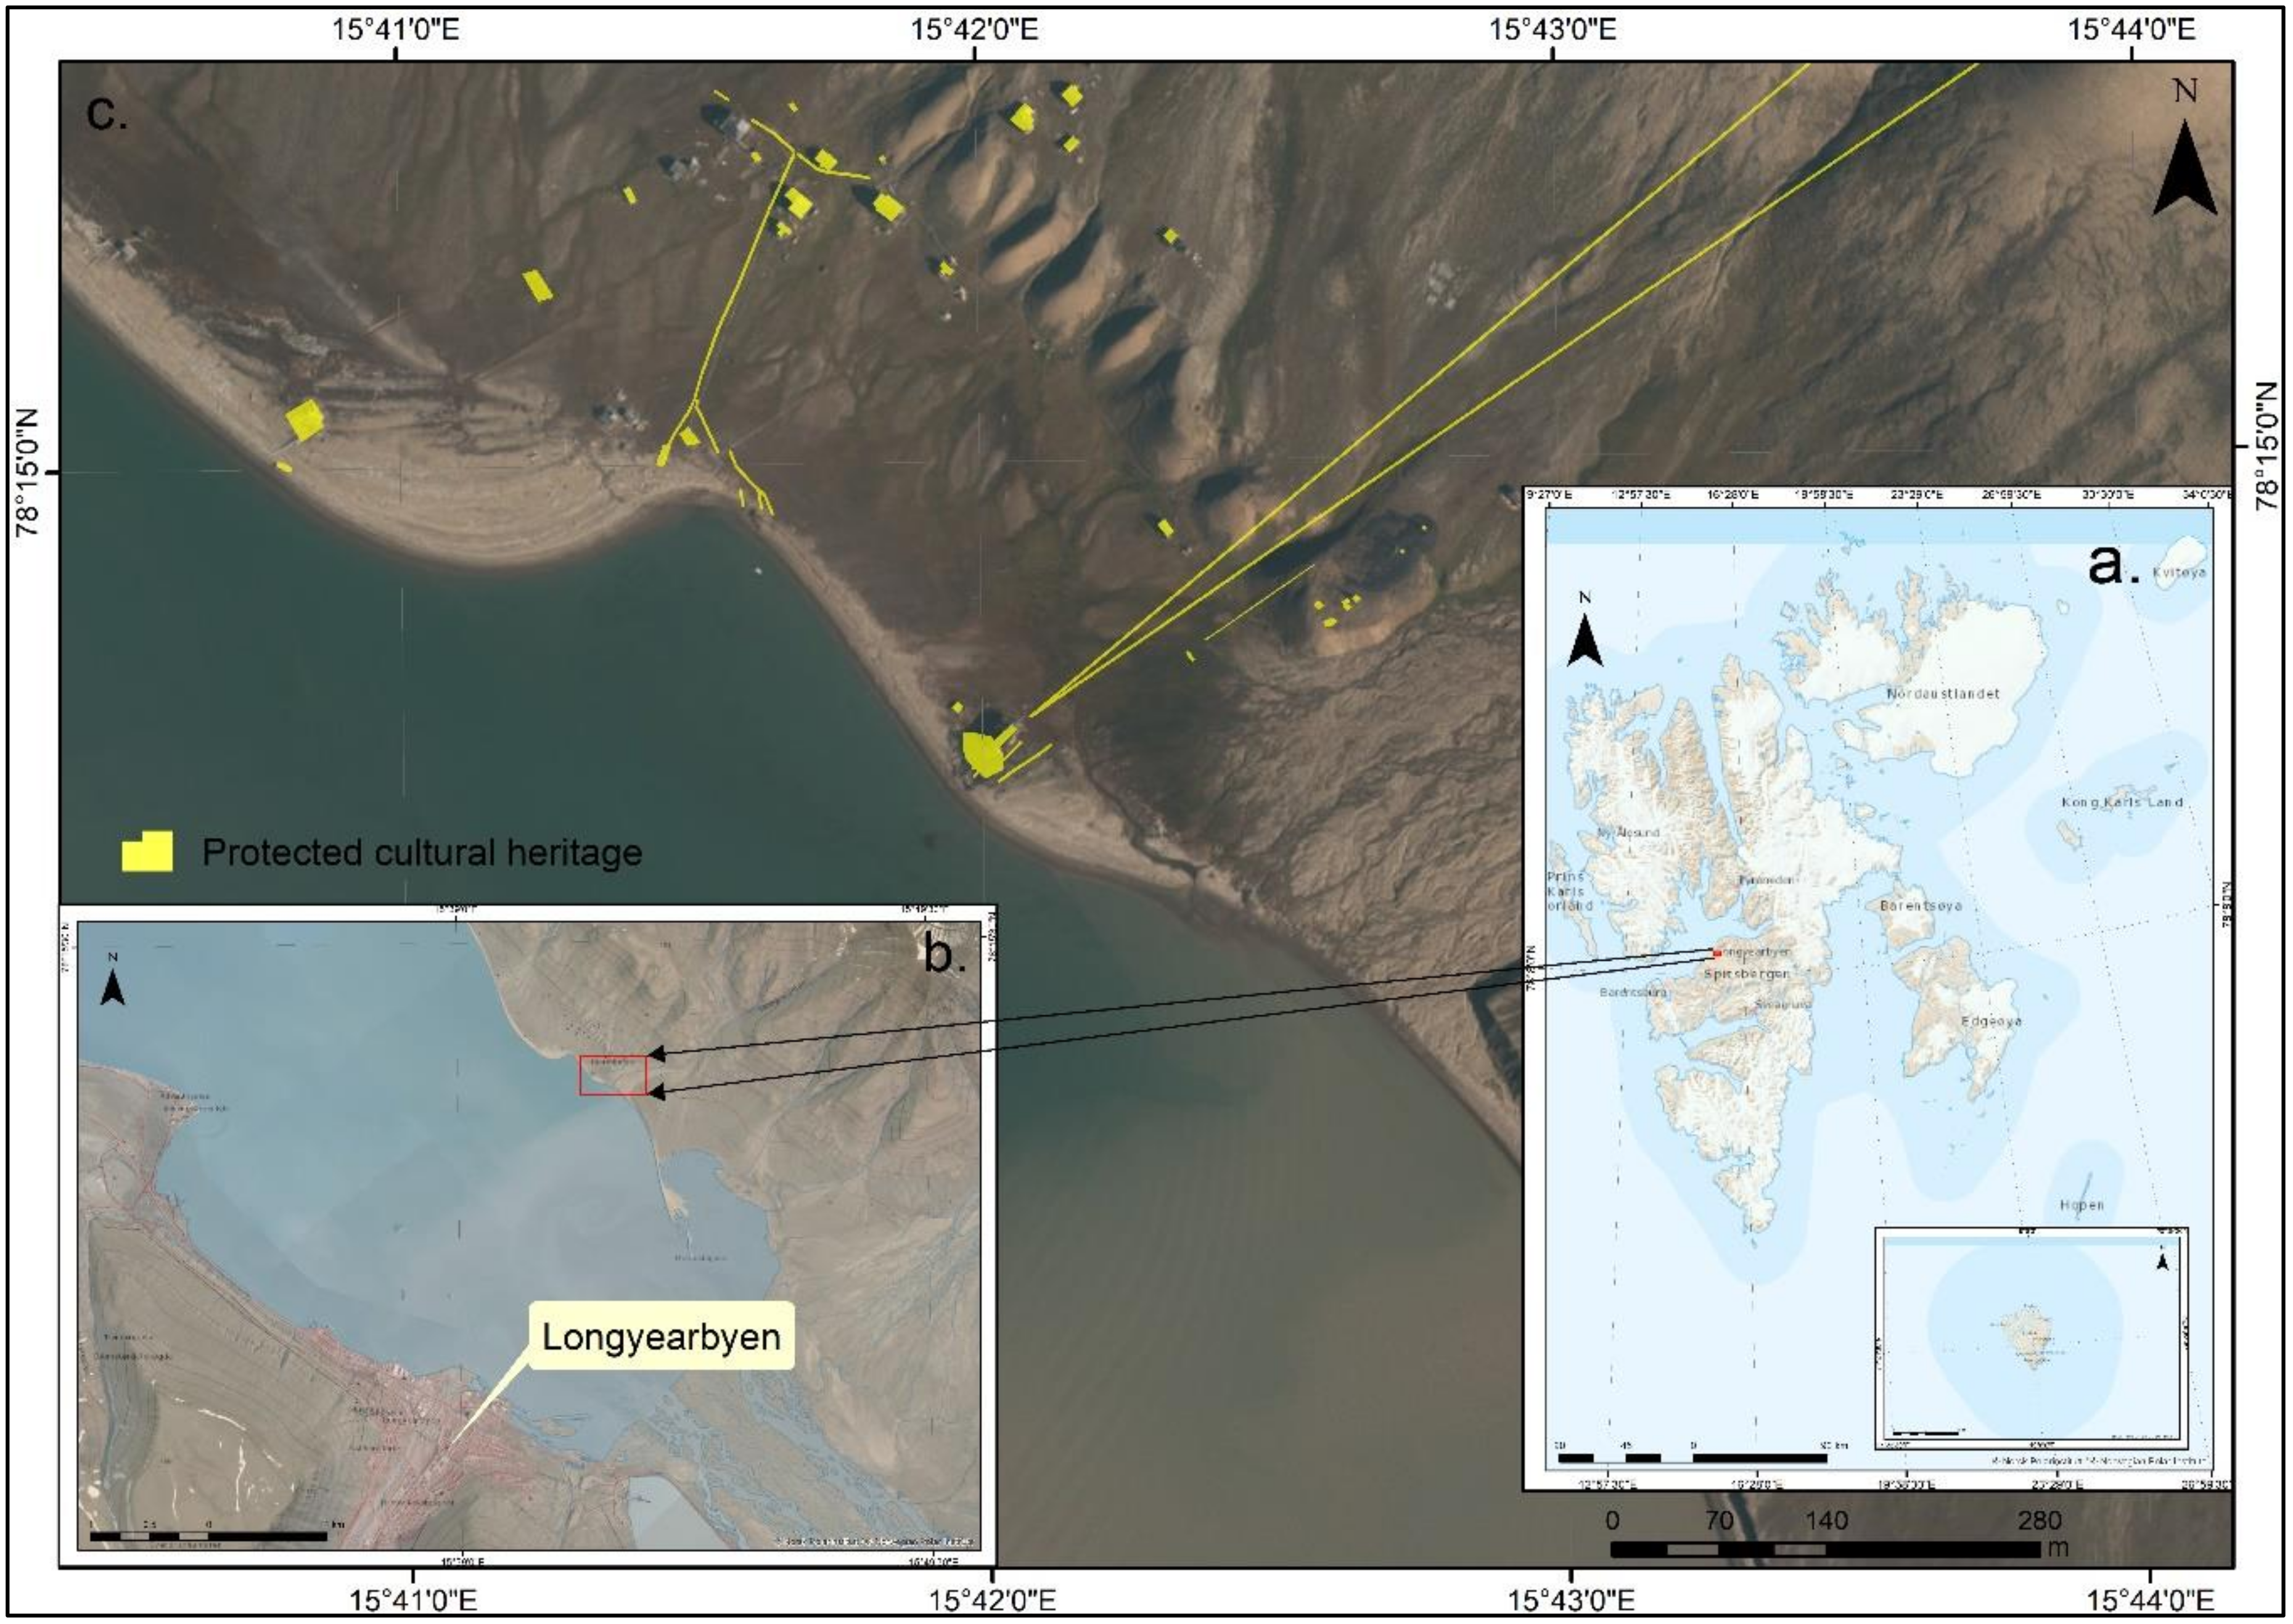
2.1. Study Area

The study area is located on Spitsbergen, which is the largest island of the Svalbard archipelago (Figure 2a), governed by Norway as it was established by the Spitsbergen Treaty from 9 February 1920. The Svalbard archipelago is situated between the North Pole and Northern Norway [49]. Svalbard thus forms a terrestrial node separating the Barents Sea, the Greenland Sea and the Arctic Ocean. This position gives a complex climatic situation where different oceanic currents influence both long-term climate and short-term meteorology of the islands. The focus of this study is the shoreline of Hiorthhamn—on the northeastern shore of Adventfjorden (Figure 2b), approximately 3 km north of Longyearbyen (Figure 2c), which is the major administrative, tourist and scientific centre in Svalbard, also named ”European Gateway” to the Arctic [21].
The Hiorthhamn fjord side is step-shaped with south-west-oriented slopes running down from the top of the Hiorthfjellet mountain to the Advent fjord shore. The bedrock setting of the study area is dominated by the subhorizontal layering of sedimentary rocks of Early Permian to Eocene age, including some coal seams that formed the base for the mining activities [67]. Sediment of varying thickness is draped over the bedrock slopes and steps, primarily consisting of weathering material together with different types of slope-process deposits and some patches with glacial till. The highest coastline after deglaciation was approximately 62 m above the present sea level [68] and the lowermost parts of slope form a low angle beach landscape.
The climate is a Polar tundra climate, according to the Köppen climate system. The mean annual air temperature in central Spitsbergen is −5 °C, the mean annual precipitation is 190 mm (concentrated mainly during the summer season), and dominant winds come from southwest or west. Svalbard is an area with continuous permafrost, meaning all but the surface is permanently below 0 degrees Celsius. A permafrost landscape has a so-called active layer, meaning the surface of the soils, often ca 0.5–1 m thick, which thaws in the summer and refreezes in the winter. The arctic climate influences the landscape through high activity of frost weathering together with surface cryogenic processes, such as solifluction, which are associated with permafrost and the active layer. The cryogenic surface processes are all also effected by gravity, resulting in a net downslope movement even on only gently sloping ground. Other important processes are rock fall, snow avalanches and debris flows, that also bring material from higher to lower elevations [69]. These climatically linked processes have in central Svalbard resulted in a “smoothing” of the landscape, with few sharp topographic features and a rounded topography. At the start of the 20th Century, the records have shown a strong warming trend (starting with the 1920s), where within a period of 5 years the mean annual air temperature changed from −9 °C to −4 °C. This warming is generally interpreted as representing the end of the Little Ice Age (LIA) [12].
Politically, Svalbard is governed by a representative of the federal government, Sysselmannen (the Governor) of Svalbard. Sysselmannen must ensure that activities on Svalbard are in line with the Norwegian national safety and security goals, as well as being the administrator of all cultural heritage and natural values of the archipelago [70]. In the Norwegian national heritage database, Askeladden—Riksantikvaren [71], there are 2025 listed cultural heritage sites in Svalbard; 342 built heritage sites and 1683 archaeological sites. An overwhelming majority of these sites are coastal, thus being exposed to geohazards, development and wear and tear from tourism.

2.2. Cultural Heritage Background

The Arctic environment is ideal for long-term preservation of archaeological remains, both for artefacts and environmental proxies [43]; however, studying cultural heritage in the Arctic is quite challenging due to a changing warmer climate [63]. The discovery of Spitsbergen was made by a Dutch crew in 1596 led by Willem Barentsz; this led to a flow of Russians and Europeans craving for glory, money and fame [49]. There were different activities that brought explorers to Svalbard; whaling (starting from the 17th Century), hunting and scientific exploration (starting with the 18th Century), industrialisation (19th and 20th Centuries) [72].
All the “traces” that were left behind by these activities came in time to be listed cultural heritage. Nowadays, Svalbard’s cultural heritage is under the protection of the Svalbard Environmental Protection Act, which states that all remains from before 1946 are automatically protected as listed cultural heritage sites. Moreover, all traces of human graves, including crosses and other grave markers, as well as bones and bone fragments found on or below the surface of the ground are automatically protected regardless of their age. Same rules apply to skeletal remains at slaughter sites for walruses and whales and in connection with self-shooting traps for polar bears; the protected cultural heritage sites have a 100-m buffer protected area around the sites. The buffer area is granted the same importance as the site itself [73].
From 1955, numerous archaeological expeditions took place in Svalbard; they were organised by the Soviet Union, the Netherlands, Denmark, Sweden, Finland, Poland and Norway [74]. Early explorers of Svalbard have shown a great interest in cultural heritage, like the Dutch whaler Cornelius Gisbert Zoorgdrager, who in his book “Bloyende Opkomst der Aloude en Hedendaapsche Groenlansche Visschery” from 1720, mentions all the places on the coast of Svalbard where he has seen remains of buildings and blubber ovens during his whaling expeditions around 1700. The first real archaeological survey was undertaken by Christian Keller in 1967, as an experimental project; and the first scientific excavation took place in 1958 on Midthuken in Bellsund by the Finnish scholar Tegengren. It is worth to mention the fact that many Svalbard cultural heritage sites have been threatened by the effects of erosion since their existence; only in 1989 their destruction begin to be acknowledged, resulting in a recommendation that research should be focused on threatened cultural heritage [75], along with the need for geological mapping of Svalbard coasts [49].
Starting from 1978, the Russian archaeologist V.F. Starkov was leading extensive excavations in Svalbard of the Russian hunting stations; he was followed by Norwegian, Dutch and Polish archaeologists [76,77]. Russian settlements represent the most numerous group of historical sites on Spitsbergen, being spread all over the territory of the archipelago [78]. Exploration of Svalbard’s natural resources (oil, petroleum, coal) left behind significant traces; coal was found and used as early as 1610 by whalers in Svalbard on their ships. Permanent coal-mining communities were established in Longyearbyen and Hiorthhamn (mining active 1906–present) (Figure 3a–c), Grumant (1910–1962), Ny-Ålesund (1916–1962), Bjørnøya (1916–1925), Svea (1917–2016) (Figure 3d–f), Barentsburg (1920–present) and Pyramiden (1927–1998) [79].
Extensive whale and walrus hunting took place in Svalbard starting from 1611. The hunting activities started with the English and Dutch whalers, followed by Russian and Norwegian. This lasted about three hundred years and lead to killing of thousands of Greenland right whales and thousands of Atlantic walruses [80]. The remains of the hunting stations, slaughter sites, blubber ovens and the whalers’ cemeteries are all listed heritage sites.
Cultural heritage in Svalbard also includes remains like plane wrecks from WWII, and even these young sites experience the same threats, exposure to geo-hazards, tourism and development. The historic remains at Svalbard are considered international cultural heritage [81] and the Governor of Svalbard states that conserving cultural heritage is amongst the most important environmental goals. Thus, monitoring and maintenance of cultural heritage sites is considered an important task [82].

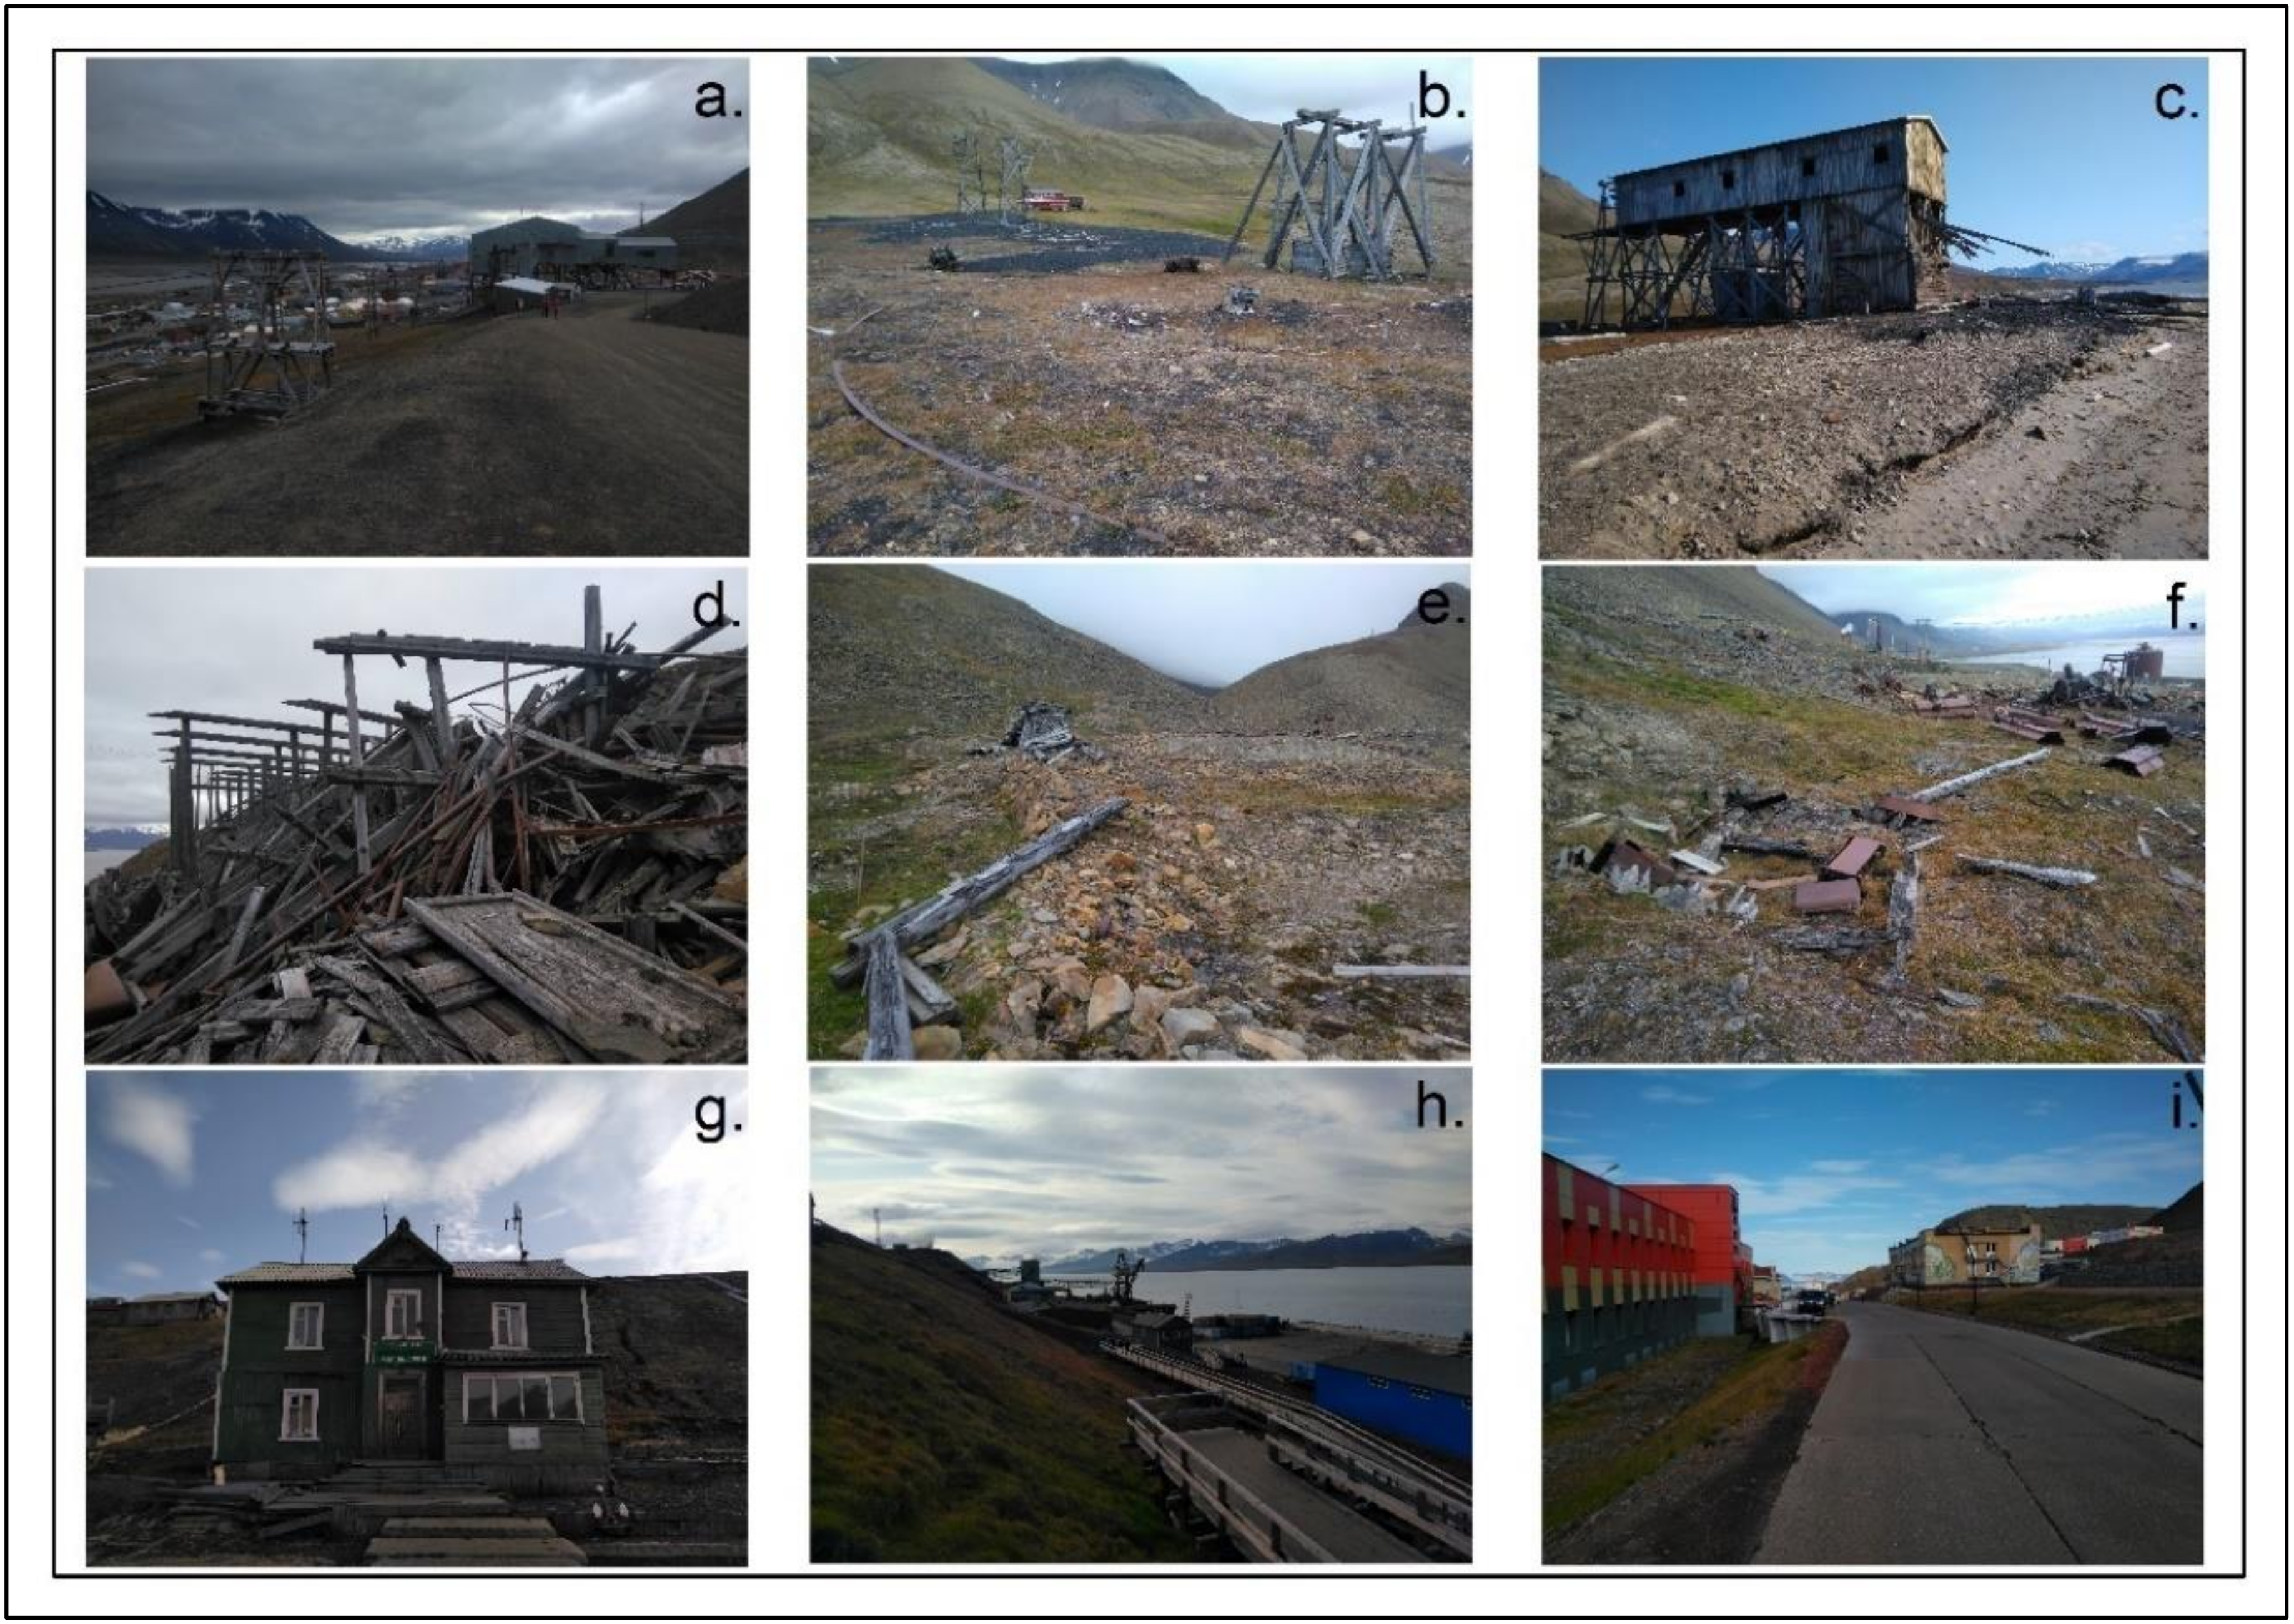
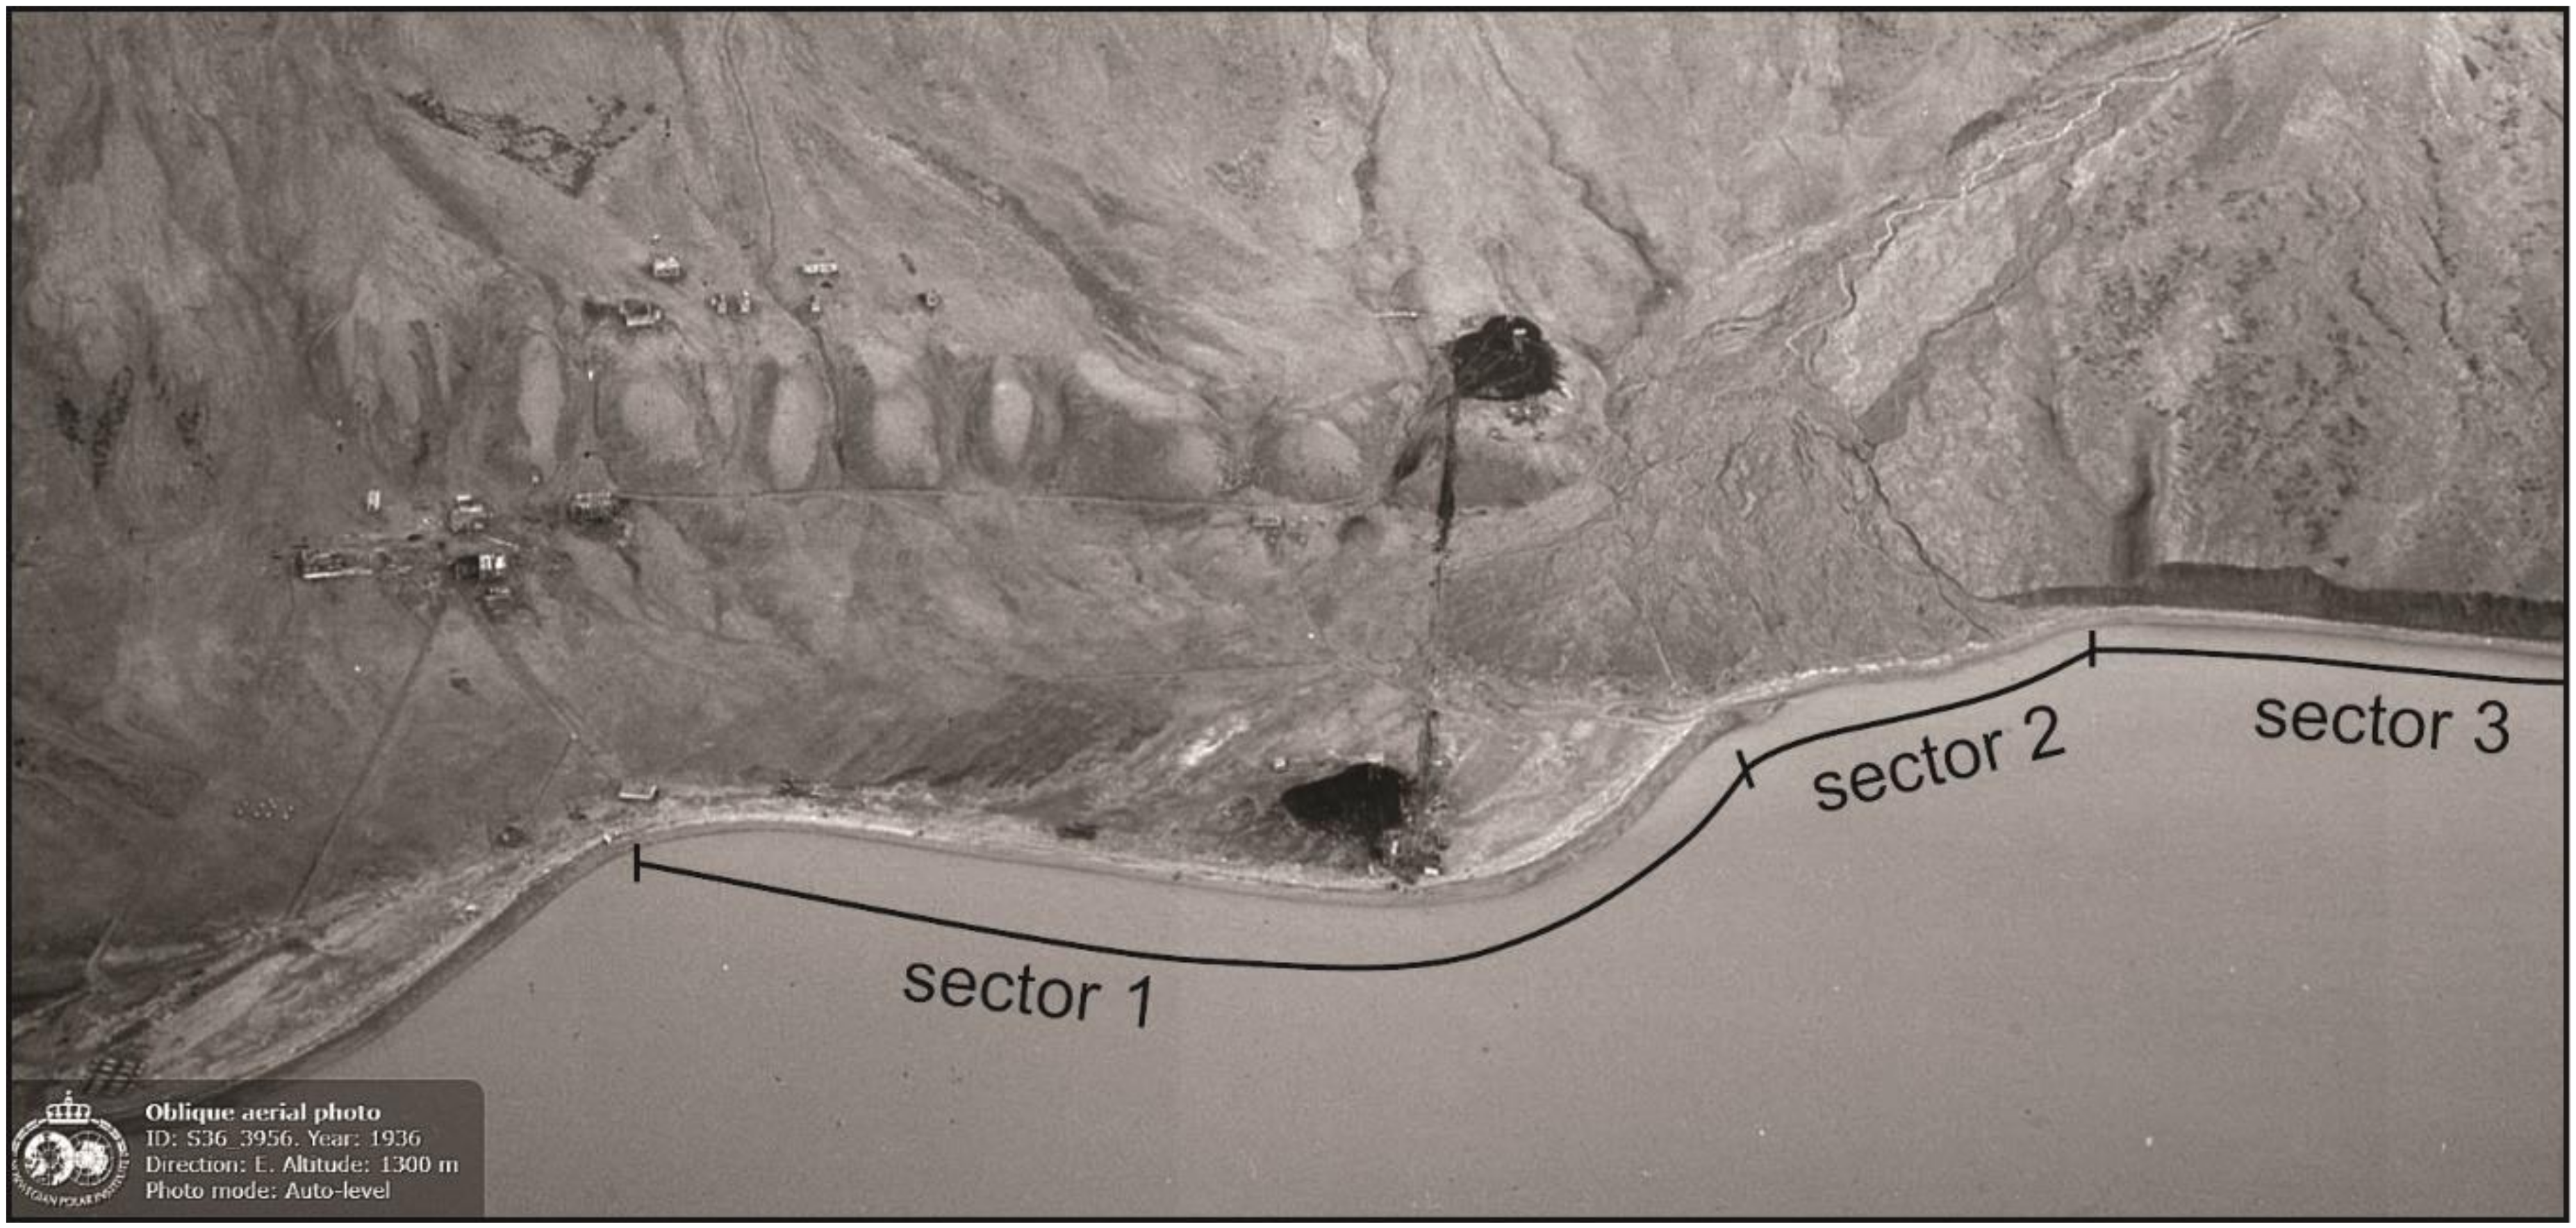
2.3. Hiorthhamn Mining Settlement

In 1917, a Norwegian company, A/S De Norske Kulfelter Spitsbergen, started constructing the mining facilities of what was to become Hiorthhamn city, but coal mining itself did not start up until 1919. Buildings and machines were moved from nearby Advent City, an English coal mining city that was closed down in 1909. The mine at Hiorthhamn was in use only for a few years, from 1919 until 1921 and again from 1938 until 1940. Nevertheless, an entire mining town was built up at the foot of the mountain Hiorthfjellet (Figure 4) [83]. At the start of the 20th century, the business activities in Svalbard was characterised by great optimism. However, many of them failed due to lack of knowledge.
The central cable car station in Hiorthhamn was built in 1939 (Figure 3c) and is listed in the National heritage database Askeladden under the ID 93040-6. It consists of a large wooden loading construction. The inside machinery is in good shape, with wheels and gears on cast foundations. A wooden staircase leads to the top of the construction. Remains of two railway tracks come out from the southern side of the building directly into the sea. From the side towards the mountains, rests of cable car wires are hanging [70].
Today the former mining settlement is the second largest gathering of listed buildings at Svalbard (next to Ny–Ålesund) and is considered an important cultural heritage site. The listed historic site counts a total of 13 standing buildings and remains from mining infrastructure, such as cable car poles, a cable car station and railway tracks. The mine itself is situated high up in the mountain, 580 meters above sea level, and the coal was transported on an aerial cableway from the mine to the seaside. Except a few buildings up in the mountains, the whole site is situated close to the coastline, vulnerable to coastal processes [85].

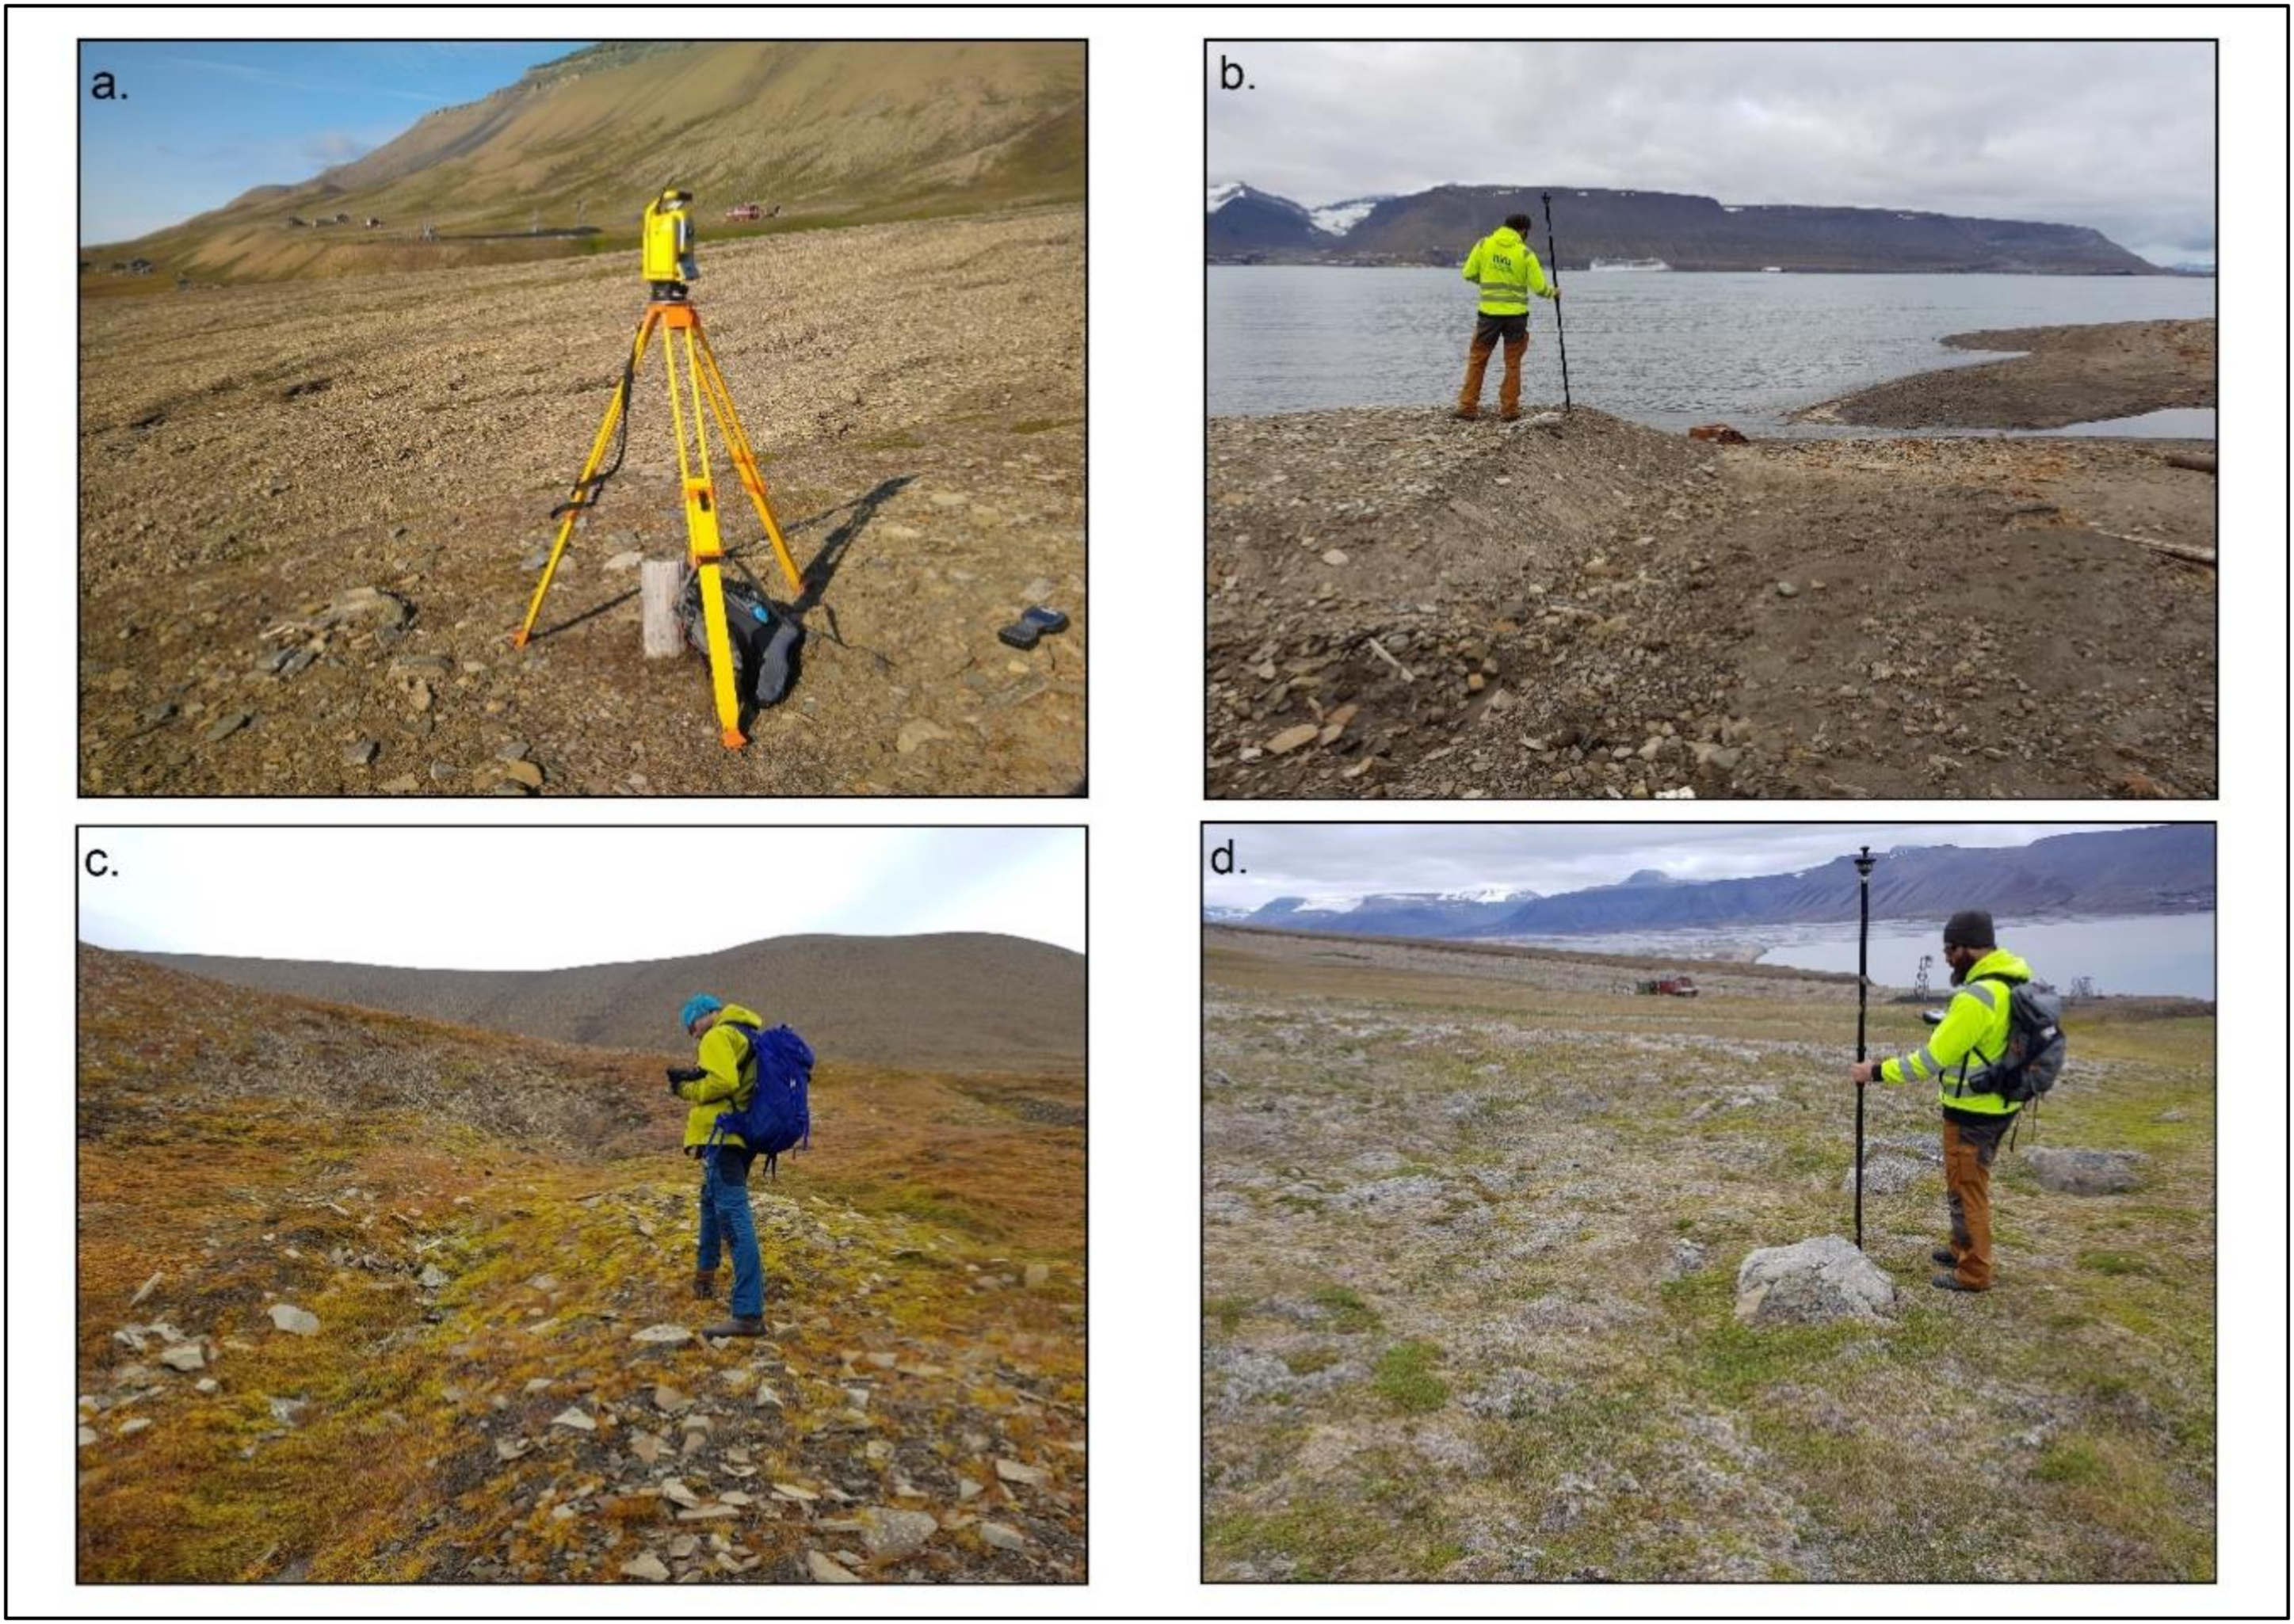
3. Materials and Methods

Coastline dynamics were evaluated on the basis of modern GIS and RS techniques. In this study, we used the remote sensing data available from this area: a topographic map from 1927 (scale 1:50,000), aerial images from 2009, and field surveys from August 2019 to assess the coastal change over a period of 92 years. The aerial images from 2009 were obtained by the Web Map Services (WMS) developed by the Norwegian Polar Institute (NPI) [69]. All the data was integrated into a GIS using the WGS_1984_UTM_Zone_33N reference system. The 1927 topographic map was georeferenced in ArcGIS ver. 10.4 (ESRI, Redlands, CA, USA) by adding six control points by using first order polynomial, auto-adjust transformation. The total RMS error was 4.5 m, which is close to the global errors mentioned in Bourriquen et al. [55].
The geomorphology and surface sediments of the study area was mapped through a combination of remote sensing and four days of field validation in beginning and end of August 2019. Field data was collected using Getac F110 rugged field tablets with integrated GPS. The base for the geomorphological map is the 2009 aerial images available together with elevation data (DEM and contour lines) and the map was made in ArcGIS ver. 10.6 software.
Change rates between shorelines extracted from old maps, aerial images and field surveys were computed using the DSAS v.5 extension of ArcGIS [65]. Different parameters were calculated: Shoreline Change Envelope (SCE, expressed in m), Net Shoreline Movement (NSM, in m), End Point Rate (EPR, m/yr), and Linear Regression Rate (LRR, m/year). SCE describes the variability of each transect considering the maximum spatial recorded displacement of shoreline, but without considering the time span. NSM deals only with the dates of two shorelines, reporting the distance between the oldest (1927) and newer (2019) shorelines for each transect, whereas this movement may not be the maximum shoreline displacement recorded. EPR is calculated in m/yr by dividing the distance of shoreline movement by the time elapsed between the oldest and the most recent shorelines. A total of 146 transects at 10 m alongshore intervals were analysed using the EPR parameter of DSAS to obtain annual mean rates of shoreline change. LRR is based on the overall minimum of the squared distance to the known shoreline using all available data to find the best-fit line and is being recognised as a very useful tool for computing long-term rates of shoreline change. The confidence interval in DSAS was at 95%. The shoreline was divided into three sectors in order to get a better picture of the final geomorphological and DSAS analyses.
Field surveys were made in August 2019 using a GPS system comprised of an Altus APS–NR2 antenna and a Carlson controller. Two initial points were surveyed with the GPS system (±0.5 m accuracy), then the survey was conducted with a Trimble S5 Series Motorized total station, along with a Trimble TSC3 controller (Figure 5a). In total, a number of four fixed points were established and recorded for present and future monitoring of the shoreline (Figure 5b), to gather data to support the geomorphological mapping (Figure 5c) as well as for monitoring of surface soil movements over time (Figure 5d).

4. Results and Discussion

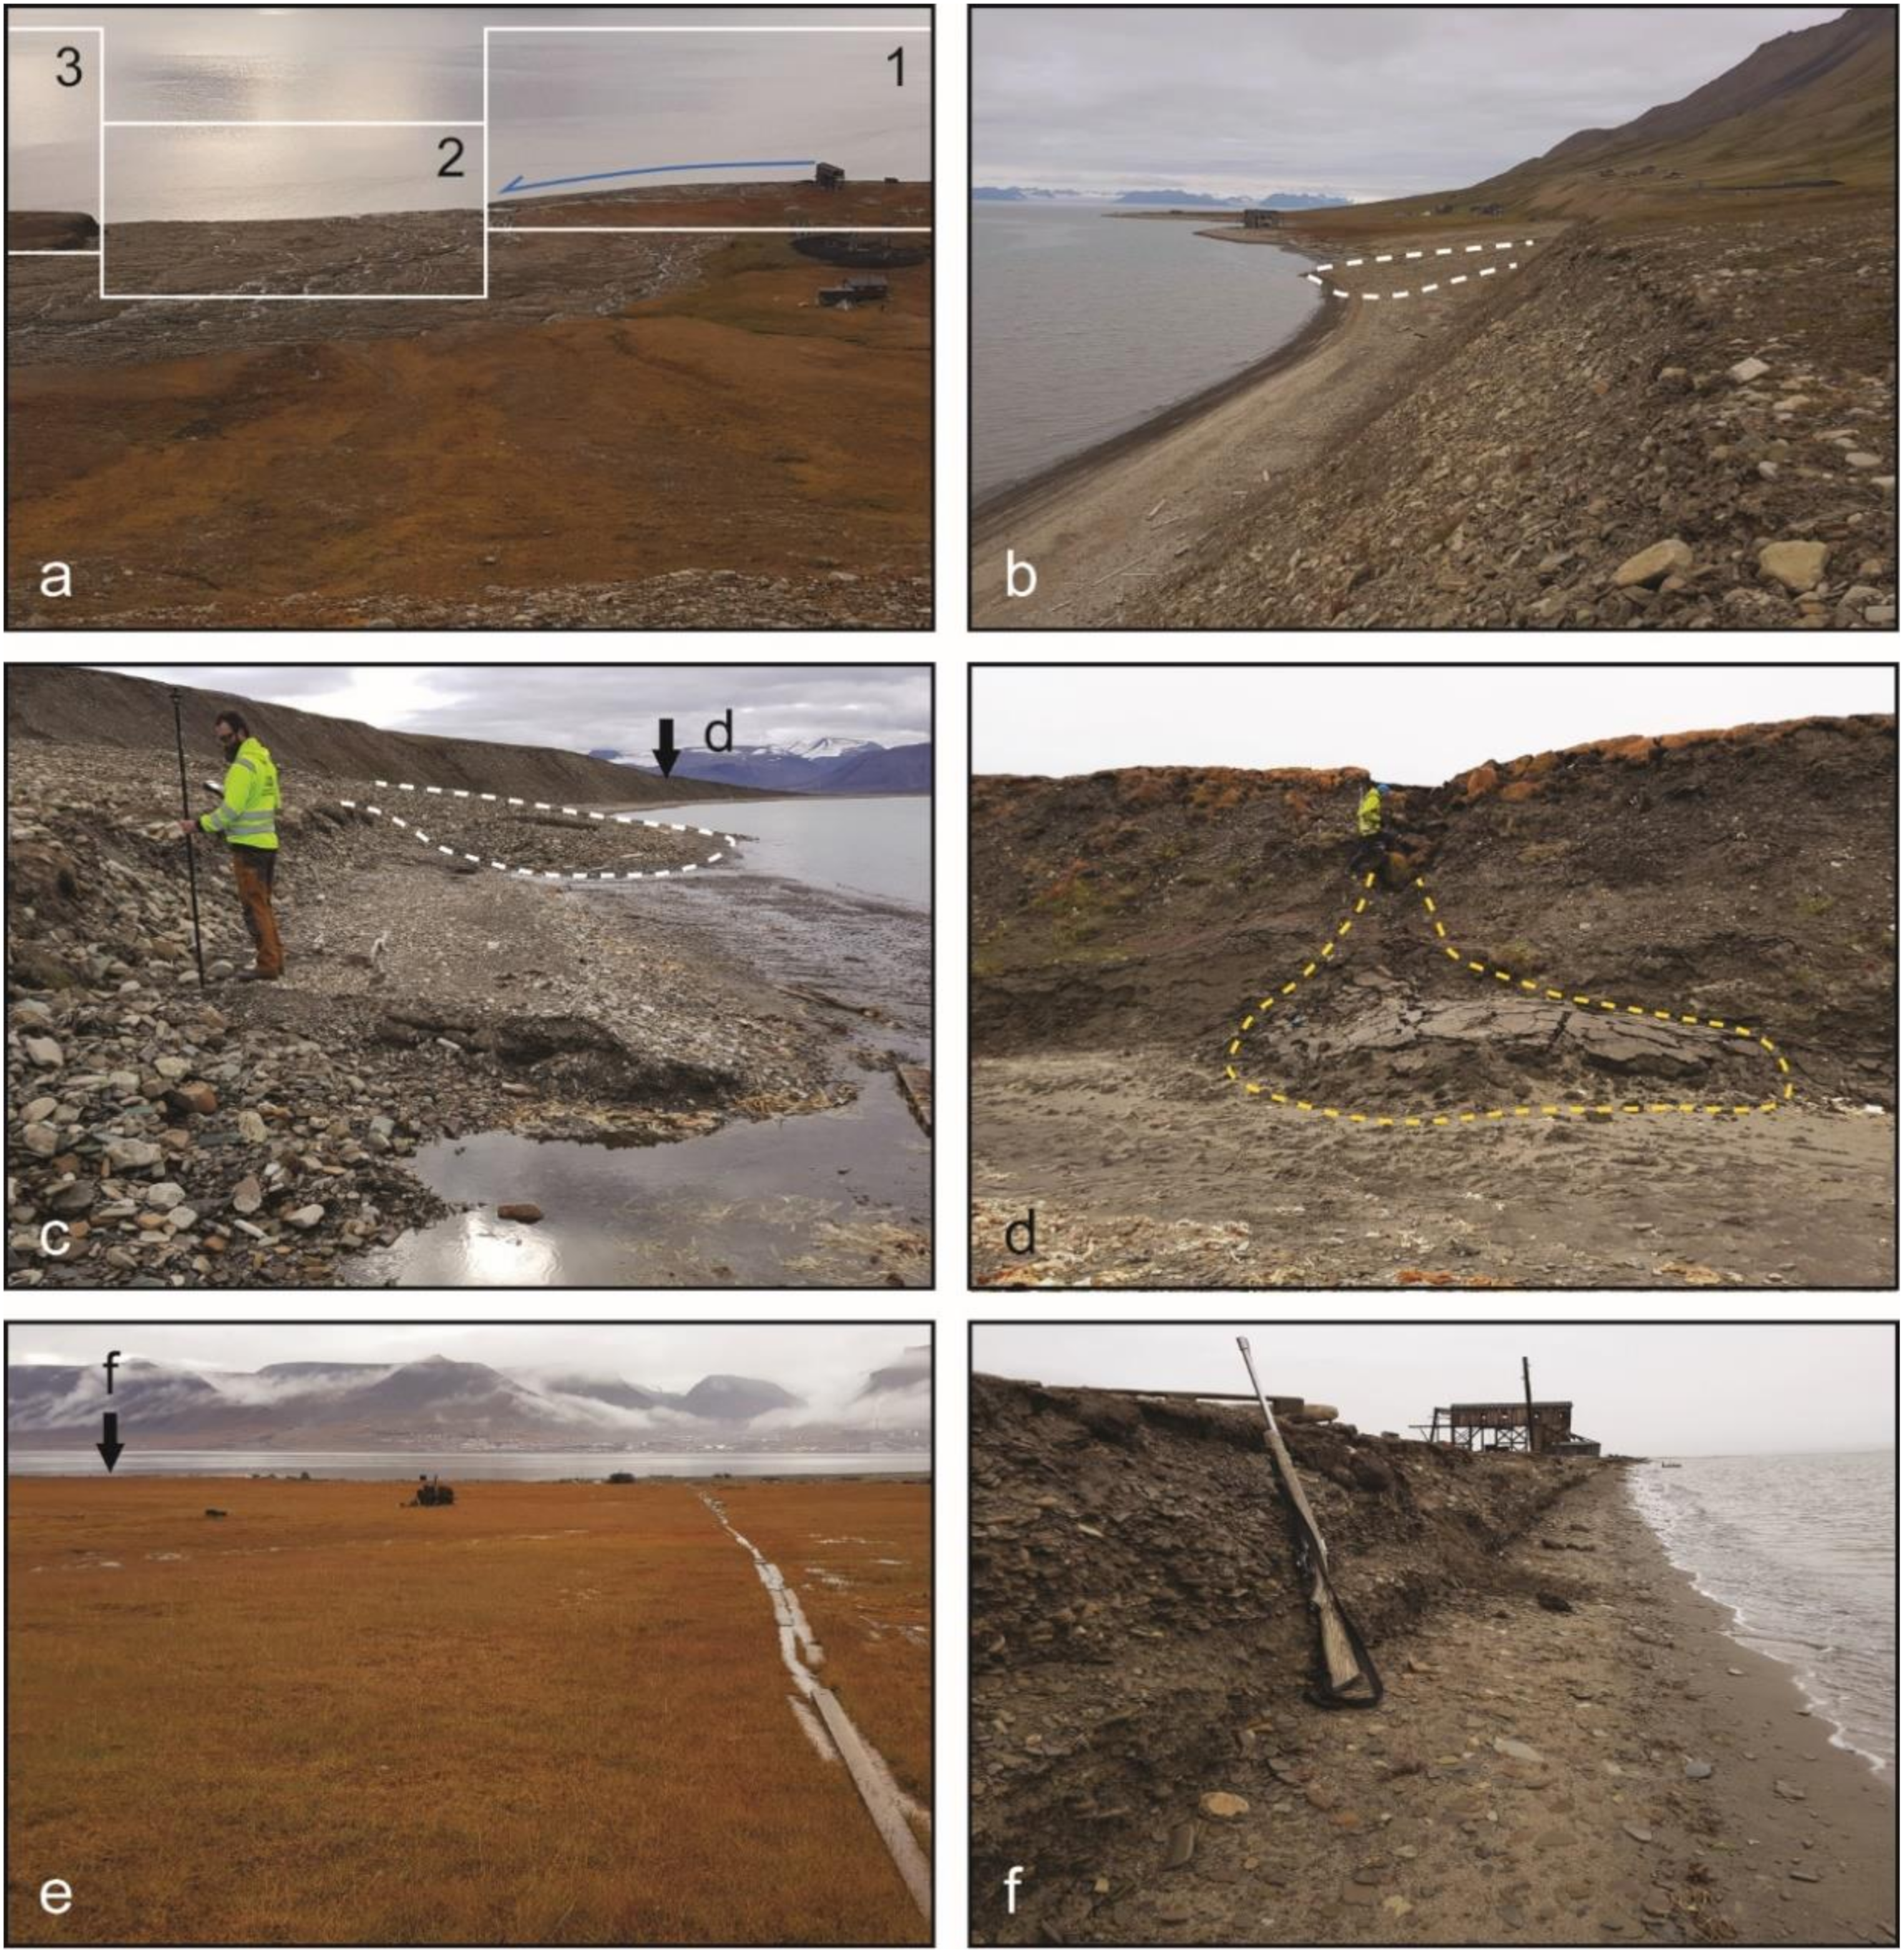
4.1. Geomorphological and Surface Sediment Mapping

Results from the geomorphological mapping are shown in Figure 6. In addition to the result from the present study, it includes some sub-surface interpretations by [86]. The map coastline is based on aerial photos of 2009, whereas the present coastline based on GPS field surveying (2019) is shown as a purple line.
The gently sloping plain down to the shoreline in the northern part of the study area (Sector 1) is mainly covered by peat and grass vegetation, and the low wave-cut section (Figure 7a,e) clearly shows how today’s organic material overlies gravelly beach sediments. A series of low subdued gravelly ridges oriented obliquely from the present-day beach and inward is only visible in the aerial photos and is interpreted as relict beach ridges formed during earlier beach migration towards south east. This development requires a net sediment supply to Sector 1 and long-shore sediment drift from northwest towards southeast, which is confirmed by the ongoing build-up of a small spit bar shifting the small tidal channel outlet towards southeast between 2009 and 2019 (south-eastern end of Sector 1 and Figure 7a).
The wave-erosion shoreline scarp (Figure 7f) which cuts the old subdued beach ridges at an angle, together with observed in-land displacement of over-wash deposits parallel to the beach, indicate a change in shoreline environment towards increased erosion. This change may be the result of a shift in dominating wind-, and hence, wave direction during especially erosive storm events. The detailed land survey data of the present shoreline (Figure 6) supports this interpretation.
Sector 2 of the study area includes the distal part of an active alluvial fan system which is subjected to both erosional and depositional processes. A braided fluvial system is transporting coarse and poorly sorted sediments towards the shoreline and episodic debris flows or debris torrents transport larger masses, which are later remodelled by the more continuous fluvial processes. According to [86] detailed descriptions of sedimentary processes and environment, fluvial channels migrate laterally over the fan throughout the summer due to melting of a snowpack that deflects the water flow. Dynamic shifts in location of the fluvial transport and debris flows down to the swash zone today (Figure 7b,c) result in an irregular shoreline with significant yearly and seasonal changes (Figure 5b).
The south-eastern Sector 3 of the study area forms a long erosional escarpment through a raised abandoned alluvial fan–delta [86]. Wave action forms the steep escarpment by undercutting the raised delta sediments. Slumping of primarily sandy sediments in the over-steepened escarpment moves sediments down to the beach (Figure 7d) where they are moved into the sea and further eastwards by wave action and long-shore transport. The shoreline displacement between 2009 and 2019 (Figure 6) clearly highlights the shoreline retreat resulting from the undercutting and erosion.
Solifluction is a ubiquitous process transporting sediments downward from the slopes above both Sectors 1 and 2. The same net downward movement of surface material is the result of active layer detachments forming scars and slump (Figure 6). Although these slope processes have no direct impact on the shoreline sedimentary environment today, they contribute to the total down slope sediment flux, and enhanced thawing of permafrost due to a warmer future climate may increase this effect, subsequently resulting in increased net shoreline input.
Lønne and Nemec [86] described the onshore area of Sectors 2 and 3 in detail and characterized the combined feature as a Holocene fan delta and that the depositional system may hypothetically extend under water up to 400 m offshore. The postglacial lowering of the relative sea level and a simultaneous decline in glaciofluvial activity enhanced fluvial erosion of the delta fan and formed the younger, and still active, incised braided system feeding Sector 2 with fluvial-, and debris-flow sediments. Apart from some snow avalanche deposition in the uppermost part, there is today no sediment input from higher up to the raised delta fan of Sector 3. The shoreline in Sector 3 has no significant terrestrial sediment input and future shoreline changes are more dependent on marine-controlled processes and erosional potential. Since the escarpment today is dependent on the internal permafrost in the raised delta-sediments, future increase in soil temperature and active layer thickness may lead to increased speed of undercutting and subsequent shore–line retreat.

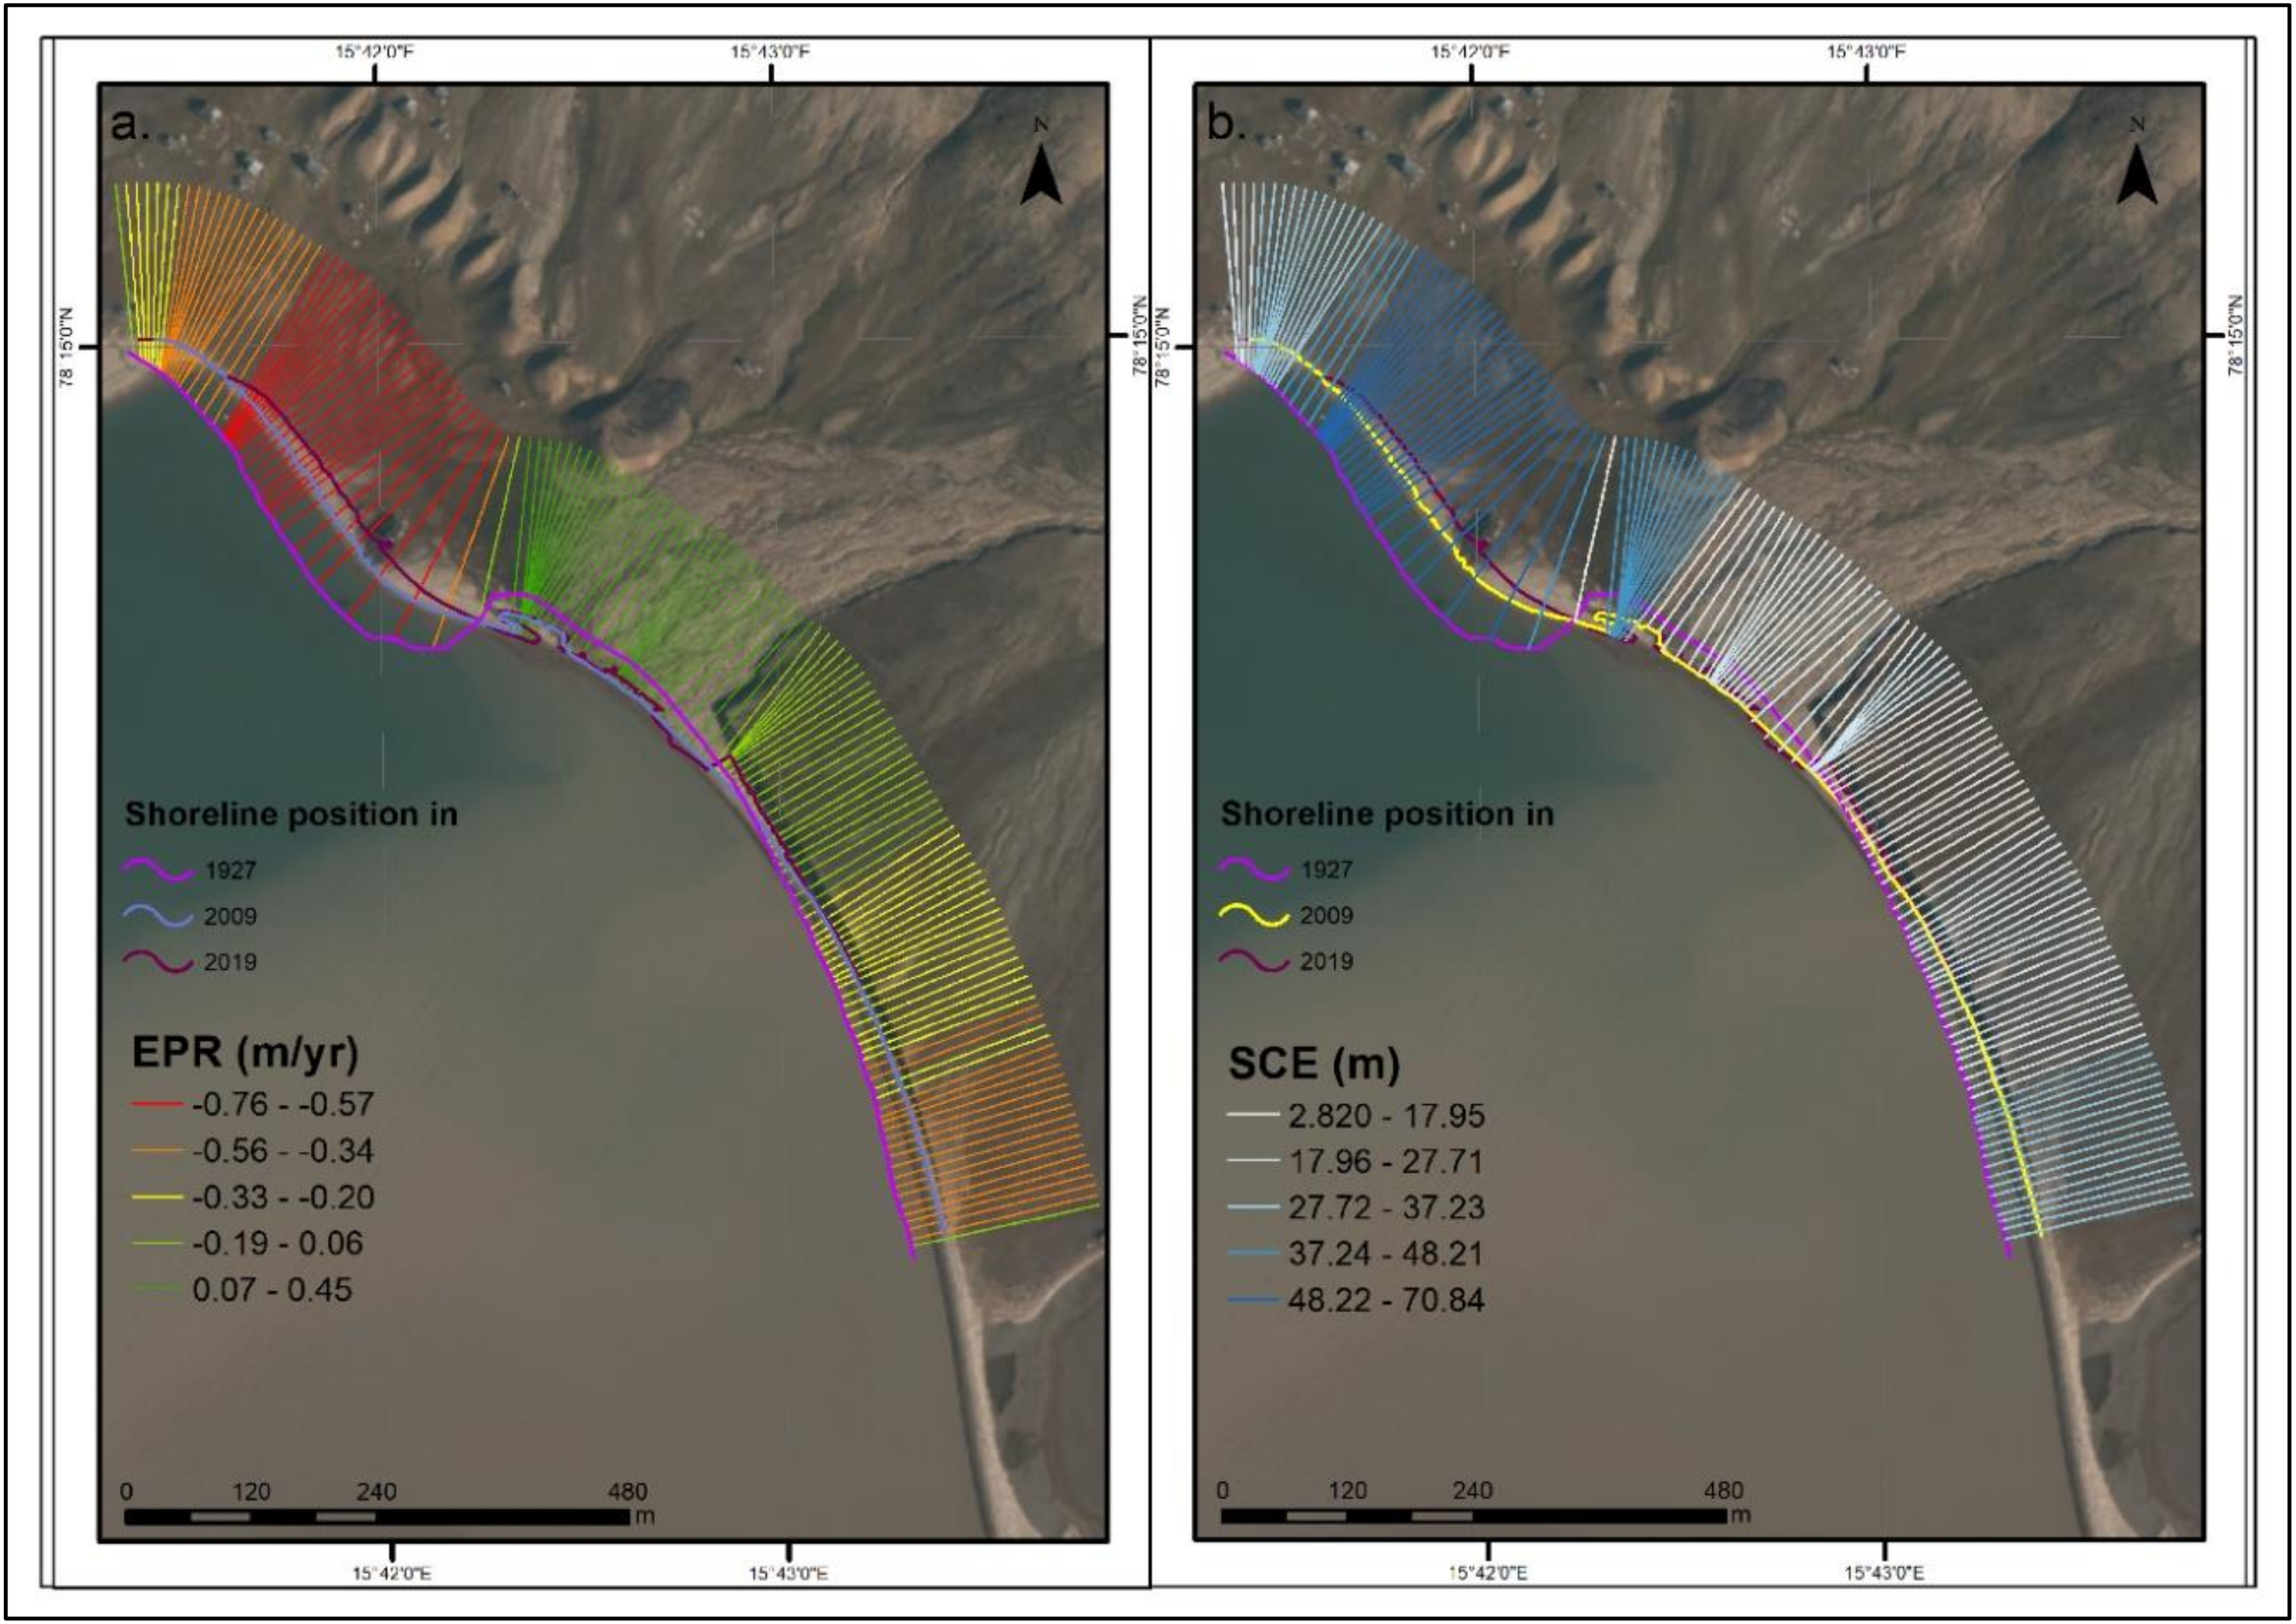
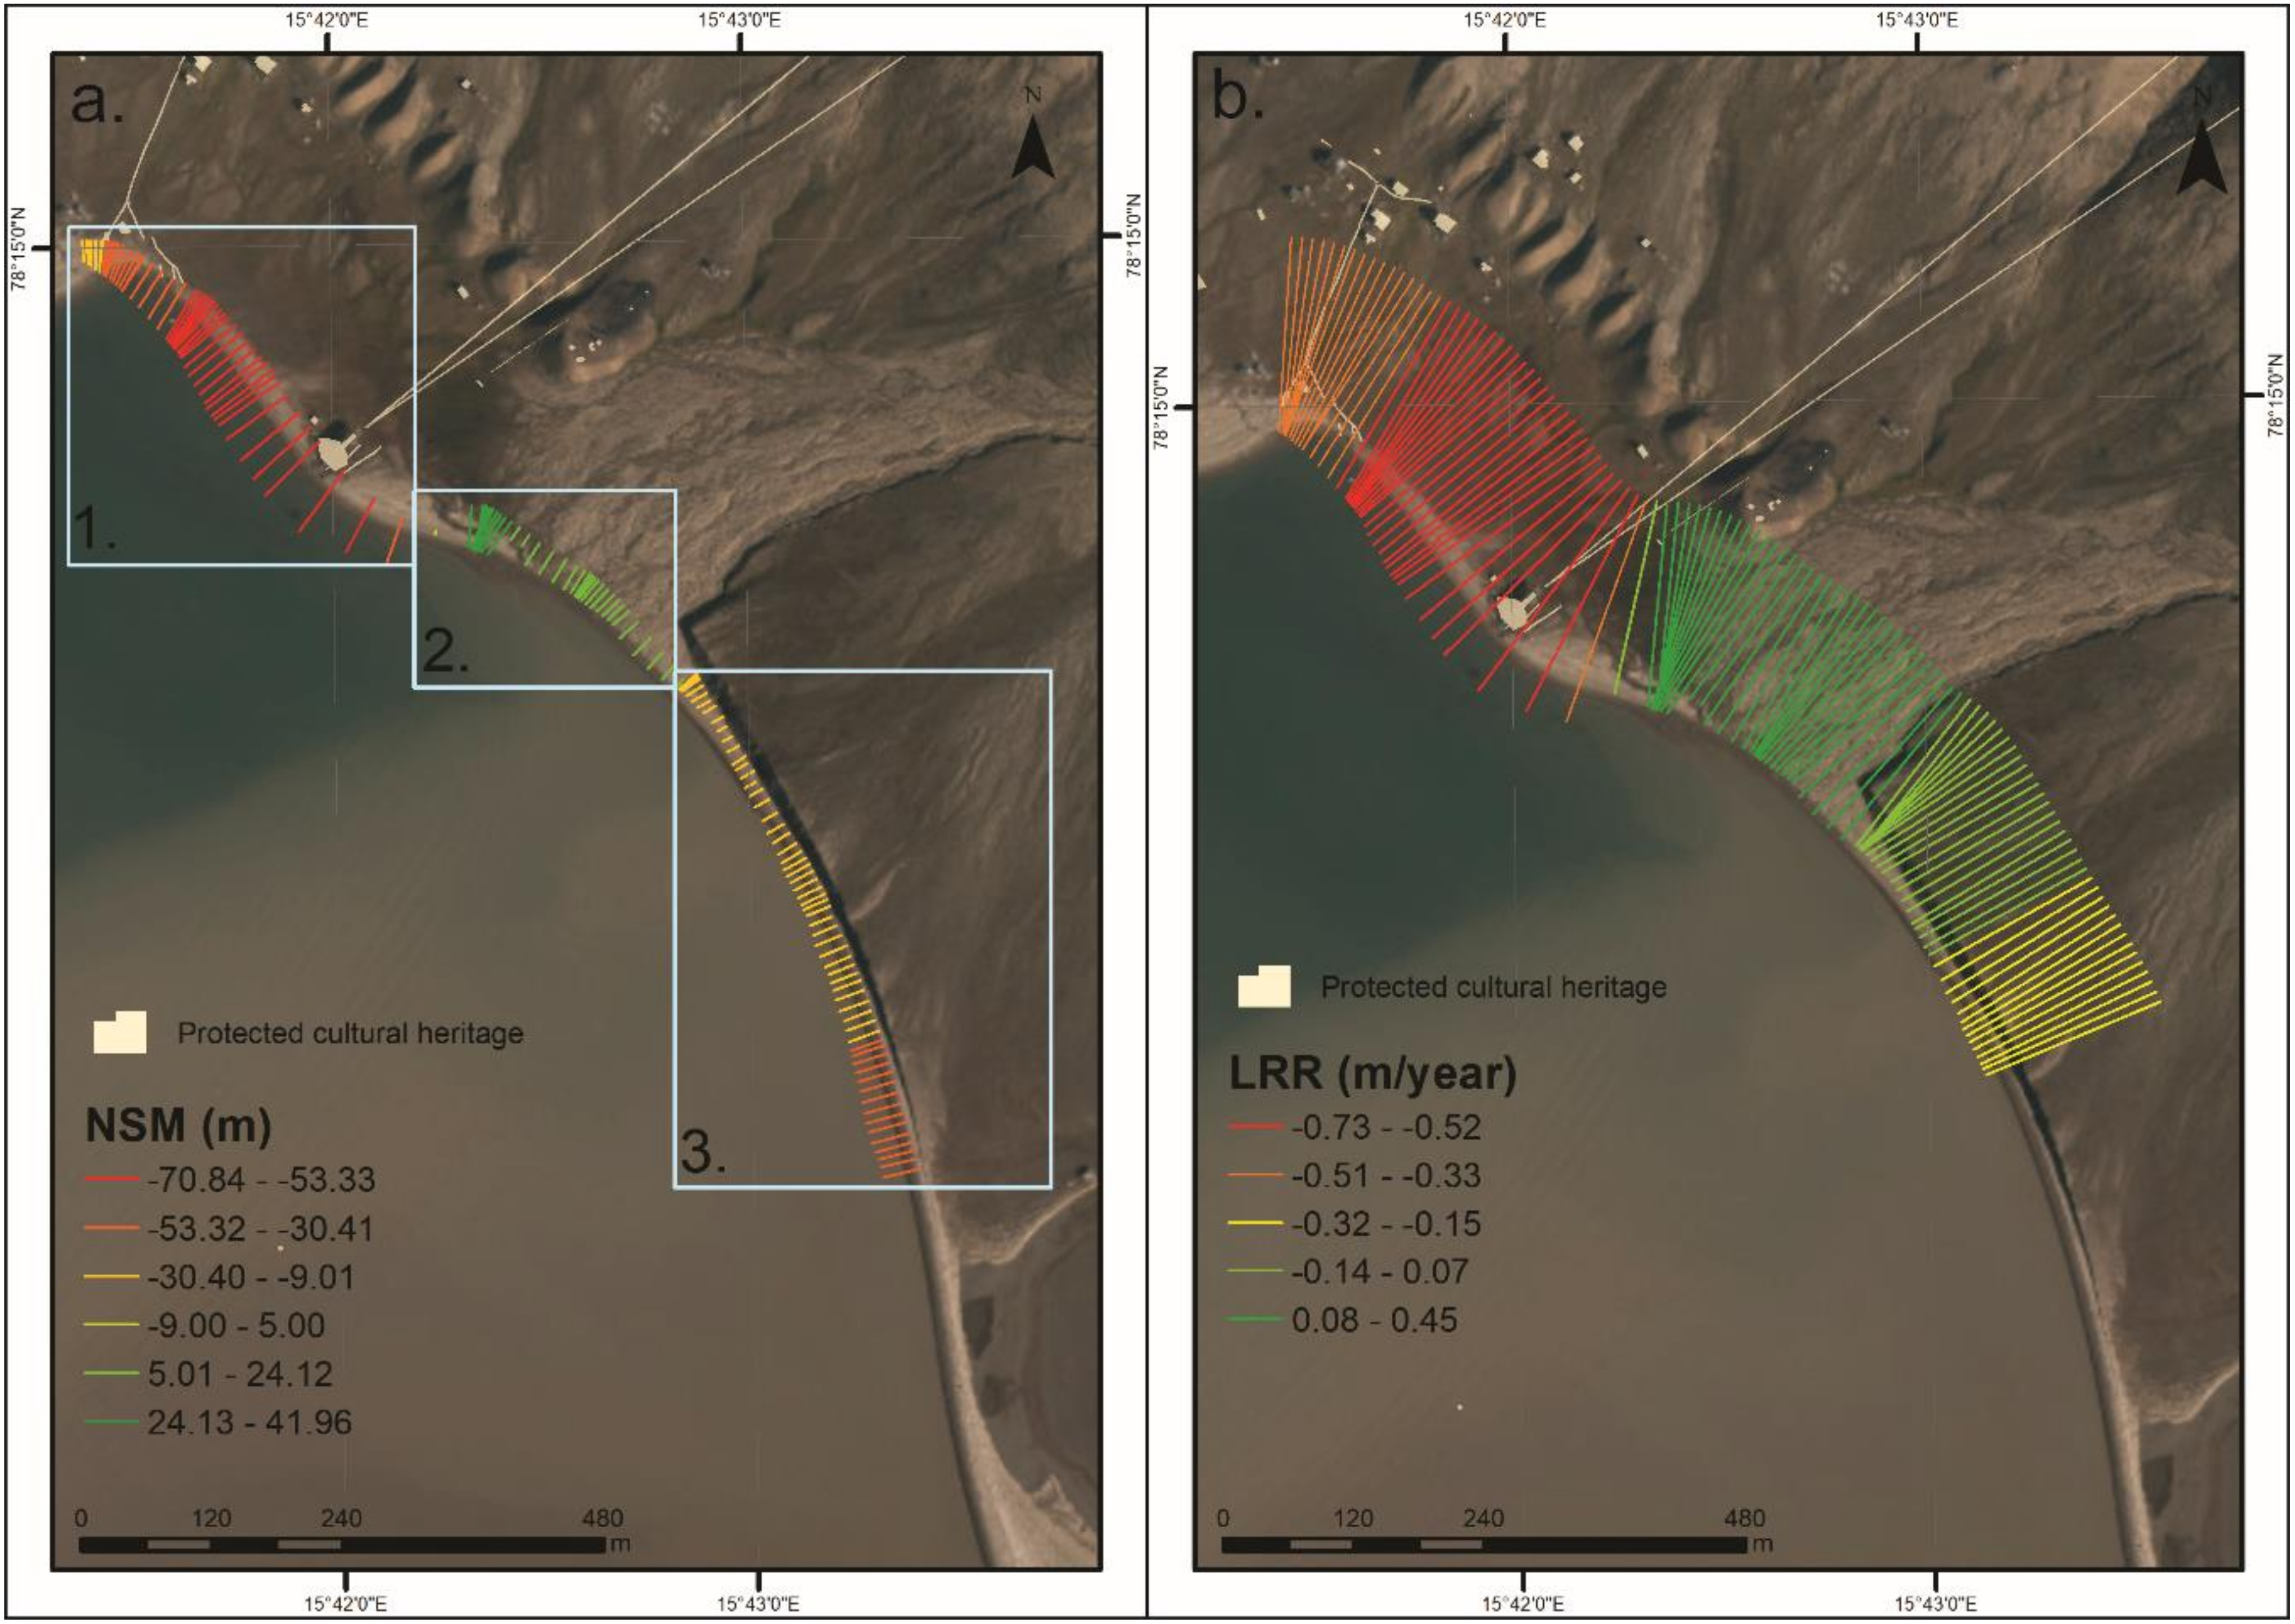
4.2. Shoreline Displacement

Using the DSAS analysis of the coastline, the following parameters were computed EPR (Figure 8a), SCE (Figure 8b). EPR shows the highest rates between the oldest (1927) and the most recent (2019) shoreline in the northwestern part of our area of interest. The shoreline from 2009 was not included in the analysis and is shown in Figure 8a only for orientation purpose.
The final rates were reclassified into five classes by using the Natural Breaks (Jenks) method: very high (−0.76 to −0.57 m/year), high (−0.56 to −0.34 m/year), moderate (−0.33 to −0.20 m/year), low (−0.19 to 0.06 m/year) and very low (0.07 to 0.45 m/year). The average erosion rate for the entire coastline is −0.21 m/year. The highest EPR values are located in the north-western part of the coastline (Sector 1), where the most important part of the cultural heritage (the loading dock) is located, making it very vulnerable to coastal erosion. Positive values are recorded in the middle part of the interest area (Sector 2), where sediments are being deposited from the alluvial fan. The southeastern part of the coastline (Sector 3) can be framed into the average erosion rate of −0.21 m/year. However, Sector 3 has no cultural heritage assets. SCE (m) values represent the greatest distance among all the shorelines that intersect a given transect and they are visible in Figure 8b. The highest interval (48.22–70.84 m) is located within Sector 1 and the lowest values (2.82–17.95 m) in Sector 2.
NSM, expressed in m is visible in Figure 9a. Sector 1 is characterised by very high and high erosion rates, while Sector 2 and Sector 3 by moderate and high accretion and moderate and high erosion, respectively.
The LRR parameter is detailed in Figure 9b and highlights the areas with erosion, stability and accretion, divided into five classes, as follows: very high erosion = −0.73 to −0.52; high erosion = −0.51 to −0.33; moderate erosion = −0.32 to −0.15; stability = −0.14 to 0.07; accretion = 0.06 to 0.45. The average LRR is −0.16 m/year. There was a total number of 112 transects, out of which 76 (67.86%) are erosional and 36 accretional (32.14%). Transect number 102 has the highest value for an erosional transect and is located in Sector 1, in the same area as the loading dock is located. Whilst the transect with the highest accretion value is number 93, located in the upper part of Sector 2. A significant percentage of the shoreline (48%) has transects with statistically significant erosion. This highlights the vulnerability of the coastal cultural heritage.
A study that focused on approximately 62,000 km of Arctic coasts [7] reported an average erosion rate of −0.5 m/year. The highest erosion rate in the Arctic was registered on Alaskan coast (Drew Point) with a value of −8.4 m/year, while the lowest erosion rate was reported in Svalbard. Other reported erosion rates in Svalbard range from −0.5 to −4.5 m/year for Longyearbyen [21], −0.26 m/year for Isbjørnhamna [48], −0.34 m/year and −0.47 m/year for ice-poor cliffs and ice-rich cliffs, respectively [32]. With a value of EPR of −0.21 m/year, our study area can be framed in around the average erosion rate previously reported in Svalbard. A recent study [51] reported EPR values of −0.19 m/year, which has increased from −0.07 m/year for period 1936–2007. This means that large portions of Svalbard coasts, strictly referring to those surveyed in the past, have a stable erosion rate. This is due to the fact that in many cases high erosion rates compensate with high accretion rates. The complex interaction between different sediment transporting processes and shoreline processes is well exemplified in this study and indicates that understanding of the upland systems is important for a predictive interpretation of the shore-line changes into the future.

4.3. Cultural Heritage

As shown by Hollesen et al. [43], the cold wet climate of the Arctic is the perfect environment in which cultural heritage can be preserved; following the climate variables and tendencies nowadays, the “friendly” environment is slowly disappearing. This leads to a systematic degradation of cultural heritage assets in the Arctic, which is the case of the present study, where coastal cultural heritage is in great danger of being destroyed.
The most vulnerable element of protected cultural heritage is the cable car station or loading dock (Figure 10a,b). Other remains that are washed away by the sea are visible in Figure 10c from 2011; those remains are no longer present in Figure 10d from 2019. This shows the power that sea exerts on the shoreline, along with longshore currents. To this is added the increase in global sea level, which is caused by an increase in temperature of the oceans and significant mass loss of the Svalbard glaciers [87]. Other cultural heritage remains exposed are the exploitation rail tracks (Figure 10e), along with wrecks of heavy machines, loading carts, small loading wagons, metal barrels and other industrial waste that is scattered in Sector 1, but very densely seen in Sector 2.

5. Conclusions

Historical evolution and temporal morphodynamics of shoreline position is of great importance in evaluating the spatial dynamics of the coastal system behaviour and of cultural heritage assets located in coastal areas. DSAS analysis of shoreline changes in years 1927–2019 shows both erosion and accretion for different sectors of the coastline. Sector 1, which is located in the north-west part of the investigated coastal area and has a length of 460 m is characterised as having high and very high erosion; Sector 2 has a length of 230 m has a moderate accretion, and Sector 3 with a length of 610 m showed moderate erosion, respectively. Potential changes in wind and wave direction and possibly intensity since 1927 have interacted with sediment availability and processes transporting material down to the beach zone. The type of shoreline sediments exposed to erosion also affects the resulting rate of erosion with already well-sorted and fine-grained beach sediments being more susceptible to abrasion than more course, poorly sorted debris flows and braided river sediments. Hence, the same change in wave energy might have a different result in shoreline displacement at different positions along the shore—causing a varied erosional hazard to pre-existing cultural heritage. If the active-layer thickness increases in a warming climate, this will contribute significantly to the potential erosion rates of sedimentary coast-lines. The fact that almost half of the shoreline has statistically high erosion transects, highlights the danger for the coastal cultural heritage and the need from local authorities of a future sustainable management plan.

Author Contributions

Conceptualisation, I.C.N., L.R.; methodology, I.C.N., K.S., L.R.; software, I.C.N.; validation, I.C.N.; formal analysis, I.C.N.; data curation, I.C.N., K.S., L.R.; writing—original draft preparation, I.C.N.; writing—review and editing, I.C.N., K.S., L.R., A.-C.F., V.V.M.; visualization, I.C.N.; supervision, I.C.N.; project administration, V.V.M.; funding acquisition, V.V.M. All authors have read and agreed to the published version of the manuscript.

Funding

This research was funded by the Research Council of Norway, CULTCOAST—Monitor, Manage and Preserve Sites and Landscapes under Climate Change and Development Pressure (MILJØFORSK), project number 294314.

Acknowledgments

The authors are grateful to the Norwegian Polar Institute (NPI) personnel for the assistance in the logistic fieldwork. Two anonymous reviewers are kindly acknowledged for their fruitful comments.

Conflicts of Interest

The authors declare no conflict of interest. The funders had no role in the design of the study; in the collection, analyses, or interpretation of data; in the writing of the manuscript, or in the decision to publish the results.

References

  1. Verlynde, N. Perceptions of risk and climate change in densely populated coastal areas. Environ. Risques Sante 2018, 1, 278–293. [Google Scholar] [CrossRef]
  2. Mentzafou, A.; Vamvakaki, C.; Zacharias, I.; Gianni, A.; Dimitriou, E. Climate change impacts on a Mediterranean river and the associated interactions with the adjacent coastal area. Environ. Earth Sci. 2017, 76, 259. [Google Scholar] [CrossRef]
  3. Yu, Q.W.; Lau, A.K.H.; Tsang, K.T.; Fung, J.C.H. Human damage assessments of coastal flooding for Hong Kong and the Pearl River Delta due to climate change-related sea level rise in the twenty-first century. Nat. Hazards 2018, 92, 1011–1038. [Google Scholar] [CrossRef]
  4. Kang, L.; Ma, L.; Liu, Y. Evaluation of farmland losses from sea level rise and storm surges in the Pearl River Delta region under global climate change. J. Geogr. Sci. 2016, 26, 439–456. [Google Scholar] [CrossRef] [Green Version]
  5. Jonah, F.E. Managing coastal erosion hotspots along the Elmina, Cape Coast and Moree area of Ghana. Ocean Coast. Manag. 2015, 109, 9–16. [Google Scholar] [CrossRef]
  6. Overduin, P.P.; Strzelecki, M.C.; Grigoriev, M.N.; Couture, N.; Lantuit, H.; St-Hilaire-Gravel, D.; Günter, F.; Wetterich, S. Coastal changes in the Arctic. In Sedimentary Coastal Zones from High to Low Latitudes: Similarities and Differences; Martini, I.P., Wanless, H.R., Eds.; Geological Society: London, UK, 2014; Volume 388, pp. 103–129. [Google Scholar] [CrossRef]
  7. Lantuit, H.; Overduin, P.P.; Couture, N.; Wetterich, S.; Aré, F.; Atkinson, D.; Brown, J.; Cherkashov, G.; Drozdov, D.; Forbes, D.L.; et al. The Arctic Coastal Dynamics database: A new classification scheme and statistics on arctic permafrost coastlines. Estuar. Coast. 2012, 35, 383–400. [Google Scholar] [CrossRef] [Green Version]
  8. Ding, M.; Wang, S.; Sun, W. Decadal Climate Change in Ny-Ålesund, Svalbard, A Representative Area of the Arctic. Condens. Matter 2018, 3, 12. [Google Scholar] [CrossRef] [Green Version]
  9. Yletyinen, J. Arctic climate resilience. Mar. Biol. 2019. [Google Scholar] [CrossRef]
  10. Strozzi, T.; Paul, F.; Wiesmann, A.; Schellenberger, T.; Kääb, A. Circum-Arctic Changes in the flow of Glaciers and Ice Caps from Satellite SAR Data between the 1990s and 2017. Remote Sens. 2017, 9, 947. [Google Scholar] [CrossRef] [Green Version]
  11. Bartsch, A.; Höfler, A.; Kroisleitner, C.; Trofaier, A.M. Land Cover Mapping in Northern High Latitude Permafrost Regions with Satellite Data: Achievements and Remaining Challenges. Remote Sens. 2016, 8, 979. [Google Scholar] [CrossRef] [Green Version]
  12. Lousada, M.; Vieira, G.; Bandeira, L.; Mora, C. Evaluation of the use of very high resolution aerial imagery for accurate ice-wedge polygon mapping (Adventdalen, Svalbard). Sci. Total Environ. 2018, 615, 1574–1583. [Google Scholar] [CrossRef]
  13. De Haas, T.; Kleinhans, M.G.; Carbonneau, P.E.; Rubensdotter, L.; Hauber, E. Surface morphology of fans in the high-Arctic periglacial environment of Svalbard: Controls and processes. Earth Sci. Rev. 2015, 146, 163–182. [Google Scholar] [CrossRef] [Green Version]
  14. Lewkowicz, A.G.; Way, R.G. Extremes of summer climate trigger thousands of thermokarst landslides in a High Arctic environment. Nat. Commun. 2019, 10, 1329. [Google Scholar] [CrossRef] [Green Version]
  15. Ramage, J.L.; Irrgang, A.M.; Herzschuh, U.; Morgenstern, A.; Couture, N.; Lantuit, H. Terrain controls on the occurrence of coastal retrogressive thaw slumps along the Yukon Coast, Canada. J. Geophys. Res. Earth Surf. 2017, 122, 1619–1634. [Google Scholar] [CrossRef]
  16. Lantuit, H.; Pollard, W.H. Fifty years of coastal erosion and retrogressive thaw slump activity on Herschel Island, southern Beaufort Sea, Yukon Territory, Canada. Geomorphology 2008, 95, 84–102. [Google Scholar] [CrossRef]
  17. Barbante, C.; Spolaor, A.; Cairns, W.R.L.; Boutron, C. Man’s footprint on the Arctic environment as revealed by analysis of ice and snow. Earth Sci. Rev. 2017, 168, 218–231. [Google Scholar] [CrossRef]
  18. Van Pelt, W.; Pohjola, V.; Petterson, R.; Marchenko, S. A long-term dataset of climatic mass balance, snow conditions, and runoff in Svalbard (1957–2018). Cryosphere 2019, 13, 2259–2280. [Google Scholar] [CrossRef] [Green Version]
  19. Pilguj, N.; Kolendowics, L.; Kryza, M.; Migała, K.; Czernecki, B. Temporal changes in wind conditions at Svalbard for the years 1986–2015. Geogr. Ann. A 2019, 101, 136–156. [Google Scholar] [CrossRef]
  20. Lim, M.; Strzelecki, M.C.; Kasprzak, M.; Swirad, Z.M.; Webster, C.; Woodward, J.; Gjelten, H. Arctic rock coast responses under a changing climate. Remote Sens. Environ. 2020, 236, 111500. [Google Scholar] [CrossRef]
  21. Jaskólski, M.W.; Pawłowski, Ł.; Strzelecki, M.C. High Arctic coasts at risk—The case study of coastal zone development and degradation associated with climate changes and multidirectional human impacts in Longyearbyen (Adventfjorden, Svalbard). Land Degrad. Dev. 2018, 29, 2514–2524. [Google Scholar] [CrossRef]
  22. Sisneros-Kidd, A.M.; Monz, C.; Hausner, V.; Schmidt, J.; Clark, D. Nature-based tourism, resource dependence, and resilience of Arctic communities: Framing complex issues in a changing environment. J. Sustain. Tour. 2019, 27, 1259–1276. [Google Scholar] [CrossRef]
  23. Ramakrishnan, R.; Agrawal, R.; Remya, P.G.; NagaKumar, K.C.V.; Demuduc, G.; Rajawat, A.S.; Nair, B.; Rao, K.N. Modelling coastal erosion: A case study of Yarada beach near Visakhapatnam, east coast of India. Ocean Coast. Manag. 2018, 156, 239–248. [Google Scholar] [CrossRef]
  24. Stronkhorst, J.; Huisman, B.; Giardino, A.; Santinelli, G.; Santos, F.D. Sand nourishment strategies to mitigate coastal erosion and sea level rise at the coasts of Holland (The Netherlands) and Aveiro (Portugal) in the 21st century. Ocean Coast. Manag. 2018, 156, 266–276. [Google Scholar] [CrossRef]
  25. Narra, P.; Coelho, C.; Sancho, F.; Palalane, J. CERA: An open-source tool for coastal erosion risk assessment. Ocean Coast. Manag. 2017, 142, 1–14. [Google Scholar] [CrossRef]
  26. Appelquist, L.R.; Balstrøm, T. Application of the Coastal Hazards Wheel methodology for coastal multi-hazards assessment and management in the state of Djibouti. Clim. Risk Manag. 2014, 3, 79–95. [Google Scholar] [CrossRef] [Green Version]
  27. Micallef, S.; Micallef, A.; Galdies, C. Application of the Coastal Hazard Wheel to assess erosion on the Maltese coast. Ocean Coast. Manag. 2018, 156, 209–222. [Google Scholar] [CrossRef] [Green Version]
  28. Fitton, J.M.; Hansom, J.D.; Rennie, A.F. A national coastal erosion susceptibility model for Scotland. Ocean Coast. Manag. 2016, 132, 80–89. [Google Scholar] [CrossRef] [Green Version]
  29. Pantusa, D.; D’Alessandro, F.; Riefolo, L.; Principato, F.; Tomasicchio, G.R. Application of a coastal vulnerability index. A case study along the Apulian Coastline, Italy. Water 2018, 10, 1218. [Google Scholar] [CrossRef] [Green Version]
  30. Molina, R.; Anfuso, G.; Manno, G.; Gracia Prieto, F.J. The Mediterranean Coast of Andalusia (Spain): Medium-Term Evolution and Impacts of Coastal Structures. Sustainability 2019, 11, 3539. [Google Scholar] [CrossRef] [Green Version]
  31. Ruiz-Beltran, A.P.; Astorga-Moar, A.; Salles, P.; Appendini, C.M. Short-Term Shoreline Trend Detection Patterns Using SPOT-5 Image Fusion in the Northwest of Yucatan, Mexico. Estuar. Coast. 2019, 42, 1761–1773. [Google Scholar] [CrossRef]
  32. Sessford, E.G.; Bæverford, M.G.; Hormes, A. Terrestrial processes affecting unlithified coastal erosion disparities in central fjords of Svalbard. Polar Res. 2015, 34, 24122. [Google Scholar] [CrossRef] [Green Version]
  33. Crowther, A.; Faulkner, P.; Prendergast, M.E.; Morales, E.M.Q.; Horton, M.; Wilmsen, E.; Kotarba-Morley, A.M.; Christie, A.; Petek, N.; Tibesasa, R.; et al. Coastal subsistence, maritime trade, and the colonization of small offshore islands in Eastern African Prehistory. J. Isl. Coast. Archaeol. 2016, 11, 211–237. [Google Scholar] [CrossRef] [Green Version]
  34. Kzakzad, S.; Pieters, M.; Van Balen, K. Coastal cultural heritage: A resource to be included in integrated coastal zone management. Ocean Coast. Manag. 2015, 118, 110–128. [Google Scholar] [CrossRef]
  35. Asandulesei, A.; Tencariu, F.A.; Nicu, I.C. Pars pro toto—Remote sensing data for the reconstruction of a rounded Chalcolithic site from NE Romania: The case of Ripiceni—Holm settlement (Cucuteni Culture). Remote Sens. 2020, 12, 887. [Google Scholar] [CrossRef] [Green Version]
  36. Nicu, I.C.; Usmanov, B.; Gainullin, I.; Galimova, M. Shoreline dynamics and evaluation of cultural heritage sites on the shores of large reservoirs: Kuibyshev Reservoir, Russian Federation. Water 2019, 11, 591. [Google Scholar] [CrossRef] [Green Version]
  37. Pourkerman, M.; Marriner, N.; Morhange, C.; Djamali, M.; Amjadi, S.; Lahijani, H.; Beni, A.N.; Vacchi, M.; Tofighian, H.; Shah-Hoessein, M. Tracking shoreline erosion of “at risk” coastal archaeology: The example of ancient Siraf (Iran, Persian Gulf). Appl. Geogr. 2018, 101, 45–55. [Google Scholar] [CrossRef]
  38. Jazwa, C.S.; Johnson, K.N. Erosion of coastal archaeological sites on Santa Rosa Island, California. West. N. Am. Nat. 2018, 78, 302–327. [Google Scholar] [CrossRef]
  39. Chapman, H.P.; Fletcher, W.G.; Thomas, G. Quantifying the effects of erosion on the archaeology of intertidal environments. A new approach and its implications for their management. Conserv. Manag. Arch. 2001, 4, 233–240. [Google Scholar] [CrossRef]
  40. Nicu, I.C. Natural hazards—A threat for immovable cultural heritage. A review. Int. J. Conserv. Sci. 2017, 8, 375–388. [Google Scholar]
  41. Fatorić, S.; Seekamp, E. Are cultural heritage and resources threatened by climate change? A systematic literature review. Clim. Chang. 2017, 142, 227–254. [Google Scholar] [CrossRef]
  42. Barr, S. Cultural Heritage, or How Bad News Can Also Be Good. In Arctic Triumph; Sellheim, N., Zaika, Y., Kelman, I., Eds.; Springer: Chaam, The Netherlands, 2019; pp. 43–57. [Google Scholar] [CrossRef]
  43. Hollesen, J.; Callanan, M.; Dawson, T.; Fenger-Nielsen, R.; Friesen, T.M.; Jensen, A.M.; Markham, A.; Martens, V.V.; Pitulko, V.V.; Rockman, M.; et al. Climate change and the deteriorating archaeological and environmental archives of the Arctic. Antiquity 2018, 92, 573–586. [Google Scholar] [CrossRef]
  44. Holmgaard, S.B.; Thuestad, A.E.; Myrvoll, E.R.; Barlindhaug, S. Monitoring and Managing Human Stressors to Coastal Cultural Heritage in Svalbard. Humanities 2019, 8, 21. [Google Scholar] [CrossRef] [Green Version]
  45. Dawson, J.; Johnson, M.; Stewart, E. The unintended consequences of regulatory complexity: The case of cruise tourism in Arctic Canada. Mar. Policy 2017, 76, 71–78. [Google Scholar] [CrossRef]
  46. Thuestad, A.E.; Tømmervik, H.; Solbø, S.A. Assessing the impact of human activity on cultural heritage in Svalbard: A remote sensing study of London. Polar J. 2015, 5, 428–445. [Google Scholar] [CrossRef]
  47. Hagen, D.; Vistad, O.I.; Eide, N.E.; Flyen, A.C.; Fangel, K. Managing visitor sites in Svalbard: From a precautionary approach towards knowledge-based management. Polar Res. 2012, 31, 18432. [Google Scholar] [CrossRef] [Green Version]
  48. Zagórski, P.; Rodzik, J.; Moskalik, M.; Strzelecki, M.C.; Lim, M.; Błaszczyk, M.; Promińska, A.; Kruszewski, G.; Styszyńska, A.; Malczewski, A. Multidecadal (1960–2011) shoreline changes in Isbjørnhamna (Hornsund, Svalbard). Pol. Polar Res. 2015, 36, 369–390. [Google Scholar] [CrossRef]
  49. Sessford, E.G. Spatial and Temporal Analysis of Holocene Coastal Development: Applications to Erosion Assessment and Cultural Heritage Mitigation in Svalbard. Master’s Thesis, University of Oslo, Oslo, Norway, 2013. [Google Scholar]
  50. Zagórski, P. Shoreline dynamics of Calypsostranda (NW Wedel Jarlsberg Land, Svalbard during the last century). Pol. Polar Res. 2011, 32, 67–99. [Google Scholar] [CrossRef]
  51. Zagórski, P.; Jarosz, K.; Superson, J. Integrated assessment of shoreline change along the Calypsostranda (Svalbard) from remote sensing, field survey and GIS. Mar. Geod. 2020, 1–22. [Google Scholar] [CrossRef]
  52. Zagórski, P.; Gajek, G.; Demczuk, P. The influence of glacier systems of polar catchments on the functioning of the coastal zone (Recherchefjorden, Svalbard). Z. Geomorphol. 2012, 56, 101–121. [Google Scholar] [CrossRef]
  53. Ziaja, W.; Maciejowski, W.; Ostafin, K. Coastal landscape dynamics in NE Sørkapp Land (SE Spitsbergen), 1900–2005. Ambio 2009, 38, 201–208. [Google Scholar] [CrossRef]
  54. Strzelecki, M.C.; Małecki, J.; Zagórski, P. The influence of recent deglaciation and associated sediment flux on the functioning of polar coastal zone—Northern Petuniabukta, Svalbard. In Sediment Fluxes in Coastal Areas; Coastal Research Library 10; Maanan, M., Robin, M., Eds.; Springer: Dordrecht, The Netherlands, 2015; pp. 23–45. [Google Scholar] [CrossRef]
  55. Bourriquen, M.; Baltzer, A.; Mercier, D.; Fournier, J.; Pérez, L.; Haquin, S.; Bernard, E.; Jensen, M. Coastal evolution and sedimentary mobility of Brøgger Peninsula, northwest Spitsbergen. Polar Biol. 2016, 39, 1689–1698. [Google Scholar] [CrossRef]
  56. Jaskólski, M.W.; Pawłowski, Ł.; Strzelecki, M.C. Assessment of geohazards and coastal change in abandoned Arctic town, Pyramiden, Svalbard. In Cryosphere Reactions Against the Background of Environmental Changes in Contrasting High-Arctic Conditions in Svalbard; Institute of Geoecology and Geoinformation A. Mickiewicz in Poznań Polar Reports; Rachlewicz, J., Ed.; Bogucki Wydawnictwo Naukowe: Poznan, Poland, 2017; Volume 2, pp. 51–64. [Google Scholar]
  57. Kavan, J. Post-Little Ice Age development of coast in the locality of Kapp Napier, central Spitsbergen, Svalbard archipelago. Mar. Geod. 2019. [Google Scholar] [CrossRef]
  58. Mercier, D.; Laffly, D. Actual paraglacial progradation of the coastal zone in the Kongsfjorden area, western Spitsbergen (Svalbard). In Cryospheric Systems: Glaciers and Permafrost; Harris, C., Murton, J.B., Eds.; Geological Society, Special Publications 242: London, UK, 2005; pp. 111–117. [Google Scholar] [CrossRef]
  59. Bourriquen, M.; Mercier, D.; Baltzer, A.; Fournier, J.; Costa, S.; Roussel, E. Paraglacial coasts responses to glacier retreat and associated shifts in river floodplains over decadal timescales (1966–2016), Kongsfjorden, Svalbard. Land Degrad. Dev. 2018, 29, 4173–4185. [Google Scholar] [CrossRef]
  60. Zagórski, P.; Strzelecki, M.C.; Rodzik, J. Processes controlling the past and recent evolution of coastal environments in the southern Bellsund, Svalbard. In New Perspectives in Polar Research; Migała, K.P., Owczarek, P., Kasprzak, M., Strzelecki, M.C., Eds.; Instytut Geografii i Rozwoju Regionalnego, Uniwersytet Wrocławski: Wrocław, Poland, 2014; pp. 205–230. [Google Scholar]
  61. Hollesen, J.; Matthiesen, H.; Elberling, B. The impact of climate change on an archaeological site in the Arctic. Archaeometry 2017, 59, 1175–1189. [Google Scholar] [CrossRef] [Green Version]
  62. Harmsen, H.; Hollesen, J.; Madsen, C.K.; Albrechtsen, B.; Myrup, M.; Matthiesen, H. A Ticking Clock? Preservation and Management of Greenland’s Archaeological Heritage in the Twenty-First Century. Conserv. Manag. Arch. 2018, 20, 175–198. [Google Scholar] [CrossRef]
  63. Hollesen, J.; Matthiesen, H.; Fenger-Nielsen, R.; Abermann, J.; Westergaard-Nielsen, A.; Elberling, B. Predicting the loss of organic archaeological deposits at a regional scale in Greenland. Sci. Rep. 2019, 9, 9097. [Google Scholar] [CrossRef]
  64. Himmelstoss, E.A.; Henderson, R.E.; Kratzmann, M.G.; Farris, A.S. Digital Shoreline Analysis System (DSAS) Version 5.0 User Guide; U.S. Geological Survey Open-File Report 2018-1179; U.S. Geological Survey: Reston, VA, USA, 2018. [CrossRef] [Green Version]
  65. Norwegian Institute for Cultural Heritage Research. Available online: https://www.niku.no/prosjekter/cultcoast/ (accessed on 2 January 2020).
  66. Norwegian Polar Institute. Available online: https://geodata.npolar.no/ (accessed on 2 January 2020).
  67. Dallmann, W.K.; Kjærnet, T.; Nøttvedt, A. Geological Map of Svalbard, 1:100,000 sheet C9G Adventdalen; Temakart 31/32; Norwegian Polar Institute: Tromsø, Norway, 2001; pp. 4–55. [Google Scholar]
  68. Lønne, I. Faint traces of high Arctic glaciations: An early Holocene ice-front fluctuation in Bolterdalen, Svalbard. Boreas 2005, 34, 308–323. [Google Scholar] [CrossRef]
  69. Christiansen, H.H.; Humlum, O.; Eckerstorfer, M. Central Svalbard 2000-2011 Meteorological Dynamics and Periglacial Landscape Response. Arct. Antarct. Alp. Res. 2013, 45, 6–18. [Google Scholar] [CrossRef] [Green Version]
  70. Nyman, E.; Galvao, C.B.; Mileski, J.; Tiller, R. The Svalbard archipelago: An exploratory analysis of port investment in the context of the new arctic routes. Marit. Stud. 2019. [Google Scholar] [CrossRef]
  71. Riksantivaren—Norwegian Directorate for Cultural Heritage Management. Available online: https://www.riksantikvaren.no/veiledere/askeladden/ (accessed on 5 February 2020).
  72. Norwegian Polar Institute. Available online: https://geodata.npolar.no/arcgis/rest/services/Basisdata/NP_Ortofoto_Svalbard_WMTS_25833/MapServer?f=jsapi (accessed on 3 January 2020).
  73. Arlov, T.B. A Short History of Svalbard, 2nd ed.; Norsk Polarinstitutt: Oslo, Norway, 1989. [Google Scholar]
  74. Governor of Svalbard. Available online: https://www.sysselmannen.no/en/the-governor-of-svalbard/environmental-protection/cultural-heritage-management/ (accessed on 7 January 2020).
  75. Jørgensen, R.; Bertelsen, R. Archaeological research on Svalbard and the preservation of historical monuments, a resource crisis? Acta Boreal. A Nord. J. Circumpolar Soc. 1989, 6, 5–9. [Google Scholar] [CrossRef]
  76. Albrethsen, S.E. Archaeological investigations of 17th century whaling on Svalbard. Acta Boreal. A Nord. J. Circumpolar Soc. 1989, 6, 43–51. [Google Scholar] [CrossRef]
  77. Hultgreen, T. When Did the Pomors Come to Svalbard? Acta Boreal. 2002, 19, 125–145. [Google Scholar] [CrossRef]
  78. Jasinski, M.E.; Zagórski, P. Significance of Archaeological Sites for Estimating Coastal Plain Development in the Renardodden Area, Bellsund, Spitsbergen; Wyprawy Geograficzne na Spitsbergen, UMCS: Lublin, Poland, 1995; pp. 35–41. [Google Scholar]
  79. Starkov, V.F. Methods of Russian Heritage Site Dating on the Spitsbergen Archipelago. Acta Boreal. A Nord. J. Circumpolar Soc. 2005, 22, 63–78. [Google Scholar] [CrossRef]
  80. Senger, K.; Brugmans, P.; Grundvåg, S.; Jochmann, M.M.; Nøttvedt, A.; Olaussen, S.; Skotte, A.; Aleksandra, S.-S. Petroleum, coal and research drilling onshore Svalbard: A historical perspective. Norw. J. Geol. 2019, 99. [Google Scholar] [CrossRef] [Green Version]
  81. Hacquebord, L. Three centuries of whaling and walrus hunting in Svalbard and its impact on the Arctic ecosystem. Environ. Hist. 2001, 7, 169–180. [Google Scholar]
  82. Dahle, K.; Bjerck, H.B.; Prestvold, K. Kulturminneplan for Svalbard 2000–2010. Cultural heritage plan for Svalbard 2000–2010. Longyearbyen, Governor of Svalbard, 2000. Sysselmannens Rapp. 2000, 2, 126. Available online: https://www2.sysselmannen.no/globalassets/sysselmannen-dokument/trykksaker/kulturminneplan_2am0y.pdf (accessed on 7 February 2020).
  83. Governor of Svalbard. Kulturminneplan for Svalbard 2013-2023. Plan for the management of cultural heritage in Svalbard from 2013 to 2023. Rapportserie 2013, 1, 112. Available online: https://www.sysselmannen.no/contentassets/a68fc9647eaa4c72bcfee9835f448a96/sysselmannen_kulturminnepl_2013_web-2.pdf (accessed on 7 February 2020).
  84. Norwegian Polar Institute. Available online: https://toposvalbard.npolar.no (accessed on 14 February 2020).
  85. Johannessen, L.J. Hiorthhamn—Kulldrift Under Vanskelige Forhold. 2006, p. 12. Available online: https://www2.sysselmannen.no/globalassets/sysselmannen-dokument/trykksaker/hiorthamn_for_web_67mnp.pdf (accessed on 7 February 2020).
  86. Lønne, I.; Nemec, W. High-arctic fan delta recording deglaciation and environment disequilibrium. Sedimentology 2004, 51, 553–589. [Google Scholar] [CrossRef]
  87. Church, J.A.; Monselesan, D.; Gregory, J.M.; Marzeion, B. Evaluating the ability of process based models to project sea-level change. Environ. Res. Lett. 2013, 8, 014051. [Google Scholar] [CrossRef]
Figure 1. Distribution of studies dealing with coastal erosion in Svalbard (red numbers correspond to numbers from Table 1, column 1) (base map from Norwegian Polar Institute) [66].
Sustainability 12 02306 g001
Figure 2. (a). Geographical location of the study area in the context of Svalbard; (b) Local context; (c) Location of the protected cultural heritage (base orthophoto from Norwegian Polar Institute) [66].
Sustainability 12 02306 g002
Figure 3. (a) Former coal-mining infrastructure in Longyearbyen; (b,c) Former coal-mining infrastructure in Hiorthhamn; (d–f) Remains of the coal-mining exploitation in Svea; (g–i) Current images from the Russian coal-mining city of Barentsburg.
Sustainability 12 02306 g003
Figure 4. Detail of Hiorthhamn mining settlement from 1936, with emphasis on the three sectors analysed in this study (image courtesy: Norwegian Polar Institute) [84].
Sustainability 12 02306 g004
Figure 5. (a) Total station and controller on one of the fixed points; (b) Coastline survey; (c) Geological mapping of the upper area of Hiorthhamn; (d) Survey of surface soil movements.
Sustainability 12 02306 g005
Figure 6. Map showing geomorphology and surface sedimentology in the study area. Simplified genetic sediment classifications of Sector 3 are based on the study of Lønne and Nemec [86].
Sustainability 12 02306 g006
Figure 7. (a) Overview of primarily the active fan with boxes marking the position of interpreted coastal sectors. Note that Sectors 1 and 3 extend outside the photo. Blue arrow indicates the long-shore sediment transport direction forming a small spit-bar in the eastern end of Sector 1; (b) Photo towards north west, from the coastal escarpment of the relict alluvial fan in Sector 3, towards sectors 1 and 2. Dotted line delineates the post 2009 debris flow advance of the coastline in Sector 2; (c) Photo from the middle of Sector 2 towards east showing shoreline erosional edge (left of person) and the recent debris flow deposit (dotted line); (d) Sector 3. Fresh small slump from the shoreline escarpment in the relict alluvial fan; (e) The peat covered relict beach ridge plain in Sector 1; (f) The active erosion edge of the shoreline in Sector 1 at high tide (rifle for scale). Note the coarse sorted beach sediment in the section and the thin strip of beach separating the shoreline scarp from the water line.
Sustainability 12 02306 g007
Figure 8. (a) End Point Rate and (b) Shoreline Change Envelope of the coast in Hiorthhamn area as calculated by DSAS (1927, 2009 and 2019 shoreline position used).
Sustainability 12 02306 g008
Figure 9. (a) Coastal stability derived from Net Shoreline Movement analysis (in m) (very high erosion = NSM −70.84 to −53.33; high erosion = NSM −53.32 to −30.41; moderate erosion = NSM −30.40 to −9.01; stability = NSM −9.00 to 5; moderate accretion = NSM 5.01 to 24.12; high accretion = NSM 24.13 to 41.96; (b) LRR parameter expressed in m/year.
Sustainability 12 02306 g009
Figure 10. Details over Sector 1; (a,b) Details highlighting the erosion of what was in the past the loading dock; (c) Figure from 2011 highlighting remains from the exploitation equipment on the beach (courtesy of A.-C. Flyen); (d) The only remained equipment on the beach in 2019; (e) Exploitation rail tracks affected by coastal erosion.
Sustainability 12 02306 g010
Table 1. List of studies dealing with coastal erosion in Svalbard (numbers in column 1 correspond to the red numbers in Figure 1.
Number on MapLocation Inside SvalbardKeywordsReference
1BrøggerhalvøyaCoastal erosion, Arctic, SvalbardOverduin et al. [6]
2LongyearbyenCoastal change and vulnerability, environmental risk assessment, community infrastructure, Longyearbyen, High ArcticJaskólski et al. [21]
3 (a–d)Vestpynten, Fredheim, Damesbukta, Kapp LailaTerrestrial-sourced hazards, coastal erosion, coastal geomorphology, DSAS, SvalbardSessford et al. [32]
4IsbjørnhamnaArctic, Spitsbergen, coastal erosion, sea-ice, shore ice, fjord systemZagórski et al. [48]
5 (ac)Fredheim, Longyearbyen, SkansbuktaCultural heritage, monitoring, mitigation, SvalbardSessford [49]
6CalypsostrandaArctic, Spitsbergen, photogrammetric granulometry, sediment texture, impact of wavesZagórski [50]
Coastal change, DSAS * shoreline hazard map, coastal erosion, coastal morphodynamics, SvalbardZagórski et al. [51]
7RecherchefjordenPolar catchments, glacier systems, coastal zone, Recherchefjorden, SvalbardZagórski et al. [52]
8SørkappCoastal dynamics, coastal landscape, Pre-Quaternary bedrockZiaja et al. [53]
9Petuniabukta (Billefjorden)Glacier retreat, fjord, coastal evolution, sediment transportStrzelecki et al. [54]
10Brøgger PeninsulaSubmarine and aerial coastal evolution, paraglacial, sedimentary flux, High Arctic, SvalbardBourriquen et al. [55]
11PyramidenCoastal management, geohazards, environmental assessment, Pyramiden, ArcticJaskólski et al. [56]
12Kapp NapierClimate change, coast evolution, glacier, historic photographs, SvalbardKavan [57]
13KongsfjordenValley glaciers, GIS, shoreline dynamics, glacial runoffMercier and Laffly [58]
Arctic, coastal geomorphology, global change, paraglacial, SpitsbergenBourriquen et al. [59]
14BellsundCoastal morphodynamics, glacial processes, paraglacial processes, sea ice and shore ice, High Arctic, SvalbardZagórski et al. [60]
* DSAS—Digital Shoreline Analysis System.

