Abstract
Despite advances in the data, models, and methods underpinning environmental life cycle assessment (LCA), it remains challenging for practitioners to effectively communicate and interpret results. These shortcomings can bias decisions and hinder public acceptance for planning supported by LCA. This paper introduces a method for interpreting LCA results, the Argumentation Corrected Context Weighting-LCA (ArgCW-LCA), to overcome these barriers. ArgCW-LCA incorporates stakeholder preferences, corrects unjustified disagreements, and allows for the inclusion of non-environmental impacts (e.g., economic, social, etc.) using a novel weighting scheme and the application of multi-criteria decision analysis to provide transparent and context-relevant decision support. We illustrate the utility of the method through two case studies: a hypothetical decision regarding energy production and a real-world decision regarding polyphenol extraction technologies. In each case, we surveyed a relevant stakeholder group on their environmental views and fed their responses into the model to provide decision support that is relevant to their perspective. We found marked differences between results using ArgCW-LCA and results from a conventional analysis using an equal-weighting scheme, as well as differentiation between stakeholder preference groups, indicating the importance of applying the perspective of the particular stakeholder group. For instance, there was a rank reversal of alternatives when comparing between an equal weighting approach for all environmental and economic dimensions and ArgCW-LCA. ArgCW-LCA provides opportunity for both public and private sector incorporation of LCA, such as in developing enlightened stakeholder value measures. This is achieved through enabling the LCA practition to provide public and private actors’ interpreted LCA results in a manner that incorporates educated stakeholder perspectives. Furthermore, the method encourages stakeholder multiplicity through participatory design and policymaking that can enhance public backing of actions that can make society more sustainable.
1. Introduction
Effective communication of life cycle assessment (LCA) results to non-technical audiences remains an ongoing challenge [1]. As LCA is increasingly applied outside of academia, particularly in policy making and cross-sector planning, practitioners need appropriate methods to convey results to audiences without intimate knowledge of LCA [2]. In the past, they have commonly resorted to endpoint indicators that frame impacts in terms of broad societal concerns, such as damage to ecosystems, resource depletion, and human health. Although easy to understand, endpoints are less comprehensive and exhibit higher levels of uncertainty than more granular midpoint impacts [3]. Alternatively, practitioners have subjectively weighted and aggregated endpoints to a simple single score, at the risk of failing to account for dominating alternatives, to recognize interdependency of indicators, and to convey stakeholder perspectives (both included and excluded) [4,5]. This issue also affects methods such as internalized monetization of environmental impacts [6], as the issues that are present in the calculation of endpoint damages [4] are implicitly included in the monetized damages. Standalone midpoint impacts (e.g., carbon footprint) are also used to convey results. However, this is also in effect a subjective ‘binary’ weighting that can induce burden shifting, e.g., the optimization of the carbon footprint leading to increases in ecotoxicity [5,7].
Because of these issues, using present methods of deriving single scores in LCA can have unintended consequences. At best, LCA users can unwittingly utilize subjective scoring systems. At worst, an LCA practitioner can covertly pick a scoring system that aligns with desired outcomes, with potentially negative consequences for other actors along with the potential for misguidance. Furthermore, the complex methods used to develop single scores can obfuscate subjective modeling choices and results interpretation. These issues can potentially produce poor and biased decision making, environmental management failures, environmental inequities, and the like.
When decisions based on LCAs effect large systems, such as in developing public policy and large-scale corporate decision-making, broad populations can also be impacted. For example, present efforts that push to reduce the carbon footprint in, e.g., energy production to reach current political climate targets through the introduction of photovoltaics [8] could unintentionally increase other impacts, such as marine ecotoxicity and mineral resource depletion. This type of decision-making instance with wide-reaching effects behooves clearer modes of communicating the implementation and the interpretation of supporting LCAs [9]. Effective and understandable results interpretation remains particularly challenging, with 500 corporate CEOs listing difficulty in interpreting results as the second greatest hindrance to use of decision support tools [10].
Partly in response to the issue of stakeholder exclusion in decision making, a number of methodologies have been developed to involve non-experts in planning [11,12] and to include their voices in policy development [9,13]. When these processes include LCA, participatory methods should be used where possible in developing the LCA, and results should be presented clearly to support informed input from all stakeholders. To date, LCA practitioners have lacked a systemic process that both transparently includes multiple stakeholder perspectives as well as clearly and understandably reports results to the general public.
To address this gap, this paper introduces a methodology to facilitate a more inclusive LCA process. We call this methodology the Argumentation Corrected Context Weighting for LCA (ArgCW-LCA) methodology. ArgCW-LCA introduces a novel method to gather and weight varying stakeholder perspectives, which provide transparently derived single scores that can support decisions on any scale of system. Unlike current systems of developing single scores, which each only offer some of these abilities [4,5], ArgCW-LCA offers the ability for an LCA practitioner to: include non-environmental impacts, account for the entire range of environmental impacts assessed in LCA, provide easy-to-understand transparent weightings, and include stakeholder perspectives, in the development of a comparative single-score assessment for decision support.
We demonstrate ArgCW-LCA through two case studies. The first is a theoretical decision about the selection of an energy production method for increased utilization in a national-scale energy supply grid. The second is a real decision-making context from the Horizon 2020 NoAW project (https://cordis.europa.eu/project/rcn/203384/factsheet/en) where a lab-scale technology for polyphenol extraction must be chosen for upscaling to pilot scale.
The ArgCW-LCA methodology advances a stakeholder-consensus-based approach to interpret environmental assessments that includes social and economic considerations. This opens the door towards LCAs that can better account for the multiple dimensions of sustainability, which can inform more holistic and inclusive environmental governance in the public and private sectors. Thus, such a methodology creates opportunity to effectively and quantitatively include these issues in decision making that has the potential for broad societal and environmental impact.
2. Methods
The ArgCW-LCA methodology operationalizes a stakeholder-perspective-driven process for environmental management. The methodology is comprised of six-steps: (i) collecting stakeholder perspectives, (ii) transforming perspectives to weights, (iii) assessing stakeholder accord, (iv) applying argumentation to divergent perspectives, (v) calculation and calibration of weights, and (vi) application of multi-criteria decision analysis (MCDA) (Figure 1). Through these elements, ArgCW-LCA generates a single score that can include impacts across environmental, social and economic dimensions.

Figure 1.
Application flow for the ArgCW-LCA methodology.
2.1. Collection of Stakeholder Perspectives
The first step in ArgCW-LCA is the collection of stakeholder perspectives. In this step, each member of the stakeholder group ranks all criteria to be used in the decision-making process and includes a justification for their ranking. There is little limitation on how this can be carried out, except that all rankings must include a justification. Rankings can include multiple criteria ranked equally and criteria can be omitted entirely from a stakeholder’s ranking. This step could be carried out through workshops, structured interviews, questionnaires, or any other similar format. Regardless of which method is chosen, care should be taken in regards to influence on stakeholder perception prior to gathering responses so as to avoid biasing stakeholder perspective.
The appropriateness of utilizing the perspectives of the stakeholder/decision-maker group is one issue that might come into question in this step. For example, the executive-suite of a corporation may not have an opinion on the relationship of various environmental impacts. However, this can be solved by giving equal weighting from the stakeholder group, thus reflecting the effective non-response of the stakeholder group. While this does not include any profound insight from the stakeholder group, it does adequately incorporate their views, or rather lack thereof, and allow the latter elements of the method (e.g., environmental context) to determine the weighting. Another alternative might be for an LCA practitioner to incorporate recommendations from the literature, such as the recommendations from ILCD [14,15] as the basis for providing a stakeholder weighting profile, effectively allowing the stakeholder to acquiesce to expert opinion. More ideally in this latter option, the LCA practitioner could apply a mixed approach in which expert information is used to inform the stakeholder and to empower the stakeholders to provide a perspective. However, as cautioned above, this is effectively influencing the stakeholder perspective and great care should be taken when applying this approach.
2.2. Transformation to Weights
In order to utilize the stakeholder perspectives in the context of an MCDA, as carried out in this methodology, the rankings gathered from the collection of stakeholder perspectives must be transformed to weighting factors. This can be done in either one step or multiple steps. For single-step transformation, the rankings from stakeholder perspectives are converted to weightings using the rank order centroid (ROC) method, which assigns fixed weights to a given ranking based on the number of criteria ranked (Equation (1)).
This method was chosen due to its effectiveness as an implementation tool, ease of implementation, and predictive performance [16,17,18]. For multi-step conversions, such as where environmental and economic criteria are treated as two separate criteria sets, the ROC method is applied to each set of criteria and then the criteria sets are weighted in relation to each other either directly or by a second application of the ROC method. The direct application of weighting is preferred when the number of criteria sets is small and direct application of weighting is easily understood. When the number of criteria sets is large, e.g., more than three or four, or there is uncertainty regarding the appropriate relative weighting of the criteria sets, a second application of ROC can be carried out to increase the reliability of the weighting between criteria sets.
Where there was no response for a given criterion from a stakeholder, that weight-stakeholder-criterion pairing is left blank in the calculation of the stakeholder perspective. Because the weights are averaged amongst all respondents, this treats a non-response as a ‘no opinion’, removing the respondent from the calculation of that specific criterion’s weight. This effectively treats a ‘no opinion’ response as equal to the mean of all other respondents, which corresponds to the logical idea that if a decision maker does not have an opinion, then they would defer to the perspective of their peers—an extension of what one finds in the concept of majority rule [19].
2.3. Assessment of Stakeholder Accord
The weights for each of the criteria are analyzed to determine how well the average weight represents the individual values of the respondents. To test this, a slightly modified version of a coefficient of variation (CV*) was used (Equation (2)).
where S = standard deviation of the weights in the individual criteria and µ=the mean of all weights in the respondent group.
Using the CV* statistic, with cut-offs placed at 50 (moderate disagreement) and 70 (high disagreement), each of the assessment criteria is characterized in terms of relative disagreement amongst respondents. These cutoffs are set at natural points based on observed response dynamics in our case studies. While based on casual observation, these cutoffs appear to capture this mechanic amongst respondents, in practice, these cutoff values could be altered to better suit a given situation.
2.4. Application of Argumentation to Stakeholder Perspectives
When there is little disagreement amongst the respondents, even if some of the respondents include unfounded justifications, the removal of their response would have little effect on the outcome of the weighting for the given criteria. Thus, in order to reduce unnecessary work, when there is not a designation of high disagreement for a particular criterion, then no further treatment is carried out. However, when there is a high level of disagreement, the argumentation protocol is carried out. For those criteria where the CV* statistic indicated high disagreement, there are two possibilities. The first is that there is true disagreement within the stakeholder group, and the second is that there are disagreements based on certain respondents’ justifications that are based on incorrect understanding of the criteria or scientifically unfounded information.
In a real-world scenario, the need for application of argumentation is only necessitated when it is difficult to reconcile disagreement amongst the stakeholder group. Thus, the argumentation step should only be carried out either when there is no practical method of reconciling disagreement such as through a round-table discussion (or other such method of resolution) or when a high level of formal traceability is required, e.g., implementation in a numerical decision support system.
Argumentation provides a formal way to inspect justifications, and in particular, justification for preferences. A justification is considered here as a set of arguments that an agent puts forward to describe the reasoning behind his/her ranking of alternatives. These arguments can be seen as a set of “reasoning steps” to reach a conclusion. Agents may agree or contradict one another on one or many of these reasoning steps. By using a formal framework encoding these reasoning steps, namely logic, it is then possible to automatically detect agreements and contradictions between them, and finally, to establish accepted and rejected justifications which will be used to filter and update the initial agents’ preferences. The general principle of our approach is described in Figure 2.
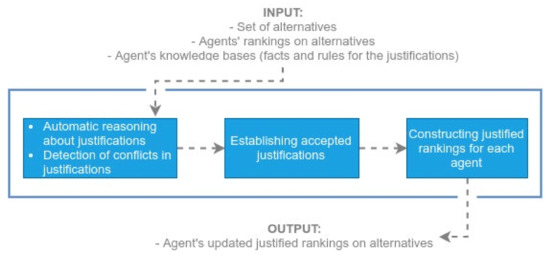
Figure 2.
General principles of the argumentation approach, with three sub-problems: automatic detection of conflicts in the justifications of the agents, establishing accepted justifications by solving these conflicts, and reflecting these accepted justifications by updating the agents’ rankings to produce justified preferences.
Logic is the systematic study of valid inference. Typically, it uses facts to represent knowledge about the world and rules to express deductive links between this knowledge. Applying rules on facts generates reasoning steps in the form of “given a hypothesis we deduce a conclusion”. For instance, suppose there is factual knowledge stating that “freshwater is rare” and “water consumption has a global negative impact on freshwater availability.” Suppose also that the following rule is applied: “anything that has a negative impact on something that is a rare resource should have a high importance.” Based on these suppositions, one can generate the reasoning step that states: “given that ‘fresh water is rare’ and ‘water consumption has a global negative impact on water’, we deduce that water consumption has a high importance”. And, for the sake of following this example in latter parts of this work, we will assume that in this particular example, high importance is defined as having a rank of 5 in the preference ranking.
Representing the justifications in a logical language allows us to identify the links between the different reasoning steps (‘support links’ when the conclusion of a reasoning step is used in the hypothesis of another reasoning step, and ‘attack links’ when the conclusion of a reasoning step contradicts the hypothesis of another reasoning step). These links are represented using Statement Graphs [20] where each node (or statement) represents a reasoning step; the dashed arrows represent support links while normal arrows represent attack links. The statement “→ T (true)” which has an “accepted strictly” status (i.e., cannot be rejected) represents the concept of truth and is used to support factual knowledge. For instance, the “water consumption” example can be represented in the Statement Graph depicted in Figure 3.
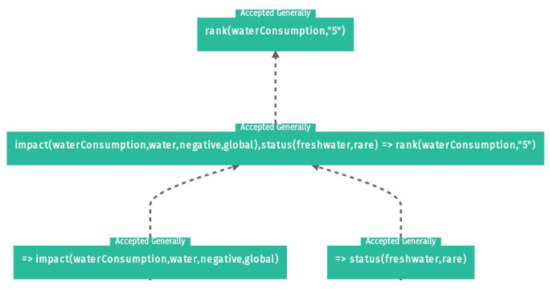
Figure 3.
Graphical representation of the statement graph associated with the Water consumption example. Each node represents a piece of knowledge associated with its truth status (accepted, rejected or ambiguous). In this example, all nodes are accepted.
Accepting or rejecting a reasoning step is achieved using a logical semantics. Classical logic semantics fail in presence of contradictions due to the principle of explosion “from falsehood, anything follows”. Furthermore, if classical logic semantics is applied to contradicting justifications it will yield that all justifications are accepted and reasoning becomes trivial. Thus, we apply conflict-tolerant semantics [21].
Statement Graphs allow one to circumvent this problem by labeling the statements with either Accepted, Rejected or Ambiguous. The intuition behind these labels is as follows:
- A statement is labeled Accepted if all the elements in its hypothesis are supported by accepted statements and none of them is attacked by an accepted statement.
- A statement is labeled Rejected if one of the elements in its hypothesis is not supported by an accepted statement or it is attacked by an accepted and stronger statement.
- A statement is labeled Ambiguous if one of the elements in its hypothesis is supported by an accepted statements and it is attacked by an accepted statement or it is only supported by an ambiguous statement.
For more details about these labels, and the Statement Graphs formalism, please refer to [20]. Figure 4 presents the Statement Graph in which the fact expressed by an agent that water consumption has a negative global impact on water and ‘fresh water is rare’ implies that water consumption has a high importance (rank=5). In Figure 4, the statements are contested by another agent stating that the impact is negative but only has a local impact (green statements are accepted and orange statements are ambiguous). As one of the facts is contested, the reasoning is now ambiguous, which makes the conclusion about the ranking uncertain.
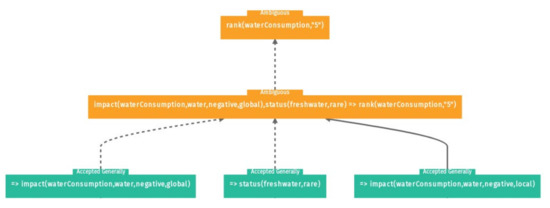
Figure 4.
Graphical representation of the updated statement graph with the contradictory information. The conclusion about the ranking is now ambiguous.
Once the status of justifications has been established, we need to update each agent’s rankings to reflect only “admissible” rankings. In order to do this, we chose to directly modify the rankings of agents by removing the unjustified and ambiguous part of the ranking, hence offering a cautious result by simulating a “no opinion policy” on the criteria that had no valid justification for its position in the ranking. In our previous example, no agent would be allowed to rank water consumption as having “high importance” (rank ≤ 5) based on the fact that it has a global impact on water.
The analysis of the justifications for preferences offers several advantages. First, the analysis offers the ability to base decisions on justified knowledge rather than personal preferences, and this might allow agents to identify hidden biases by pushing them to justify their preferences. Second, justifications can be used as an explanation for the final decision by showing the points of agreements and disagreements between the different agents. Finally, by explicitly representing the justifications, the final decision becomes flexible in regards to new knowledge, as the automatic reasoning will showcase changes in accepted and rejected justifications given new information. In particular, if new information becomes available after a decision has been made, one can automatically check how it would have affected the results of the application of argumentation.
2.5. Calculation of Weighting Profile
After the application of argumentation to the criteria with high disagreement, a resultant stakeholder weighting profile is derived. In a single step decision, this is calculated by taking the average of the argumentation-adjusted weights, which are derived using the ROC method to convert the argumentation-adjusted rankings for each criterion. This is then normalized such that the sum of the weights of all criteria is equal to 1000, resulting in a normalized average stakeholder weighting. However, while this stakeholder-weighting profile indicates the generalized opinions of the stakeholder group after correction through argumentation, it does not account for the importance of a given criterion in relative terms for a given decision-making context. For example, the stakeholder group might give great weight to climate change impacts, but in the context of a particular decision, climate change impacts might not be an important differentiating factor amongst the assessed alternatives. The stakeholder weighting profile also does not take into account the relative amount of variance from best to worst alternative for a given criterion. In order to incorporate the specific decision-making context, a context-weighting multiplier (CWM) is calculated for each criteria. This multiplier is derived for each criteria by dividing the absolute value of the average value of the indicator amongst all alternatives by a normalization factor, e.g., planetary ecological boundaries, person year of equivalent impact, GDP, or earnings before interest, taxes, depreciation, and amortization (EBITDA). This gives an indication of the average relative importance of the criteria for the given set of alternatives relative to the status quo, which is calculated in Equations (3) and (4).
where = the average relative importance factor for alternative a, = the average value of a given criteria n, and = the normalization factor for a given criteria n. In essence, this step is an average of normalized impacts as it is carried out in standard practice in LCA.
Then, in order to indicate the variation amongst the alternatives and thus, indicate the ability to improve a given criterion by choosing amongst the alternatives, a relative variation factor is calculated. This is calculated by subtracting the smallest RIF from the largest RIF for the given set of alternatives.
where = the relative variation factor for criteria n. These two factors, the . and the are then averaged to calculate the CWM. Finally, the argumentation-adjusted weights are multiplied by the CWM and normalized such that the weight of all criteria sum to 1000. For a multi-step decision, the same process is undertaken for each criteria set; however, each criteria-set is scaled to equal the portion of 1000 weighting points equivalent to the importance of that set based on the previously determined inter-set weighting, as described in Section 2.2.
To give a simple example of this, suppose that there are three alternatives a, b, and c that are assessed using three criteria C1 through 3. The RIF, RVF, and the resultant context weighting factor, which is derived from scaling the CWM such that the sum of all CWM equal 1000, are calculated and show in Table 1.

Table 1.
Example scenario with three alternatives assessed using three criteria; RIF, RVF, and context weighting multiplier are calculated.
The application of an averaged RVF and RIF results in an argumentation and relative impact-adjusted stakeholder preference weighting profile. This weighting profile is then used in the application of MCDA and can be easily displayed such that an average stakeholder can understand what relationship is used amongst the decision criteria in order to provide decision support. If further description is desired, then the Stakeholder weighting and the CWM can also be displayed to show the relationship between stakeholder perspectives so that the context of the decision-making can be understood in relation to the final weighting profile.
It is also possible to carry out this step in the absence of a stakeholder perspective. In that case, the CWM is used to derive the weighting profile. Doing so is not preferred, and it, in effect, acts very similarly to existing single score derivation methods; however, it can also be useful as an intermediary step when collection of stakeholder perspectives is not possible.
2.6. Application of MCDA
Using the argumentation and context-weighting adjusted stakeholder preference weighting profile, one can apply MCDA to the problem of selecting a preferred alternative. This could be done using a number of methods; however, here, it is carried out using TOPSIS due to its widespread use and ease of application [19,22,23]. TOPSIS functions by normalizing each decision criteria by creating a theoretical ideal and anti-ideal for a given criteria amongst the assessed alternatives, and then measures a weighted Euclidean distance from the ideal for each alternative thus deriving an overall distance from the theoretical ideal alternative [24]. This allows for good performance in one criterion to compensate for poorer performance in other criteria.
The authors also consider that a compensatory approach to MCDA is preferable for application to interpretation of LCA, and the potential for addition of other common metrics such as economic impacts is also vital. This is because the alternatives assessed in such a method should already have been screened for binary decision criteria either through qualitative means or through quantitative methods such as strategic environmental assessment or other risk assessment. Thus, all assessed alternatives are considered acceptable, though with trade-offs amongst the decision criteria for the various assessed alternatives. Furthermore, there are often other criteria than just the environmental that are taken into account when making a decision. Thus, while one could use other MCDA, the ease of application with criteria including environmental, economic, and others, along with the intuitiveness and ease of interpretation of TOPSIS are make it ideal for application in this context.
3. Application of the ArgCW-LCA Methodology in Practice
In order to illustrate the application of the methodology, two exemplary cases were examined. These cases were chosen, in part, because of the potential regional or national scale impacts that could result from decisions that would be guided from their implementation. The first case compares various energy production methods, based on Ecoinvent [25] database processes. This comparison is done to illustrate the effectiveness of the ArgCW-LCA methodology utilizing well known and established inventories that represent the assessed alternatives and to illustrate a type of large-scale decision making that might benefit from the inclusion of ArgCW-LCA.
In order to illustrate the utility of the ArgCW-LCA methodology in practice, a second test case comparing various polyphenol extraction methods developed as part of the NoAW project was conducted. The results of the latter analysis were used for internal discussions of the NoAW project. Both cases were analyzed using the ReCiPe 2016 impact assessment method [26], utilizing all 18 midpoint environmental impact indicators. In addition to the environmental impacts indicators; both cases were also assessed based on production cost.
Two groups of decision makers from European Union Horizon 2020 projects, NoAW and Agrocycle, each with environmentally driven decision-support demands, were queried as test groups for this methodology implementation. While they do not represent any particular authority and their perspectives should not be construed as something to be applied in other situations, these groups were chosen because they represent two typologies of decision makers that might utilize the ArgCW-LCA methodology. The group from Agrocycle was comprised of industry representatives, thus closely mirroring a group make-up that might be expected in a corporate decision-making context (e.g., an executive board) where knowledge of environmental science was largely limited. The group from NoAW, however, was comprised primarily of scientists mirroring an expert panel such as might be utilized by a government task force. A third typology of stakeholder groups, that which might be found in participatory design, was not mirrored in this study. However, the authors consider that the implementation in this third group typology would, to a great extent, mirror the implementation in the Agrocycle group.
3.1. Energy Systems Case Description
For the energy systems test case, ten electricity production methods were assessed: heat and power co-generation from biogas, heat and power co-generation from wood chips, hard coal, deep geothermal, hydroelectric with an alpine reservoir, combined cycle natural gas, nuclear with a boiling water reactor, oil, slanted roof installation solar, and onshore wind with a 3 MW turbine. All LCIs were modelled using Ecoinvent 3.4 [25], assuming production in the US portion of the Western Electricity Coordinating Council. The impacts associated with these alternatives are shown in Table S5 of the Supplementary Information.
The energy system case is intended to exemplify the kind of alternatives that might be discussed at a governmental level when discussing future energy policy or potential subsidies.
3.2. Polyphenol Extraction Case Description
For the polyphenol extraction case, four extraction types were assessed (Table 2). These were assessed for potential scale-up from lab to pilot scale as part of the NoAW project and are described in more detail by Vega et. al. [27]. These extraction types include both pressurized liquid extraction (PLE) with a solvent to feedstock ratio of 10 and 25, as well as an acetone solvent extraction (Acn) with a solvent to feedstock ratio of 5 and 10. The impacts associated with these alternatives are shown in Table S6 of the SI.
Table 2.
Polyphenol case alternative descriptions.
The polyphenol extraction case is intended to exemplify a real-world application of the ArgCW-LCA methodology. In this case, the decision support derived from the application of the ArgCW-LCA methodology was utilized in the internal discourse of the NoAW project and its decisions regarding technologies chosen for scale-up within the project.
3.3. Collection of Stakeholder Perspectives for the Test Cases
For the purposes of collecting stakeholder perspectives for the example cases, a questionnaire was distributed to the stakeholders. This questionnaire is comprised of a ranking of the criteria for decision making (in this case from 1-18 for the 18 midpoint criteria that were assessed, with the ability to rank multiple criteria equally) and a written justification for each ranking. The exact format of the questionnaire is included in Table S1 of the SI. This step could also be achieved through workshops or structured interviews but in the context of this work, a questionnaire was considered the most expedient means of gathering stakeholder perspectives.
The collection of stakeholder perspectives was carried out for two test groups, both of which are from Horizon 2020 projects. The first was carried out in Beijing, China, at the annual Agrocycle stakeholder meeting on the 23rd October 2018 and the second in Hsinchu, Taiwan at the NoAW annual meeting on the 26th of October 2018. This first was collected from a group of stakeholders representing corporations interested in the work of the Agrocycle project (n = 10), and the second was comprised of responses from the project partners of the NoAW project (n = 21).
3.4. Transformation to Stakeholder Weighting Profile for the Test Cases
In order to transform the rankings gathered from the stakeholder groups, we applied a dual-step transformation; however, the weighting between the two criteria sets (environmental and economic) was tested at multiple levels instead of a single fixed relationship in order to indicate a spectrum of perspectives relating environmental and economic performance. Thus, ROC was only applied to the ranking of environmental impacts as economic performance has only one indicator.
3.5. Application of Argumentation to Stakeholder Perspectives for the Test Cases
In the application of the ArgCW-LCA methodology in these cases, in order to illustrate various situationally appropriate applications of ArgCW-LCA, the NoAW group and the Agrocycle group were treated differently with regards to the application argumentation. The NoAW group represents disparate experts that would be unlikely to discuss their perspectives amongst each other, partly due to the larger number of stakeholders and also in part due to the lack of time allocated to such endeavors for this type of stakeholder group. Conversely, the Agrocycle group is intended to represent executives in a corporate environment, where roundtable discussion replaces the function of the application of argumentation. Thus, these groups represent two of the standard archetypes of stakeholder groups that would be queried in the application of the ArgCW-LCA methodology.
3.6. Conversion to Weightings for the Test Cases
In order to derive the RIF for the test cases, the relationship to average annual emissions for a European person [28] is utilized as the normalization set for environmental impacts. While there is a great need to move toward introducing absolute metrics into this type of discourse [29], the European average consumption normalization was chosen because other normalization sets, such as those relating to absolute sustainability [30] do not yet cover all midpoint impacts. In regard to the economic criteria set, because only production cost is used, no normalization is needed as there is no need to relate multiple economic criteria.
4. Results
4.1. Stakeholder Perspectives and Transformation to Weights
The rankings made by the individual respondents were converted using ROC to weightings. Supplementary Information Table S2 and Table S3 show the individual stakeholder weightings for the 18 environmental criteria in the ReCiPe2016 life cycle impact assessment method [26] derived from ranking-argument pairs for all criteria from all stakeholder respondents in Agrocycle (n = 10) and NoAW (n = 21). Figure 5 shows the weightings derived from these pairings. In this format, it is difficult to derive a consensus from amongst the respondents, however, it is possible to understand the responses regarding the various criteria from an individual agent and thus, see if there are any respondents that lie completely out of the norm of the group. This was not seen in the NoAW nor the Agrocycle groups.
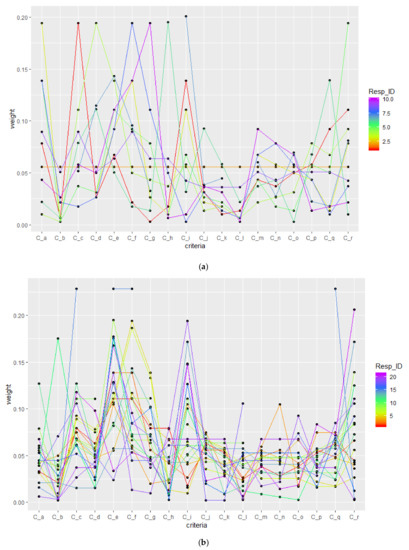
Figure 5.
Decision-maker weighting profiles from (a) agrocycle and (b) NoAW.
Note that in all following examples, criteria C_a to C_r were used to represent the 18 criteria used, which are the 18 indicators in the ReCiPe2016 Life cycle impact assessment method and are defined in Table 3.
Table 3.
Environmental impact assessment indicators from the ReCiPe2016 Life cycle impact assessment method as used to define the 18 environmental criteria used in the following case studies.
4.2. Assessment of Stakeholder Accord
In order to visualize the stakeholder accord, the stakeholder weightings were plotted as boxplots (Figure 6). A visual inspection of the boxplots confirms that there is likely a large range of CV*, thus the CV* criteria was applied to both respondent sets. There are also some notable differences between the respondent groups. For example, when looking at global warming (C_e), there is only a moderate level discord amongst the Agrocycle stakeholders, while there is great discord amongst the NoAW stakeholders. Conversely, land use (C_i) and water consumption (C_r) exhibit high levels of discord for both NoAW and Agrocycle stakeholders. These types of differences can be expected amongst respondent groups depending on each group’s particularities, which highlights the need for application of argumentation in order to effectively relate to the preferences of a particular respondent group.
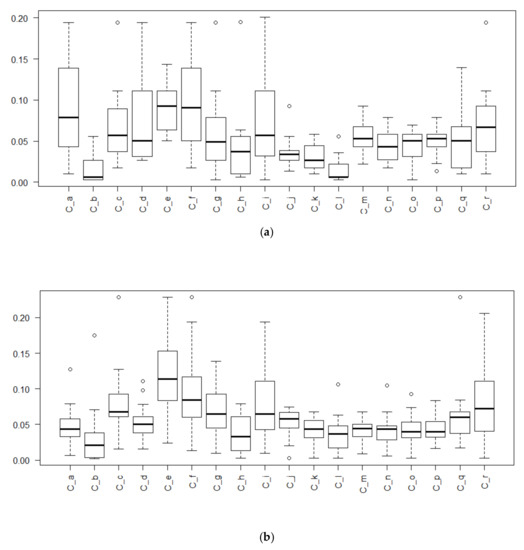
Figure 6.
Boxplot of (a) Agrocycle and (b) NoAW respondent weightings for C_a…C_r showing median, 75th and 25th percentile as well as max. and min. up to 1.5 times the interquartile range.
In applying the CV* criteria for both respondent groups (Figure 7), the assessment indicated nine criteria above the upper cut-off for disagreement for Agrocycle and six criteria above the upper cut-off for disagreement for NoAW. Here, we see disagreement above the upper cut-off for Agrocycle in fine particulate matter formation (C_a), freshwater ecotoxicity (C_c), freshwater eutrophication (C_d), human carcinogenic toxicity (C_f), human non-carcinogenic toxicity (C_g), ionizing radiation (C_h), land use (C_i), terrestrial ecotoxicity (C_q), and water use (C_r). And for NoAW, there is disagreement above the upper cutoff for freshwater ecotoxicity(C_c), Global warming (C_e), Human carcinogenic toxicity (C_f), land use (C_i), terrestrial ecotoxicity (C_q), and water use (C_r).
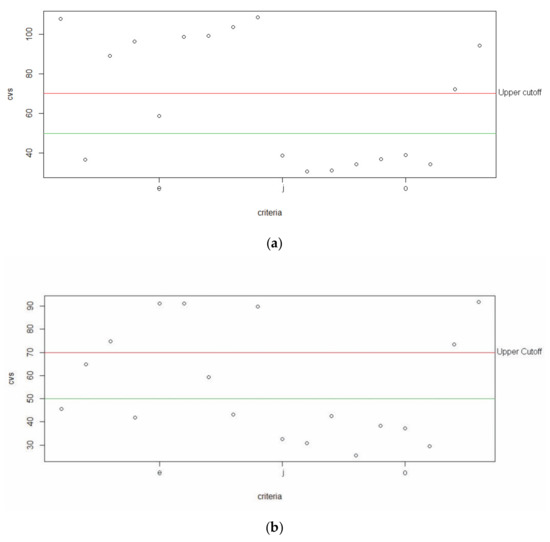
Figure 7.
(a) Agrocycle, and (b) NoAW CV* of weights by criteria, red line is the CV* = 70 upper cutoff and green line is the CV* = 50 lower cutoff.
4.3. Application of Argumentation
Despite the appearance of more disagreement in the Agrocycle stakeholder group, it is assumed that this is justified disagreement, as might be found in a corporate decision-making setting after, e.g., round-table discussion. Thus, argumentation is applied only to the NoAW stakeholder group. The application of argumentation led to the removal of a number of responses, following the cautionary approach, as outlined in Section 2.4. These are shown in Table 4. For instance, in Section 2.4, we have seen that no agent would be allowed to rank water consumption as having “high importance” (rank ≤ 5) based on the fact that it has a global impact on water. This stems from the other agent’s unrefuted claim that water consumption only has a local impact. Hence, any agent using the global impact justification to rank water consumption as highly important (rank ≤ 5, in this case: agent 1) has had their ranking modified. Regarding global warming, two of the most depreciative rankings were not supported by any justification (agents 9 and 14); following our approach, these ranks have been removed, which explains the large modification in the weighting for these particular agents, and thus, this criterion. Overall, this led to some relatively minor change in the stakeholder weighting profile, which is shown for the NoAW stakeholder group (Table 5). While in the case shown, there was not major alteration in the weighting profile, it is theoretically possible that there could be large changes, which represents the value of checking that this is not the case. Notably, some criteria experienced larger alterations in weighting than others, e.g., global warming.
Table 4.
Argumentation adjustment of rankings for criteria with high disagreement with and without argumentation applied. Agents 1-21 represent the individuals in the NoAW stakeholder group.
Table 5.
Stakeholder weighting profile without consideration for decision context with and without argumentation for the NoAW stakeholder group.
4.4. Calculation of Weighting Profile
The weighting profile was then calculated (Table 6 and Table S4 of the SI). The weighting profile derived using the ArgCW-LCA methodology was also compared to a case utilizing equal weights for all environmental impacts. It is shown that in some cases, the application of the ArgCW-LCA methodology results in the effective removal of some criteria and an increase in importance by as much as a factor 6 relative to equal weighting for others. There is also a clear impact of including the CWM relative to using only the normalized average stakeholder weighting. For example, in both stakeholder groups, fossil resource scarcity is not given great weight, but in all four cases, the CWM causes the final weighting to be greater than would be given by equal weights.
Table 6.
Calculation of weighting profile for environmental impacts, including comparison relating ArgCW-LCA weighting to equal weights given to environmental impacts for NoAW—Electricity production case. ‘Comparison to equal weights’ shown in percent equal to the ratio of the weights from ArgCW-LCA and equal weighting.
4.5. Application of MCDA
In order to understand the utility of the ArgCW-LCA method, TOPSIS was applied to both the electricity generation case and the polyphenol extraction case using weighting derived from the ArgCW-LCA methodology and equal weights for all environmental impacts. These analyses were completed using the weighting profiles described in Section 4.4. Calculation of weighting profile. The results of these analyses are shown in Figure 8 utilizing the ArgCW-LCA methodology and Figure 9 utilizing equal weights.
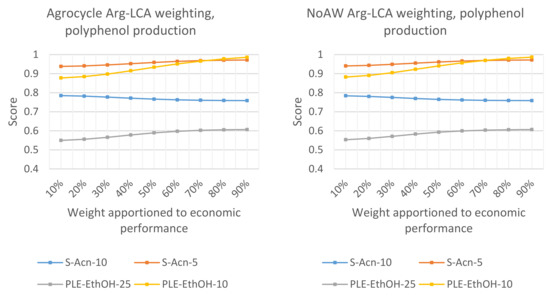
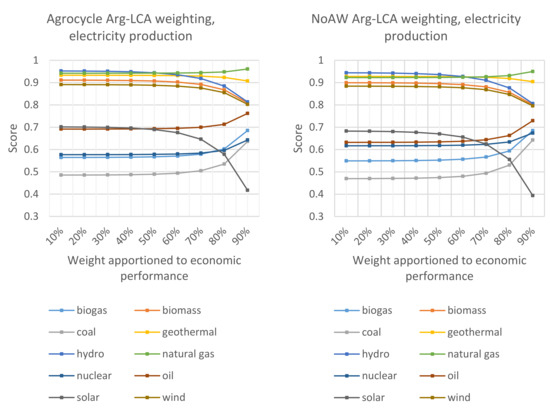
Figure 8.
Comparative decision support using the ArgCW-LCA methodology for polyphenol extraction and electricity production for the Agrocycle and NoAW stakeholder groups with a range of weight from 10% to 90% given to economic performance. A value of 1 is the most preferred, and a value of 0 is the least preferred alternative.
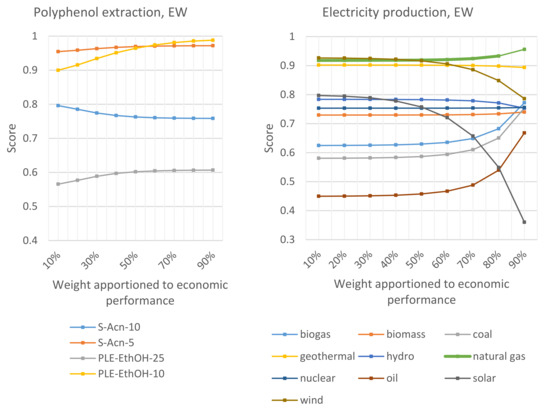
Figure 9.
Decision support using equal weights for electricity production and polyphenol extraction with a range of weight from 10% to 90% given to economic performance. A value of 1 is the most preferred and 0 is the least preferred alternative.
5. Discussion
5.1. Applicability, Utility, and Benefits of the ArgCW-LCA Methodology
One major benefit of the ArgCW-LCA methodology is its ability to increase the transparency of decision support. In a single string of numbers, one can clearly describe the prioritization of impacts, be they environmental, economic, etc. This is one step towards demystifying LCA for decision makers who might not be specialists in the field of environmental assessment. It also provides a straightforward method for indicating the derivation of the weighting and testing the sensitivity to weighting, as the calculation of results using varying weightings is easily carried out.
For application in the private sector, the method allows for easy incorporation of corporate strategic planning into the environmental assessment of various investment alternatives. Such utility could be of great use in reporting to stakeholders as well as the justification of decisions when fiduciary responsibility and transparent reporting is a driving factor, such as in publicly traded corporations where there is a desire for ideas such as enlightened shareholder primacy [31]. Furthermore, in the public sector, the transparency of the method allows for easy display that constituent values are being applied.
In any case, the method promotes transparent decision support, which is fundamental for the application of life cycle assessment in the context of decision making.
5.2. Analysis of Decision Support
Based on the decision support shown in Section 4.5. Application of MCDA, differences in decision support can be seen both between stakeholder groups, and in particular, between decision support provided through the application of the ArgCW-LCA methodology weighting and equal weights. While expected, due to the differences in applied weighting, it highlights the importance of the weighting used in providing decision support. In particular, differences can be seen between the ranking of biomass electricity production between the equal weighting and ArgCW-LCA weighting. This is primarily due to the relative exaggeration, given the actual impacts exhibited in the alternatives, of importance given to land use, stratospheric ozone depletion, and ozone formation when using equal weights relative to ArgCW-LCA weighting. A similar effect can be seen in the point of inflection between S-Acn-5 and PLE-EthOH-25 in terms of environmental and economic weighting for the polyphenol extraction case. Furthermore, differences can be seen in decision support between the two stakeholder groups. For example, at less than 50% weight given to economics, there is little difference between the use of solar and oil energy production when applying the weighting from Agrocycle, while there is a clear preference for solar when applying the NoAW weighting.
One other element of note is what part of the ArgCW-LCA is driving the development of the decision support. In order to illustrate this, a comparison is made between the weighting string from uncorrected NoAW rankings and the weighting strings with only argumentation applied and with both argumentation and the CWM applied (Table 7). This comparison shows the much greater impact that decision context has (max. 269%) in the application of the ArgCW-LCA methodology than the application of argumentation (max. 10%). This should be expected, as the application of argumentation was carried out using the ‘no opinion policy’, meaning that removed rankings are equal to the average of the remainder rankings. Thus, unless the number of removed rankings becomes great and particularly centered on either higher or lower rankings, the overall effect should be limited.
Table 7.
Change in weighting string based on application of argumentation and CWM to NoAW stakeholder weightings.
5.3. Future Developments
One area of future development of the ArgCW-LCA methodology is in methods to bring a larger stakeholder group into the decision-making process. As it is currently formulated, this methodology is aimed at allowing decision makers to directly tailor the metrics used for providing decision support. However, as novel technologies are developed, such as e-survey and digital democracy in the form of, e.g., massive open online deliberation platforms [32], along with greater implementation of machine learning to process larger sample sizes, the potential to integrate the views of affected populations could become much more achievable. This would represent a valuable step toward public participatory design. In addition, other steps to improve the original LCA could be very helpful in regard to the improvement of the relevance of the application of ArgCW-LCA in a participatory design setting, such as further development of regional and temporal specificity such as what is being implemented in Brightway 2 [33,34].
Another major area of future development of this methodology is its reliance on a normalization factor in relation to the environmental impacts. Ideally, this would incorporate ideas of absolute sustainability [30]. An analysis incorporating absolute indicators has been carried out in a few instances in a limited way (e.g. [35,36]). However, this is not yet developed to a point where it can be utilized with the same impact coverage as found in the ReCiPe impact assessment method, nor most other available life cycle impact assessment methods. This is, in part, driven by the issue that there are not planetary boundaries defined for all of the environmental issues covered in methodologies such as ReCiPe. Thus, an average-consumption normalization factor was utilized. This poses two primary issues. First, normalization factors are somewhat uncertain, and second, they cannot be construed to indicate anything about the idea of absolute sustainability in the context of decision making. However, lacking a better alternative, status quo consumption-based normalization does offer utility in terms of framing a decision relative to present global importance insomuch as it indicates the ability of a decision to affect the status quo. However, if better definitions of planetary boundaries, in regards to all environmental impacts, are developed, then application of absolute environmental sustainability indicators [29] can become realizable, and in turn, simplify the calculation of the CWM.
6. Conclusions
There is need for more advanced interpretation of LCA for use in corporate governance and regional or larger-scale decision making. The ArgCW-LCA methodology provides a relatively simple method for integrating stakeholder preference and relative impact for deriving a weighting for use in applying MCDA. This allows for some of the benefits associated with traditional single-score derivation methods in LCA while allowing for tailoring to the specific demands of a decision-making body, thus making it more usable in a real-world decision-making context. Furthermore, the transparency inherent in the method allows for reporting that is crucial in the context of a publicly traded corporation or government-based regulatory context. In addition, its application supports the operationalization of ideas such as enlightened shareholder primacy. However, current limitations in the development of life cycle interpretation, such as lacking well established planetary boundaries, makes it difficult to directly incorporate ideas of true sustainability in the application of ArgCW-LCA. Instead, status quo relevance is suggested as the best currently available alternative.
When the ArgCW-LCA method is applied to two test cases, it is shown that it is possible for different decision support to be derived from the application of the ArgCW-LCA methodology when compared to the use of equal weights for environmental criteria as well as different decision support to be derived for different decision-making groups. This indicates that there is value in terms of differentiation to potential decision support gained through the application of the ArgCW-LCA methodology.
Supplementary Materials
The following are available online at https://www.mdpi.com/2071-1050/12/6/2170/s1, Table S1: title, Stakeholder preference questionnaire, Table S1: title, Decision maker weighting profiles from Agrocycle, Table S3: Decision maker weighting profiles from NoAW, Table S4: title, calculation of weighting profile for environmental impacts including comparison relating Arg-LCA weighting to equal weights given to environmental impacts a.) Agrocycle—polyphenol extraction case, b.) Agrocycle—Electricity production case, c.) NoAW—polyphenol extraction case, Table S5: title, Electricity production impacts, shown for 1 MWh of production, Table S6: title, Polyphenol extraction impacts.
Author Contributions
Conceptualization, Joshua Sohn.; methodology, J.S. and P.B.; software, J.S., P.B., and A.H.; validation, J.S., P.B., P.B., P.P.K., B.G., M.B., and S.I.O.; formal analysis, J.S. and P.B.; investigation, J.S.; resources, P.B., P.B., and S.I.O.; data curation, J.S. and P.B.; writing—original draft preparation, J.S. and P.B.; writing—review and editing, J.S., P.B., P.B., A.H., P.P.K., B.G., M.B., and S.I.O.; visualization, J.S. and P.B.; supervision, P.B., P.P.K., B.G., M.B., and S.I.O.; project administration, J.S.; funding acquisition, P.B., M.B., and S.I.O. All authors have read and agreed to the published version of the manuscript.
Funding
This project has received funding from the European Union’s Horizon 2020 research and innovation program under grant agreement No. 688338.
Conflicts of Interest
The authors declare no conflict of interest.
References
- Cordella, M.; Kaps, R. Designing Sustainable Technologies, Products and Policies: From Science to Innovation; Springer Nature: Cham, Switzerland, 2018; ISBN 9783319669809. [Google Scholar]
- Thabrew, L.; Wiek, A.; Ries, R. Environmental decision making in multi-stakeholder contexts: applicability of life cycle thinking in development planning and implementation. J. Clean. Prod. 2009, 17, 67–76. [Google Scholar] [CrossRef]
- Reap, J.; Roman, F.; Duncan, S.; Bras, B. A survey of unresolved problems in life cycle assessment. Part 2: Impact assessment and interpretation. Int. J. Life Cycle Assess. 2008, 13, 374–388. [Google Scholar] [CrossRef]
- Kalbar, P.P.; Birkved, M.; Nygaard, S.E.; Hauschild, M. Weighting and Aggregation in Life Cycle Assessment: Do Present Aggregated Single Scores Provide Correct Decision Support? J. Ind. Ecol. 2016, 21, 1591–1600. [Google Scholar] [CrossRef]
- Pizzol, M.; Laurent, A.; Sala, S.; Weidema, B.; Verones, F.; Koffler, C. Normalisation and weighting in life cycle assessment: quo vadis? Int. J. Life Cycle Assess. 2017, 22, 853–866. [Google Scholar] [CrossRef]
- Pizzol, M.; Weidema, B.; Brandão, M.; Osset, P. Monetary valuation in Life Cycle Assessment: A review. J. Clean. Prod. 2015, 86, 170–179. [Google Scholar] [CrossRef]
- Laurent, A.; Olsen, S.I.; Hauschild, M.Z. Limitations of carbon footprint as indicator of environmental sustainability. Environ. Sci. Technol. 2012, 46, 4100–4108. [Google Scholar] [CrossRef]
- Schellnhuber, H.J.; Rahmstorf, S.; Winkelmann, R. Why the right climate target was agreed in Paris. Nat. Clim. Chang. 2016, 6, 649–653. [Google Scholar] [CrossRef]
- Kalbar, P.P.; Das, D. Advancing Life Cycle Sustainability Assessment Using Multiple Criteria; Elsevier Inc.: Amsterdam, The Netherlands, 2020; ISBN 9780128183557. [Google Scholar]
- Stenfors, S.; Tanner, L.; Syrjänen, M.; Seppälä, T.; Haapalinna, I. Executive views concerning decision support tools. Eur. J. Oper. Res. 2007, 181, 929–938. [Google Scholar] [CrossRef]
- Charnley, S.; Engelbert, B. Evaluating public participation in environmental decision-making: EPA’s superfund community involvement program. J. Environ. Manag. 2005, 77, 165–182. [Google Scholar] [CrossRef]
- Jankowski, P. Towards participatory geographic information systems for community-based environmental decision making. J. Environ. Manag. 2009, 90, 1966–1971. [Google Scholar] [CrossRef] [PubMed]
- Beierle, T.C.; Cayford, J. Democracy in Practice: Public Participation in Environmental Decisions, 1st ed.; Routledge: New York, NY, USA, 2002; ISBN 1891853546. [Google Scholar]
- European Commission—Joint Research Centre—Institute for Environment and Sustainability. International Reference Life Cycle Data System (ILCD) Handbook—General guide for Life Cycle Assessment—Detailed guidance; Publications Office of the European Union: Luxembourg, Luxembourg, 2010; ISBN 978-92-79-19092-6. [Google Scholar]
- Hauschild, M.Z.; Goedkoop, M.; Guinée, J.; Heijungs, R.; Huijbregts, M.; Jolliet, O.; Margni, M.; De Schryver, A.; Humbert, S.; Laurent, A.; et al. Identifying best existing practice for characterization modeling in life cycle impact assessment. Int. J. Life Cycle Assess. 2013, 18, 683–697. [Google Scholar] [CrossRef]
- Srivastava, J.; Connolly, T.; Beach, L.R. Do ranks suffice? A comparison of alternative weighting approaches in value elicitation. Organ. Behav. Hum. Decis. Process. 1995, 63, 112–116. [Google Scholar] [CrossRef]
- Barron, F.H.; Barrett, B.E. Decision Quality Using Ranked Attribute Weights. Manage. Sci. 1996, 42, 1515–1523. [Google Scholar] [CrossRef]
- Sureeyatanapas, P. Comparison of rank-based weighting methods for multi-criteria decision making. Kku Eng. J. 2016, 43, 376–379. [Google Scholar]
- Palomares Carrascosa, I. Large Group Decision Making: Creating Decision Support Approaches at Scale; Springer International Publishing: Cham, Switzerland, 2018; ISBN 9783030010263. [Google Scholar]
- Hecham, A.; Bisquert, P.; Croitoru, M. On a flexible representation for defeasible reasoning variants. Proc. Int. Jt. Conf. Auton. Agents Multiagent Syst. AAMAS 2018, 2, 1123–1131. [Google Scholar]
- Arieli, O. Conflict-free and conflict-tolerant semantics for constrained argumentation frameworks. J. Appl. Log. 2015, 13, 582–604. [Google Scholar] [CrossRef]
- Kalbar, P.P.; Karmakar, S.; Asolekar, S.R. Selection of an appropriate wastewater treatment technology: A scenario-based multiple-attribute decision-making approach. J. Environ. Manag. 2012, 113, 158–169. [Google Scholar] [CrossRef]
- Kalbar, P.P.; Karmakar, S.; Asolekar, S.R. Technology assessment for wastewater treatment using multiple-attribute decision-making. Technol. Soc. 2012, 34, 295–302. [Google Scholar] [CrossRef]
- Hwang, C.-L.; Yoon, K. Multiple Attribute Decision Making: Methods and Applications A State-of-the-Art Survey; Springer: Berlin/Heidelberg, Germany, 1981; ISBN 978-3-540-10558-9. [Google Scholar]
- Wernet, G.; Bauer, C.; Steubing, B.; Reinhard, J.; Moreno-ruiz, E.; Weidema, B. The ecoinvent database version 3 (part I): overview and methodology. Int. J. Life Cycle Assess. 2016, 3, 1218–1230. [Google Scholar] [CrossRef]
- Huijbregts, M.A.J.; Steinmann, Z.J.N.; Elshout, P.M.F.M.; Stam, G.; Verones, F.; Vieira, M.D.M.; Zijp, M.; van Zelm, R. ReCiPe 2016: A harmonized life cycle impact assessment method at midpoint and enpoint level—Report 1: Characterization. Natl. Inst. Public Health Environ. 2016, 194. [Google Scholar]
- Vega, G.C.; Voogt, J.; Nilsson, A.E.; Sohn, J.; Birkved, M.; Olsen, S.I. Lessons from combining techno-economic and life cycle assessment—A case study of polyphenol extraction from waste resources. In Proceedings of the Heraklion 2019 proceedings of Wednesday, Heraklion, Greece, 26 June 2019. [Google Scholar]
- PRé. Various Authors SimaPro Database Manual Methods Library; PRé: Amersfoort, The Netherlands, 2019. Available online: https://simapro.com/wp-content/uploads/2019/02/DatabaseManualMethods.pdf (accessed on 11 March 2020).
- Bjørn, A.; Diamond, M.; Owsianiak, M.; Verzat, B.; Hauschild, M.Z. Strengthening the Link between Life Cycle Assessment and Indicators for Absolute Sustainability To Support Development within Planetary Boundaries. Environ. Sci. Technol. 2015, 49, 6370–6371. [Google Scholar] [CrossRef] [PubMed]
- Bjørn, A.; Hauschild, M.Z. Introducing carrying capacity-based normalisation in LCA: framework and development of references at midpoint level. Int. J. Life Cycle Assess. 2015, 20, 1005–1018. [Google Scholar] [CrossRef]
- Rahim, M. The Rise of Enlightened Shareholder Primacy and Its Impact on the US Corporate Self-Regulation. Int. Co. Commer. Law Rev. 2014, 12, 409–417. [Google Scholar]
- Helbing, D. Towards Digital Enlightenment; Springer International Publishing: Cham, Switzerland, 2019; ISBN 9783319908687. [Google Scholar]
- Patouillard, L.; Collet, P.; Lesage, P.; Tirado Seco, P.; Bulle, C.; Margni, M. Prioritizing regionalization efforts in life cycle assessment through global sensitivity analysis: a sector meta-analysis based on ecoinvent v3. Int. J. Life Cycle Assess. 2019, 24, 2238–2254. [Google Scholar] [CrossRef]
- Cardellini, G.; Mutel, C. Temporalis: an open source software for dynamic LCA. J. Open Source Softw. 2018, 3, 612. [Google Scholar] [CrossRef]
- Ryberg, M.W.; Owsianiak, M.; Richardson, K.; Hauschild, M.Z. Development of a life-cycle impact assessment methodology linked to the Planetary Boundaries framework. Ecol. Indic. 2018, 88, 250–262. [Google Scholar] [CrossRef]
- Brejnrod, K.N.; Kalbar, P.; Petersen, S.; Birkved, M. The absolute environmental performance of buildings. Build. Environ. 2017, 119, 87–98. [Google Scholar] [CrossRef]
© 2020 by the authors. Licensee MDPI, Basel, Switzerland. This article is an open access article distributed under the terms and conditions of the Creative Commons Attribution (CC BY) license (http://creativecommons.org/licenses/by/4.0/).