1. Introduction
Cultivated land resources are crucial land resources and the basis of China’s food security. However, with the continuous acceleration of urbanization and adjustment of the industrial structure layout, China’s cultivated land area has been decreasing annually over the past 20 years [
1], which introduces certain challenges to food security. Therefore, to protect the quantity of cultivated land, after many years of development and improvement, a more perfect system including relevant laws, systems, and executive means has been formed basically for the protection of cultivated land in China [
2]. This system has slowed the decline in cultivated land area in the past 10 years, but its guiding role in the management and protection of the quality and ecology of cultivated land needs to be strengthened [
3]. Currently, China’s high-quality cultivated land accounts for only 27.3% of the total cultivated land area, so it is also urgent to protect and improve the quality of cultivated land to achieve the coordinated and sustainable development of the economy and society. At the same time, China’s grain yield showed continuous growth for 12 years from 2003 to 2015, but this result stemmed from not only the expansion of grain planting areas and scientific and technological progress but also the use of large amounts of fertilizers and pesticides, which has led to a series of ecological and environmental problems, such as water pollution, soil pollution, and air pollution [
4]. In January 2017, the Central Committee of the Communist Party of China and the State Council of the People’s Republic of China issued the Opinions on Strengthening the Protection of Cultivated Land and Improving Cultivated Land Requisition-Compensation Balance, which clearly required that the strictest cultivated land protection system be adhered to; the trinity protection of the quantity, quality, and ecology of cultivated land be strengthened; and the red line of cultivated land be firmly guarded to promote the formation of a new pattern of cultivated land protection with more powerful protection, smoother implementation, and more efficient management. Furthermore, the zonal utilization and protection of cultivated land is a key component of land-use management and an important basis for the compilation of territorial spatial planning and differentiated implementation of cultivated land policies in China [
5]. Therefore, in the context of an ecological civilization development strategy, the spatial zoning of cultivated land has important practical significance in terms of relieving the pressure of cultivated land protection, improving the efficiency of cultivated land utilization, and considering the multiple functions of cultivated land, thereby improving the value of cultivated land.
Differences in the location and quality of cultivated land will lead to different levels of food production from cultivated land in different regions [
6]. Therefore, dividing cultivated land space into several different zones and formulating differentiated cultivated land management policies can guide the sustainable development of cultivated land space and provide a reference for the comprehensive zoning of land in territorial spatial planning [
7]. The fundamental process of the spatial zoning of cultivated land divides a certain region based on differences and similarities in its cultivated land utilization with specific objectives in mind [
8].
In recent years, related research on the spatial zoning of cultivated land has mainly focused on the economic compensation zoning of cultivated land protection [
9,
10,
11], zoning of cultivated land based on intensive utilization [
12,
13], zoning of cultivated land-use types [
14,
15], protection zoning of cultivated land [
16,
17,
18,
19,
20,
21], utilization zoning of reserve resources for cultivated land [
22], zoning of the multifunctionality of cultivated land use [
23,
24], construction occupancy zoning of cultivated land [
25], and zoning of cultivated land quality improvement [
26,
27,
28,
29]. Moreover, some scholars have studied the zoning of cultivated land use based on the quality [
30], integrated productive capacity [
31], and productivity [
32,
33] of the land. Most of these studies focused on the spatial zoning of cultivated land using a single factor, such as quantity, quality, intensive utilization, comprehensive production capacity, or productivity. Additionally, some scholars have tried to consider multiple factors for the spatial zoning of cultivated land, such as quality, output and efficiency [
8], or grain, urbanization, and ecology [
34]. Nevertheless, most of the above studies aimed to increase the quantity, improve the quality, promote the productivity of cultivated land, and ensure construction land development; however, these studies did not fully consider the relationships between the regional ecological environment and the utilization and protection of cultivated land.
The trinity protection of the quantity, quality, and ecology of cultivated land is a hierarchical and systematic concept whose general goal is to comprehensively maintain and improve the production, ecology, and life functions of farmland ecosystems [
35]. Currently, there are few studies on the spatial zoning of cultivated land based on the trinity of quantity, quality, and ecology (TQQE). Some scholars have carried out relevant research mainly on the basis of practical experience [
36], connotation and protection approaches [
35], and regulatory systems [
37,
38] of the TQQE of cultivated land. Therefore, it is necessary to evaluate the comprehensive status of cultivated land and conduct scientific and reasonable spatial zoning of regional cultivated land on the basis of developing an understanding of the profound connotation of the TQQE of cultivated land.
This paper selects Shandong Province as the research area and focuses on cultivated land characteristics, such as integration and systematization. Based on the overall consideration of the quantity, quality, and ecological status of cultivated land, this paper builds a theoretical framework and indicator system for the spatial zoning of cultivated land and conducts spatial zoning of cultivated land to propose corresponding utilization strategies and protection measures for different zones, providing a practical and theoretical basis for policy making related to the differentiated management of cultivated land in Shandong Province and other regions in the new era of ecological civilization.
2. Materials and Methods
2.1. Study Area
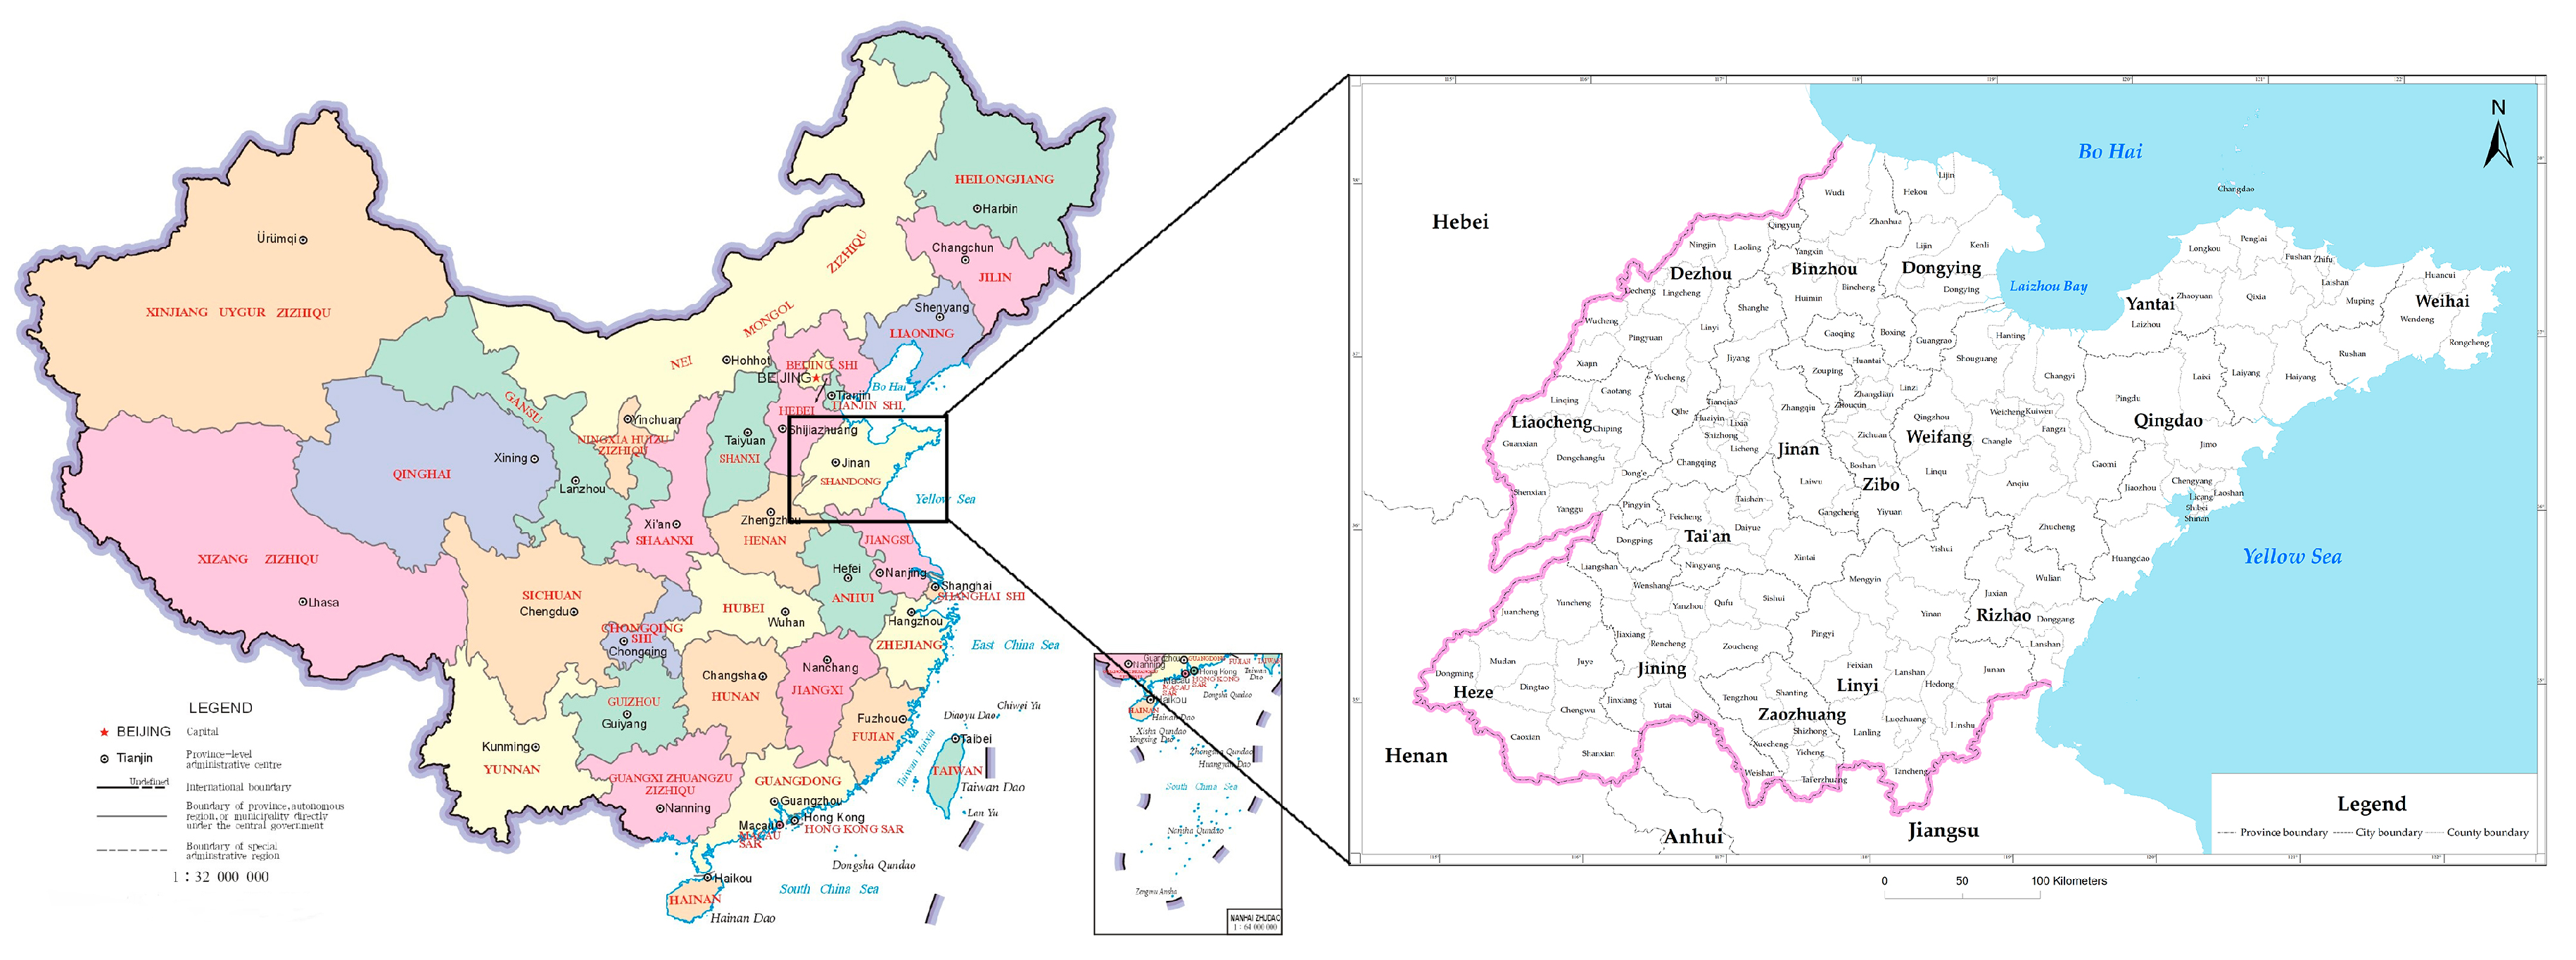
Shandong Province is located on the eastern coast of China, within 34°22.9′-38°24.0′ N and 114°47.5′-122°42.3′ E. It belongs to the warm temperate zone and has a monsoon climate, which is characterized by the synchronization of high temperatures and ample precipitation. The central area is mountainous, the southwestern and northwestern areas are low lying and flat, and the eastern area consists of gentle rolling hills. The total area of Shandong Province is 157,965 km
2, and the province includes 16 cities and 137 county-level administrative units (
Figure 1). Shandong Province is a large agricultural province in China, ranking among the top provinces in this country in terms of the proportion of cultivated land area and agricultural output value. In 2017, the cultivated land area reached 48.05% of the total land area, and the agricultural added value reached 275.57 billion yuan.
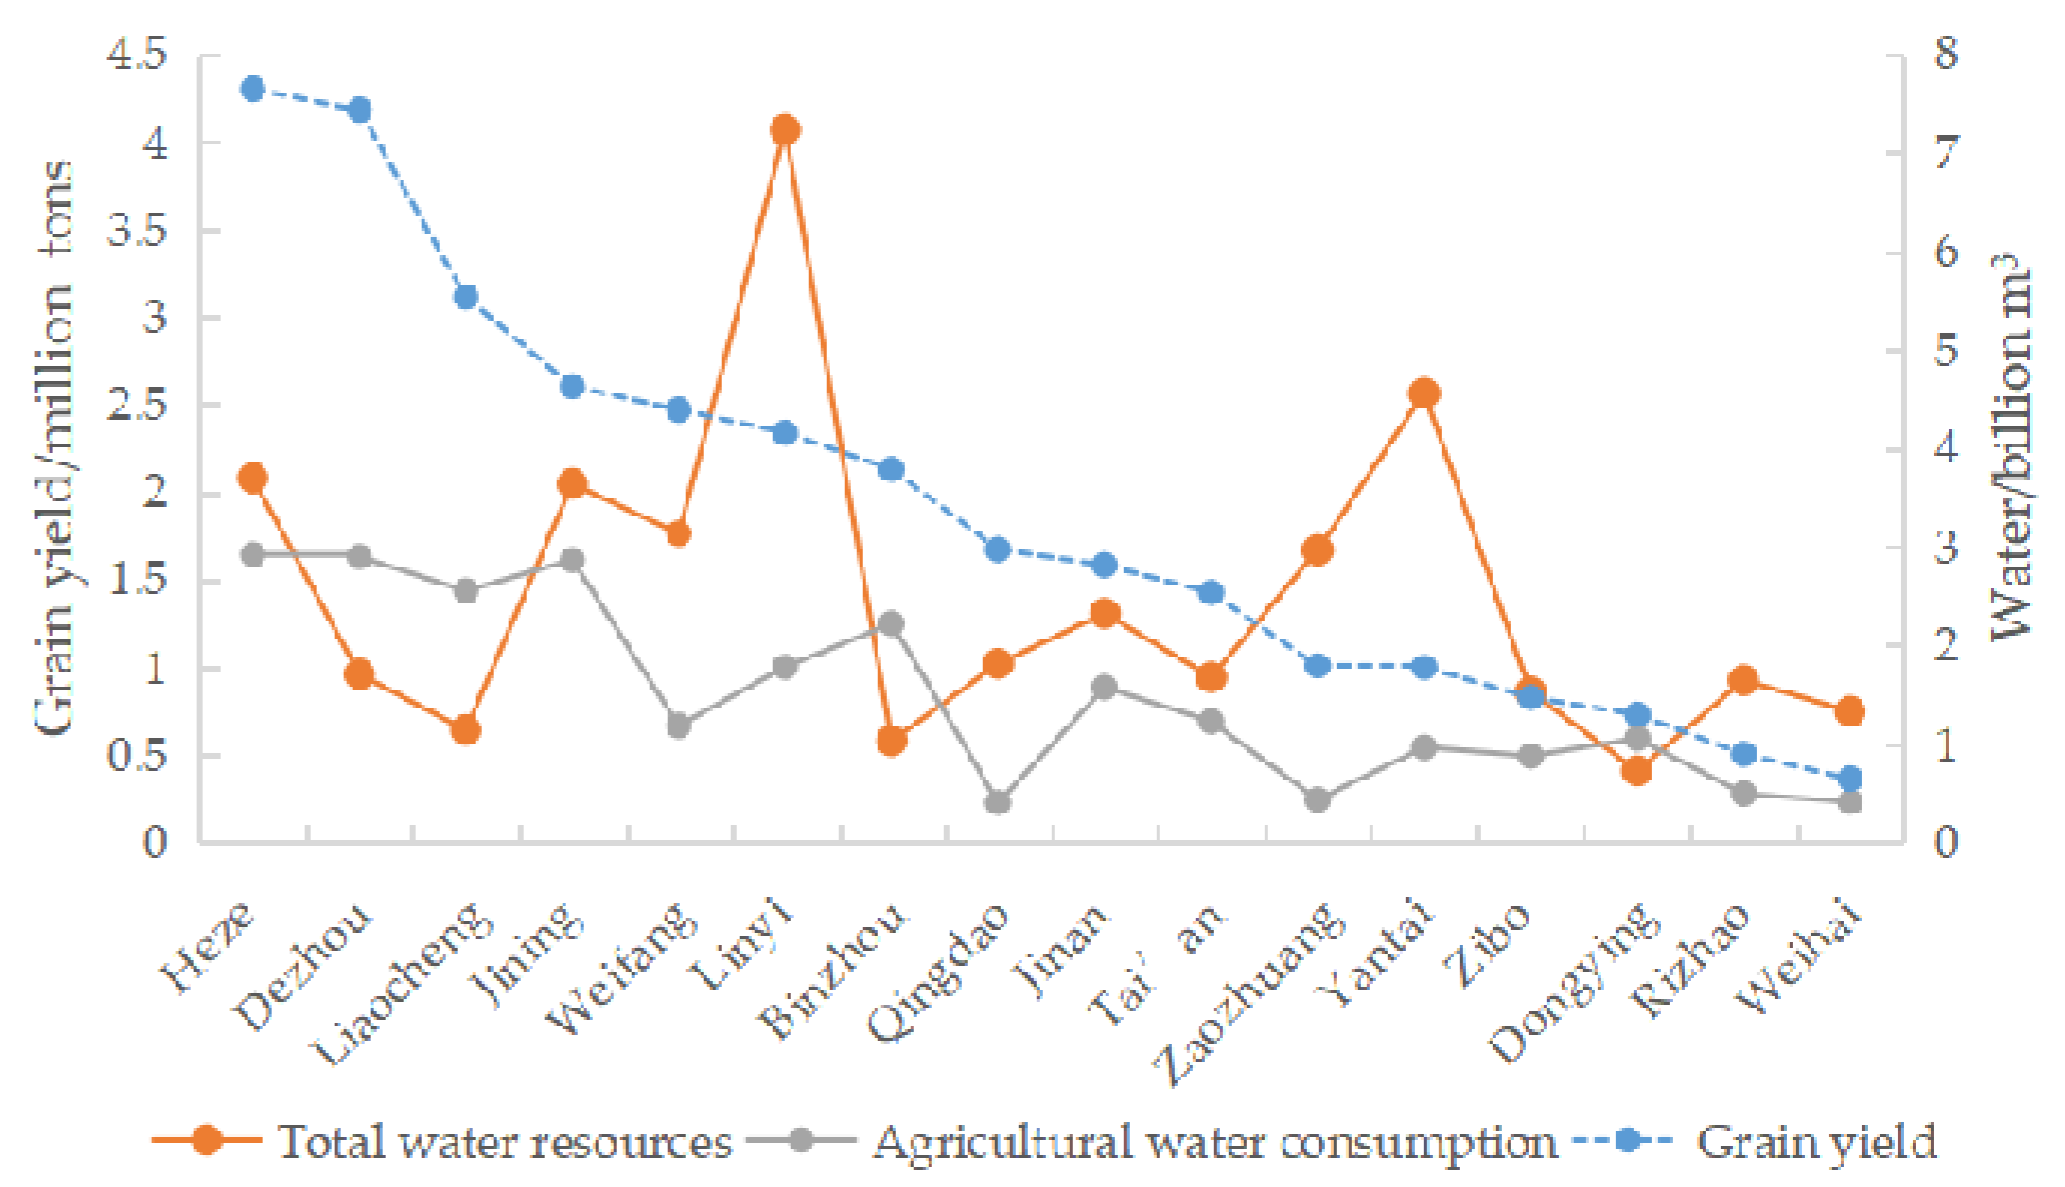
In 2017, the grain yield of Shandong Province reached 53.7431 million tons. Due to the vast territory of Shandong Province, the level of grain production was spatially differentiated: The grain production levels in Heze city and Dezhou city, located in the western inland area, were relatively high, each exceeding 7 million tons, and the grain production levels in Weihai city and Rizhao city, located in the eastern coastal area, were relatively low, each lower than 0.9 million tons. At the same time, the utilization status of cultivated land in Shandong Province was also spatially differentiated. The problem of spatial mismatching between grain production and cultivated land utilization challenges the realization of food security and agricultural modernization.
The water resources consumed by cultivated land are used as an example. Water safety is fundamental to food security [
39], and agricultural production consumed 64% of the total water consumption in Shandong Province in 2017. At the same time, there was a strong positive correlation between agricultural water consumption and grain production in each city: The agricultural water consumption in Heze city, Dezhou city, and Jining city was greater than 1.6 billion m
3, and the agricultural water consumption in Qingdao city, Zaozhuang city, Rizhao city, and Weihai city was lower than 0.3 billion m
3. However, the agricultural water consumption was greater than the total water resources in Dezhou city, Liaocheng city, Binzhou city, and Dongying city, and the demand for water resources exceeded their maximum supplies. The total water resources amount was much larger than the agricultural water consumption in Linyi city and Yantai city. Thus, there was a shortage of water resources in northwestern Shandong; however, due to the pressure from grain production and the large amount of agricultural water use, its water resources were increasingly strained while the southeastern area of Shandong Province was rich in water resources and had low agricultural water consumption (
Figure 2). Therefore, this study of the spatial zoning of cultivated land in Shandong Province is typical and representative.
2.2. Data
The data used for research in this paper included vector data, text materials, and statistical data. The vector data were from an administrative map of Shandong Province, and the text materials were from General Land Use Planning of Shandong Province from 2006 to 2020 and Agricultural Modernization Planning of Shandong Province from 2016 to 2020, which were collected and provided by the Department of Natural Resources of Shandong Province. Statistical data on the cultivated land area in 2009 and 2018, the utilization quality of cultivated land in 2017, the land desertification area in 2015, and the ecological function region area in 2017 were collected and provided by the Department of Natural Resources of Shandong Province. The data on the total water resources, total water consumption, and agricultural water consumption in 2017 were all from the Shandong Statistical Yearbook (2018). All the data are the latest data that can be obtained through the official channels, and there has been little change in the characteristics of the differences in cultivated land resources among regions over a short period of time, so these data were used to calculate and represent the current pattern of cultivated land resources in Shandong Province.
Shandong Province contains a total of 137 county-level administrative units, of which Shinan District, Shibei District, and Licang District of Qingdao city, and Changdao County of Yantai city were not included in this study of the spatial zoning of cultivated land because they contain no cultivated land or the area of cultivated land is very small. Therefore, a total of 133 zoning units were established and used in this study.
2.3. Methods
2.3.1. Theoretical Framework
Farmland ecosystems are seminatural and semiartificial ecosystems [
40]. Farmland ecosystem structure is mainly composed of natural components and artificial components: Natural components include natural resource elements, such as cultivated land resources, water and heat resources, and biological resources, which are the material basis for farmland ecosystem functioning. In contrast, artificial components include human input elements, such as agricultural engineering and agricultural production technology, which regulate the use of natural resources to promote the various functions of farmland ecosystems [
41]. After all production factors are input into the farmland ecosystem, the structure of the system elements is optimized and regulated under the influence of the regional ecological environment. Through system operation, the production, life, and ecology functions of the farmland ecosystem can eventually be realized [
42]. At the same time, through feedback on the quality of farmland ecosystem services (such as food security, landscape culture, and ecological services), the structure and operating conditions of farmland ecosystems can be readjusted to provide a better level of farmland ecosystem services.
The element structure and operating environment are important foundations for realizing the functions and services of farmland ecosystems. Among the input factors, the cultivated land resource itself represents the quantity of cultivated land, and a series of factors that form the geological and geographical environment and the level of artificial utilization of cultivated land resources reflect the quality of cultivated land. The operational environment of farmland ecosystems represents the ecology of cultivated land (
Figure 3). Therefore, the spatial zoning of cultivated land should consider three aspects: The quantity of cultivated land, the quality of cultivated land, and the regional ecological environment.
2.3.2. Principles of Zoning
(1) Principle of dominance: The spatial zoning of cultivated land based on the TQQE is a process of analyzing the spatial combination of cultivated land resources in terms of quantity, quality, and ecology and then dividing corresponding management and control zones. Therefore, the main indicators that can be used to reflect the characteristics of the three aspects should be selected as the basis for the division of zones; however, the influence of factors, such as regional economic development and food security, should also be considered.
(2) Principle of the whole: Research on the spatial zoning of cultivated land provides a basis for the implementation of zonally differentiated cultivated land management and control policies in Shandong Province. Therefore, the spatial zoning unit of cultivated land should be consistent with administrative boundaries and maintain their integrity to the greatest extent possible, as this condition is conducive to adopting similar or consistent control policies.
(3) Principle of integration: The spatial zoning of cultivated land according to the TQQE is based on a comprehensive analysis of various factors that cause regional differences in cultivated land, and this analysis considers the influence of various factors, such as cultivated land area, cultivated land quality, and water and soil resources. It is necessary to not only analyze each factor but also comprehensively analyze the manifestation degree and effect of multiple factors in the zoning unit.
2.3.3. Indicators of Zoning
Based on the above principles of zoning and considering the availability of data, a total of six indicators related to cultivated land quantity, quality, and ecology were selected for the spatial zoning of cultivated land (
Table 1).
Zoning indicators related to quantity: Ensuring a certain planting area is important for protecting the regional cultivated land production capacity and achieving the goal of food security [
43]. Therefore, the proportion of cultivated land area (A
1) was selected to reflect the distribution of cultivated land quantity. At the same time, the phenomenon of cultivated land loss caused by rapid economic development has aggravated the tension between food demand and cultivated land resources [
44]. Therefore, the rate of change in cultivated land area (A
2) was selected to reflect the trend of change in the regional cultivated land quantity.
Zoning indicators related to quality: Because the loss of cultivated land is unavoidable at this stage, protecting high-quality cultivated land and increasing crop yield have become important ways to ensure the output of cultivated land [
45]. Therefore, the quality grade of cultivated land (B) was selected to comprehensively reflect the quality of cultivated land.
Zoning indicators related to ecology: These indicators mainly reflect the degree of conflict and the level of coordination between regional ecological security and cultivated land protection and utilization. A reasonable land-use structure is of great significance for maintaining the stability of the land ecosystem and achieving the sustainable utilization of land [
46]. Therefore, the proportion of ecological function region area (C
1) was selected to reflect the level of regional ecological health. In contrast, the deterioration of the ecological environment will reduce the stability of the land ecosystem; thus, the proportion of land desertification area (C
2) was selected to reflect regional ecological risk. At the same time, the shortage of water resources in the northern dryland farming region is an important hidden threat to China’s food security [
47]. Therefore, the matching coefficient between land and water resources [
48] (C
3) was selected to reflect the degree of spatial matching between water resources and cultivated land resources and to reflect the impact of resource constraints on regional ecological risk conditions. Due to the lack of relevant data at the county level, the proportion of ecological function region area and the matching coefficient between land and water resources were replaced by the mean value of the local city.
2.3.4. Zoning Methods
(1) Indicator analysis for the spatial zoning of cultivated land: From the three perspectives of quantity, quality, and ecology, a spatial analysis of each indicator in the indicator system was carried out to comprehensively reflect the cultivated land conditions in different regions.
(2) Indicator grading for the spatial zoning of cultivated land: Based on the indicator analysis results, with county-level administrative units as the zoning units and using ArcMap 10.3, the natural breakpoint method was used to grade each indicator.
(3) Spatial zoning of cultivated land: In this study, hierarchical clustering was used, which is a common clustering method used worldwide. It was first used to classify 133 zoning units into classes, and then the Euclidean distance was used as the similarity measure to specify the distances between classes. The calculation formula [
49] is as follows:
where
Dij is the similarity coefficient of the cultivated land resources between unit
i and unit
j;
xik is the grade of index
k in unit
i;
xjk is the grade of index
k in unit
j; and
n is the total number of zoning indicators.
Then, between-group linkage was used for clustering; that is, when the average value of the distance between zoning units for two classes was the smallest, the two classes were merged, and the distances were recalculated. This process was repeated until all samples were merged into one class [
50]. In the process of clustering, the distance between merged classes is called the fusion coefficient. As the clustering process advances, the similarity between classes decreases, and the fusion coefficient shows an upward trend. When two classes with large differences are merged, the fusion coefficient increases rapidly, so it can be used to determine the optimal number of zone types [
51].
3. Results
3.1. Distributions of the Quantity, Quality, and Ecology of Cultivated Land in Shandong Province
3.1.1. Distributions of the Quantity of Cultivated Land in Shandong Province
The proportions of cultivated land area of 72 county-level administrative units were greater than 0.72%, and these sites were mainly distributed in the form of strips in the western, midwestern, and mideastern regions of Shandong Province. The proportions of cultivated land area of 61 county-level administrative units were less than 0.72%, and these sites were mainly distributed in the form of spots along the northeastern coast and in the central inland regions of Shandong Province (
Figure 4a). From 2009 to 2018, the cultivated land area of only 30 county-level administrative units increased, and the cultivated land area of the remaining 103 county-level administrative units decreased (
Figure 4b).
3.1.2. Distribution of the Quality of Cultivated Land in Shandong Province
The cultivated land quality grades of 48 county-level administrative units were less than 7.85, indicating superior quality; these sites were mainly distributed in the midnorthern region of Shandong Province. The cultivated land qualities of 54 county-level administrative units were moderate; these units were mainly distributed in the southwestern region of Shandong Province. The cultivated land quality grades of 31 county-level administrative units were greater than 7.85, indicating poor quality; these sites were mainly distributed in the southeastern region and the Yellow River Delta in the northern region of Shandong Province (
Figure 5).
3.1.3. Distributions of the Ecology of Cultivated Land in Shandong Province
The proportion of ecological function region area in Weifang city was greater than 20%. The proportions of ecological function region area in Linyi city and Jining city in the south of Shandong Province were between 10% and 20%. The proportions of ecological function region area of the remaining 14 cities were less than 10% (
Figure 6a). The proportions of land desertification area of four county-level administrative units were greater than 5%, and these sites were clustered in the Yellow River Delta in the northern region. The proportions of land desertification area of 19 county-level administrative units ranked second, and these sites were mainly distributed in the region around the Yellow River Delta and in parts of western Shandong Province. The proportions of land desertification area of 110 county-level administrative units were less than 1.2%, where there was no desertification, or the land desertification areas were very small (
Figure 6b). The matching coefficients between the land and water resources of six cities in the north of Shandong Province were less than 0.14, indicating a poor degree of spatial matching; the matching coefficients between land and water resources of six cities in the midsouth and east of Shandong Province were between 0.14 and 0.24; and the matching coefficients between land and water resources of three cities in the south and along the eastern coast of Shandong Province were greater than 0.24, indicating a good degree of spatial matching (
Figure 6c).
3.2. Indicator Grading for the Spatial Zoning of Cultivated Land
3.2.1. The Grading of Zoning Indicators Related to Quantity
County-level administrative units with A
1 > 0.72% were divided into areas with a large proportion of cultivated land, and county-level administrative units with A
1 ≤ 0.72% were divided into areas with a small proportion of cultivated land; additionally, county-level administrative units with A
2 > 0 were divided into areas with increasing cultivated land, and county-level administrative units with A
2 ≤ 0 were divided into areas with decreasing cultivated land. Finally, the two indicators were combined to grade the zoning indicators of quantity (
Figure 7). Grade I was characterized by large proportions of cultivated land area and increases in cultivated land area, making such areas of key importance in maintaining the quantity of cultivated land. A reduction in cultivated land area is a common phenomenon during the process of urbanization and industrialization in China, but the proportions of cultivated land area for grade II were relatively large, and the quantity of cultivated land was still somewhat significant for the realization of food security. The pattern for grade III was the opposite of that for grade II, and grade IV was characterized by small proportions of cultivated land area and decreases in cultivated land area, which gradually weakened the likelihood of ensuring food security.
3.2.2. The Grading of the Zoning Indicator Related to Quality
County-level administrative units with B ≤ 7.85 were considered to be of a higher grade, county-level administrative units with 7.85 < B ≤ 9 were considered to be of a middle grade, and county-level administrative units with B > 9 were considered to be of a lower grade (
Figure 8). As the numeric value of cultivated land quality decreases, the quality of cultivated land improves, and the contribution of the land to the improvement of grain productivity becomes more prominent.
3.2.3. The Grading of Zoning Indicators Related to Ecology
Ecological security is a comprehensive manifestation of ecological risk and ecological health [
52]. The proportion of ecological function region area represents the health status of the regional ecosystem. From grade III to grade I, the larger the proportion of ecological function region area is, the more obvious the regional ecological significance is. Therefore, regions of grade I and grade II were judged to be healthy, and regions of grade III were judged to be unhealthy. The extent of land desertification and the degree of matching between land and water resources reflect the risk of regional ecosystems. From grade I to grade III, the larger the proportion of land desertification area is, and the smaller the matching coefficient between land and water resources is, the more obvious the conflict between ecological construction and cultivated land protection is. Therefore, if these two indicators of a certain area were of grade II or grade III, the scenario was considered high risk, and the remaining conditions were considered low risk (
Figure 9).
According to the risk and health of the regional ecosystem, this paper comprehensively evaluated the ecological security of each county-level administrative unit: The ecosystems of safe areas were low risk and healthy; the ecosystems of unsafe areas were high risk and unhealthy; and the ecosystems of relatively safe areas were either low risk but unhealthy or healthy but high risk (
Table 2).
3.3. Spatial Zoning of Cultivated Land Based on the TQQE
Grades I to grade IV of cultivated land quantity were assigned values from 1 to 4, respectively. The higher, middle, and lower grades of cultivated land quality were assigned values from 1 to 3, respectively. The safe, relatively safe, and unsafe areas in terms of cultivated land ecology were assigned values from 1 to 3, respectively. With the hierarchical cluster module in IBM SPSS Statistics 20, a cluster analysis of the quantity, quality, and ecology of cultivated land in 133 county-level administrative units was conducted. Considering the scale of provincial cultivated land management, this paper analyzed the clustering results with a number of zone types less than 10. Through the analysis of fusion coefficients, we found that when 10 classes were merged into 9 classes, 5 classes were merged into 3 classes, and 2 classes were merged into 1 class, the fusion coefficients increased greatly (
Figure 10), which indicated that these mergers brought two classes with large differences together and the characteristics of each zone type were distinct when the number of zone types was 10, 5, 4, or 2.
Further merging on the basis of two classes resulted in the most significant increase in the fusion coefficient, which was 45.11%; further merging on the basis of four classes resulted in a large increase in the fusion coefficient, which was 32.26%. However, at the provincial scale, it was relatively rough to divide the cultivated land resources into two classes for management. Therefore, this paper divided the cultivated land resources of Shandong Province into four types of zones (
Figure 11).
(1) Key protection zones: This type of zone consisted of 54 county-level administrative units that were widely distributed in the western and mideastern regions of Shandong Province. The cultivated land areas in these zones were generally large, accounting for 56.39% of the total cultivated land area of Shandong Province, and the quality of cultivated land was generally medium or high. Although the ecosystems were relatively safe, there was a certain degree of water–land matching, the average amount of water resources accounted for only 36.56% of the total water resources of Shandong Province, and the areas of ecological function regions were small. In this type of zone, the focus should be on promoting the moderate-scale management of grain to ensure food security in Shandong Province but, at the same time, promoting the development of water-saving agriculture and changing the method of agricultural development.
(2) Comprehensive promotion zones: This type of zone consisted of 54 county-level administrative units that were mainly distributed in the Jinan metropolitan area, Qingdao metropolitan area, and other regions with high levels of urban development. The cultivated land areas in these zones were generally small and showed a declining trend, accounting for only 21% of the total cultivated land area of Shandong Province, but the quality of cultivated land was generally at a middle or high level. Although the ecosystems were relatively safe, the areas of the ecological function regions were small. There was a certain degree of water–land matching, the average amount of water resources reached 37.14% of the total water resources of Shandong Province, and the water resources were relatively abundant. In this type of zone, the aims should be to develop high-efficiency agriculture, make use of modern agricultural facilities to improve crop production conditions, and increase the yield of cultivated land through year-round production, stereo planting, and cultivation of high-added-value products.
(3) Multifunctional utilization zones: This type of zone consisted of 17 county-level administrative units that were mainly located in the southern region of Shandong Province. The qualities of cultivated land in these zones were all in the lower grade, but the cultivated land ecosystems were relatively safe. This type of zone had a large ecological function region area, and the degree of matching between water and land resources was good. The cultivated land area accounted for 14.87% of the total cultivated land area of Shandong Province, and the average amount of water resources accounted for 20.41% of the total water resources of Shandong Province. In these zones, the plan should include taking advantage of the ecological environment, developing characteristic agricultural industries according to local conditions, and carrying out integrated development of the primary, secondary, and tertiary industries in rural areas while relying on new agricultural business entities.
(4) Ecological utilization zones: This type of zone consisted of eight county-level administrative units, five of which were located in the Yellow River Delta in northern Shandong Province. The quality of cultivated land in these zones was generally poor, and the cultivated land ecosystems were not safe. There were serious problems associated with land desertification and water–land mismatching. The area of cultivated land accounted for 7.74% of the total water resources of the total cultivated land area of Shandong Province while the average amount of water resources accounted for only 3.59% of the total water resources in Shandong Province. The risk of ecosystems was high. In addition, the ecological function region areas were relatively small, and the fragile agricultural ecological environment requires the use of high-tech modern agriculture in these zones to reasonably develop agricultural resources and explore modes of ecological agriculture on the basis of protecting and improving the ecological environment of the Yellow River Delta.
3.4. Comparison between the Results of Spatial Zoning of Cultivated Land and the Results of Existing Zoning
The cultivated land resources are mainly managed by the land department and agricultural sector. At present, the zoning results related to cultivated land resources in Shandong mainly include the comprehensive land-use zoning in
General Land Use Planning of Shandong Province from 2006 to 2020 (
Figure 12a) and the agricultural regional layout in
Agricultural Modernization Planning of Shandong Province from 2016 to 2020 (
Figure 12b).
Based on different research perspectives, the results of this paper are different from those obtained with the other two zoning schemes due to differences in the types and bases of zoning, which are mainly reflected in the following:
(1) In the other schemes, each zone is almost continuous in space. Although the zoning results in this paper show the agglomeration of zoning types in space, the zoning types are not completely continuously distributed, which more accurately reflects the main characteristics and development directions of the protection and utilization of cultivated land in each county-level administrative unit and are good for implementing different policies in different regions.
(2) In this study, comprehensive factors were used to carry out the spatial zoning of cultivated land in Shandong Provinc while the agricultural regional layout was mainly obtained based on the direction of regional economic development to lay out the agricultural development direction of various regions in Shandong Province. This paper focused on the farmland ecosystem itself and conducted zoning according to the quantity, quality, and ecological status of cultivated land to allow the farmland ecosystem to maintain its normal functional structure and meet the needs of sustainable social and economic development. Therefore, in this paper, zoning research was specifically conducted on cultivated land while the zoning was also based on comprehensive factors, which are of great significance for the implementation of differentiated cultivated land protection policies in Shandong Province.
(3) Compared with the other two schemes, the results for the key protection zones are basically consistent with those of western Shandong and the western belt of economic growth, and the results for the ecological utilization zones are basically consistent with those of northern Shandong and the high-efficiency ecological economic zone of the Yellow River Delta. However, for the multifunctional utilization zones with superior ecological conditions, although the zoning results are basically consistent with those for southern Shandong, it is located in the western belt of economic growth, which is the main agricultural production base in the agricultural regional layout. As it covers two major metropolitan areas in Shandong Province, the comprehensive promotion zone type is mainly located in eastern Shandong and central Shandong under the comprehensive land-use zoning, as well as the blue economic zone of Shandong Peninsula and the economic circle of the capital city in the agricultural regional layout. It can be seen that the cultivated land zoning results in this paper are more in line with the actual pattern of development at present and especially reflect the importance of the regional ecological environment in the future protection and utilization of cultivated land.
4. Discussion
4.1. Improvement of the Cultivated Land Requisition–Compensation Balance in Shandong Province
To increase the food production capacity and ensure national food security, China implements the strictest protection system for cultivated land. The protection and improvement of the comprehensive food production capacity must be guaranteed by stabilizing a certain amount of cultivated land, and the cultivated land requirement–compensation balance is the most effective measure for realizing a dynamic equilibrium in total cultivated land. However, as the connotation of cultivated land protection continues to be enriched, the conditions of cultivated land resources differ among regions. Therefore, in Opinions on Strengthening the Protection of Cultivated Land and Improving Cultivated Land Requisition-Compensation Balance, the Central Committee of the Communist Party of China and the State Council of the People’s Republic of China emphasized that China should improve its management practices in terms of the cultivated land requisition–compensation balance and implement differentiated management policies for improving this balance. The cultivated land requirement–compensation balance should be improved according to differences in the quantity, quality, and ecology of cultivated land in different regions.
(1) The adjustment of cultivated land quantities in the province must follow the basic conditions of cultivated land resources and the laws of economic and social development in different regions [
53]. Central Liaocheng city, central Dezhou city, and western Tai’an city, which are located in key protection zones, have large proportions of cultivated land, and their cultivated land areas have increased continuously in recent years. The potential for cultivated land development and utilization in these regions is great. However, due to the limitation of the economic development level, these land resources are difficult to develop and utilize. Therefore, these regions can be used as a key area to supplement the cultivated land quantities in Shandong Province. In contrast, the Jinan metropolitan area and Qingdao metropolitan area, located in comprehensive promotion zones, exhibit rapid social and economic development, but their potential in the development and utilization of cultivated land is low, and it is difficult to achieve an on-site cultivated land requisition–compensation balance. Therefore, these regions should be considered the key areas of building usage in the adjustment of provincial cultivated land quantity. Finally, a dynamic equilibrium of total cultivated land in the province can be achieved overall.
(2) The qualities of cultivated land in the central and northern areas of Shandong Province were relatively good while the qualities of cultivated land in most of the remaining areas should be improved. Therefore, in the process of achieving a cultivated land requisition–compensation balance, how to improve the quality of supplementary cultivated land after building usage is still the main problem associated with cultivated land protection in Shandong Province. To ensure that cultivated land "occupies the best and supplements the best", we suggest that in the territorial spatial planning of Shandong Province, the cultivated land quantity and basic farmland protection area should be used as the main control indicators for the regional cultivated land requisition–compensation balance, and relevant indicators reflecting the quality of cultivated land should be added. The constraint indicators of cultivated land quality for each city in Shandong Province should be determined according to the cultivated land qualities of different spatial zones, and ultimately, an internal restriction mechanism must be formed to promote the stable and increasing quality of cultivated land and achieve a cultivated land quality requisition–compensation balance in the province.
(3) China has entered an era of ecological civilization from an era of industrial civilization. The cultivated land requirement–compensation balance should not only balance the quantity and quality of cultivated land but also reasonably reflect the ecological value of cultivated land. For example, for the ecological utilization zone in the Yellow River Delta, the cultivated land ecosystem has a higher risk, and the regional ecological environment is poor. In addition to the production function of cultivated land, the ecological function of cultivated land should be strengthened. Therefore, the cultivated land requisition–compensation balance in Shandong Province should focus on evaluating the ecological value of all cultivated land and consider soil fertility maintenance, nutrient circulation, the carbon sink, and biodiversity [
54]. The economic compensation standards in different regions should be reasonably determined to provide a strong guarantee for the cultivated land requisition–compensation balance.
4.2. Construction of a Fallowing and Rotation System for Cultivated Land in Shandong Province
In the new era, cultivated land rehabilitation will be an important measure for the quality improvement and ecological protection of cultivated land in Shandong Province; thus, it is urgent to gradually develop a mode and policy system of fallowing and rotation on cultivated land that is in line with the conditions in Shandong Province. In May 2019, the Shandong Provincial Department of Agriculture and Rural Affairs and the Shandong Province Finance Bureau issued the Implementation Plan for Pilot of Fallow and Rotation System of Cultivated Land in 2019, which designated a rotation area of approximately 333 km2 on cultivated land. According to the zoning results in this paper, Shandong Province should conduct rotations of corn and soybean and of corn and peanut in the key protection zones with large areas of good-quality cultivated land to improve the supply capacity of soybeans and oilseeds and accelerate the establishment of a green planting system in Shandong Province.
At the same time, the excessive use of cultivated land resources and the excessive consumption of water resources have caused a series of ecological problems, such as land desertification. Therefore, Shandong Province should gradually carry out pilot fallowing of cultivated land in ecological utilization zones where the quality of cultivated land is generally poor and the cultivated land ecosystems are unsafe, especially in areas where land desertification and water–land mismatching are prominent, to alleviate the pressure on regional water resources, continuously improve the matching between water resources and land resources, and effectively improve the ecological environment of cultivated land.
4.3. Optimization of the Indicator System for the Spatial Zoning of Cultivated Land
The selection of indicators for the spatial zoning of cultivated land directly affects the scientific rationality of the zoning results. Limited by time and data, this paper mainly selected six zoning indicators from three elemental layers (quantity, quality, and ecology) of cultivated land, representing a new avenue of research on the indicator systems for the spatial zoning of cultivated land. However, the conditions of cultivated land differed among regions. Therefore, when conducting research on the spatial zoning of cultivated land in other regions, the main factors influencing regional cultivated land utilization and protection should first be clarified, and the indicator system for the spatial zoning of cultivated land in this paper should be optimized and adjusted. For example, for the mountainous and hilly regions in southern China, soil and water losses should be key considerations when selecting ecological indicators for the spatial zoning of cultivated land. Therefore, exploring a multiregional and differentiated indicator system for the spatial zoning of cultivated land is an important direction for future research.
5. Conclusions
This paper built a theoretical framework for the spatial zoning of cultivated land based on the TQQE and clarified the significance of the cultivated land scale, cultivated land quality, and regional ecological environment to maximum the functions of farmland ecosystems. Then, combined with relevant zoning principles, a total of six indicators of spatial zoning for cultivated land were selected from the three perspectives of quantity, quality, and ecology, and an indicator system for the spatial zoning of cultivated land based on the TQQE was established.
By analyzing the spatial zoning indicators for cultivated land, this paper found that the overall amount of cultivated land in Shandong Province is decreasing and the spatial distribution of cultivated land quantity is unbalanced. The quality level of cultivated land is uneven between regions of Shandong Province. All regions of Shandong Province have different degrees of potential ecological risks in relation to cultivated land; however, some regions have a certain ecological importance. Based on the grading of indicators for the spatial zoning of cultivated land and the use of hierarchical clustering, clustering analysis was performed on 133 county-level administrative units. Then, the cultivated land resources of Shandong Province were divided into four types of zones, namely, key protection zones (including 54 county-level administrative units), comprehensive promotion zones (including 54 county-level administrative units), multifunctional utilization zones (including 17 county-level administrative units), and ecological utilization zones (including 8 county-level administrative units), and the main problems and future development directions in relation to the protection and utilization of cultivated land in each zone type were proposed.
The zoning results showed that in the key protection zones of cultivated land located in the western and mideastern regions of Shandong Province, the method of agricultural development should be changed, and food security should be ensured; in the comprehensive promotion zones, which have a higher level of urban development, the plan should involve taking advantage of high-efficiency agriculture to achieve the goal of a high yield from cultivated land; in the multifunctional utilization zones located in the south of Shandong Province, integrated development of the primary, secondary, and tertiary industries in rural areas should be promoted, and characteristic agricultural industries should be developed; and in the ecological utilization zones in the Yellow River Delta, the ecological environment should be improved, and ecological agriculture should be developed. In addition, compared with the existing zoning results, the zoning scheme in this paper has advantages in meticulousness, pertinence, and comprehensiveness, and the research results are consistent with the social and economic development of Shandong Province and China’s requirements for ecological civilization construction. The research results showed that the spatial zoning of cultivated land based on the TQQE has important theoretical and practical significance for guiding the protection and utilization of cultivated land in Shandong Province and other regions.


