Abstract
Moisture dry-out from steel-faced insulated sandwich panels has previously received little attention from researchers. This paper reports the results from laboratory tests and dynamic heat, air, and moisture transport simulations of the moisture dry-out capabilities of a steel-faced sandwich panel with a mineral wool core. Three test walls (TWs) with dimensions of 1.2 m × 0.4 m × 0.23 m were put above water containers to examine the moisture transport through the TWs. A calibrated simulation model was used to investigate the hygrothermal regime of a sandwich panel wall enclosure with different initial moisture contents and panel joint tightening tapes. The moisture dry-out capacity of the studied sandwich panels is limited (up to 2 g/day through a 30-mm-wide and 3-m-long vertical joint without tapes). When the vertical joint was covered with a vapour-permeable tape, the moisture dry-out was reduced to 1 g/day and when the joint was covered with a vapour-retarding tape, the dry-out was negligible. A very small amount of rain would be enough to raise the moisture content to water vapour saturation levels inside the sandwich wall, had the rain ingressed the enclosure. The calculated time of wetness (TOW) on the internal surface of the outer steel sheet stayed indefinitely at about 5500 h/year when vapour-retarding tapes were used and the initial relative humidity (RH) was over 80%. TOW stabilised to about 2000 h/year when a vapour-permeable tape was used regardless of the initial humidity inside the panel. A vapour-permeable tape allowed moisture dry-out but also vapour diffusion from the outside environment. To minimise the risk of moisture damage, avoiding moisture ingress during construction time or due to accidents is necessary. Additionally, a knowledge-based method is recommended to manage moisture safety during the construction process.
1. Introduction
Insulated sandwich panels are layered structures which have two facings and an insulating core. The facings are relatively thin and strong and could be made out of varied materials, e.g., metals (commonly steel) or fibre-reinforced composites and wood-based materials [1,2]. The majority of sandwich panel producers in Europe focus on panels with metal facings and rigid plastic foam or mineral wool for the core material [2]. Plastic foams give the highest values of thermal insulation but panels with mineral wool can also reach adequate thermal insulating properties. Such panels are particularly well suited for walls and roofs [2]. However, plastic foam materials are combustible and mineral wool is preferred when there is a particular requirement for fire safety [2]. Recent research suggests that mineral wool has a lower environmental impact than hydrocarbon-based insulation materials [3,4] and, thus, might be of interest as the more sustainable choice of the two. For a building to be sustainable, it must, among other aspects, maintain long-term durability. Peris Mora reviewed literature regarding durability and sustainability and brought out that one of the most efficient ways to achieve sustainability is to improve the durability of the construction works and that greater material durability leads to less time and resources required to maintain it [5]. The annual installed area of these type of panels has reached up to 130 million m2 in Europe [6]. Thus, the evaluation of the hygrothermal performance and from this the durability of the panels could interest the construction industry.
Moisture dry-out from structures is an important part of the overall hygrothermal performance of the building envelope [7,8,9]. Information about the dry-out capability is necessary to design and construct buildings in a manner where there would not be any threats to human health as a result of high humidity [10]. In Sweden, an industry standard for including moisture safety in the construction process is commonly used [11]. However, research from Sweden shows that, even after the industry standard has been in use for years, the knowledge in moisture safety is still low and designers have problems assessing moisture risks [12]. Therefore, it is necessary for researchers to provide guidelines for stakeholders in the construction business about dry building design and moisture-safe practices. Knowing the critical environment conditions during construction time and the moisture dry-out rate of the used structures, stakeholders responsible for moisture safety can make knowledge-based decisions. Experience shows that general guidelines such as “avoid moisture ingress” or “protect moisture-sensitive materials during construction or storage” are not thoroughly followed (Figure 1). More specific guidelines, such as in which conditions (e.g., relative humidity of outside air, rain amount) it is safe to install specific details, in which conditions the details must be stored, etc., could be useful. To give such guidelines, it is necessary to know the moisture dry-out capability and the conditions when critical situations occur.
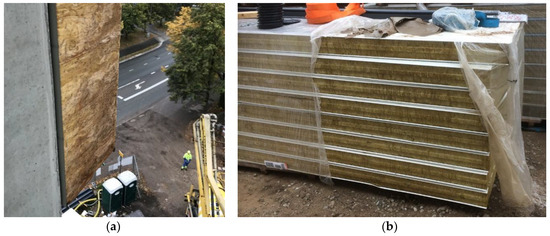
Figure 1.
Sandwich panel insulating core exposed to outside environment during construction (a) and storage (b). Photos taken by the authors.
However, there has been little research regarding the moisture dry-out of steel-faced sandwich panels. Most research regarding the durability of these panels has focused on the mechanical resistance and only a few acknowledge the influence of moisture. Pfeiffer brings out in his thesis about the durability of sandwich panels that “temperature and humidity affect the ageing of mineral wool cores in sandwich panels” and that “it is expected that increased humidity and increased temperature lead to a faster loss in strength” because “cured urea-formaldehyde (UF) resin is not completely stable to hydrolysis” [13]. Being a component of the mineral wool binder, UF resin makes its hydrolysis to influence the mechanical properties of the mineral wool [13]. Moisture-induced damage to mineral wool is also reported in a recent study where the authors determined that the mean compressive strength of a mineral wool sample that had a prolonged presence of elevated moisture content was 93% lower than the declared value [14]. Pfeiffer reports that a combination of elevated temperature (65 °C) and humidity (≈100% relative humidity) decreases the tensile strength of a sandwich panel to 60% of its initial strength in about a year, stabilising to around 40% to 50% of the initial strength after a few more years. Although Pfeiffer notes that the scatter in results is great and the results depend largely on sample variation, it is evident that high relative humidity (RH) levels are to be avoided in the sandwich panel. In the book Lightweight Sandwich Construction [2], it is also highlighted that high humidity rather than high temperature is the degrading factor for mineral wools in the sandwich panel. The authors of the book also mention that internal moisture variations in the sandwich panel could lead to the corrosion of the steel faces. The back faces are usually coated to inhibit corrosion. The principle of the test method to evaluate corrosion resistance of the coatings is to expose the test panel to continuous water condensation for 500 h or up to 1500 h [15]. However, if there is a water leakage situation, the high humidity conditions could last longer. Increasing moisture content also increases the thermal conductivity of mineral wool [16]. Studies show that significant reduction in the thermal insulation function is already present at relatively low moisture contents of 5–20% by volume of the mineral wool insulation [17].
Laukkarinen et al. made a series of laboratory measurements with steel-faced mineral wool sandwich panels in a water leakage situation [18]. Their paper focused mostly on measurement techniques and methods to detect moisture leakages, but it was evident from the measurements that the outer layer of the mineral wool core experienced condensing conditions repeatedly. The authors reported that the spread of moisture is more influenced by the evaporation speed than the speed of vapour diffusion [18]. Nonetheless, there was no analysis of the moisture dry-out capability of the tested structures.
The purpose of this study is to quantify the moisture dry-out capability of steel-faced sandwich panels and investigate the hygrothermal behaviour of the panels when different joint sealing tapes are applied and how the tapes affect the moisture dry-out and the overall hygrothermal performance of steel-faced sandwich panels. The knowledge from the study gives an important input to dry building design and moisture safety management of the construction process. For example, the dry-out rate of a structure is required to evaluate the criticality of wetting incidents or the need for weather protection.
2. Materials and Methods
2.1. Studied Sandwich Panels
The studied panels are steel-faced and have a mineral (stone) wool insulation core. The insulation thickness of the panels is 230 mm. The insulation thickness could vary in practice depending on the needed thermal transmittance. The thickness of the external steel sheet is 0.6 mm and of the internal sheet, 0.5 mm. According to the standard installation method, the vertical joints of the panels have a 30 mm wide gap, which must be filled with insulation and sealed from both sides during the installation of the panels (Figure 2a,b). Horizontal joints have elastic sealing strips in place from the factory (Figure 2c). Steel faces are vapour tight and only a negligible amount of water vapour is assumed to escape through the horizontal joint, thus, the only area to have an impact on the drying capability of the panels is assumed to be the vertical joint and the tapes covering it.
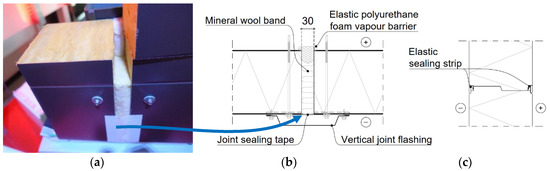
Figure 2.
A mock-up of a standard vertical panel joint (a), the respective detail drawing (b) and a drawing of the horizontal panel joint (c).
2.2. Laboratory Test
The laboratory test (Figure 3) was set up in a controlled environment to measure the dry-out capability and study the effects of a vapour-permeable and a vapour-retarding wind barrier tape on the drying out of moisture from the steel-faced sandwich panel. Three segments (test walls, TWs) were extracted from two larger sandwich panels (Figure 4). Test wall 1 (TW1) and test wall 2 (TW2) were cut from the same panel and had the insulation (stone wool) fibres parallel to their longer sides. Test wall 3 (TW3) was cut out from another panel with the stone wool fibres perpendicular to its longer sides.
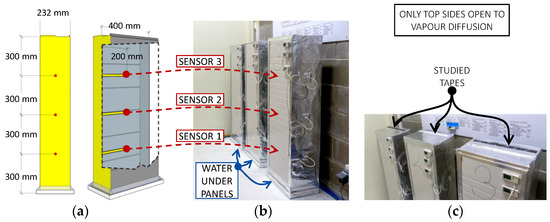
Figure 3.
3D model of a test wall (TW) (a) with indicated sensor placement (red dots) and photos of the TWs (b) in the TalTech nZEB Test Facility and of the top sides of the TWs with drying apertures covered with tapes (c).
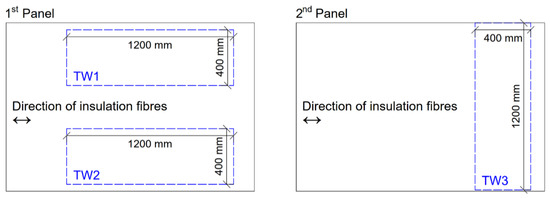
Figure 4.
Location of the test wall (TW) cut-outs (blue dashed line) in the larger sandwich panels.
It was necessary to create a gradient of water vapour pressure through the insulation (stone wool) of the sandwich panel. A container filled with water was put under the TWs (Figure 3b). The TWs were 10 mm apart from the water level and care was taken not to disturb the water level while weighing the TWs to avoid water contact with the insulation. The TWs were prepared in such a way that water vapour could escape them only through a designated surface, which was on the opposite side of the water container. All other sides of the TWs were sealed vapour tight with a butyl band and aluminium foil covering. This setup imitated the circumstances that would arise if water leaked into the sandwich panel and accumulated in its bottom part (e.g., in the plinth rail).
Nine temperature and RH (t&RH) sensors (HOBO UX100-023A) were installed on the centre line of the TWs in the middle of the insulation layer. The sensors were distributed at equal distances (300 mm) from each other and from the water level and top side (Figure 3a). All the penetrations due to the sensors’ cables were sealed with a butyl band and an aluminium tape to minimise their influence on the measurements. Another t&RH sensor, which logged the ambient air temperature and RH during the test, was installed directly above the TWs.
The accuracy of the t&RH sensors was validated with the help of saturated salt solutions, which produce a fixed humidity level, as described by Greenspan [19]. The sensors were placed sequentially above the aqueous solutions of MgCl, NaCl and K2SO4, which produced an environment with an RH of 32.78% ± 0.16, 75.29% ± 0.12 and 93.58% ± 0.55, respectively, at 25 °C. The sensors were held above the saturated salt solutions for at least 12 h after the readings stabilised. The correction values reached up to +3.7% at 79% RH but stayed below +2.5% at 33% and 98% RH, being below +1.5% for most points at these RH levels (Figure 5). This was considered when reporting the results of this paper.
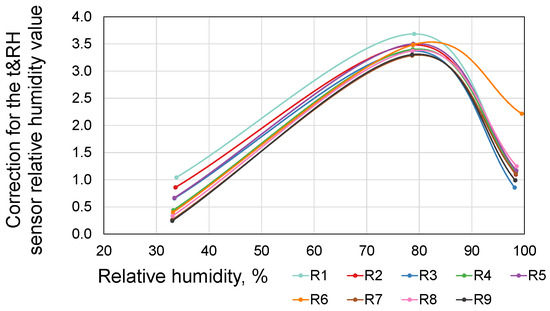
Figure 5.
Correction values for the temperature and relative humidity (t&RH) sensors (R1–R9) at different RH values.
The TWs were kept in isothermal conditions, i.e., the ambient temperature and RH were the same around all sides of the TWs (Figure 6, water vapour pressure 793–1266 Pa), with the exception of the bottom side of the TWs where the RH was ≈100% due to the water vapour pressure (2642–3166 Pa) generated from the water in the container beneath. This setup created a sufficient water vapour gradient for the experiment.
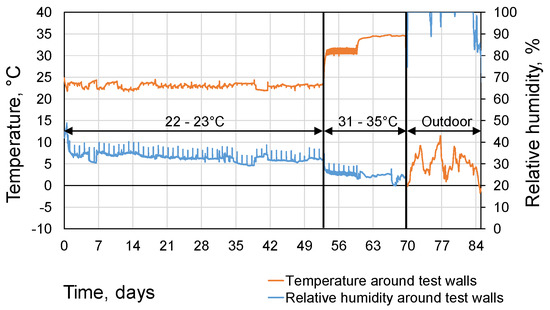
Figure 6.
Ambient conditions during the laboratory test.
The designated drying surface area of the TWs was changed throughout the test, being either a fully open top side (230 mm × 400 mm) or an aperture of 30 mm × 375 mm. The width of the aperture (30 mm) was chosen to reflect the width of the standard vertical joint for these types of sandwich panels. For the purpose of measuring the water vapour saturation speed, there was also a test sequence when TW1 had all sides sealed. Figure 7 shows a timeline describing the series of measurements and changes made to the dry-out aperture and the environment surrounding the TWs throughout the test. A vapour-permeable (with an Sd or equivalent air layer thickness of 0.05 m) tape and a vapour-retarding (Sd = 15 m) tape were used on the aperture to study the effect of the tapes (Figure 3c).
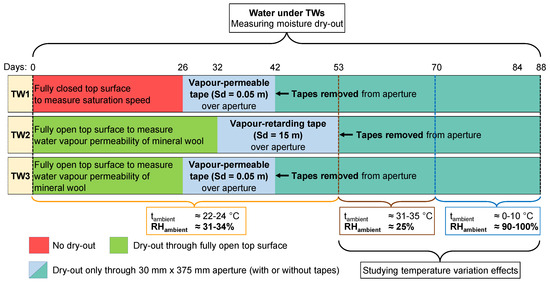
Figure 7.
Timeline (in days) of the laboratory test with descriptions of various parts of the test. Each horizontal band describes one TW. Distinct colours indicate changes to the top surface of the TWs.
In addition to the data gathered with t&RH sensors, all the TWs were regularly weighed to determine the mass of dried-out (evaporated) water. A calibrated Kern DS 30K0.1L platform scale was used with a maximum weighing capacity of 30 kg, readability of 0.1 g and repeatability of 0.2 g.
2.3. HAM Modelling
The numerical simulation tool Delphin 5 was used for the combined heat, air and moisture (HAM) transport modelling. Delphin is a well-developed, advanced and validated software suitable for building sciences [20,21].
The simulation models were calibrated against the measurements with sufficient accuracy as described by Kalbe et al. [22]. A 2D model was necessary to achieve a good agreement between the measured data and simulation results. Kalbe et al. [22] reported a good agreement of the measured and simulated drying processes, but there was a possibility of a slight overestimation of drying. The authors compared the measured and simulated RH and water vapour pressures (Figure 8), which showed sufficiently good agreement, although the simulation tended to underestimate RH in the high humidity region. This could have been partly due to the positive shift of registered RH values (up to +3.7% at 79% RH) detected with validating the readings of t&RH sensors over saturated salt solutions. These discrepancies have been considered when reporting the results of this paper.
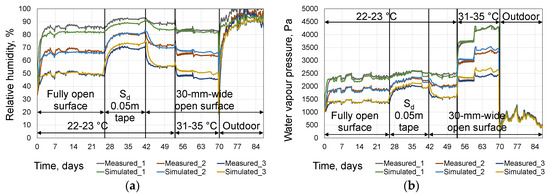
Figure 8.
Comparison of measured and simulated RH (a) and water vapour pressure (b) of TW3. Adapted from Kalbe et al. [22].
2.3.1. Material Properties
Table 1 and Figure 9 present the material properties used in the HAM models. The material properties are based on the data provided by the producer of the sandwich panels and Delphin’s default functions (for the properties that depend on the hygric environment) [22].

Table 1.
Material properties of the stone wool insulation of the sandwich panels [22].
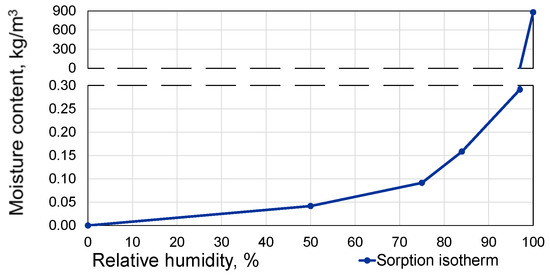
Figure 9.
Sorption isotherm used for the stone wool in the simulations.
The steel sheets were omitted from the simulation models and no vapour exchange was modelled on the corresponding boundary.
2.3.2. Climate Data and Boundary Conditions
The HAM transport simulations were made with the outside temperature and RH data of the Estonian moisture reference year (MRY) for water vapour condensation analysis. The climate data (Figure 10a) correspond to a year where the potential of an assembly to dry out is low and which would occur once in every ten years in Estonia [23]. A simplified relationship of outdoor and indoor temperatures was used for the indoor boundary (Figure 10b). This corresponds to typical indoor conditions of heated warehouses and is based on the approach described in EN 15026:2007 [24]. No vapour exchange was assumed between the panel and the indoor environment.
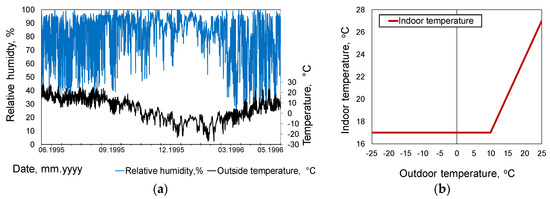
Figure 10.
Temperature and RH values of the climate data used in heat, air and moisture (HAM) simulations for the outside (a) and inside (b) boundaries.
2.3.3. Simulation Model
The HAM simulation model comprised only the stone wool part, with steel modelled as a boundary without vapour exchange. A model of half of a 6-m-long and 230-mm-thick sandwich panel was made. The length of 6 m is typical for sandwich panels. The 30-mm-wide joint (see Section 2.1) where vapour exchange could occur was also included and the corresponding boundary layer was simulated with an Sd of 0.05 m, which is the value for a vapour-permeable wind barrier tape.
To simplify the model and reduce simulation time, the principle of symmetry was applied. Thus, the final 2D geometry in the simulation model was 3015 mm by 230 mm (Figure 11).
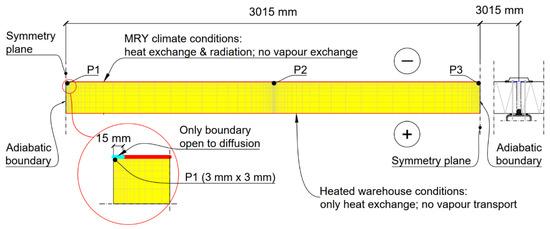
Figure 11.
Geometry of the simulated model (yellow) in the context of a standard vertical joint (on the right). Locations of simulated RH points are shown with leaders (P1 = at the diffusion open joint; P2 = at one-quarter of the panel; P3 = at half of the panel). A zoomed-in view of the left side of the model at the diffusion open joint is given on the bottom left of the figure. MRY—moisture reference year.
In a previous study, where the authors used constant climate conditions for the simulations [22], it was reported that a high RH occurs in the external part of the panel. Thus, the RH outputs (P1, P2, P3) in the current simulations were assigned to 3 mm × 3 mm segments in the outermost layer of the insulation (Figure 11). The output P1 was assigned to the middle of the diffusion open joint, P2 was assigned to a point at one-quarter of the panel length and P3 was assigned to the middle of the panel (far right edge in the simulation model geometry).
The simulations were made with two initial moisture contents: 0.134 kg/m3 and 0.291 kg/m3 which respectively correspond to 80% RH and water vapour saturated conditions (97% RH on the sorption curve). The latter (overhygroscopic moisture) would occur when about 67 g of water is sealed into a sandwich panel with material properties described earlier and with dimensions of 1 m × 1 m × 0.23 m (thus, with a volume of 0.23 m3, 0.23 m3 × 0.291 kg/m3 ≈ 6.69 × 10⁻² kg moisture). The situation would be similar to a test where a mineral wool sample is put above free water (without direct contact and capillary water flow) in a sealed box and the mineral wool acquires the maximum amount of water molecules due to adsorption. One hundred per cent RH would mean that the mineral wool is saturated with free water (moisture content ≈ 900 kg/m3; Figure 9).
The 80% RH level describes a situation where no water leak has occurred, but the panel has equalised with a surrounding autumn outside environment (for comparison, the 28-day moving average of RH values during the autumn and winter of the selected MRY is constantly over 80%). Thus, for the panel with a volume of 0.23 m3, there would be 0.23 m3 × 0.134 kg/m3 ≈ 3.08 × 10⁻² kg of moisture (water vapour). The difference of moisture contents between the 80% RH level and water vapour saturated conditions is 0.157 kg/m3 or 3.61 × 10⁻² kg for a panel with the volume of 0.23 m3.
The simulations were made with the wall facing north, west and south, considering the solar diffuse and direct radiation data of the MRY climate data. The external surface of the sandwich panel was assumed to be medium grey with an absorption coefficient of 0.6. Additionally, a simulation without any radiation influence was made. All the simulations were started with the beginning of January and the yearly data were treated as cyclic, i.e., data wrapped after 365 days.
2.3.4. Time of Wetness
Time of wetness (TOW) is widely used regarding metallic materials and is defined in the ISO standard 9223:2012 as a “period when the metallic surface is covered by adsorptive and/or liquid films of electrolyte to be capable of causing atmospheric corrosion” [25]. The standard also describes that TOW is calculated as the length of time (in hours per year) during which the relative humidity is greater than 80% at a temperature greater than 0 °C and notes that “wetting of surfaces is caused by many factors, for example, dew, rainfall, melting snow and a high humidity level”. TOW categories (Table 2) range from internal microclimates (level T1) to damp climates and unventilated sheds in humid conditions (level T5). A higher TOW indicates higher corrosivity of the atmosphere. The latter is also influenced by airborne salinity (represented by chloride) and the concentration of pollutants (sulphur-containing substances represented by sulphur dioxide) in the atmosphere; but in the context of this study, it is assumed that the concentration of these inside the sandwich panel is at the lowest level.
Table 2.
Time of wetness (TOW) and corrosivity categories [25].
A recent study described that when estimating TOW from measurement data, a more accurate approach would be to use values obtained from the surface of the metal material, instead of ambient air RH [26]. The same approach has applied in this study to calculate the TOW of the steel surface inside the sandwich panel. The temperature and RH data used in the TOW calculation is simulated in the point P3 (Figure 11), i.e., in the outermost 3 mm thick layer of the mineral wool core in the middle of the panel.
3. Results
3.1. Laboratory Test Results
The first set of analyses examined the saturation speed of water vapour (TW1, Figure 12a) and the distribution of water vapour inside the sandwich panel (TW2, Figure 12c and TW3, Figure 12e). Then the configuration of the drying surface was changed (see Figure 7 in the Methods section for a more detailed description): only an aperture of 30 mm × 375 mm was left open to diffusion and covered with a vapour-permeable tape on TW1 and TW3 and with a vapour-retarding tape on TW2. After the RH readings stabilised, the tapes were removed, leaving a 30 mm wide surface uncovered. In parallel, the dried-out moisture for each past period for every TW was determined (TW1, Figure 12b; TW2, Figure 12d and TW3, Figure 12f).
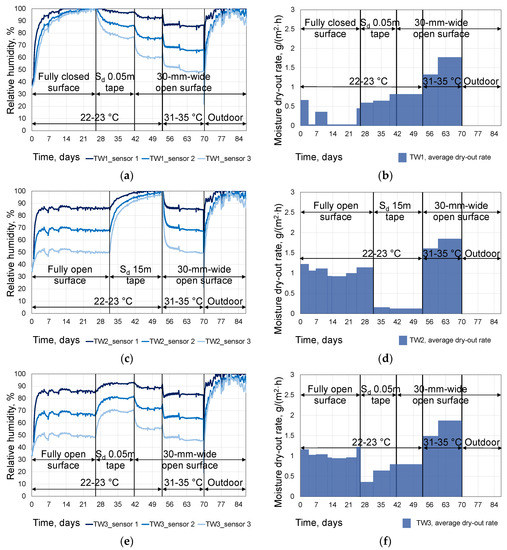
Figure 12.
Measured RH inside TW1 (a), TW2 (c) and TW3 (e) at different heights (sensor 1 is located closest to the water container, sensor 2 in the middle of the TW and sensor 3 at the highest point) and measured moisture dry-out rates of the TWs (b,d,f) during various parts of the test.
From the data in Figure 12a, it can be seen that the RH levels in the sandwich panel rise quickly over 90% if the panel is sealed vapour tight. Water vapour saturation was reached in every measured point in 26 days. The moisture dry-out rate (Figure 12b) for the corresponding period was negligible with the exception of the measurement results in the first week of the test. Some vapour leakages were determined around the water container; these were sealed (Figure 13) and afterwards the dry-out rate was close to 0 g/(m2∙h). The same additional sealing was also applied around the water containers of TW2 and TW3.
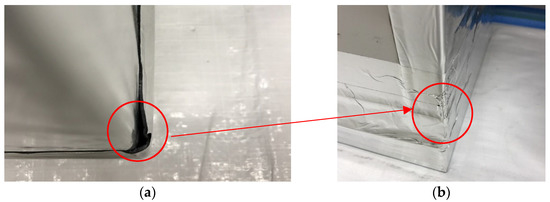
Figure 13.
During the measurement of water vapour saturation speed in TW1, an unexpected reduction of weight occurred. After examining the TW, a leakage point was found (a). Additional aluminium foil tape was added (b) to prevent unwanted vapour diffusion.
The RH levels in TW2 and TW3 were distributed equally, corresponding to the distance from the water level. The water vapour was able to dry out without additional resistance (up to day 32 on TW2, Figure 12c and up to day 26 on TW3, Figure 12e). The dry-out rate during these periods was about 1 g/(m2∙h) (Figure 12d,f). This could be considered the maximum dry-out rate under these climate conditions. In a later phase of the experiment, when the ambient temperature was increased to 31 °C and then further to 35 °C, the dry-out rate per square metre of the drying surface increased, which could be explained by the greater evaporation energy due to higher temperatures. However, the dry-out rate remained modest at best being 1.5–1.75 g/(m2∙h). It is to be expected that with lower ambient temperatures, the dry-out rate is lower. Unfortunately, due to overlapping experiments, it was not possible to measure the dry-out rate when the TWs were placed in outdoor conditions. Nevertheless, the measured RH levels indicate that due to the high RH in the outside environment, the insulation core in the TWs quickly saturated with water vapour and in such conditions the dry-out capacity was negligible.
The dry-out capacity was close to 0 g/(m2∙h) with the vapour-retarding (Sd 15 m) tape (Figure 12d) and around 0.5 g/(m2∙h) with the vapour-permeable (Sd 0.05 m) tape (Figure 12b,f). This is in correlation with the measured RH readings, which show that the RH levels reach saturation with the vapour-retarding tape, making it comparable to a fully vapour sealed enclosure. With the vapour-permeable tape, the RH levels stabilised on a higher level compared to the situation without any added tapes.
3.2. Simulation Results
With laboratory measurements, it became evident that the moisture dry-out capacity of the steel-faced sandwich panels is limited. The simulations were necessary to study the humidity regime of an entire sandwich panel over the course of three years with different initial moisture contents, joint tapes, and solar radiation conditions.
The simulation results with a water vapour-permeable tape (Sd 0.05 m) over the panel joint show that with the initial moisture content corresponding to overhygroscopic level, the outer layer of the stone wool insulation core will experience water vapour saturation conditions for more than 510 days if no solar radiation reached the surface of the sandwich panel (Figure 14a). It would take about two years until the RH levels equalised at the levels produced if the initial RH had been 80% (Figure 14a).
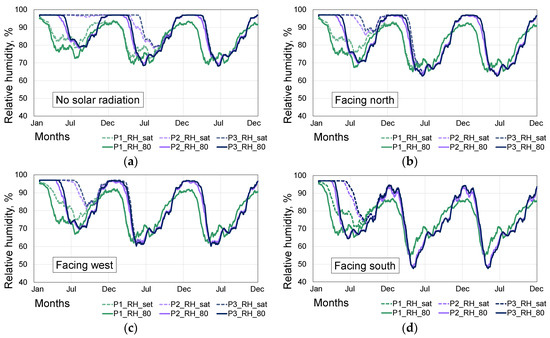
Figure 14.
Twenty-eight-day moving average of simulated RH levels in the outermost 3-mm-thick layer of the mineral wool core at various distances from the panel joint (P1 being closest to the joint, P2 = at one-quarter of the panel; P3 = at half of the panel) and with an initial RH of 80% and at the level of water vapour saturation (dashed lines) of a sandwich panel wall fully shaded (a) or facing north (b), west (c) or south (d).
The environment in the sandwich panel would become less humid with solar radiation on the surface of the wall (Figure 14b–d). Nevertheless, the RH in the centre of the panel would stay at water vapour saturation level for more than 200 days if the wall were facing west (Figure 14c). This is 75 days more than if the initial RH were 80%. For the south direction, the initial humidity levels are comparable to those of the westward facing wall, but during the following summers, the RH level decreased more in the south-facing wall (Figure 14d). However, the wall with the initial moisture content on water vapour saturation level still needed over 10 months to equalise with the RH levels of the wall with the initial RH of 80%.
It is noteworthy that walls with the initial RH of 80% are also reaching the overhygroscopic water limit during wintertime if the walls are not facing south, i.e., are receiving little solar radiation. This is probably due to the vapour-permeable wind barrier tape allowing water vapour from outside to enter the internals of the sandwich panel.
The 28-day moving average of simulated RH levels (Figure 15) in the middle of the panel in the outermost 3 mm thick layer of the mineral wool core with varying initial moisture contents and without any solar radiation show that when using the vapour-permeable (Sd = 0.05 m) tape (Figure 15a), the RH will stabilise for most initial moisture content levels after one year, reaching the overhygroscopic RH level in winter even if the initial moisture content was close to 0 kg/m3. Evidently, when using the vapour-retarding (Sd = 15 m) tape, the outer layer of the insulation core will remain at approximately the level of overhygroscopic moisture indefinitely if the initial RH is more than 80% (Figure 15b). The RH inside the sandwich panel did not reach the overhygroscopic level with lower initial moisture contents corresponding to < 50% RH during the simulated period, but the model with an initial moisture content of 0 kg/m3 showed a tendency of rising RH.
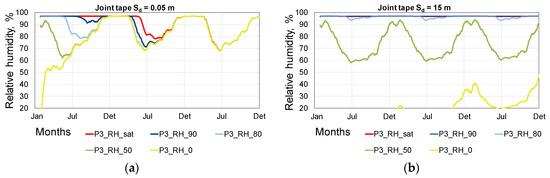
Figure 15.
Twenty-eight day moving average of simulated RH levels in the outermost 3-mm-thick layer of the mineral wool core in the middle of the panel (output P3) with varying initial RH with a vapour-permeable (a) and a vapour-retarding (b) tape over the panel joint.
The calculated time of wetness (TOW) in the middle of the panel in the outermost 3-mm-thick layer of the mineral wool core reaches a constant level after three years from the simulation start at about 2000 h/year when using the vapour-permeable (Sd = 0.05 m) tape regardless of the initial moisture content (Figure 16a). TOW would reach to about 5400 h with initial moisture content corresponding to 80% RH or more, had a vapour-retarding (Sd = 15 m) tape been used (Figure 16b). TOW stays below 200 h/year with vapour-retarding tapes and low initial moisture content (≤50%) but tends to rise each year.
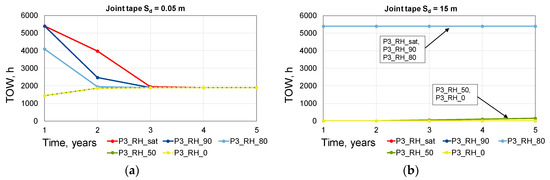
Figure 16.
Calculated TOW from the simulated temperature and RH levels in the outermost 3-mm-thick layer of the mineral wool core in the middle of the panel (output P3) with varying initial RH with a vapour-permeable (a) and a vapour-retarding (b) tape over the panel joint.
The spatial distribution of RH in the sandwich panel on day 183 (summer) illustrates how moisture would be distributed in the panel using a vapour-retarding (Figure 17a) or a vapour-permeable tape (Figure 17b) on the vertical joint. Relative humidity becomes evenly distributed with the vapour-retarding tape. This suggests that the dry-out is negligible when using these tapes. If the RH in the panel had equalised to 80% before it was sealed with a vapour-retarding tape, the outermost layer would experience conditions near the overhygroscopic limit even during a warm season (Figure 17a). If vapour-permeable tapes are used, the RH levels in the panel will be below 90% (Figure 17b) and mostly influenced by the outside climate.
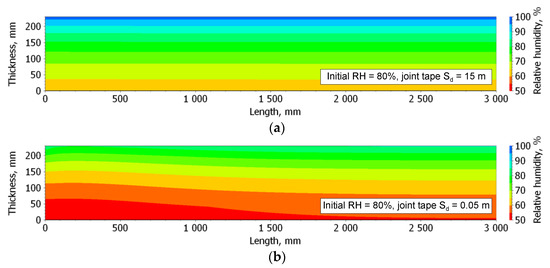
Figure 17.
Simulated spatial distribution of RH in the sandwich panel on day 183 (summer) with vapour-retarding (a) and vapour-permeable (b) tapes over the panel joint (the upper left corner in the graphs) with an initial RH of 80%.
However, this means that with the vapour-permeable tape, the panel also acquires excessive moisture from the outside environment. This will lead to RH levels reaching the overhygroscopic limit during wintertime in the outermost layers even if the initial RH were 50% (Figure 18b). This does not happen when using vapour-retarding tapes (Figure 18a).
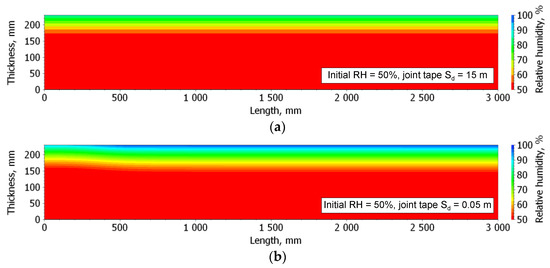
Figure 18.
Simulated spatial distribution of RH in the sandwich panel on day 365 (winter) with vapour-permeable (a) and vapour-retarding (b) tapes over the panel joint with an initial RH of 50%.
3.3. Critical Rain Amount and Moisture Safety Measures
The results from the laboratory test showed a limited dry-out capacity and the simulations indicated a high TOW level with vapour-retarding tapes and initial moisture contents corresponding to 80% RH or more. The difference in the moisture content corresponding to 80% RH and water vapour saturation level is very small: 0.157 kg/m3 or 3.61 × 10⁻² kg for a panel with the volume of 0.23 m3. Assuming the density of water to be 1000 kg/m3 makes the volume of this amount to be 3.61 × 10⁻⁵ m3. This corresponds to roughly 1.57 × 10⁻⁴ m or ≈0.16 mm of water column over the surface with the dimensions of 0.23 m by 1 m. This is a remarkably small amount. For triple the volume (e.g., had the wall enclosure been 3 m high), this would be ≈0.5 mm. Which means that a very small amount of rain would be enough to raise the moisture content to water vapour saturation levels inside the sandwich wall, had the rain ingressed the enclosure. For example, the mean precipitation amount per one wet day is 5.4 mm in Estonia [27], and a rainfall event is considered as heavy when the accumulated sum of precipitation is over 50 mm per day [28]. In a study discussing heavy rainfalls in Estonia, the authors reported that in total 509 heavy precipitation events occurred in Estonia during a 44-year period [28].
Due to the combination of a limited dry-out and the possibility of a long time of wetness had a small amount of rain entered the panel, guidelines to enhance the moisture safety of such structures are presented in accordance with and in addition to the Swedish industry standard for moisture safety of the construction process [29].
- A moisture management plan should be prepared considering the limited dry-out rate up to 2 g/day (without tapes, in favourable conditions) through a 30-mm-wide and 3-m-long joint.
- The moisture management plan should also consider that the panels must not equalise to ambient air conditions if ambient RH > 80%. A protective film on the exposed sides of the insulating core must be in place from the factory if such conditions or rain might occur. The film should be removed before the installation of the panels.
- If ambient RH > 80% during storage and installation, then vapour-permeable tapes must be used to cover the outer joints.
- A moisture safety officer should be on site during the installation of the panels.
- Moisture inspection rounds must be carried out regularly.
- Spot measurements of humidity in the panels are recommended.
- In the case of water ingress, all free water must be immediately removed from the structure and t&RH sensors must be installed where the leakage occurred.
- ○
- If RH > 80% inside the panel, then aided drying is necessary and outer joints must not be covered with vapour-retarding tapes.
- Non-conformances in relation to the moisture safety plan must be documented.
4. Discussion
The findings of the laboratory test and the following simulations indicate that the dry-out capacity of steel-faced sandwich panels is low (about 1 g/(m2∙h)) even if there is no wind barrier tape covering the vertical joint, which is the only area where moisture dry-out could occur at a significant level.
A dry-out rate of 1 g/(m2∙h) means that the moisture dry-out would be about 2 g/day through a standard 30 mm wide and 3 m long vertical joint. The laboratory test demonstrated that when the vertical joint is covered with a vapour-permeable tape, the moisture dry-out will be reduced to a half of that of an uncovered joint (to 1 g/day). Moisture dry-out is also temperature driven and the dry-out rates presented here would appear under the most favourable conditions (high ambient temperature and low external RH). It is to be expected that with lower ambient temperatures, the dry-out rate is even lower.
If the joint were covered with a vapour-retarding tape, no moisture dry-out is to be expected and in case of any water ingress into the insulation space, water vapour saturation would persist in the outer layers of the insulation core. This could have a negative impact on the glue adhering the steel sheet to the insulation core or to the steel sheet itself [2,13]. Pfeiffer reported the results of different temperature and humidity conditions on the tensile strength of a sandwich panel with mineral wool core. His research suggests that the tensile strength decreases the most when the sandwich panel experiences water vapour saturation and overall it is expected that increased humidity and temperature lead to a faster loss in strength [13]. Moreover, research shows that persisting elevated moisture content of mineral wool reduces its compressive strength and thermal insulation function significantly [14,17]. All of which leads to durability issues and lesser sustainability of the overall structures.
In the simulations, a comparison was made between the situation with an initial moisture content corresponding to a water vapour saturated level and 80% RH. The results indicate that the vapour-permeable tape indeed allowed moisture to dry out; however, the process would be slow and it would take 10 to 24 months for the humidity levels to equalise with the levels produced by an initial RH level of 80% depending on the presence of solar radiation (from exposed directly towards south to a fully shaded situation). This suggests that moisture ingress could have a negative impact on the longevity of the structure regardless of the use of vapour-permeable tapes over joints. Nevertheless, the vapour-permeable tapes indeed help to clear out excess moisture from the panel.
However, the simulations also indicate that the vapour-permeable tape allows vapour to enter the structure from outside and, regardless of the initial moisture content, an equilibrium state will arrive where there is an environment with high humidity levels over three months during the wintertime. This is something to be considered when using the vapour-permeable tapes of the joints—whether the yearly recurring high moisture levels are problematic or not.
Further simulations demonstrated that when using the vapour-retarding tape, there was little vapour flow into the sandwich panel and with initial moisture contents corresponding to >50% RH, the humidity levels in the panel did not reach the overhygroscopic limit during the three-year simulation period. However, it was evident that even with the relatively vapour-retarding tape, the RH levels inside the panel still tended to rise. This suggests that over the course of the building lifespan, unfavourable conditions might occur. It is also common that these panels are installed during periods when the outside air RH is over 80% and if the panel had equalised to these conditions the outer layer of the insulation core would experience persisting water vapour saturation, leading to possible damage.
TOW calculations indicated that regardless of the initial moisture content, TOW will stabilise to level T3 if vapour-permeable tapes are used. This suggests that if the airborne salinity contamination and the concentration of sulphur compounds in the sandwich panel are low, the corrosivity category of the inside environment of the sandwich panel would be up to C3 or medium [25]. In more aggressive environments or when using vapour-retarding tapes, the corrosivity category could reach C4.
It is advisable to supply the panels sealed with a protective film over the exposed insulation core so that they would not adsorb moisture during the storage or installation process. This is to avoid the panel equalising to high RH (e.g., >80%) conditions, which could lead to persisting water vapour saturation in the external layer of the insulating core and a high TOW value. The protecting film should be removed right before the installation of the sandwich panel. The combination of limited moisture dry-out and the possibility of persisting water vapour saturation conditions in the outer layer of the insulation core due to small amount of rain leads us to suggest that the storage and installation process of such panels must be well managed. Other research also recommends the inclusion of moisture safety management in the building process to maintain a dry building process [11]. More research is needed to determine the limiting time of wetness or humidity criteria for such panels. A degradation model could be useful. The degradation model should consider corrosion, decomposition of the adhesive between steel and mineral wool, change of strength or thermal properties of the mineral wool and mould risk (if there is a possibility of air leakages to the indoor environment).
5. Conclusions
This study investigated the moisture dry-out capacity and the hygrothermal regime of a steel-faced sandwich panel with mineral wool insulation. A series of laboratory tests and heat, air and moisture transport simulations were carried out. The results indicate that the moisture-dry out capacity of the studied sandwich panels is limited (up to 2 g/day through a standard 30-mm-wide and 3-m-long vertical joint without covering tapes in favourable conditions). When the vertical joint is covered with a vapour-permeable tape, the moisture dry-out will be reduced to a half of that of an uncovered joint (to 1 g/day) and if the joint were covered with a vapour-retarding tape, no moisture dry-out is to be expected. Use of vapour-retarding tapes on the outer joints will lead to persisting high humidity conditions and a high TOW value inside the panel if the initial relative humidity is higher than 80%. Vapour-permeable tapes allow moisture to dry out, but the rate of 1 g/day for a standard size panel leads to a time-consuming dry-out if there is any water leak into the panel. It is recommended that the sandwich panels be supplied on site in a sealed condition so that they would not adsorb moisture before installation and that, during the construction time, weather protection be used to avoid water ingress into the panels. The panels must not equalise to the outside air conditions if the air RH is 80% or higher. The inside to the steel sheets should withstand an environment with a corrosivity category at least C3 even with thorough moisture management and vapour-permeable tapes or C4 when using vapour-retarding tapes. The results indicate that very little moisture could lead to conditions where damages might occur. This means that the protection method should not allow water to enter the insulation space and in case of water ingress all free water must be immediately removed from the structure and additional aided drying is necessary if the RH in the panel exceeds 80%. This study confirms that construction time moisture management is also important with structures that are regarded as moisture tolerant under usage conditions.
Author Contributions
Conceptualization, K.K. and T.K.; methodology, K.K. and T.K.; investigation, K.K. and H.P.; writing and visualization—original draft, K.K.; writing—review and editing, K.K. and T.K.; supervision, T.K.; funding acquisition, T.K. All authors have read and agreed to the published version of the manuscript.
Funding
This research was supported by the EC—Research Programme of the Research Fund for Coal and Steel—HAIR—Improved Durability of Steel Sandwich Panel Constructions regarding Hygrothermal and AIRtightness Performance (grant No. 754185), Estonian Centre of Excellence in Zero Energy and Resource Efficient Smart Buildings and Districts, ZEBE (grant No. 2014–2020.4.01.15-0016) and funded by the European Regional Development Fund, by the Estonian Research Council (grant No. PRG483), and by the European Commission through the H2020 project Finest Twins (grant No. 856602).
Conflicts of Interest
The authors declare no conflict of interest.
References
- Khan, T.; Acar, V.; Aydin, M.R.; Hülagü, B.; Akbulut, H.; Seydibeyoğlu, M.Ö. A review on recent advances in sandwich structures based on polyurethane foam cores. Polym. Compos. 2020, 41, 2355–2400. [Google Scholar] [CrossRef]
- Davies, J.M. Lightweight Sandwich Construction; Davies, J.M., Ed.; Blackwell Science Ltd.: Oxford, UK, 2008; ISBN 9780470690253. [Google Scholar]
- Hill, C.; Norton, A.; Dibdiakova, J. A comparison of the environmental impacts of different categories of insulation materials. Energy Build. 2018, 162, 12–20. [Google Scholar] [CrossRef]
- Llantoy, N.; Chàfer, M.; Cabeza, L.F. A comparative life cycle assessment (LCA) of different insulation materials for buildings in the continental Mediterranean climate. Energy Build. 2020, 225, 110323. [Google Scholar] [CrossRef]
- Peris Mora, E. Life cycle, sustainability and the transcendent quality of building materials. Build. Environ. 2007, 42, 1329–1334. [Google Scholar] [CrossRef]
- Spitzner, M.H.; Koschade, R.; Cammerer, J. Entwicklung eines Sandwichelements mit Energie-Akkumulation, Energieverteilung und Dämmung (SEA). In FIW München Geschäfts-und Tätigkeitsbericht 2010; Forschungsinstitut für Wärmeschutz e.V. München: Gräfelfing, Germany, 2010. [Google Scholar]
- Pihelo, P.; Lelumees, M.; Kalamees, T. Influence of Moisture Dry-out on Hygrothermal Performance of Prefabricated Modular Renovation Elements. Energy Procedia 2016, 96, 745–755. [Google Scholar] [CrossRef]
- Kukk, V.; Külaots, A.; Kers, J.; Kalamees, T. Influence of interior layer properties to moisture dry-out of CLT walls. Can. J. Civ. Eng. 2019, 46, 1001–1009. [Google Scholar] [CrossRef]
- Pihelo, P.; Kalamees, T. Commissioning of moisture safety of nZEB renovation with prefabricated timber frame insulation wall elements. Wood Mater. Sci. Eng. 2019, 1–8. [Google Scholar] [CrossRef]
- EU 305/2011 Regulation of the European Parliament and the Council laying down harmonised conditions for the marketing of construction products and repealing Council Directive 89/106/EEC. Off. J. Eur. Union 2011, 54, 5–43. [CrossRef]
- Mjörnell, K.; Arfvidsson, J.; Sikander, E. A Method for Including Moisture Safety in the Building Process. Indoor Built Environ. 2012, 21, 583–594. [Google Scholar] [CrossRef]
- Olsson, P.; Tjäder, E. Suggestions for adjustment of ByggaF to improve the current use and suit the process of renovation. Energy Procedia 2017, 132, 921–926. [Google Scholar] [CrossRef]
- Pfeiffer, L. Durability Assessment of Sandwich Panel Construction. Ph.D. Thesis, University of Surrey, Guildford, UK, 2005. [Google Scholar]
- Ivanič, A.; Kravanja, G.; Kidess, W.; Rudolf, R.; Lubej, S. The Influences of Moisture on the Mechanical, Morphological and Thermogravimetric Properties of Mineral Wool Made from Basalt Glass Fibers. Materials 2020, 13, 2392. [Google Scholar] [CrossRef] [PubMed]
- EN 13523-26:2014—Coil Coated Metals—Test Methods—Part 26: Resistance to Condensation of Water; Technical Committee CEN/TC 139 “Paints and varnishes”; National Standards Authority of Ireland: Dublin, Ireland, 2014.
- Karamanos, A.; Hadiarakou, S.; Papadopoulos, A.M. The impact of temperature and moisture on the thermal performance of stone wool. Energy Build. 2008, 40, 1402–1411. [Google Scholar] [CrossRef]
- Jerman, M.; Černý, R. Effect of moisture content on heat and moisture transport and storage properties of thermal insulation materials. Energy Build. 2012, 53, 39–46. [Google Scholar] [CrossRef]
- Laukkarinen, A.; Vinha, J.; Kalbe, K.; Kesti, J.; Kalamees, T.; Honkakoski, E. Laboratory tests and modelling of mineral wool insulated steel sandwich panels. E3S Web Conf. 2020, 172, 17006. [Google Scholar] [CrossRef]
- Greenspan, L. Humidity fixed points of binary saturated aqueous solutions. J. Res. Natl. Bur. Stand. 1977, 81, 89–96. [Google Scholar] [CrossRef]
- Nicolai, A.; Grunewald, J.; Zhang, J.J. Recent improvements in HAM simulation tools: Delphin 5/CHAMPS-BES. In Proceedings of the 12th Symposium for Building Physics, Dresden, Germany, 29–31 March 2007; pp. 866–876. [Google Scholar]
- Sontag, L.; Nicolai, A.; Vogelsang, S. Validierung der Solverimplementierung des Hygrothermischen Simulationsprogramms Delphin; Technische Universität Dresden: Dresden, Germany, 2013. [Google Scholar]
- Kalbe, K.; Piikov, H.; Kesti, J.; Honkakoski, E.; Kurnitski, J.; Kalamees, T. Moisture dry-out from steel faced insulated sandwich panels. E3S Web Conf. 2020, 172, 17007. [Google Scholar] [CrossRef]
- Kalamees, T.; Vinha, J. Estonian Climate Analysis for Selecting Moisture Reference Years for Hygrothermal Calculations. J. Build. Phys. 2004, 27, 199–220. [Google Scholar] [CrossRef]
- EN 15026 Hygrothermal Performance of Building Components and Building Elements—Assessment of Moisture Transfer by Numerical Simulation; Technical Committee CEN/TC 89 “Thermal performance of buildings and building components”; European Committee for Standardization: Brussels, Belgium, 2007.
- ISO 9223:2012—Corrosion of Metals and Alloys—Corrosivity of Atmospheres—Classification, Determination and Estimation. Available online: https://www.iso.org/standard/53499.html (accessed on 12 October 2020).
- Hoseinpoor, M.; Prošek, T.; Babusiaux, L.; Mallégol, J. Toward more realistic time of wetness measurement by means of surface relative humidity. Corros. Sci. 2020, 177, 108999. [Google Scholar] [CrossRef]
- Tammets, T.; Jaagus, J. Climatology of precipitation extremes in Estonia using the method of moving precipitation totals. Theor. Appl. Climatol. 2013, 111, 623–639. [Google Scholar] [CrossRef]
- Mätlik, O.; Post, P. Synoptic weather types that have caused heavy precipitation in Estonia in the period 1961–2005. Est. J. Eng. 2008, 14, 195–208. [Google Scholar] [CrossRef]
- ByggaF Industry Standard ByggaF—Method for Moisture Safety of the Construction Process. Branschstandard ByggaF—Metod för fuktsäker byggProcess, Version 08/05/2013 (English translation); 2013. Available online: http://www.fuktcentrum.lth.se/verktyg-och-hjaelpmedel/fuktsaekert-byggande/byggaf-metoden/ (accessed on 12 October 2020).


Publisher’s Note: MDPI stays neutral with regard to jurisdictional claims in published maps and institutional affiliations. |
© 2020 by the authors. Licensee MDPI, Basel, Switzerland. This article is an open access article distributed under the terms and conditions of the Creative Commons Attribution (CC BY) license (http://creativecommons.org/licenses/by/4.0/).