Abstract
Ecosystem services (ES) are essential for human well-being. However, few studies have investigated the optimization of the management of water resources based on trade-offs of ES in arid areas. In order to solve this problem, four important ES that affect the carbon cycle and water cycle were selected from the regulating ecosystem services (carbon storage (CAS), evapotranspiration (ET)), the supporting ecosystem services (soil drought index (TVDI)) and the provisioning ecosystem services (groundwater depth (GWD)) in arid areas. The spatiotemporal distribution of these four ES were quantitatively analyzed—using related models—in the Tarim River, situated in a typical arid inland basin, in 2000, 2010, and 2018, in order to determine the fundamental driving factors of change in ES. The results showed that CAS was mainly affected by changes in land use, while ET, TVDI, and GWD were mainly affected by changes in water volume. The unified management of water resources improved the regulating ecosystem services (an initial increase in CAS, followed by a decrease; ET continued to grow from 2000 to 2018), the supporting ecosystem services (TVDI was maintained at 0.69–0.74), and the provisioning ecosystem services (GWD rose 5.77% in 2000–2010, and stabilized at 3.05 m in 2018). The trade-off/synergy relationships of the four ES were further analyzed at different geographical scales through correlation analysis and the trade-off index (RMSD). In different river sections, the ES that affect carbon and water cycles were highly dependent on each other. In areas with high CAS, the groundwater depth was low, and the soil moisture and ET were high. With different land use types, there was a synergistic relationship between CAS and GWD in woodland and grassland areas, and between ET and GWD in farmland areas. This showed that there was still strong competition between natural vegetation and groundwater, represented by woodland and grassland, and the ineffective loss of water resources such as ET through expansion of farmland. Finally, this study innovatively incorporated the results of trade-offs of ES into water resource management. In order to reduce the trade-offs between ES, and to improve ES, to achieve the ecological protection and restoration of desert riparian forests, and to optimize the water resource management in arid areas, different ecological water regulation and control measures were proposed in the high-flow years and the low-flow years of arid areas. This study can provide important scientific references for the improvement of ES and the optimization of the management of water resources in other similar river basins in arid areas.
1. Introduction
Ecosystem services (ES) are the natural environmental conditions and effects formed and maintained by ecosystems and ecological processes, as well as the benefits directly or indirectly derived from the ecosystem, upon which humans and other organisms depend for their existence [1,2]. The Millennium Ecosystem Assessment further expands upon the concept of ecosystems, dividing ES into: supply services (e.g., food and water), support services (e.g., soil formation and nutrient cycling), regulation services (e.g., climate regulation, water purification, and carbon storage), and cultural services (e.g., entertainment and education) [3]. ES are closely related to human well-being. In the past half century, the sharp decline of ES has negatively affected human well-being, and has seriously threatened human health and survival [3]. Therefore, researchers and organizations have strengthened the comprehensive assessment of ES in order to maintain their long-term supply capacity, and to enhance ecosystem stability [4,5,6,7]. There are usually three kinds of inter-relationships among ES: synergy, independence, and trade-off relationships [5,8]. When people maximize the benefits of one or more ecosystem services, they often unintentionally affect the supply of the others. This relationship mechanism is defined as a trade-off or synergy [9]. The neglect of the trade-off/synergy between ES will reduce the supply capacity of certain ES, and may even pose challenges to the stability and security of the entire ecosystem. Land use is a significant factor associated with ES provisioning [5]. Quantifying the relationships between land use changes and the changes in ES can help us to understand more deeply the mechanisms related to the enhancement of any given ES, and could provide useful guidance for potential ecological restoration strategies in the future [3,7]. Trade-off analysis provides a theoretical basis for land use decision-making, and balancing ecological restoration and ecosystem services should be the main task of today’s land use policies [5,9]. To date, many studies have used different methods to quantitatively evaluate and weigh the relationship between different ES [10,11,12,13,14,15]. Correlation analysis is one of the most commonly used methods. According to correlation analysis, the trade-off relationships between different ES can be qualitatively evaluated, and an operational standard can be provided for land use management policies and ecosystem protection [16,17,18,19]. In addition, through the combination of correlation analysis and principal component analysis, and using the trade-off index to quantify the trade-offs and synergies between different ES, the main influencing factors of the trade-offs and changes of different ES can be determined, so as to manage the ecosystem and its landscape more scientifically [20,21]. Therefore, the study of trade-off analysis will help us to understand the connection between multiple ES, which is of great significance for the management of regional ecosystems and the promotion of human well-being [22,23].
At present, the global ecological environment is facing major changes, especially in arid regions. Environmental problems—such as increased water resource conflicts caused by climate change and the over-exploitation of water resources, reduced vegetation coverage, and increased groundwater depth (GWD) (i.e., the depth from the land surface to the groundwater surface in groundwater monitoring wells)—have placed enormous pressure on ES (i.e., climate regulation, water circulation, and water supply) [24,25,26,27,28]. These ecological and environmental problems have seriously affected the stability, integrity, and sustainability of ES, and have ultimately caused the loss of their supply capacity [29,30]. Regulating ecosystem services mainly play a role and support each other in natural ecosystems, since they are, by their nature, closely related to ecosystem structures, processes and functions [13]. Carbon storage is an ecosystem process that produces several important ecosystem services, both as a supply service (i.e., the provisioning of wood, fiber and fuel) and as a regulatory service (i.e., regulating the concentration of greenhouse gases in the atmosphere and mitigating global warming) [31]. Therefore, carbon storage has become the focus of many scholars in the field of ecosystem services in arid areas. For example, with the implementation of the GFGP (Grain-for-Green Program), the NPP (net primary productivity) and NEP (net ecosystem productivity) in the Loess Plateau ecosystem have steadily increased, and carbon storage has been significantly improved [32]. As another supporting service in arid areas, the water cycle is essential for the maintenance of desert oases and human survival [3]. Although ET, soil moisture and groundwater are not specific ES in the classification of ES, they are closely related to ecosystem processes and functions, and are important components of the water cycle, and are prerequisite for the provision of ES [3,13,31]. Coupled with special conditions, such as low precipitation, high ET, warming and dry climate in arid areas, soil moisture and groundwater reserves are very small, resulting in reductions in vegetation biomass or stunted growth [27,31]. Therefore, soil moisture is extremely important to the growth of herbs in arid areas, and for some large forests and shrubs, groundwater serves as a special water storage and water supply service to maintain their growth [30,31,33]. In addition, soil moisture and groundwater are the important basis for vegetation restoration in arid areas, and vegetation cover is the basis for soil erosion control, carbon sequestration and biodiversity. In this sense, we can treat soil moisture as a supporting service, and groundwater as a provisioning service [3,31]. Moreover, soil moisture and ET are the most important variables regulating many ecosystem processes in water-limited landscapes, and soil desiccation has a negative effect on these processes. Thus, soil moisture and ET are also scarce regulating services in arid areas [13,31,34,35].
The purpose of water resource management is to solve the protection and utilization problems related to the resources of river basins, to improve ecosystem service functions, and ultimately to achieve sustainable development with regard to river basins [30,36,37,38]. At present, the basin management model has changed from partial management to overall management, and from decentralized management to integrated management. In 1993, the Tennessee Valley Authority was established in the USA—the first basin management organization in the world—and many basins have since established similar management organizations [39,40,41,42,43,44]. However, because these management models mainly concentrate on the development and utilization of water resources, they have been restricted by the management of administrative regions, and are not conducive to the systematic and scientific management of the river basin. With increasing conflicts in water resources, ecosystem service functions continue to decline. An integrated management model was gradually developed in the 1990s; its goal was to coordinate ecological protection and resource utilization, improve water-related ES, and realize the sustainable development of water resource management [45,46,47,48,49]. In arid areas where water resources are scarce, social and economic development lags behind, and the ecological environment is fragile. In oasis and desert riparian forest ecosystems, the generation and supply of ES is dependent on the water and carbon cycle processes, and the rational allocation of water resources is essential for the stability and security of ES [50]. For example, Central Asia is a region with severe cross-border water resource conflicts. The zoning management of the upper and middle reaches of the Aral Sea basin has resulted in downstream flow interruption, and the severe shortage of water resources has seriously degraded the vegetation in the lower reaches of the Aral Sea basin, reduced the transpiration rate of plants, increased the degree of soil drought, reduced evapotranspiration (ET), and further aggravated GWD. A series of ecological and environmental problems has reduced the region’s biodiversity and ecosystem carbon storage (CAS) capacity, and slowed the carbon cycle, weakening the climate regulation services of the basin. At the same time, the flow interruption downstream has blocked the water cycle in the entire basin, resulting in serious damage to water-related ES such as water regulation and water supply. The Aral Sea crisis has become the focus of attention of many studies [51,52,53]. The success of integrated water resource management depends on balancing the health and safety of ecosystems with human needs and preferences [54]. For ecosystem management, the key to achieving these two goals lies in the effective integration of scientific information and the impact of ecosystems on human well-being, and ES are dedicated to this integration [55]. Both water resource management and ES emphasize the key role of integrating competing interests in environmental decision-making. This similarity and correlation show that the management of water resources based on trade-offs between ES is of great significance [56]. However, research on ES in arid and semi-arid areas of the world has mainly focused on improving ecosystem management by evaluating the interaction of ES under land use/cover change. For example, studies on arid and semi-arid areas in Spain, Iran, Central Asia, and China mainly focus on evaluating the trade-offs and interactions between ES (i.e., food production, water production, soil erosion control, and CAS), and providing scientific methods for ecosystem management [15,19,57,58,59]. Other research has focused on evaluating the importance of ES through field surveys of local residents [60]. To date, especially in arid areas, there has been very little research related to the integration of the trade-offs of ES into water resource management. How to optimize the management of water resources based on the results of trade-offs of ES in arid areas is a major issue faced by many researchers and river basin managers.
The objectives of this paper are: (1) to reveal the trade-offs/synergies between ES based on the changes and interactions of ES, and (2) to achieve the optimal management of water resources in arid areas. To this end, four important ES that affect the carbon and water cycles were selected from the regulating ecosystem services (carbon storage (CAS), evapotranspiration (ET)), supporting ecosystem services (soil drought index (TVDI)), and provisioning ecosystem services (groundwater depth (GWD)) in arid areas. This paper quantified four ES and their trade-offs/synergy relationships in order to reveal the fundamental driving mechanism of changes in ES. Finally, the results of the trade-offs of ES were applied to water resource management to guide basins management in arid areas. This study can provide important scientific references for improving ES and optimizing the management of water resources of similar river basins in arid areas.
2. Data and Methods
As a regulating ecosystem service, CAS plays an important role in the study of the carbon cycle, carbon sinks/sources, and climate change mitigation in arid areas [31]. The water cycle is another important supporting ecosystem service in arid areas; ET, soil moisture and groundwater are its important components, and are the prerequisites for the provision of ES [3]. In addition, soil moisture and ET are scarce regulating services in arid areas [13,31], while groundwater is an important water storage and water supply service, and is one of the most functional suppliers of life support in arid areas [3,30]. Therefore, this study selected four important ES that affect the carbon and water cycles of the basin ecosystem in arid areas, from the regulating ecosystem services (carbon storage (CAS), evapotranspiration (ET)), supporting ecosystem services (soil drought index (TVDI)) and provisioning ecosystem services (groundwater depth (GWD)), by quantifying ES and their trade-offs/synergies, revealing the driving mechanism of the changes in ES in order to guide the management of water resources in arid areas, and to provide a scientific reference for the optimal management of water resources in arid areas (Figure 1).
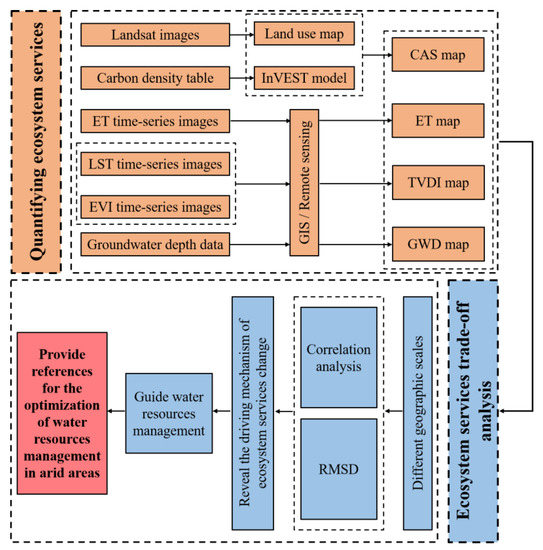
Figure 1.
Flowchart of the study. CAS, carbon storage; ET, evapotranspiration; GWD, groundwater depth; TVDI, soil drought index.
2.1. Research Region
The Tarim River basin (34.20–43.39° N, 71.39–93.45° E) is located in southern Xinjiang, China, adjacent to the Taklimakan Desert (Figure 2). The basin consists of 144 tributaries in nine major rivers, namely the Aksu River, the Yarkand River, the Hotan River, the Keriya River, the Dina River, the Kashgar River, the Kaidu-Kongqi River, the Weigan River, and the Cheerchen River [30]. The Tarim River is 1321 km long, with a total area of 1.02 × 10⁶ km2 [33]. It does not produce its own run-off, and is a pure dissipative inland river. The run-off mainly comes from melting ice and snow in alpine areas. It is divided into four river sections: Alar-Xinqiman, Xinqiman-Yingbaza, Yingbaza-Wusman, and Wusman-Qiala sections. In recent years, due to the over-exploitation of soil and water resources, only the Aksu, Hotan, Yarkand, and Kaidu-Kongqi Rivers discharge into the Tarim River, forming a pattern comprising four sources and one trunk [27]. The study area is a typical temperate arid continental climate, with an average temperature of 10.5–11.4 °C, annual precipitation of only 20 mm, and evaporation of up to 2500–3000 mm. The desert riparian forest in the Tarim River basin is composed mainly of Populus euphratica and Tamarix, and the herbs include reed, Apocynum venetum, and licorice (Glycyrrhiza glabra), amongst others [33]. The lithology of the aquifer in the main stream of the Tarim River is basically the same, with fine silty sand and medium fine sand above 300 m. Therefore, the water permeability and richness of the aquifer are uniformly distributed, with little change [61].
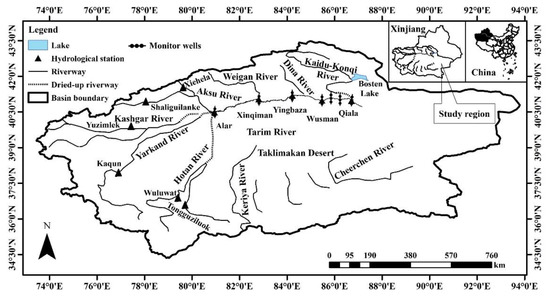
Figure 2.
Overview of the Tarim River basin and the study area.
The Tarim River is the largest inland river in China, and the fifth largest inland river in the world. From 1950 to 2000, due to the over-utilization and exploitation of water resources in the source area of the Tarim River and the decentralized management of each sub-basin, the amount of water flowing into the Tarim River continued to decrease, desertification and salinization increased, the wetland areas shrank, and degradation of the vegetation worsened. Thus, the Tarim River basin has become a region of serious ecological degradation [62,63]. The previous management model of the Tarim River basin was mainly a single small area management, in which the protection of the ecosystems and water resources was the focus of the various administrative regions. In order to restore the ecosystem, in 2001, the Chinese government invested 10.7 billion yuan to carry out an emergency project of ecological water replenishment. After the reform of the management system of the Tarim River in 2011, the sub-basin of the headstream areas was uniformly administered by the Tarim River Basin Authority. In order to further strengthen the comprehensive management of the river basin, the ‘river chief system’ was implemented in the Tarim River basin in 2017, with a senior administrative officer serving as the river director and being responsible for coordinating and solving major issues of social and economic development, and ecological protection [30,33,50]. Following the implementation of the unified river basin management, and due to major changes in the management model, the entire river basin has become a unified management unit, of which the government is in charge, with negotiation and cooperation from multiple administrative departments. By 2018, 19 times of ecological water conveyance had been carried out in the Tarim River basin. After the implementation of the comprehensive management, the natural vegetation coverage, the growth of the tree rings of Populus euphratica, and the GDP in the Tarim River basin all increased [30].
2.2. Data Resources
The main sources of data are shown in Table 1. Landsat Thematic Mapper and Operational Land Imager images from the years 2000, 2010, and 2018 were collected from the United States Geological Survey (https://glovis.usgs.gov/) in order to extract the land use data. The resolution of the Landsat images was 30 m, and the images were obtained on days when the vegetation coverage reached the highest in a year, and cloud cover was <10%. In order to obtain the TVDI and ET data, time-series images of the enhanced vegetation index (EVI), land surface temperature (LST), and evapotranspiration (ET) were obtained from the MODIS MOD13Q1 (EVI), MOD11A2 (LST), and MOD16A3GF (ET) datasets, which were released by the NASA EOS data center (https://ladsweb.modaps.eosdis.nasa.gov). The MOD11A2 dataset contains day and night LST data; we used the day LST data. The temporal resolutions of the EVI, LST, and ET images were 16 days, 8 days, and 1 year, respectively, and their spatial resolutions were 250 m, 1 km, and 500 m, respectively. The total number of the selected EVI and LST images was 138 (46 images per year) and 276 (92 images per year), respectively. The hydrological data included: (i) monitoring data for the run-off of the Alar, Xinqiman, Yingbaza, Wusman, and Qiala sections, from 1957 to 2018; (ii) monitoring data for water diversion (i.e., supply water for national economic development through channels and ecological water diversion), return water (i.e., the diverted water that re-enters the river), and riverway loss (i.e., evaporation, leakage water, and overflowing water) for each monitor section (i.e., Alar, Xinqiman, Yingbaza, Wusman, and Qiala) from 2005 to 2018 (no data were available prior to 2005); and (iii) the monthly GWD data of 51 underground monitor wells (distributed in the Alar, Xinqiman, Yingbaza, Shajilike, Shazihekou, Wusman, Aqike, Tieyz, and Qiala sections) from 2010 to 2018. These hydrological data were provided by the Tarim River Basin Authority. In addition, the soil’s organic carbon data in the carbon module of the InVEST model came from the Scientific Data Center for Cold and Arid Regions (http://westdc.westgis.ac.cn/).

Table 1.
Data source.
2.3. Land Use/Cover Maps
The land use/cover data used in this study were Landsat TM image data from the Tarim River, with a resolution of 30 m, taken from July to September in the years 2000, 2010, and 2018. During this period, features such as the abundant water in the basin, rivers and reservoirs, and the luxuriant growth of the natural vegetation and crops, were obvious. The land use was divided into six primary types: farmland, woodland, grassland, water area, construction land, and unused land. The woodland was further divided into closed forestland, sparse woodland, and shrub land. The land use/cover maps were produced using the manual interpretation method. The manual interpretation method is to first use a unified classification system to classify each temporal remote sensing image separately, and then to directly discover land use/cover change information by comparing the classification results [30]. Prior to the interpretation, the GEOSTAR3.0 software was used for the atmospheric correction and geometric correction of the primary multispectral images, and ArcGIS10.4 software was used to make false color composite images for the separate years. The areas with natural vegetation and farmland were determined by visual interpretation. Finally, the Kappa index method was used to test the accuracy of the interpretation results. Combining the survey results of the 108 large samples in the early stage and the field investigation in the later stage, the accuracy of the final inspection results was 89.6%, 90.2%, and 88.9%, respectively.
2.4. Calculation of Riverway Loss
Based on the water balance principle, the water consumption in the river section should be the difference between the incoming water from the upper section and the run-off from the lower section, according to the following equation:
where WC is the water consumption of the river section (108 m3); WUp is the amount of water coming from the upper section (108 m3); and WDown is the annual run-off of the lower section (108 m3).
Water consumption in the mainstream of the Tarim River was mainly due to national economic water diversion, ecological water diversion, and the natural dissipation of the river, resulting in the following water balance equation:
where WC is the water consumption of the river section (108 m3); WN is the national economic water diversion (108 m3); WE is the ecological water supply (108 m3), including the ecological flood diversion of agricultural water diversion and the pure ecological water diversion of ecological sluice; and WR is the natural loss of water in the process of run-off migration, including evaporation, leakage and overflow [30].
2.5. Regulating Ecosystem Services
Carbon Storage
In this study, carbon storage (CAS) was assessed by InVEST, a model assemblage jointly developed by Stanford University, the World Wildlife Fund (WWF), and The Nature Conservancy (TNC), under the auspices of the Natural Capital Project (http://www.naturalcapitalproject. org/InVEST.html). InVEST is useful in informing the decision-making process by quantifying and mapping the distribution of ecosystem services under alternative scenarios. CAS includes four basic carbon stocks (aboveground biomass, underground biomass, soil carbon stock, and dead organic matter). The carbon module in the InVEST model was used to assess the spatial distribution of CAS in ecosystems, using Equations (3) and (4) [64]:
where Cv is CAS in vegetation (ton); Cabove is CAS in all living plant material above the soil; Cbelow is the CAS in the living root systems; and Cdead is the CAS in litter, as well as lying and standing dead wood. Ctot is the total CAS (tons), and Csoil is the CAS in the soil (tons). See Table S1 for the vegetation carbon density table.
2.6. Supporting Ecosystem Services
Soil Moisture
In this study, the soil drought index (TVDI) was used to characterize the soil moisture supporting service. TVDI can be effectively used to monitor the soil surface water content in arid areas [30]. The TVDI is a simplified land surface dryness index related to soil moisture, which is calculated as:
where TVDI ranges between 0 and 1 (TVDI = 0 indicates that the soil’s water content is close to the field water-holding capacity, and TVDI = 1 indicates that the soil’s water content is close to the wilting point). Ts is the surface temperature; TSmin is the lowest surface temperature corresponding to an EVI value, where EVI is the enhanced vegetation index based on the MODIS data; and TSmax is the highest surface temperature corresponding to an EVI value. The fitting equations for TSmin and TSmax are [65]:
where a1 and b1 are the coefficients of the wet edge fitting equation; a2 and b2 are the coefficients of the dry edge fitting equation; and ρ is the reflectance of the bands corrected by the atmosphere (near infrared, red and blue); L = 1 is the soil regulation parameter; and c1 and c2 are parameters that describe the influence of the atmosphere on the red band due to the blue band, i.e., 6.0 and 7.5, respectively.
2.7. Provisioning Ecosystem Services
Groundwater
In this study, groundwater depth (GWD) was selected to characterize the groundwater provisioning service. The GWD spatial distribution map was obtained by Kriging interpolation from the annual GWD data of 51 groundwater monitor wells perpendicular to the river, using ArcGIS10.4 software. As the groundwater monitor wells of the Tarim River started to operate after 2008, for the missing GWD data in 2000, we used the monthly run-off of each section from 2010 to 2018 to construct a fitting function with the monthly GWD of each groundwater monitor well in the corresponding section. Then, according to the monthly run-off of each section in the year 2000, the monthly GWD of each groundwater monitor well in each section in 2000 was obtained through the fitting equation. Finally, the monthly groundwater data of each well were averaged to obtain the average GWD in 2000 (Figure S1 and Table S2).
2.8. Trade-Off and Synergy Analysis
2.8.1. Correlation Analysis
We used ArcGIS10.4 combined with the correlation coefficient method to analyze and determine the grid data of the four ES in the years 2000, 2010, and 2018. First, the 1 × 1 km grid sample points were created using the ‘Fishnet’ tool in ArcGIS 10.4, and the average ecosystem service of each sample point was extracted based on each grid. The number of samples selected in this study was as follows: 14,708 sample sites in the entire region, 8606 sample sites in the Alar-Yingbaza river section, and 6102 sample sites in the Yingbaza-Qiala river section. Finally, according to the sample points of the different ES, the correlation coefficient was calculated by SPSS 22 (Pearson, two-tailed) [19].
2.8.2. Root Mean Square Deviation
The Root Mean Square Deviation (RMSD) was used to quantify the trade-off between two or more ES, and required the data to be standardized prior to calculation [20,66]:
where ESstd is the standardized value of any ecosystem service; ESobs is an observed value; and ESmin and ESmax are the minimum and maximum observed values. ESi is the standardized value of ESi, and is the expected value of the i number of ES. This method expands the meaning of trade-offs, which is not limited to the characterization of the negative trade-off relationship, but also effectively expresses the imbalance of the rate of co-directional change between synergistic services [20,64]. It is a simple and effective method that can characterize the degrees of trade-offs between two or more ES without paying attention to the relationship between the ES.
3. Results
3.1. Effect of the Implementation of Policies on Land Use and Land Cover
The spatial distribution of land use/cover types in the Alar-Qiala section of the Tarim River basin in 2000, 2010, and 2018 is shown in Figure 3A. Woodland, grassland, farmland, and unused land were the main land types in this area (Figure 3B). With the protection and restoration of vegetation driven by the policy of unified water resource management, the land use area and structure have changed significantly [48]. From 2000 to 2018, the farmland, water area, construction land and unused land in the Alar-Qiala section of the Tarim River basin showed an increasing trend, in which the farmland area increased by 11.66 × 10⁴ hm2—a significant increase of 65.03%—and unused land increased by only 1%. There was a decreasing trend in woodland and grassland areas, with grassland areas decreasing by 9.09 × 10⁴ hm2, with the largest decrease reaching 20.78%, and woodland areas decreased by 5.06 × 10⁴ hm2: a decrease of 10.50% (Figure 3C). In addition, compared with 2000–2010, the rate of the increase of the farmland area, and the rate of the decrease of the grassland and woodland areas were significantly lower in 2010–2018. This shows that the expansion of farmland in the Tarim River basin has been effectively controlled and the restoration of woodland and grassland has improved following the implementation of the comprehensive management of the Tarim River, and the unified management of water resources in the basin. From 2000 to 2018, the land use transfer in the Aral-Qiala section of the Tarim River basin mainly occurred between farmland, woodland, grassland and unused land (Table 2). Farmland was the main importer, while grassland and woodland were the main exporters. From 2000 to 2010, the increased farmland came mainly from grassland, accounting for 64.81%; from 2010 to 2018, the increased farmland came mainly from woodland, accounting for 53.33%.
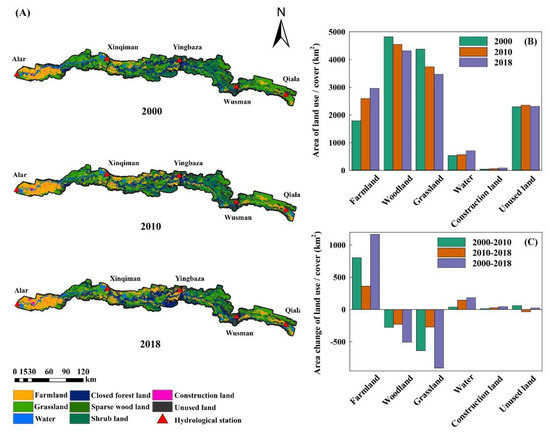
Figure 3.
The spatial distribution of the land use/cover (A), the area of the land use/cover (B), and the area change of the land use/cover (C) in the mainstream area of the Tarim River over the period 2000–2018.
Table 2.
Change matrix of the land use in the mainstream area of the Tarim River, hm2.
3.2. Spatio-Temporal Characteristics of the Ecosystem Services
Figure 4A shows the spatial distribution of CAS in the Alar-Qiala section of the Tarim River basin in the years 2000, 2010, and 2018, showing a strong spatial heterogeneity. There was no obvious difference in the spatial distribution pattern of CAS in 2000, 2010, and 2018, and there was an overall decreasing trend in the high CAS value from the Tarim River basin to its surroundings. The spatial distribution was consistent with the change in the land use. In terms of time, the total CAS of the entire region increased from 93.70 million tons to 93.92 million tons over the period 2000–2010, and decreased to 93.01 million tons in 2018 (Figure 5B). From a spatial perspective, the high-value CAS areas were mainly concentrated in the Xinqiman-Yingbaza and Yingbaza-Wusman sections. The average annual CAS in these two river sections in 2000, 2010, and 2018 were 28.13 and 26.96 million tons, respectively. The carbon densities were 67.79 and 78.35 t·hm−2, respectively. As these two river sections were the main areas of woodland distribution, with high vegetation coverage and good growth, there was less interference from human activities, and good maintenance of the natural vegetation. The Alar-Xinqiman section was mainly farmland. The average CAS and carbon densities in this section, over the period 2000–2018, were 22.74 million tons and 57.12 t·hm−2, respectively. Among the different land use types, woodland was the main carbon pool in the Alar-Qiala section of the Tarim River basin. In the years 2000, 2010, and 2018, CAS in this section ranged from 31.88–35.31 million tons, accounting for 34.28–37.68% of the total CAS of the basin’s ecosystem. The grassland CAS was second only to woodland, and ranged from 24.03 to 30.37 million tons in 2000, 2010, and 2018, accounting for 25.84–32.41% of the total CAS (Figure 5A). In addition, the carbon density of the vegetation types in the study area remained stable, and the average carbon density showed that woodland (73.77 t·hm−2) was greater than farmland (73 t·hm−2) and grassland (69.35 t·hm−2) in 2000, 2010, and 2018.
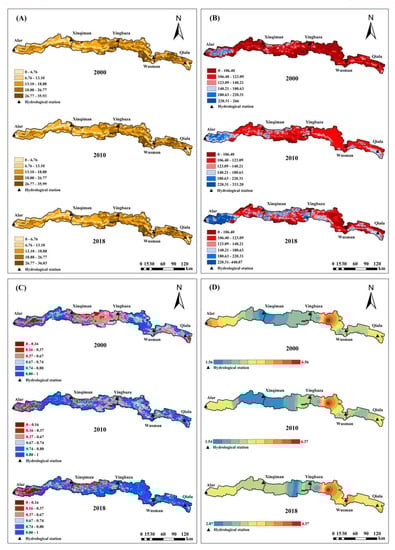
Figure 4.
The spatial distribution of CAS (A), ET (B), TVDI (C), and GWD (D) in the mainstream area of the Tarim River during 2000–2018 (CAS = carbon storage, ET = evapotranspiration, TVDI = soil drought index, GWD = groundwater depth).
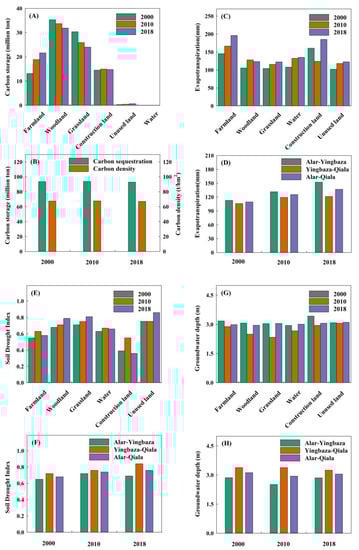
Figure 5.
The carbon storage of the land use/cover (A); the carbon storage and carbon density (B); the evapotranspiration of land use/cover (C); the evapotranspiration in the different river sections (D); the soil drought index of the land use/cover (E); the soil drought index in the different river sections (F); the groundwater depth of the land use/cover (G); and the groundwater depth in the different river sections (H) in the mainstream area of the Tarim River during 2000–2018.
The spatial distribution of ET in the Alar-Qiala section of the Tarim River basin over 2000, 2010, and 2018, is shown in Figure 4B. The spatial distribution pattern of the study area changed significantly in 2000, 2010, and 2018, and the overall distribution was highest in the west and lowest in the east. The actual ET in the arid areas was mainly affected by the water conditions; however, the Tarim River basin is located inland and precipitation is rare, and the entire area has a low ET value. In terms of time (Figure 5D), the ET in the entire region was stably distributed between 110 and 140 mm over the years 2000, 2010, and 2018, with the minimum occurring in 2000 (109 mm) and the maximum in 2018 (140 mm). In 2010, the ET in the entire region increased by 15.56% compared with the year 2000, and in 2018 it increased by 10.37%, compared with 2010. From a spatial perspective, the high ET areas were mainly concentrated in the Alar-Yingbaza section, and the average ET over the years 2000, 2010, and 2018 reached 130 mm. The low ET areas were concentrated in the Yingbaza-Qiala section, with an average annual ET value of 116 mm. In addition, from 2000 to 2018, the average ET for the different land use types showed that ET in farmland areas (169 mm) was greater than in water (125 mm), woodland (119 mm) and grassland (114 mm) areas (Figure 5C). This difference was due to the artificial planting and irrigation of the agricultural land, which increased the vegetation coverage and soil moisture compared to the areas with sparse vegetation. Therefore, the ET in the study area showed significant spatial heterogeneity, and the implementation of a series of policies on the unified management of water resources improved the water conditions in the Tarim River basin, and the entire region has gradually become more humid.
Figure 4C shows the spatial distribution of the TVDI in the Alar-Qiala section of the Tarim River basin in the years 2000, 2010, and 2018. According to the classification of the drought level, the TVDI value is <0.67 for humid, 0.67–0.74 for light drought, 0.74–0.80 for moderate drought, 0.80–0.86 for severe drought, and >0.86 for extreme drought [30]. The results show the strong spatial heterogeneity of TVDI, as with CAS and ET. From a spatial perspective, the high value TVDI areas were mainly distributed in the Yingbaza-Qiala section, and the average TVDI over the years 2000, 2010, and 2018 was 0.78 (moderate drought). The low value TVDI areas were mainly concentrated in the Alar-Yingbaza section, with an average TVDI value of 0.69 (light drought) (Figure 5F). The average TVDI value for the different land use types (Figure 5E), in 2000, 2010, and 2018, was significantly different, showing that farmland (0.59) was lower than woodland (0.72), grassland (0.76), and unused land (0.79) areas. Since the change in the soil moisture in the Tarim River basin depends on water delivery and irrigation water, the farmland areas were greatly affected by human activities, making the soil moisture higher than for the other land types, with a humid state in farmland areas. In terms of the stability of the ecosystem, the water-holding capacity of the woodland soil was higher than that of the grassland, which is conducive to weakening the vulnerability of the arid environment. In terms of time (Figure 5F), following the implementation of the comprehensive management of the Tarim River, the soil in the entire area started to exhibit humidification in 2000 (TVDI = 0.69). The effect of the ecological water management was significantly enhanced from 2010 to 2018, and the degree of drought in the region was controlled, in a state of light drought.
The spatial distribution of GWD in the Alar-Qiala section of the Tarim River basin over the period 2000, 2010, and 2018, is shown in Figure 4D. The spatial distribution varied over the study period. The areas with high GWD values were mainly concentrated in the Yingbaza-Qiala section, and the average GWD was 3.34 m in 2000, 2010, and 2018. The areas with low GWD values were mainly distributed in the Alar-Yingbaza section, with an average GWD of 2.74 m in 2000, 2010, and 2018 (Figure 5H). This is because the GWD in the Tarim River basin is mainly dependent on ecological water delivery and the irrigation water volume as the soil moisture content changes. After the three major sources of the Aksu, Hetian, and Yarkand Rivers converge, it flows from Alar to Qiala over a distance of 893 km. In the process of river discharge, there is bound to be loss of water due to natural evaporation and leakage, resulting in a drop in the groundwater level of the Yingbaza-Qiala section. In addition, the Alar-Xinqiman section was the main agricultural irrigation area, which had a greater impact on human activities, and the groundwater level was shallower. Groundwater is the main water source for vegetation growth in the Tarim River basin. In 2000, 2010, and 2018, the average GWD for the different land use types was 2.81 m in grassland areas, which was less than in the woodland (2.84 m), farmland (3.01 m) and unused land (3.04 m) (Figure 5G). This shows that the groundwater level for the growth of shallow-rooted plants, such as grasslands, was lower than that of other vegetation types, and was highly sensitive to changes in GWD. In terms of time, the average GWD at the initial stage of the comprehensive management of the Tarim River, in 2000, was 3.12 m. With the reform of the Tarim River basin system, the groundwater level rose rapidly due to high-intensity ecological water transfer, to 2.94 m in 2010, which was 5.77% higher. By 2018, the average GWD was stable, at 3.05 m.
3.3. Trade-Offs and Synergies among Multiple Ecosystem Services
Figure 6 shows the spatial correlation coefficients between the indicators of the ES in different sections of the Tarim River basin, in order to determine the ecosystem service spatial relationships. The results show that, in the Alar-Yingbaza and Yingbaza-Qiala sections, CAS–GWD, CAS–TVDI and ET–TVDI maintained significant trade-off relationships (p < 0.01), and the trade-off relationship between ET–TVDI was most obvious. However, there were significant synergistic relationships between CAS–ET and GWD–TVDI over the entire study period, with the synergistic GWD–TVDI relationship being the most obvious. Some indicators showed opposite trends in different river sections over the study period. For example, ET–GWD showed synergy in the Alar-Yingbaza section, while the opposite pattern (i.e., a trade-off) was observed in the Yingbaza-Qiala section.
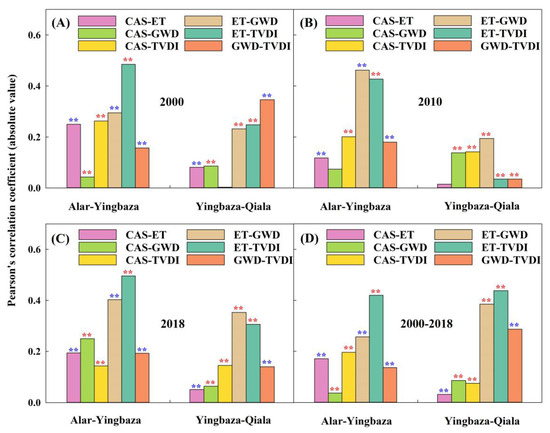
Figure 6.
The spatial correlation of paired ecosystem service indicators in the different river sections for each time period (** indicates significantly positive correlations, p < 0.01; ** indicates significantly negative correlations, p < 0.01; no * indicates p ≥ 0.05. CAS = carbon storage, ET = evapotranspiration, TVDI = soil drought index, GWD = groundwater depth).
For different land use/cover types, the trade-offs/synergies between ES were not the same on different spatial and temporal scales (Figure 7). For woodland and grassland areas, CAS–ET had a synergistic effect over the entire study period, but it was a trade-off relationship in farmland areas; ET–GWD showed a synergistic effect in farmland areas, but was a trade-off in woodland and grassland areas. In other words, there was a space–time scale dependence of trade-offs/synergies between ES. In addition, among the other ES, CAS–GWD (except 2000–2018, low significant synergy, p < 0.05) and GWD–TVDI (except 2018, low significant synergy, p < 0.05) showed significant synergy (p < 0.01) over the entire study period, and CAS–TVDI (except 2018, low significant trade-off, p < 0.05) showed a significant trade-off relationship during the entire period, which is consistent with the results of the studies in the different river sections.
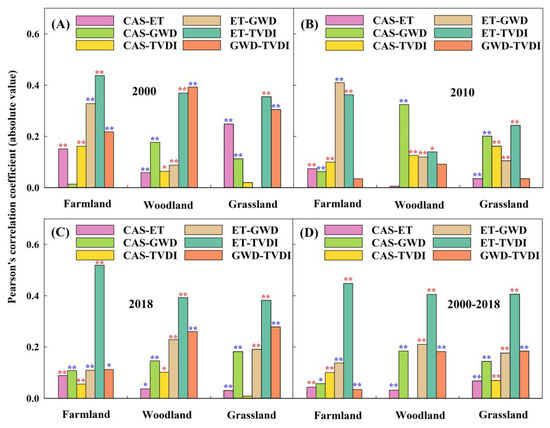
Figure 7.
The spatial correlation of paired ecosystem service indicators in the different land use types for each time period. (** and * indicate significantly positive correlations, respectively (p < 0.01, p < 0.05); ** and * indicate significantly negative correlations, respectively (p < 0.01, p < 0.05); no * indicates p ≥ 0.05. CAS = carbon storage, ET = evapotranspiration, TVDI = soil drought index, GWD = groundwater depth).
In order to better understand the changes in the ecosystem service trade-offs, the RMSD of the paired ES in the different sections and land use types was determined (Figure 8). In the different river sections, there were some differences in the trade-off intensity of ES over the period from 2000 to 2018. In all of the paired services (except CAS–TVDI), the RMSD of the Yingbaza-Qiala section was higher than that of the Alar-Yingbaza section (Figure 8A). For the different land use/cover types, overall, the RMSDs among all of the paired services (except CAS–TVDI) were lower for grassland than for woodland areas (Figure 8B).
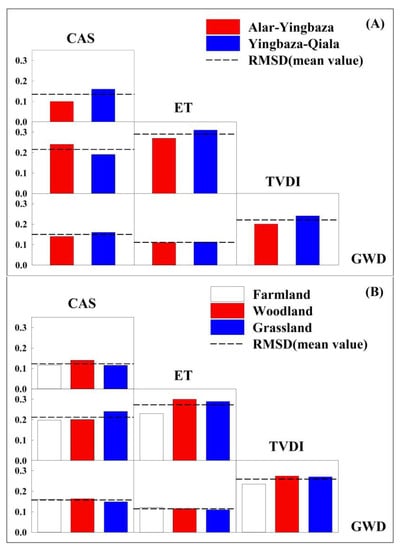
Figure 8.
The RMSD values between two ecosystem service indicators of different river sections (A), and the RMSD values of two ecosystem service indicators of different land use types (B) for the entire study period (the ordinate represents the RMSD values between two ES).
4. Discussions
4.1. The Underlying Drivers for Changes in the Ecosystem Services
Previous research has shown that a variety of factors bring about the generation, status and evolution of ES, including land use/cover changes, atmospheric carbon dioxide, biological changes, and nitrogen deposition, etc. [67,68,69]. The Millennium Ecosystem Assessment categorized these factors into physical (direct) and human (indirect) factors [3]. On a large spatiotemporal scale, climate change and land use are the main direct and indirect drivers of changes in ES. In arid basins, the changes in ES are mostly driven by water and land resource exploitation, which are influenced by water resource management policies [50].
Land use change is important in the long-term study of the earth, and changes in the type of land use affect the main ecological processes, such as energy exchange, the carbon cycle, the water cycle, soil erosion and accumulation, and the biogeochemical cycle, etc. Therefore, land use influences the supply of ES [3,70]. The agricultural irrigation economy has always been an important economic source in the Tarim River basin. In the early 1990s, the development of agricultural production in the Tarim River basin mainly relied on the expansion of the farmland area. With the rapid rise in food and cotton prices, driven by the economy, there was a surge in the reclamation of land; a large number of woodland, grassland, and unused land areas were reclaimed as farmland, resulting in a sharp increase in the farmland area. The over-exploitation of water and soil resources increased desertification and salinization, reduced the wetland area, and the vegetation has progressively deteriorated. The Tarim River has become one of the most noticeable land degradation areas, not only in China but also in the world [27,33]. In order to reduce land degradation and restore ecosystems, the Chinese government implemented a series of water resource management policies, the implementation of which has increased the management of the water and soil’s development, ensuring sufficient water supply in the Tarim River basin. In this study, the significant change in the CAS area within the ecosystem was consistent in spatial distribution with the change in land use, and its characteristics were decreasing around the Tarim River. From 2000 to 2010, the CAS in the study area increased by 0.22 million tons, mainly due to the conversion of grasslands (69.35 t·hm−2) to farmland (73 t·hm−2). Following the implementation of the comprehensive management, the remarkable restoration of the vegetation also resulted in increased surface biomass, carbon density, and CAS in woodland and grassland areas. CAS decreased by 0.91 million tons from 2010 to 2018, mainly due to the conversion of woodland areas (73.77 t·hm−2) to farmland (73 t·hm−2). At the same time, the transformation of grassland to desert, overgrazing, and the unreasonable utilization of grassland resources led to a decrease in the total CAS in grassland areas, which is consistent with research results showing a decline in grassland CAS in other arid areas of China [71].
Based on a previous study [30], climate change was the main driving factor for the changes in the runoff of the headstream areas of the Tarim River, but the change in the water volume of the mainstream Tarim River was mainly affected by the runoff of the headstream areas. Compared with 1960–1993, due to climate change, the run-off in the headstream areas of the Tarim River basin increased by 18.66 × 10⁸ m3·year−1 from 1994 to 2017, resulting in an increase of 6.33 × 10⁸ m3·year−1 into the Tarim River. According to the water balance principle, we used the run-off data, the agricultural and ecological diversion, and the return water of various river sections from 2005 to 2018 to calculate the riverway loss (i.e., the sum of the evaporation, leakage, and overflow in the river channel) of each section of the Tarim River, in order to clarify the mechanism driving the changes in the three ES that affect the water cycle in the basin ecosystem (i.e., ET, TVDI, GWD). The results (Figure 9) show that, from 2005 to 2018, the average run-off, water diversion, and riverway loss of the Alar-Yingbaza section were 46.88 × 10⁸ m3, 6.66 × 10⁸ m3, and 12.21 × 10⁸ m3, respectively; the average riverway loss rate was 29.84%, and the per unit riverway loss was 273.15 × 10⁴ m3·km−1. The average run-off, water diversion, return water and riverway loss of the Yingbaza-Qiala section were 28.51 × 10⁸ m3, 8.76 × 10⁸ m3, 0.15 × 10⁸ m3 and 11.74 × 10⁸ m3, respectively; the average riverway loss rate was 45.47%, and the per unit riverway loss was 294.97 × 10⁴ m3·km−1. In addition, the average evaporation, leakage and overflow in the Alar-Yingbaza section was greater than that in the Yingbaza-Qiala section. The enhancement of management of the water resources has increased the run-off from the mainstream of the Tarim River year by year, and the entire region has become more humid. However, compared with the Alar-Yingbaza section, the Yingbaza-Qiala section had a higher per unit riverway loss, lower leakage, and lower surface evaporation, resulting in a larger average GWD, lower soil moisture, and lower ET. This shows that the change in the water volume is the main driving force for the changes in ET, TVDI, and GWD in the Tarim River.
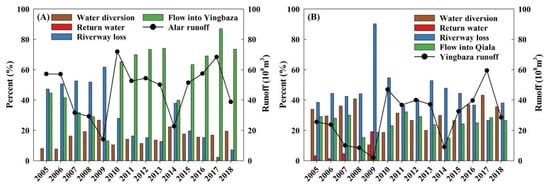
Figure 9.
Water regime change and water volume conversion in different river sections from 2005 to 2017. (A) Alar-Yingbaza, (B) Yingbaza-Qiala.
4.2. Trade-Off and Synergy Relationships between the Ecosystem Services
ES are closely related, and have a non-linear relationship, which is due to the influence of common drivers or the interaction between them [72,73,74]. Many studies have investigated the trade-offs and synergies of ES, revealing that trade-offs or synergies among multiple ES are universal [20]. The approaches to the research of the trade-offs and synergies among multiple ES can also be summarized into four categories: statistical methods, GIS spatial analysis methods, scenario simulation, and ES liquidity analysis methods [20,66]. Compared with other methods, correlation analysis and trade-off indexes (RMSD) are the most commonly used and effective approaches to assess and discuss the relationships of paired ES [5,20,32,66]. In order to reveal the trade-off/synergy of ES, we first qualitatively compared the trade-offs of different river sections and different land types in each period, using a Pearson correlation analysis. The results showed that there was a significant trade-off relationship between CAS–GWD, CAS–TVDI, and ET–TVDI in the Alar-Yingbaza and Yingbaza-Qiala sections during the study period, while those between CAS–ET and GWD–TVDI were significant during the whole period, indicating a great dependence on the ES that affect the carbon and water cycles in this region. This is because the areas with high CAS were usually closer to the riverbank, with a better water regime and greater vegetation coverage, and these areas often have shallow groundwater levels, resulting in higher soil wetting and ET. These results are consistent with those of Fu et al. [58], who believed that, although there was little precipitation in the oasis, the groundwater level was close to the surface, and the strong transpiration of trees would lead to a rise in the groundwater level. In different sections of the river, some ES showed the opposite trend during the study period. For example, ET–GWD showed synergy in the Alar-Yingbaza section, while the opposite pattern (i.e., trade-off) was observed in the Yingbaza-Qiala section. This is because the Tarim River basin is a dissipative river. Following the implementation of ecological water transport in the headstream areas, when the river flowed through the Yingbaza-Qiala section, 60.02% of the water volume had already been dissipated in the Alar-Yingbaza section, which, coupled with the high per-unit riverway loss of the Yingbaza-Qiala section, meant that when the water flowed over the river channel, the water in the river would overflow out of the river channel or evaporate naturally before the groundwater level could be raised [27], resulting in a synergistic relationship between ET and the GWD. In addition, for different geographical scales, the trade-offs/synergies between ES are not completely consistent for different land use types and river sections, showing strong regional heterogeneity and regional scale dependence. In other arid areas, the correlation coefficients between ES have been found to be concentrated in the range 0.02–0.52 [19,75], which is consistent with this study. Second, we used RMSD to quantitatively analyze the trade-offs between multiple ES [66]. The results showed some differences in the trade-off intensity of ES in the section of the river over the period 2000 to 2018. The RMSD of the Yingbaza-Qiala section was higher in all of the paired services (except CAS–TVDI) than it was in the Alar-Yingbaza section, which indicates strong internal competition between the ES that affect the carbon cycle and water cycle in the Yingbaza-Qiala section. For different land use/cover types, in general, the RMSDs among all of the paired services (except CAS–TVDI) were lower for grassland than woodland areas. This indicates that the ES provided by woodland may be more uneven, and that grassland, with a smaller RMSD, can be used to support a higher level of synergistic ES. Similar findings have been noted in other studies on the Loess Plateau [76,77,78].
4.3. Optimal Management of Water Resources Based on Ecosystem Services
Water resources are limited, fragile, and scarce, and are essential for maintaining life, the environment and human development [54,79]. Humans can benefit directly and indirectly from freshwater ecosystems—termed water-related ES—but the potential loss of ES due to conflicts with water resources are seldom studied [80]. Arid areas are extremely fragile ecological environments, which are sensitive to climate change and human activities. Water is a key environmental factor for ensuring the structural integrity and stability of the ecosystem in arid areas, and for maintaining functional ES [56]. This study indicates that the ES that affect the carbon and water cycles in the different river sections of the Tarim River basin generally show dependence on one another. However, in the woodland and grassland areas in desert riparian forests in arid areas, the strong competition between CAS and GWD limits the efficient use of ecological water to a certain extent. Coupled with the imbalance of the water volume in the high-flow years and the low-flow years of arid areas, forests such as Populus euphratica may be unable to maintain normal and stable growth within the threshold range of suitable groundwater. In addition, in farmland areas, due to the strong competition for water resources between ET and GWD, there would be a loss of some of the water resources, and a reduced water use efficiency of agricultural irrigation to a certain extent. The expansion of farmland also invaded and destroyed the desert–oasis transition zone at its periphery, resulting in the continuous shrinkage of the natural vegetation of the green corridor. Therefore, in order to reduce trade-offs between ES, to enhance the ES that affect the carbon and water cycles in arid basins, to realize the effective protection of desert riparian forest, and to ensure reasonable and efficient ecological water demand, the following measures should be taken: (1) establish an ‘underground ecological water bank’ in order to maintain a stable groundwater level. The ‘underground ecological water bank’ can store a large amount of water underground in high-flow years, for the long-term use of natural vegetation in low-flow years. According to Ling et al. [30], the GWD was maintained at 2–6 m, which ensured the stability of the ES function of the desert riparian Populus euphratica community, and the normal growth of deep-rooted plants. Therefore, the establishment of an ‘underground ecological water bank’ is beneficial to the reduction of the trade-off between CAS and GWD in natural vegetation, and the prevention of the reduction of CAS due to the decrease of natural vegetation coverage. (2) Implement ecological water conservancy engineering and an ecological water rotational irrigation system in low-flow years. In 2011, the Chinese government established ‘three red lines’ (i.e., the development and utilization of water resources, water use efficiency, and the limitation of the pollution capacity in water function areas); the total amount of water used and wasted, and the total amount of sewage discharged into the rivers were strictly controlled in order to achieve the rational allocation and effective protection of the water resources [27,30]. Based on previous research results [30,81,82,83], the efficient water resource regulation and control model has resulted in improvements in ES. For example, in the Syr Darya River basin of Central Asia and the Heihe River basin of China, water allocation was implemented by coordinating the relationship between the whole basin and the different administrative regions, in order to balance the water demand between economic development and ecological protection. This unified water distribution has greatly improved the ecological environment of the arid region, and the water-related ES have improved significantly [81,82,83]. In addition, in the Tarim River basin, the ecological sluice was controlled to overflow 2–3 times per year, from July to September, lasting for 15–20 days, with a maximum overflow time interval of 3–5 years, effectively ensuring the seed germination and formation of the Populus euphratica community in low-flow years, maintaining and enhancing its biodiversity, and promoting the synergistic relationship between natural vegetation and groundwater [30]. (3) Implement the reduction of farmland and irrigation water, and strictly ensure the appropriate ratio of the oasis scale. In 2015, the Chinese government formulated the ‘ecological red line’(i.e., the spatial red line, the area red line, and the management red line). Its main content the determination of the spatial scope and minimum protection area of different types of important ecological areas and vulnerable areas according to the needs of ecological service functions, the protection of ecosystem integrity, and the sustainability of ecological processes. According to Ling et al. [50], when the vegetation cover degree was greater than 0.41, the ecosystem service value of natural vegetation was higher than that of the farmland in arid basins. Therefore, a reasonable proportion of the oasis scale (i.e., 5:5–6) is beneficial in order to control agricultural water use, and to enhance the regulating ecosystem service (CAS) of natural vegetation [84]. Moreover, the application of a Bayesian network model in arid basins could promote the reduction of farmland and irrigation water by adjusting the water price, in order to ensure the scale and area of oasis areas, and to improve habitat function [85]. Through water-saving and water-retaining engineering measures, according to the actual needs of crop irrigation, the use of water-saving irrigation technology can reduce ET and other invalid losses in the process of water transfer, improve the efficiency of utilization of water resources in farmland, and promote the water cycle of the basin [50,82,83,86]. In the future, the ES that affect the water and carbon cycles should also be taken as the foundation, and other core ES (i.e., biodiversity, wind and sand fixation, food supply and recreation, and ecotourism) that restrict the sustainable development of arid areas should be incorporated into the water resource management system. By evaluating the trade-offs between core ES in arid areas, a quantitative standard of ecological water demand was established for a desert riparian forest ecosystem, so as to form a unified basin ecological dispatching system.
5. Conclusions
The enhanced management of water resources improved ES in arid areas along the Tarim River. From 2000 to 2018, due to the exploitation of water and land resources driven by water resource management policies, CAS showed an initial increasing trend, but then decreased. The high-value CAS areas were mainly distributed within a 0–10 km range from both banks of the Tarim River, and woodland areas were the main carbon pool. ET showed an increasing trend. In 2010, the ET of the entire region increased by 15.56% compared with 2000, and in 2018, the ET increased by 10.37% compared with 2010. The TVDI was controlled at 0.69–0.74 (light drought), and the soil showed developing wetness. The average GWD in the region was 3.12 m in 2000; it increased by 5.77% to 2.94 m in 2010, and remained stable at 3.05 m in 2018. Following the implementation of the comprehensive management of the river basin, an improvement in ES was observed.
On different geographic scales, the trade-offs and synergies between multiple ES have shown regional scale dependence. In the river section, CAS and GWD, CAS and TVDI, and GWD and ET showed trade-off relationships, while CAS and ET, and GWD and TVDI maintained synergistic relationships. In the woodland and grassland areas, CAS and GWD showed a synergistic relationship, indicating that there was still strong competition between natural vegetation and groundwater in these land types. In farmland areas, ET and GWD displayed a synergistic relationship, indicating that the ineffective loss of water resources, i.e., by ET, is a result of farmland expansion, which reduces the water use efficiency of agricultural irrigation and leads to water waste. In addition, the Yingbazha-Qiala section was a typical river section with fierce competition for water resources. Compared with woodland areas, grassland supported a higher level of synergistic ES.
In order to reduce trade-offs between ES, and improve to ES, achieve ecological protection and restoration of desert riparian forests, and to optimize the water resource management in arid areas, the following measures should be taken: (1) establish an ‘underground ecological water bank’ in order to maintain a stable groundwater level; (2) implement ecological water conservancy engineering and an ecological water rotational irrigation system; (3) implement the reduction of farmland and irrigation water, and strictly ensure the appropriate ratio of the oasis scale.
Supplementary Materials
The following are available online at https://www.mdpi.com/2071-1050/12/21/8802/s1, Figure S1: The goodness of fit of groundwater depth in 51 monitor wells in 2000, Table S1: Fitting equation of the groundwater depth in Alar-Qiala in 2000, Table S2: Caron density of different land use types in the mainstream area of the Tarim River.
Author Contributions
Conceptualization, H.L.; Funding acquisition, H.L.; Investigation, G.Z. and K.Y.; Resources, G.Z., K.Y. and H.X.; Software, H.X.; Supervision, H.L.; Writing—original draft, J.G.; Writing—review and editing, J.G. All authors have read and agreed to the published version of the manuscript.
Funding
This research was funded by the Xinjiang Tianshan Youth Program (2019Q006), the West Light Foundation of Chinese Academy of Sciences (2019-XBQNXZ-A-001), and the Science and Technology Service Network Project of Chinese Academy of Sciences (KFJ-STSQYZD-114).
Acknowledgments
We would like to thank the two anonymous reviewers for their valuable comments.
Conflicts of Interest
The authors declare that they have no conflict of interest.
References
- Daily, G. Nature’s Services: Societal Dependence on Natural Ecosystems; Island Press: Washington, DC, USA, 1997. [Google Scholar]
- Costanza, R.; d’Arge, R.; de Groot, R.; Farber, S.; Grasso, M.; Hannon, B.; Limburg, K.; Naeem, S.; O’neill, R.V.; Paruelo, J.; et al. The value of the world’s ecosystem services and natural capital. Nature 1997, 387, 253–260. [Google Scholar] [CrossRef]
- Millennium Ecosystem Assessment (MA). Ecosystems and Human Well-Being: Health Synthesis; Island Press: Washington, DC, USA, 2005. [Google Scholar]
- Whitehead, P.G.; Crossman, J. Macronutrient cycles and climate change: Key science areas and an international perspective. Sci. Total Environ. 2012, 434, 13–17. [Google Scholar] [CrossRef]
- Lü, Y.; Fu, B.; Feng, X.; Zeng, Y.; Liu, Y.; Chang, R.; Sun, G.; Wu, B. A policy driven large scale ecological restoration: Quantifying ecosystem services changes in the Loess Plateau of China. PLoS ONE 2012, 7, e31782. [Google Scholar] [CrossRef]
- Gibbons, S.; Mourato, S.; Resende, G.M. The amenity value of English nature: A hedonic price approach. Environ. Resour. Econ. 2014, 57, 175–196. [Google Scholar] [CrossRef]
- Zheng, H.; Li, Y.; Brian, E.R.; Liu, G.; Ma, D.; Wang, F.; Lu, F.; Ouyang, Z.; Gretchen, C.D. Using ecosystem service trade-offs to inform water conservation policies and management practices. Front. Ecol. Environ. 2016, 14, 527–532. [Google Scholar] [CrossRef]
- Rodriguez, J.P.; Beard, T.D., Jr.; Bennett, E.M.; Cumming, G.S.; Cork, S.J.; Agard, J.; Dobson, A.P.; Peterson, G.D. Trade-offs across space, time, and ecosystem services. Ecol. Soc. 2006, 11, 28. [Google Scholar] [CrossRef]
- Dou, H.; Li, X.; Li, S.; Dang, D.; Liu, S.; Li, X.; Lyu, X.; Li, M.; Liu, S. Mapping ecosystem services bundles for analyzing spatial trade-offs in inner mongolia, China. J. Clean. Prod. 2020, 256, 120444. [Google Scholar] [CrossRef]
- Maes, J.; Paracchini, M.L.; Zulian, G.; Dunbar, M.B.; Alkemade, R. Synergies and trade-offs between ecosystem service supply, biodiversity, and habitat conservation status in Europe. Biol. Conserv. 2012, 155, 1–12. [Google Scholar] [CrossRef]
- Locatelli, B.; Imbach, P.; Wunder, S. Synergies and trade-offs between ecosystem services in Costa Rica. Environ. Conserv. 2014, 41, 27–36. [Google Scholar] [CrossRef]
- Jopke, C.; Kreyling, J.; Maes, J.; Koellner, T. Interactions among ecosystem services across Europe: Bagplots and cumulative correlation coefficients reveal synergies, trade-offs, and regional patterns. Ecol. Indic. 2015, 49, 46–52. [Google Scholar] [CrossRef]
- Hou, Y.; Lü, Y.; Chen, W.; Fu, B. Temporal variation and spatial scale dependency of ecosystem service interactions: A case study on the central Loess Plateau of China. Landsc. Ecol. 2017, 32, 1201–1217. [Google Scholar] [CrossRef]
- Felipe-Lucia, M.R.; Soliveres, S.; Penone, C.; Manning, P.; Plas, F.V.D.; Boch, S.; Prati, D.; Ammer, C.; Schall, P.; Gossner, M.M.; et al. Multiple forest attributes underpin the supply of multiple ecosystem services. Nat. Commun. 2018, 9, 4839. [Google Scholar] [CrossRef] [PubMed]
- Feng, Q.; Zhao, W.; Hu, X.; Liu, Y.; Daryantoa, S.; Cherubinic, F. Trading-off ecosystem services for better ecological restoration: A case study in the Loess Plateau of China. J. Clean. Prod. 2020, 257, 120469. [Google Scholar] [CrossRef]
- Su, C.; Fu, B. Evolution of ecosystem services in the Chinese Loess Plateau under climatic and land use changes. Glob. Planet. Chang. 2013, 101, 119–128. [Google Scholar] [CrossRef]
- Rukundo, E.; Liu, S.; Dong, Y.; Rutebuka, E.; Asamoah, E.F.; Xu, J.; Wu, X. Spatio-temporal dynamics of critical ecosystem services in response to agricultural expansion in rwanda, east africa. Ecol. Indic. 2018, 89, 696–705. [Google Scholar] [CrossRef]
- Liu, Y.; Lü, Y.; Fu, B.; Harris, P.; Wu, L. Quantifying the spatio-temporal drivers of planned vegetation restor Lüation on ecosystem services at a regional scale. Sci. Total Environ. 2019, 650, 1029–1040. [Google Scholar] [CrossRef] [PubMed]
- Pan, J.; Wei, S.; Wang, Y.; Li, Z. Spatiotemporal pattern of trade-offs and synergistic relationships among multiple ecosystem services in an arid inland river basin in NW China. Ecol. Indic. 2020, 114, 106345. [Google Scholar] [CrossRef]
- Lü, N.; Fu, B.; Jin, T.; Chang, R. Trade-off analyses of multiple ecosystem services by plantations along a precipitation gradient across Loess Plateau landscapes. Landsc. Ecol. 2014, 29, 1697–1708. [Google Scholar] [CrossRef]
- Rodríguez, N.; Armenteras, D.; Retana, J. National ecosystems services priorities for planning carbon and water resource management in colombia. Land Use Policy 2015, 42, 609–618. [Google Scholar] [CrossRef]
- Butler, J.R.A.; Wong, G.Y.; Metcalfe, D.J.; Honzak, M.; Pert, P.L.; Rao, N.; van Grieken, M.E.; Lawson, T.; Bruce, C.; Kroon, F.J.; et al. An analysis of trade-offs between multiple ecosystem services and stakeholders linked to land use and water quality management in the Great Barrier Reef Agriculture Australia. Ecosyst. Environ. 2013, 180, 176–191. [Google Scholar] [CrossRef]
- Goldstein, J.H.; Caldarone, G.; Duarte, T.K.; Ennaanay, D.; Hannahs, N.; Mendoza, G.; Polasky, S.; Wolny, S.; Daily, G.C. Integrating ecosystem-service tradeoffs into land-use decisions. Proc. Natl. Acad. Sci. USA 2012, 109, 7565–7570. [Google Scholar] [CrossRef] [PubMed]
- Richter, B.D.; Mathews, R.; Harrison, D.L.; Wigington, R. Ecologically sustainable water management: Managing river flows for ecological integrity. Ecol. Appl. 2003, 13, 206–224. [Google Scholar] [CrossRef]
- Severskiy, I. Water-related problems of Central Asia: Some results of the (GIWA) International Water Assessment Program. AMBIO 2004, 33, 52–62. [Google Scholar] [CrossRef]
- Pala, C. Environmental restoration—To save a vanishing sea. Science 2005, 307, 1032–1034. [Google Scholar] [CrossRef][Green Version]
- Ling, H.B.; Xu, H.L.; Fu, J.Y. Changes in intra-annual runoff and its response to climate change and human activities in the headstream areas of the Tarim River Basin, China. Quat. Int. 2014, 336, 158–170. [Google Scholar] [CrossRef]
- Mamat, Z.; Halik, U.; Keyimu, M.; Keram, A.; Nurmamat, K. Variation of the flood-plain forest ecosystem service value in the lower reaches of Tarim River, China. Land Degrad. Dev. 2018, 29, 47–57. [Google Scholar] [CrossRef]
- Jiang, L.; Jiapaer, G.; Bao, A.; Kurban, A.; Guo, H.; Zheng, G.; De Maeyer, P. Monitoring the long-term desertification process and assessing the relative roles of its drivers in Central Asia. Ecol. Indic. 2019, 104, 195–208. [Google Scholar] [CrossRef]
- Ling, H.; Guo, B.; Zhang, G.; Xu, H.; Deng, X. Evaluation of the ecological protective effect of the “large basin” comprehensive management system in the tarim river basin, China. Sci. Total Environ. 2019, 650, 1696–1706. [Google Scholar] [CrossRef]
- Feng, Q.; Zhao, W.; Fu, B.; Ding, J.; Wang, S. Ecosystem service trade-offs and their influencing factors: A case study in the loess plateau of china. Sci. Total Environ. 2017, 607, 1250–1263. [Google Scholar] [CrossRef]
- Feng, X.M.; Fu, B.J.; Lü, N.; Zeng, Y.; Wu, B.F. How ecological restoration alters ecosystem services: An analysis of carbon sequestration in China’s Loess Plateau. Sci. Rep. 2013, 3, 2846. [Google Scholar] [CrossRef]
- Ling, H.B.; Zhang, P.; Xu, H.L.; Zhang, G.P. Determining the ecological water allocation in a hyper-arid catchment with increasing competition for water resources. Glob. Planet. Chang. 2016, 145, 143–152. [Google Scholar] [CrossRef]
- Bhuiyan, M.; Nikolopoulos, E.; Anagnostou, E.; Quintana-Seguí, P.; Barella-Ortiz, A. A nonparametric statistical technique for combining global precipitation datasets: Development and hydrological evaluation over the Iberian Peninsula. Hydrol. Earth Syst. Sci. 2018, 22, 1371–1389. [Google Scholar] [CrossRef]
- Seyyedi, H.; Anagnostou, E.; Kirstetter, P.; Maggioni, V.; Hong, Y.; Gourley, J. Incorporating Surface Soil Moisture Information in Error Modeling of TRMM Passive Microwave Rainfall. IEEE Trans. Geosci. Remote 2014, 52, 6226–6240. [Google Scholar] [CrossRef]
- Hughes, R.M.; Whittier, T.R.; Rohm, C.M.; Larsen, D.P. A regional framework for establishing recovery criteria. Environ. Manag. 1990, 14, 673–683. [Google Scholar] [CrossRef]
- Asmamaw, D.K. A critical review of integrated river basin management in the upper Blue Nile river basin: The case of Ethiopia. Int. J. River Basin Manag. 2015, 13, 429–442. [Google Scholar] [CrossRef]
- Kingsford, R.T.; Bino, G.; Porter, J.L. Continental impacts of water development on waterbirds, contrasting two Australian river basins: Global implications for sustainable water use. Glob. Chang. Biol. 2017, 23, 4958–4969. [Google Scholar] [CrossRef]
- Rollins, M. Cofiring from the TVA public power perspective. Biomass Bioenergy 2000, 19, 467–468. [Google Scholar] [CrossRef]
- O’Neill, K.M. Why the TVA remains unique: Interest groups and the defeat of new deal river planning. Rural Soc. 2002, 67, 163–182. [Google Scholar] [CrossRef]
- Hussein, I.A.J. Application of Expert and Decision Support Systems for optimizing water supply in the Jordan Valley—The case of King Abdullah Canal. Water Int. 2005, 30, 304–313. [Google Scholar] [CrossRef]
- Roy, P.K.; Mazumdar, A. Study on hydrology and drought in the flood region of Damodar River Basin. J. Geol. Soc. India. 2007, 69, 1011–1019. [Google Scholar]
- Zuo, Q.; Liu, J. China’s river basin management needs more efforts. Environ. Earth Sci. 2015, 74, 7855–7859. [Google Scholar] [CrossRef]
- Garane, A.; Biney, C.; Belemlilga, E. The 1997 United Nations Convention on the Law of Non-navigational Uses of International Watercourses: What contribution to the development of the Water Charter for the Volta Basin? Water Int. 2017, 42, 360–371. [Google Scholar] [CrossRef]
- Bontoux, J.; Courtois, G. Wastewater reuse for irrigation in France. Water Sci. Technol. 1996, 33, 45–49. [Google Scholar] [CrossRef]
- Tortajada, C. Institutions for integrated river basin management in Latin America. Int. J. Water Resour. 2001, 17, 289–301. [Google Scholar] [CrossRef]
- Akpabio, E.M. Assessing integrated water resources management in Nigeria: Insights and lessons from irrigation projects in the Cross River Basin. Water Policy 2007, 9, 149–168. [Google Scholar] [CrossRef]
- Hagemann, N.; Klauer, B.; Moynihan, R.M.; Leidel, M.; Scheifhacken, N. The role of institutional and legal constraints on river water quality monitoring in Ukraine. Environ. Earth Sci. 2014, 72, 4745–4756. [Google Scholar] [CrossRef]
- Palomba, F.; Cesari, G.; Pelillo, R.; Petroselli, A. An empirical model for river ecological management with uncertainty evaluation. Water Resour. Manag. 2018, 32, 897–912. [Google Scholar] [CrossRef]
- Ling, H.; Yan, J.; Guo, B.; Xu, H.; Li, X.; Deng, X. Evaluation of water and land exploitation based on the ecosystem service value in a hyper–arid region with intensifying basin management. Land Degrad. Dev. 2019, 30, 2165–2176. [Google Scholar] [CrossRef]
- Pala, C. Ecology—Once a terminal case, the north Aral Sea shows new signs of life. Science 2006, 312, 183. [Google Scholar] [CrossRef][Green Version]
- Karthe, D.; Chalov, S.; Borchardt, D. Water resources and their management in central Asia in the early twenty first century: Status, challenges and future prospects. Environ. Earth Sci. 2015, 73, 487–499. [Google Scholar] [CrossRef]
- Li, J.; Chen, H.; Zhang, C. Impacts of climate change on key soil ecosystem services and interactions in Central Asia. Ecol. Indic. 2020, 116, 106490. [Google Scholar] [CrossRef]
- Bakker, K. Water security: Research challenges and opportunities. Science 2012, 337, 914–915. [Google Scholar] [CrossRef] [PubMed]
- Granek, E.F.; Polasky, S.; Kappel, C.V.; Reed, D.J.; Stoms, D.M.; Koch, E.W.; Kennedy, C.J.; Cramer, L.A.; Hacker, S.D.; Barbier, E.B.; et al. Ecosystem services as a common language for coastal ecosystem-based management. Conserv. Biol. 2010, 24, 207–216. [Google Scholar] [CrossRef] [PubMed]
- Cook, B.R.; Spray, C.J. Ecosystem services and integrated water resource management: Different paths to the same end? J. Environ. Manag. 2012, 109, 93–100. [Google Scholar] [CrossRef]
- Castro, A.J.; Martín-Lopez, B.; Lopez, E.; Plieninger, T.; Alcaraz-Segura, T.; Vaughn, C.C.; Cabello, J. Do protected areas networks ensure the supply of ecosystem services? Spatial patterns of two nature reserve systems in semi-arid Spain. Appl. Geogr. 2015, 60, 1–9. [Google Scholar] [CrossRef]
- Fu, Q.; Hou, Y.; Wang, B.; Bi, X.; Li, B.; Zhang, X.S. Scenario analysis of ecosystem service changes and interactions in a mountain-oasis-desert system: A case study in altay prefecture, China. Sci. Rep. 2018, 8, 12939. [Google Scholar] [CrossRef]
- Mashizi, A.K.; Heshmati, G.A.; Mahini, A.R.S.; Escobedo, F.J. Exploring management objectives and ecosystem service trade-offs in a semi-arid rangeland basin in southeast Iran. Ecol. Indic. 2019, 98, 794–803. [Google Scholar] [CrossRef]
- Jones, S.K.; Boundaogo, M.; Declerck, F.A.; Estrada-Carmona, N.; Mulligan, M. Insights into the importance of ecosystem services to human well-being in reservoir landscapes. Ecosyst. Serv. 2019, 39, 100987. [Google Scholar] [CrossRef]
- Guangpeng, Z. Study on Hydraulic Conductivity and Leakage Water of Riverbed in Upper Stream of Tarim River. Ph.D. Thesis, Xinjiang Agricultural University, Ürümqi, China, 2016. [Google Scholar]
- Zhou, H.H.; Li, W.H.; Li, Y.P.; Wang, Y.Y.; Huang, X. Estimation of ecological water demand of a desert riparian forest using tree rings of Populus euphratica in the Lower Tarim River. Acta Ecol. Sin. 2017, 37, 7576–7584. (In Chinese) [Google Scholar]
- Ling, H.B.; Guo, B.; Xu, H.L.; Fu, J.Y. Configuration of water resources for a typical river basin in an arid region of China based on the ecological water requirements (EWRs) of desert riparian vegetation. Glob. Planet. Chang. 2014, 122, 292–304. [Google Scholar] [CrossRef]
- Tallis, H.T.; Ricketts, T.; Guerry, A.D.; Wood, S.A.; Sharp, R.; Nelson, E.; Ennaanay, D.; Wolny, S.; Olwero, N.; Vigerstol, K.; et al. InVEST 2.6.0 User’s Guide; The Natural Capital Project: Stanford, CA, USA, 2013. [Google Scholar]
- Sandholt, I.; Rasmussen, K.; Andersen, J. A simple interpretation of the surface temperature/vegetation index space for assessment of surface moisture status. Remote Sens. Environ. 2002, 79, 213–224. [Google Scholar] [CrossRef]
- Bradford, J.; D’Amato, A. Recognizing trade-offs in multi-objective land management. Front. Ecol. Environ. 2012, 10, 210–216. [Google Scholar] [CrossRef]
- Matson, P.A.; Lohse, K.; Hall, S. The globalization of nitrogen deposition: Consequences for terrestrial ecosystems. AMBIO 2002, 31, 113–119. [Google Scholar] [CrossRef]
- Reynolds, J.F.; Stafford-Smith, D.M. Global Desertification: Do Humans Cause Deserts? Dahlem Workshop Report 88; Dahlem University Press: Berlin, Germany, 2002; p. 437. [Google Scholar]
- Körner, C. Biosphere responses to CO2 enrichment. Ecol. Appl. 2000, 10, 1590–1619. [Google Scholar]
- Fu, B.; Wang, Y.; Xu, P.; Yan, K. Mapping the flood mitigation services of ecosystems-a case study in the Upper Yangtze River Basin. Ecol. Eng. 2013, 52, 238–246. [Google Scholar] [CrossRef]
- Dong, W.; Yu, L.; Gao-Lin, W.; Lu-Ming, D.; Zheng, Y.; Hong-Min, H. Effect of rest-grazing management on soil water and carbon storage in an arid grassland (China). J. Hydrol. 2015, 527, 754–760. [Google Scholar] [CrossRef]
- Farber, S.C.; Costanza, R.; Wilson, M.A. Economic and ecological concepts for valuing ecosystem services. Ecol. Econ. 2002, 41, 375–392. [Google Scholar] [CrossRef]
- Van Jaarsveld, A.S.; Biggs, R.; Scholes, R.J.; Bohensky, E.; Reyers, B.; Lynam, T.; Musvoto, C.; Fabricius, C. Measuring conditions and trends in ecosystem services at multiple scales: The Southern African Millennium Ecosystem Assessment (SAfMA) experience. Philos. Trans. R. Soc. B Biol. Sci. 2005, 360, 425–441. [Google Scholar] [CrossRef]
- Bennett, E.M.; Peterson, G.D.; Gordon, L.J. Understanding relationships among multiple ecosystem services. Ecol. Lett. 2009, 12, 1–11. [Google Scholar] [CrossRef]
- Li, H.J.; Ren, Z.Y.; Liu, Y.X. Tradeoffs-synergies analysis among ecosystem services in Northwestern Valley Basin: Taking Yinchuan Basin as an example. J. Desert Res. 2016, 36, 1731–1738. (In Chinese) [Google Scholar]
- Pan, Y.; Xu, Z.; Wu, J. Spatial differences of the supply of multiple ecosystem services and the environmental and land use factors affecting them. Ecosyst. Serv. 2013, 5, e4–e10. [Google Scholar] [CrossRef]
- Li, Y.; Zhang, L.; Qiu, J.; Yan, J.; Wan, L.; Wang, P.; Hu, N.; Cheng, W.; Fu, B. Spatially explicit quantification of the interactions among ecosystem services. Landsc. Ecol. 2017, 32, 1181–1199. [Google Scholar] [CrossRef]
- Luo, Y.; Lü, Y.; Fu, B.; Harris, P.; Wu, L.; Comber, A. When multi-functional landscape meets critical zone science: Advancing multi-disciplinary research for sustainable human well-being. Nat. Sci. Rev. 2019, 6, 349–358. [Google Scholar] [CrossRef]
- UNEP. Status Report on the Application of Integrated Approaches to Water Resources Management; United Nations Environment Programme: Nairobi, Kenya, 2012. [Google Scholar]
- Koschke, L.; Lorz, C.; Fürst, C.; Lehmann, T.; Makeschin, F. Assessing hydrological and provisioning ecosystem services in a case study in Western Central Brazil. Ecol. Proc. 2014, 3, 1–15. [Google Scholar] [CrossRef]
- Wang, X.; Gao, Q. Sustainable development and management of water resources in the Hei River Basin of north-west China. Int. J. Water Resour. Dev. 2002, 18, 335–352. [Google Scholar]
- Karimov, A.; Giordano, M.; Mukherji, A.; Borisov, V.; Djumanov, J. Of transboundary basins, integrated water resources management (IWRM) and second best solutions: The case of groundwater banking in Central Asia. Water Policy 2012, 14, 99–111. [Google Scholar] [CrossRef]
- Wang, S.; Wei, Y. Water resource system risk and adaptive management of the Chinese Heihe River Basin in Asian arid areas. Mitig. Adapt. Strateg. Glob. Chang. 2019, 24, 1271–1292. [Google Scholar] [CrossRef]
- Guo, H.; Ling, H.; Xu, H.; Guo, B. Study of suitable oasis scales based on water resource availability in an arid region of China: A case study of Hotan River Basin. Environ. Earth Sci. 2016, 75, 984. [Google Scholar] [CrossRef]
- Zhu, X.; Zhang, G.; Yuan, K.; Ling, H.; Xu, H. Evaluation of agricultural water pricing in an irrigation district based on a bayesian network. Water 2018, 10, 768. [Google Scholar] [CrossRef]
- Ling, H.B.; Xu, H.; Guo, B.; Deng, X.; Zhang, P.; Wang, X. Regulating water disturbance for mitigating drought stress to conserve and restore a desert riparian forest ecosystem. J. Hydrol. 2019, 572, 659–670. [Google Scholar] [CrossRef]


Publisher’s Note: MDPI stays neutral with regard to jurisdictional claims in published maps and institutional affiliations. |
© 2020 by the authors. Licensee MDPI, Basel, Switzerland. This article is an open access article distributed under the terms and conditions of the Creative Commons Attribution (CC BY) license (http://creativecommons.org/licenses/by/4.0/).