Article

Impact of Sustainability Reporting and Inadequate Management of ESG Factors on Corporate Performance and Sustainable Growth

by
Camelia Oprean-Stan
1,
Ionica Oncioiu
2,*,
Iulia Cristina Iuga
3 and
Sebastian Stan
4
1
Faculty of Economic Sciences, Lucian Blaga University of Sibiu, 550324 Sibiu, Romania
2
Faculty of Finance-Banking, Accountancy and Business Administration, Titu Maiorescu University, 040051 Bucharest, Romania
3
Faculty of Economic Sciences, 1 Decembrie 1918 University, 510009 Alba-Iulia, Romania
4
Faculty of Military Management, Nicolae Balcescu Land Forces Academy, 550170 Sibiu, Romania
*
Author to whom correspondence should be addressed.
Sustainability 2020, 12(20), 8536; https://doi.org/10.3390/su12208536
Submission received: 7 September 2020 / Revised: 8 October 2020 / Accepted: 14 October 2020 / Published: 15 October 2020
(This article belongs to the Special Issue Corporate Governance and Sustainability Performance)

Abstract

:
The purpose of this research study is to examine and explain whether there is a positive or negative linear relationship between sustainability reporting, inadequate management of economic, social, and governance (ESG) factors, and corporate performance and sustainable growth. The financial and market performances of companies are both analyzed in this study. Sustainable growth at the company level is introduced as a dimension that depends on sustainability reporting and the management of ESG factors. In order to achieve the main objective of the paper, the methodology here focuses on the construction of multifactorial linear regressions, in which the dependent variables are measurements of financial and market performance and assess corporate sustainable growth. The independent variables of these regressions are the sustainability metrics and the control variables included in the models. Most of the existing literature focuses on the causality between sustainability performance and financial performance. While most impact studies on financial performance are restricted to sustainability performance, this study refers to the degree of risk associated with the inadequate management of economic, social, and governance factors. This work examines the effects of ESG risk management, not only on performance, but also on corporate sustainable growth. It is one of the few studies that addresses the problem of the involvement of companies in controversial events and the way in which such events impact the sustainability and sustainable growth of the company.

1. Introduction

In today’s business environment, the modern architecture of corporate sustainability is based on three pillars: Economic integrity, social justice and value, and environmental integrity [1]. It is clear that the combination of these factors will enable businesses to become profitable by achieving long-term growth goals, raising productivity, and optimizing shareholder value. On the other hand, the poor management of economic, social, and governance (ESG) risks by a company, as well as possible involvement in controversial events that may damage the company’s credibility and reputation in the market, may negatively affect both financial and market performance and the sustainable growth of the company. As a result, non-financial reporting is required to include information about how a business defines its position in society, as well as to strengthen the sustainable growth of corporations.
Increasingly, sustainability, the most commonly used term in corporate governance, is becoming a major concern for businesses of all sizes in an attempt to preserve capital for future generations [1,2,3,4]. Corporate sustainability can be seen as a modern concept in the field of corporate governance which enhances efficiency, shareholder value, and sustainable growth as an alternative to the traditional model of producing and optimizing income, especially as the main goal of the organization. This emerging paradigm considers that, while profit creation and maximization are important, there are other objectives with an impact on society that corporations must follow, such as those related to sustainable development.
The sustainability perspective offers a structure for value creation that relates both to achieving adequate income for the business and to meeting the needs of a diverse community of stakeholders [2]. Sustainability focuses not only on the needs of investors and shareholders, but also on the responsibility of stakeholders directly or indirectly affected or connected to the company. The concept of sustainability includes what is known as intergenerational equity [3], as it is not only an effective allocation of resources, but also a fair distribution of resources between present and future generations [4,5].
Companies operate in a global world that is affected by the past, present, and future. A short-term approach to sustainability is therefore no longer recognized because it aims at both the present and the future [6]. The principle of sustainability pays attention to not only the benefits, but also the long-term sustainability of the company. The basic principle of corporate sustainability is that businesses should completely integrate social and environmental goals with financial ones and justify their welfare activities to a broader spectrum of stakeholders via transparency and reporting mechanisms [7].
Sustainable reporting helps businesses to set goals, assess success, and implement progress to make them more sustainable. Through reporting, an organization analyzes its position in society and communicates its successes and shortcomings in order to strengthen its brand position. This enables differentiation between the organization and its rivals through the openness of the organization’s own activities, thereby boosting their financial results and providing accountability for achieving objectives [8,9].
Practically, businesses do not function in a vacuum, where their performance is instead influenced by the environment; therefore, financial figures targeting the performance of companies should be presented in their operating context in order to enable stakeholders to make accurate assessments [10]. Investor expectations are increasingly affecting the valuation of products. In times when non-financial assets are becoming a significant component in assessing the valuation of a corporation, the presentation of non-financial statements as a more comprehensive and accurate source of information than financial statements are becoming an increasingly common subject of discussion in the science and business communities.
A further reason for the increased need for non-financial reporting is based on morality. Current thinking supports the idea that organizations are morally obliged to make a positive contribution to society [11]. This concept is founded in the assumption that organizations exist because society has enabled them to operate, to use natural resources and, through their work, they can have an effect on the quality of the life of citizens [12].
Non-financial reporting is a topical issue, and the adoption of EU Directive 2014/95/EU on non-financial information increases the use of such reporting. Sustainability performance metrics are one of the most recognizable aspects of the principles and criteria that are commonly used for non-financial reporting. Creating a set of sustainability performance metrics helps organizations and stakeholders in the activity and evaluation of corporate sustainability success [13], and this is valuable for helping internal decision-making processes and can provide substantial added value to non-financial corporate communication.
The relationship between sustainability reporting and performance has been empirically explored in a number of previous studies. However, due to variations in methodologies, the results have been either inconclusive or inconsistent, with research suggesting both positive and negative relationships [14,15]. Two conflicting theories seek to explain the effect of sustainability on the financial results of a company: Value development and value destruction [16]. The approach to value creation theory is based on the premise that corporate risk is minimized by taking on social and environmental responsibility. Instead, the value destruction hypothesis suggests that businesses engaged in social and environmental responsibility lose emphasis on profits (to the detriment of shareholders) and then try to please stakeholders.
This study aims to analyze and clarify whether there is a positive or negative linear relationship between sustainability reporting, the inadequate management of environmental, social, and corporate governance (ESG) factors, and corporate performance and sustainable growth. ESG factors use economic, social, and governance criteria to assess businesses and countries as far as sustainability is concerned. In this analysis, the financial and market performances of companies are both analyzed. The novelty of this study is that we implement sustainable growth at the company level as a process that depends on the sustainability factors described above.
Starting from the objective described above, the main research question can be formulated, which will be answered by this study: Is there a statistically significant relationship between sustainability reporting, risk exposure to economic, social, and corporate governance (ESG) factors, financial or market performance, and sustainable corporate growth?
To achieve the main objective of the paper, the methodology focuses on the construction of multifactorial linear regressions using the SPSS program, in which the dependent variables are indicators of financial performance (chosen as, in this analysis, return on assets—ROA), the market performance indicator (chosen as Tobin’s Q index), and the indicator that measures the corporate sustainable growth (chosen as the sustainable growth rate—SGR). The independent variables of these regressions are sustainability metrics (sustainability reporting via the Global Reporting Initiative (GRI), the level of undertaken risk associated with the inadequate management of ESG factor (ESG risk), and involvement in controversial events—CEI) and the control variables that we included in the models. All these variables will be described in the methodology part of this paper.
The main contributions to this paper are presented as follows. This is one of few research studies to concentrate on sustainable growth at the company level as a process that depends on the sustainability factors listed above. Therefore, this study makes an important contribution to the investigation of the impact of ESG risk management, not only on performance, but also on sustainable growth.
Most impact studies on financial performance are restricted to sustainability performance. In this analysis, we refer to the degree of risk associated with the inadequate management of environment, social, and governance factors, which is another novelty of this paper. As mentioned, most of the specialist literature has focused on the causality between sustainability performance and financial performance; for example, the effect of corporate sustainability on financial results [17,18], the connection between sustainability performance and firm performance [19], the connection between firm-level sustainable practices and corporate reputation [20,21,22], and the link between corporate sustainability and business efficiency [23,24].
One factor that has not been discussed in previous studies, as far as we know, is the question of the involvement of businesses in controversial events and the way these events affect the success and sustainable growth of the business, so this is an under-researched topic. The involvement of companies in controversial events could have an impact on the environment or on society. Involvement in such evens means that the management systems of an organization are not sufficient to handle the related ESG risks. That is why this is another factor that we are taking into account.
The remainder of this article is structured as follows: Section 2 presents conceptual approaches to the literature review and the development of the hypothesis. The literature review outlines critical concepts, such as sustainability reporting, ESG risk, controversial event involvement, performance, and sustainable growth, as well as a brief presentation of the results of the causality studies between sustainability and performance. The research methodology is outlined in the Section 3 and the empirical findings are described and discussed. The discussion and conclusions of the study are outlined in the final parts of the article.

2. Literature Review and Hypotheses Development

2.1. Sustainability Reporting

Historically, sustainability reporting, in the strict sense of the term, has been accompanied by three distinct forms of reports: Annual reports, environmental reports, and social reports. The new term is “sustainability reporting” as the name for the latest integrated form of cultural, environmental, and social reporting [25]. The reporting language (used by companies) varies internationally from the following: Environmental reporting, corporate social responsibility (CSR) reporting, and corporate accountability reporting.
In the studies conducted by Zorio et al. [26] and Skouloudis and Evangelinos [27], CSR reporting and sustainability reporting are used interchangeably, referring to reports addressing economic, environmental, and social aspects of corporate operation and emerging as a new phenomenon in company reporting. Such reports explain the strategies, plans, and initiatives implemented by the organization, providing quantitative and qualitative information on economic, environmental, and social performance metrics. Indeed, corporate reporting, which was known as environmental reporting and later as CSR reporting, is now being repackaged as sustainability reporting [28].
The more recent historical trends in sustainability coverage are described, among others, by Hahn and Kühnen [29]. Throughout the 1970s, social studies were often created to supplement traditional financial statements, although exposure to environmental issues took precedence in the 1980s. Joint reports, including environmental and social statistics, along with financial reports, started to appear at the end of the 1990s following the Global Reporting Initiative (GRI) program, and this trend has continued [30]. At present, fully integrated reports containing economic, social, and environmental information in a single text are still prepared to provide comprehensive images of company activities [31].
The non-financial reporting requirement for large companies in the European Union was created with the adoption and publication in the Official Journal of the EU of Directive 2014/95/EU.

2.1.1. Why Technology Impacts the Reporting Process

Most businesses still do not understand how to apply methodologies in order to obtain superior performance [32]. Modern society needs greater transparency and accountability on the part of organizations. As a result, businesses are under pressure to provide more and more financial and non-financial information on their company and results. We may claim that non-financial information is just as important as financial information. According to research theoretically based on the principle of legitimacy [33], the option of an information disclosure setting depends on the target audience of the proposed message.
Management comments, as a part of annual reports, are intended for investors (who need different information from other stakeholders), while CSR reports are intended for the general public. Nevertheless, the reach and consistency of sustainability coverage depends on the target audience.
Technological advances contribute to more accurate data collection, improved analysis of sensitive and unregulated information, and uniform means of disclosure. Artificial intelligence and blockchain have become more efficient methods for reporting sustainability and are starting to be used in the reporting environment. These technologies provide a range of opportunities for organizations to enhance their reporting, activities, and decision-making through making use of efficient, more accurate, transparent, and verifiable data. Their widespread use has the potential to make substantial progress on the international sustainability agenda and to reform the non-financial reporting process [34].
Moreover, as indicated in the Sustainability and Reporting Trends of 2025 (GRI 2015), the new performance indicators, activated by technology development and digitalization, will enable companies to operate and report in a highly integrated manner in the coming years. There are increasing rates of operationalization in terms of their sustainable development [35].

2.1.2. Non-Financial Information Reporting

On top of that to rising global environmental consciousness and sustainable development campaigns, the growing pattern of sustainability coverage is also driven by a growing number of guidelines given by various governments and business organizations [36]. There are many non-financial reporting standards, such as the Global Reporting Initiative (GRI), the International Integrated Reporting Council (IIRC), and the Sustainability Accounting Standards Board (SASB). Consequently, according to some researchers [37], reports on GRI standards disclose much of the information about the company’s operations, as well as the details demanded by investors. The Global Reporting Initiative (GRI) is an agency that has pioneered the creation of a system for sustainability reporting. Most organizations follow the GRI structure, which has become the norm for reporting on sustainability. In their paper, Daizy and Das [38] pointed out that the GRI criteria provides more than 90 indicators of social responsibility, whereas other criteria have fewer indicators. GRI includes a reporting system that can be used by businesses of any size or sector. Hohnen [37] noted that the GRI criteria are the most commonly used by non-financial reporting organizations. According to the study, 95% of American companies, recognized as the most successful in the field of sustainable development, have produced reports in accordance with GRI standards.

2.1.3. Integrated Reporting

Throughout the past two decades, organizations have documented social and environmental problems in different reports [39]. Yet, over time, they have managed to develop their coverage style. Recently, there has been pressure to publish both financial and non-financial information in a single report [40]. This so-called integrated reporting (IR) is primarily sponsored by the International Integrated Reporting Council (IIRC), which has established a generally recognized conceptual framework [41]. The idea that businesses should broaden their reporting to incorporate all the tools they use as inputs for their business operations is fundamental to the principle of integrated reporting [42]. According to Abeysekera [43], IR integrates reporting on various aspects of organizational operations as a shared forum with a clear purpose, putting together all the core elements of organizational success in a single article.
After the creation of the International Council for Integrated Reporting (IIRC) in 2010, the concept of IR has rapidly expanded worldwide. In several countries, IR has been made compulsory for companies listed on stock exchanges [42]. IR is therefore a new issue, and previous non-financial reporting work has mostly concentrated on separate reports. The aim of IR is to present value creation over time and, thus, to provide recipients with more details on the business model of the organization than on periodic financial reporting and non-financial reporting [41]. Specifically, comprehensive reporting helps stakeholders to understand the interrelationship between the success of the business and its effect on people and the environment. Furthermore, it increases internal decision-maker comprehension of the relationship between the different roles, their existence, and the potential consequences.
The idea of integrated reporting originated in 1977 with the publication of the book entitled Social Audit for Management by Clark C. Abt. In 2000, the European Commission published the EU Financial Reporting Strategy: The Way Forward, which proposed that the annual report would include not only the financial dimension of a company, but also an overview of the environmental and social aspects required to understand growth and the company’s success or market.
The first comprehensive study was published in 2002 by Novozymes, a Danish pharmaceutical firm. In 2006, Directive 2006/46 of the European Commission required all listed companies in Europe to include a corporate governance statement in their annual report. In his paper, Owen [44] argued that integrated reporting offers shareholders a clearer and wider view of a company’s activities than conventional reporting. James [1] also indicated that integrated reporting would improve the productivity and operational performance of organizations and would also contribute to the long-term accomplishment of goals and missions.
Research studies, such as those carried out by Frias-Aceituno et al. [45] and Jensen and Berg [46], have found that businesses that issue an integrated study have substantially different characteristics than other firms. The authors found that the deciding factors, such as the size and competitiveness of the organization, have a positive effect on the decision to create a report.

2.1.4. Reporting in the Next Decade

More than half of the world’s 250 largest businesses report on sustainability [47]. Reporting rates in developed countries are high, such as France, Germany, Japan, the United Kingdom, and the United States. According to the GRI’s Reporting 2025 Project (Sustainability and Reporting Trends in 2025) [48], studies will be digital and carried out in real time. Future reports will no longer be a paper that is written and distributed once a year and will contain a complex and easily accessible dataset. If so, businesses will have less leverage over their performance information than they currently do, as their performance information will be compiled and analyzed using powerful search engines and analysis tools. A fully integrated report is defined as a report on the future. This concept defines the alignment of financial reporting and sustainability of a business with that of its suppliers or regional partners. This also applies to the physical convergence of other systems. There is only one challenge, which is the difficulty of determining which stakeholders to trust and the difficulty for companies to gain the confidence of stakeholders in the present jungle of digital platforms and smart search engines. This risk, if properly handled, does not affect the reputation and profitability of the company. With the advent of information technology, the language of communication will no longer be an obstacle for stakeholders because the transfer of information from one language to another will be achieved instantly by digital communication.

2.2. The Relationship between Sustainability Reporting and Financial Performance

Recent work has tried to develop the relationship between corporate sustainability performance and financial performance in both theoretical and empirical terms [40,49]. As of yet, the findings have been either inconclusive or contradictory. As a consequence, the preceding work is generally divided into two main categories that advocate either a positive or negative relationship.
Many articles state that sustainability has positive effects on long-term financial performance and return on investment and will ultimately lead to sufficient profits for companies. Companies not participating in their environmental liability could suffer possible collapses in the price of their shares if their investors are rational in considering the future value of the company on the basis of the current state of environmental responsibility [50]. Companies that pollute the environment could also experience a gradual depletion of revenues that could damage their future solvency. Social responsibility behaviors or sustainability practices can therefore contribute to the financial performance of a company [51].
The activities of companies towards sustainable development and the disclosure of non-financial information have both advantages and costs. Depending on the stronger impact, disclosure and reporting of non-financial information may have both positive and negative impacts on financial performance. As well, whether a positive impact will be revealed depends on the characteristics of the given country as a whole, the specific industry or market in which the company operates, and the characteristics of the company. In practice, studies have identified both the presence and the lack of a positive relationship [52].
There are studies that support sustainability reporting and disclosure and suggest that sustainable reporting is more transparent, showing the links between the financial sector of the company and the three components of sustainability [53]. There are many articles in the literature that seek to explain the relationship between sustainability and corporate financial performance. These theories relate to the influence (positive, negative, or neutral) and causality (direction) of the relationship. Briefly, we will present some articles that support each type of influence.

2.2.1. Studies that Have Revealed the Positive Effect of Separate Non-Financial Reporting on Financial Performance

To date, a significant number of studies have been conducted using different methodologies and samples, and they have shown that the publication of non-financial reports has had a positive impact on financial performance [54]. Alshehhi et al. [17] conducted a very extensive study of the literature on the impact of corporate sustainability reporting on the financial performance of a company. He studied 132 papers in top-level journals and concluded that 78% of the publications reported a positive relationship between sustainability and financial performance. Only 22% of the analyzed publications report a negative or mixed relationship or do not report any significant relationship between sustainability and financial performance. Ameer and Othman [18] studied the top 100 sustainable companies and noted a positive association between sustainability reporting and financial performance.
Presentation of the economic, environmental, and social aspects of sustainability reports has been proven to have a significant impact on the performance of the company’s market. These three aspects demonstrate the corporate contribution to economic development (both globally and locally), show the company’s concern for the environment, as well as its social contribution to the community, and improve the company’s image in the public’s eye, thus increasing the company’s market performance [54].
The study conducted by Reddy and Gordon [55] examined the impact of sustainability reporting on the financial performance of companies in New Zealand and Australia. The results of their empirical study showed that sustainability reporting is statistically significant in terms of explaining the profitability of Australian companies. Steyn [56] found that sustainability reporting contributes to the improvement of companies with superior financial performance.
Other studies have analyzed the impact of sustainability reporting on different characteristics at the company level, such as performance, yield, company value, stock prices, reputation, assets, and competitive advantages. A few of them are presented below.
In relation to share prices, Ansari [57] found that sustainability reporting had a positive effect on the share prices of real estate companies. Findings from other studies, such as Loh et al. [58] and Lourenco et al. [59], showed the usefulness of sustainability reporting. Lackmann et al. [60] argued that sustainability reporting can provide recipients with greater investment during economic downturns. They also claimed that investors take into account sustainability information while determining the value of a company.
Iatridis’ paper [61] describes the relationship between the quality of disclosure and corporate governance and raises the question of the extent to which the quality of reporting and disclosure of environmental information affects investor perceptions. The results of the study show that the disclosure of environmental information is usually correlated with the size of the company, the need for capital, profitability, and capital expenditure. The author concluded, therefore, that the publication of non-financial statements leads to an improvement in the perception of the investor and an increase in the value of the company.
Waddock and Graves [62] indicated a strong relationship between integrated reporting, the reputation of a company, and its social policy. Vafaei et al. [63] studied the impact of non-financial reporting on the net income and assets of companies in four countries: The United Kingdom, Austria, Singapore, and Hong Kong. Companies operating in traditional and non-traditional industries were analyzed. The conclusions of the authors were as follows: In the United Kingdom, non-traditional industries found a positive effect for both net profit and asset value, while traditional industries showed no such dependence. In Austria, the positive impact was observed only in non-traditional industries, but the positive impact was only on the value of the assets and not on the net profit. No significant positive impacts were identified in Singapore and Hong Kong. No positive effect was found in the sample for traditional industries (without country differentiation) and a positive relationship was found in non-traditional industries. Studies were also carried out in other international contexts. Aerts, Cormier, and Magnan [64] analyzed companies in continental Europe (Belgium, France, The Netherlands, and Germany) and North America (Canada and the USA) and concluded that environmental reporting was linked to a more accurate forecast of earnings, but that the relationship was stronger in Europe than in North America. Cormier and Magnan [65] studied French, Canadian, and German companies and argued that environmental reporting had a significant moderating effect on the market valuation of German companies, but not on Canadian or French companies.
Buallay’s work [66] aimed to investigate the relationship between sustainability reporting and operational banking performance (ROA), banking financial performance (ROE), and market performance (Tobin’s Q). The results of the study showed that there is a significant positive impact on performance of sustainability reporting. Lee Brown et al. [67] argued in their paper that sustainability reporting creates significant competitive advantages for companies. Albuquerque et al. [68] considered sustainability reporting to be a strategic product that brings profits to a company.
The studies conducted by Klassen and McLaughlin [69] and Lorraine et al. [70] used the event study method to examine the market impact of sustainability disclosure and obtained significantly different results. While Klassen and McLaughlin [69] considered that strong environmental performance is associated with significant positive returns in the United States, Lorraine et al. [70] argued that, in the United Kingdom, that only poor environmental performance is associated with a significant stock market response. Their report shows a one-week delay in market response (after the release of sustainability reports).
Studies have shown that variations in research methodologies and variable measurement lead to divergent opinions on the relationship between non-financial reporting and the profitability of companies [6,13,18,71]. In their article, Reddy and Gordon [55] supported the idea that contextual factors, such as the type of industry, have a significant impact on the returns of companies reporting non-financial data. Moreover, the literature is slowly replacing overall sustainability with more limited social responsibility (CSR). In this regard, Reddy and Gordon’s study [55] identified a number of contextual factors, such as the industry and type of sustainability report, which may have an impact on the profitability of companies.
Country-specific factors may play a role in explaining the contradictory findings of Feldman et al. [72], which identify a significant relationship between environmental reporting and market performance based on U.S. data, and the findings of Murray et al. [73], which, using data from the United Kingdom, do not establish a significant relationship between environmental reporting and market performance. Feldman et al. [72] investigated 300 U.S. companies and reported that improved environmental performance leads to a statistically significant reduction in the company’s environmental risk, which is assessed by the stock market in the form of a higher share price.

2.2.2. Empirical Studies Which Have Not Shown a Positive Effect of the Publication of Non-Financial Information on Financial Performance

We found a number of theories that focus on the downside of non-financial reporting and corporate performance. In contrast to stakeholder theory, Friedman [74] argues that the main purpose of a firm is only to increase stakeholder wealth, and any other non-financial objectives would make the firm less efficient. Overall, the financial sector appears to be less focused on social issues than environmental ones [52]. The author argues that the reporting of non-financial information does not have a significant impact on short-term or long-term financial indicators. Certain research [75,76] supports Friedman’s arguments and points out that investors expect a company to increase its wealth without sustainable policies and that sustainable policies should be pursued by non-profit organizations. On the other hand, a few researchers, such as Cordeiro and Sarkis [77], Preston and O’Bannon [78], and Shane and Spicer [79], have reported the existence of a negative relationship between sustainability reporting and corporate performance. Hamilton [80] conducted a study on 463 American firms and found a negative relationship between environmental reporting and price reactions to company shares.

2.2.3. Mixed Studies and Other Studies That Show an Unclear Relationship between the Disclosure of Sustainability and Financial Performance

The results of previous research also show that there are deficiencies in sustainability reporting, and that sustainability reporting is more useful for internal communication than for external communication [81,82]. Other opinions, such as those of Gray [83] and Gray and Milne [5], do not agree with the usefulness of existing sustainability reporting. In his study, Schreck [84], based on his own work and on data from 2006 on 300 new companies, developed the OLS regression model, which includes the following control variables among the explanatory ones: Level of social responsibility, size of the company, level of risk, and leverage. His model showed a positive relationship but concluded that adherence to the concept of sustainable development does not always lead to improved financial performance.
Several studies related to sustainability reporting show inconsistent results. Research conducted by Waworuntu et al. [85] and Ioannou and Sarafeim [86] indicates that the three components of sustainability reports have a significant positive effect, in part, on the performance of the company’s market. On the other hand, other research [87] has shown a negative impact for these factors.
Other authors, such as Gilley et al. [88], King and Lenox [89], Watson et al. [90], Link and Naveh [91], and Arragon-Correa and Lopez [92], have also reported an insignificant relationship between the disclosure of information on sustainability and financial performance. Several studies have identified an unclear relationship between the disclosure of sustainability and financial performance [93,94,95]. Park et al. [96] noted that the CSR practices undertaken lead to the positive performance of a company, but the activities initiated by company managers have a negative impact on the long-term performance of the company. Sukcharoensin [97] and Arshad et al. [98] studied the relationship between CSR practices and firm values, considering Tobin’s Q in Thai and Pakistani firms. They considered that there is no association between the values of the CSR and the economic performance of the companies.
Rahmanti [51] divided sustainability reports into three categories: Economic performance reports, environmental performance reports, and social performance reports. Their test results show that the disclosure of economic performance does not significantly influence the performance of a company. This result contradicts the result of Sitepu [99], which shows a significant relationship between the disclosure of economic performance and financial performance.
Another result of the study shows that the disclosure of environmental performance does not influence the performance of a company. This is also at odds with Sitepu [99] and Sekarsari [100], who believe that the disclosure of environmental performance affects the performance of a company. Finally, the last result refers to the disclosure of social performance, which, according to the author, has a significant impact on the performance of the company. Soana’s study [101], conducted on a sample of 68 Italian and international banks, analyzes the same relationship but in the banking sector instead. According to the results of the study, there is no statistically significant dependence on the sustainability indicators and the financial performance of companies in the banking sector. According to Hussain [102], a company that reports positive/negative information on social and environmental issues may increase/decrease its market value. By presenting environmental and social reports, the performance of companies can be improved/worsened.
In their study, Tariq et al. [103] argued that factors that have a positive impact on performance include increased disclosure of the business model, strategy, and resource allocation. On the other hand, factors which have had a negative impact on financial performance include the disclosure of risks and opportunities and even the disclosure of financial performance itself. The author argued that companies with a negative ROA try to win the advantage of investors by increasing their reporting levels, and that these reports do not function as a presentation of how the company continuously aligns its profitability with key strategies, but are instead an attempt by management to explain to what degree it is trying to make a business successful in a turbulent and difficult investment environment.
All of these discrepancies are the research gaps that have led researchers involved in carrying out this work to investigate how the effect of sustainability reporting and ESG risk management on performance and sustainable growth is exposed. The first hypothesis tested will be the following:
Hypothesis 1 (H1).
There is a significant relationship between sustainability reporting, inadequate management of environmental, social, and corporate governance (ESG) factors, and financial performance.

2.3. Understanding the Concepts of ESG Factors and ESG Risk Rating

The environmental, social, and governance (ESG) criteria are a set of standards used by socially conscious investors to monitor potential investments in a company’s operations. Environmental standards consider how an organization operates as a steward of nature. Social standards examine how an organization relates to employees, vendors, consumers, and the companies that they operate with. Governance standards consider corporate governance, executive pay, audits, internal controls, and shareholder rights.
Environmental considerations may include the use of electricity, waste, emissions, protection of natural resources, and animal welfare by an enterprise. Parameters may also be used to identify any environmental threats that a business may face and how the organization responds to those threats. Are there concerns that are relevant, for example, to the ownership of polluted property, the disposal of hazardous waste, the handling of toxic emissions, or compliance with government environmental regulations?
Social parameters look at the business relationship within the organization. Will it work with suppliers who still hold the same values? Should the company send a percentage of its income to the local community, or does it allow workers to do voluntary work there? Will the company’s working practices demonstrate strong respect for the health and safety of its employees? Have the interests of other parties been taken into account? As far as governance is concerned, investors may want to know that a business uses reliable and consistent forms of accounting and that shareholders have the ability to vote on important issues [104]. They may also like guarantees that corporations avoid conflicts of interest when selecting board members, do not use political donations to receive unduly favorable treatment and, of course, do not indulge in unethical activities.
ESG risk ratings are a very interesting concept that has been developed by Sustainalytics [49], a leading global provider of ESG and corporate governance products and services, supporting investors in the development and implementation of investment strategies that measure the degree to which ESG factors or, more technically speaking, the magnitude of the company’s economic value is at risk. It, therefore, gives investors a stronger signal of the performance of the company, which cannot be observed via the standard financial statements of the company. Hence, this study formulates the following hypothesis to test if companies reporting sustainability and better managing ESG risks achieve higher market performance:
Hypothesis 2 (H2).
There is a significant relationship between sustainability reporting, inadequate management of environmental, social, and corporate governance (ESG) factors and market performance.

2.4. Connecting the Concept of Sustainable Growth and ESG Factors

The concept of “sustainable growth” does not have a long-standing definition in the literature. It has different meanings for different individuals and groups of people. From a financial perspective, which is also addressed in this paper, sustainable growth means “affordable growth that can be profitably sustained for future benefits”. The concept of sustainable corporate growth was popularized by Higgins in 1977 [105], when he first attempted, by using a sustainable growth rate model, to explain the practical limits of the optimal development of the growing company.
The sustainable growth rate (SGR) model explains whether or not the company’s proposed development plan can be financed under existing financial parameters [106]. Specifically, the objective of the sustainable growth rate is to explain the largest annual increase in the percentage of sales that a company can afford without issuing equity or without changing its financial policies. Thus, according to this model, the value becomes the maximum around the rate of sustainable growth of the organization and falls sharply as soon as the actual growth exceeds the rate of growth [107]. This rate also allows that a company can grow without issuing new shares and without altering its financial leverage. It is reasonable to believe that the firm does not have sufficient funds when needed, cannot set targets for sustainable growth, and cannot pursue improved financial conditions, and this pressure requires changes in operational and/or financial policies. However, in today’s global competitive arena, the simple maximization of growth can help a company to meet its short-term goal of value creation, but not in the long-term [108].
Hypothesis 3 (H3).
There is a significant relationship between sustainability reporting, inadequate management of environmental, social, and corporate governance (ESG) factors, and sustainable growth.

3. Research Methodology and Data

3.1. Sample Design and Data Collection

The analyzed companies here are the 50 companies included in the calculation of the STOXX Europe 50 Index, Europe’s leading blue chip index, which offers a measure of Europe’s supersector members. It represents around 50% of the European stock market capitalization. The index covers 50 stocks, most of which are concentrated in France and Germany (17 firms, representing 34%, and 16 firms, representing 32%, respectively). Except for the banking sector (6 firms, representing 12%) and the consumer goods and services sector (5 firms, representing 10%), most industries are represented by one to four firms.
The main reason for choosing this index is the need to improve the generalization of the results obtained, as this study covers a wide range of economic sectors, including financial intermediation and insurance, industrial goods and services, personal and household goods, healthcare, technology, retail, chemicals, telecommunications, automobiles and parts, utilities, construction, and materials. In addition, by including these top companies, i.e., the components of the index, into the sample, we have ensured that they are, for the most part, geared towards sustainability objectives and that they invest funds towards meeting them. We started from the idea that drawing up a sustainability report and focusing on sustainability goals are processes that involve additional spending of funds that small and medium-sized enterprises may not be able to afford [40,45].
The study covers the period from 2013 to 2020 and therefore includes 750 annual observations of firms. Please note that due to the elimination of outliers before the regression analysis, the number of observations reported in the empirical regression might not be equal to 750. The data needed for this research were collected from the Yahoo Finance Datastream. The financial statements of these companies were compiled from the financial information provided on the Yahoo Finance website. ESG risk ratings (total rating and component ratings for the environment, social, and governance factors) and involvement in controversial events were also selected from Yahoo Finance using the Sustainalytics methodology [49].
We selected information on whether a company reports sustainability by using the GRI Sustainability Disclosure Database as follows: For each company in the sample, we manually checked if at least one sustainability report was published in the period considered. If published, it was marked with 1; otherwise, it received 0 points. Specifically, the data sources and methods for measuring these indicators are described in Table 1.

3.2. Substantiating the Variables in the Analysis

3.2.1. Measurement of Sustainability Variables

In this study, we use three types of sustainability variables. The first variable is the ESG risk ratings (both the total and components of the environment, social, and governance factors) developed by Sustainalytics, a leading global provider of ESG and corporate governance products and services, supporting investors in developing and implementing investment strategies [49]. The second variable included in the study as a dummy variable shows whether the sampled companies have published sustainability reports on the GRI Sustainability Disclosure Database. The third variable refers to event indicators, i.e., the level of involvement of companies in controversial events that have an impact on the environment or society.

Sustainalytics ESG Risk Ratings

The ESG risk score for a company consists of a quantitative score and a risk group. The quantitative score reflects units of unmanaged ESG risk with lower unmanaged risk ratings. Companies were classified into one of five risk groups based on their quantitative scores (negligible, low, medium, high, and severe). The scale of scores ranges from 0 to 100, with the most severe being 100. These categories of risk are absolute, meaning a “high risk” assessment reflects a comparable degree of unmanaged ESG risk across all covered subindustries. That is the key reason why we wanted to use this sustainability-related metric, as ESG risk ratings can be used to compare businesses from various subindustries, markets, businesses, and regions.
This variable is based on a two-dimensional basis (see Figure 1):
-
One dimension measures the exposure of a business to industry-specific ESG risks, indicating the sensitivity or vulnerability of the business or sub-industry to those risks.
-
The second dimension is management, or how well a firm manages those risks. Many of these threats are manageable, i.e., by means of effective legislation, programs, and projects that can be organized and directed. Another aspect is the unmanageable ESG risk, which is inherent in a company’s goods or services and/or the essence of a company’s business which the company cannot control.
The assessment framework for ESG risk scores distinguishes the controlled risk from the category of manageable risks, i.e., those specific ESG risks that a business has handled by means of effective policies, programs, or initiatives, as well as the management gap, which calculates the disparity between ESG material risk that the organization may face and what the company manages.
The final ESG risk ratings are a measure of unmanaged risk, which is described as a material ESG risk not controlled by a firm. This includes two types of risk: The unmanageable risk that cannot be addressed by company initiatives and the management gap. The management gap represents risks that could potentially be managed by a company but are not sufficiently managed according to the assessment. As a result, ESG risk ratings show the extent to which a company is exposed to ESG factors and what companies do or do not do to manage risks effectively.
To capture the impact of this metric on financial and market performance and sustainable growth in more detail, we evaluated both the overall score for ESG risk and the score on its components in terms of the environmental, social, and governance factors.

Sustainability Reports on GRI Sustainability Database

For all companies in the sample, we checked whether they published at least one sustainability report in the GRI Sustainability Disclosure Database during the period 2013–2020. This sustainability variable was introduced as a dummy variable in the study (companies obtained a score of 1 if they published at least a sustainability report, otherwise 0 during the period considered in the study).

Event Indicators: Involvement in Controversial Events

The event indicator is an indicator that offers a warning about a possible management issue by involvement in controversies. Sustainalytics measures the degree of involvement of businesses in controversial events which have an impact on the environment or society. Involvement in events can mean that the management structures of an organization are unsuitable for managing specific ESG risks. Each event occurrence is classified from category 1 (low environmental and social impacts, posing negligible risks to the company) to category 5 (severe environmental and social effects, posing serious risks to the company) (see Figure 2).

3.2.2. Selection and Measurement of the Performance Variables

We used both financial and market performance measures to evaluate the impact of sustainability reporting and exposure to environmental, social, and corporate governance (ESG) risks on a firm’s performance.
The financial performance of a company is interesting if we link the results obtained (most often in the form of profit) to the capital invested, as it is desired to obtain the highest possible return on the capital invested. As a result, the rate of return has the capacity to measure organizational performance most accurately. In this study, the return on assets (ROA) was used as a measure of the financial performance of a company from different perspectives, as considered by other authors [52,103,109,110,111,112,113,114,115,116]. The return on assets (ROA) measures the efficiency of the capital allocated to the assets of the company. Due to the fact that the ROA is not influenced by the types of capital sources used by the firm in the financing process, and therefore does not depend on the financing policy, it becomes the most appropriate ratio for inter-firm comparisons.
Many organizations use ROA along with the return on equity (ROE) to support their business decisions. Secondly, both internal and external stakeholders (e.g., employees and shareholders) use these measures to determine how well a firm performs. Thirdly, investors also use these indicators as the basis for their investment decisions. ROA data are available and can be calculated on the basis of the financial statements of the listed companies. This rate is therefore essential for the profitability of the company and measures the efficiency of the use of assets, taking into account the value of the profit earned.
In order to measure the market performance variable, we selected Tobin’s Q ratio, in line with other studies [117,118]. In the calculation of this coefficient, two variables are taken into account: The market value of assets and the value of the replacement cost of these assets. Thus, the balance is when the market value is equal to the replacement cost. The ratio can be determined not only at the level of assets, but also at the level of the company as a whole.
For the market values of companies, we calculated the capitalization of the market as a product between the closing price of shares and the number of shares. As far as the cost of replacing assets is concerned, Tobin used the book value in their analysis to determine it. In this study, we considered the replacement cost as determined by the net accounting assets, calculated by the decrease in the value of the total assets of the total liabilities (representing, in fact, the value of the equity).
However, we note that there are a number of problems related to this model, such as the following [119]: The market value is often influenced by various factors that are not under the control of the company’s management (the external perspective of the company). The replacement value also depends on the national or international accounting standards applied to that organization. Another limitation associated with this method is that it only uses financial and accounting data, and, in order to be able to objectively assess the level of efficiency of a company, a more comprehensive tool is needed, including both quantitative and financial variables as well as qualitative ones.
The sustainable growth rate (SGR) is the rate at which a company can use its own internal funds without borrowing money from banks or financial institutions [120] to achieve growth. The SGR is commonly used to plan long-term sustainable growth, capital investments, cash flow forecasts, and borrowing strategies. The SGR formula [105,121,122] is given as follows:
SGR = Net Profit Ratio × Asset Turnover Ratio × Equity Multiplier × Retention Rate
The net profit ratio is proportional to how much net income or benefit a percentage of revenue generates. The asset turnover ratio measures the value of the sales or revenues of a business relative to the value of its assets. The asset turnover ratio may be used as a measure of the efficiency with which a business uses its assets to produce revenue. The equity multiplier is a ratio of financial leverage that measures the portion of the assets of the company that is financed by equity of the shareholders. It is determined by dividing a company’s total asset value by the total shareholder equity. The retention ratio is the proportion of earnings held as retained earnings back in the company. The retention ratio refers to the percentage of net profits retained in order to grow the company, instead of being paid out as dividends. It is the opposite of the payout ratio, which measures the percentage of profit paid out as dividends to shareholders. The retention ratio is also called the plowback ratio.

3.2.3. Selection and Measurement of the Control Variables

When examining the relationship between sustainability reporting and exposure to environment, social, and corporate governance (ESG) risks and financial performance, market performance, and sustainable growth, it is important to take into account other variables that may affect these contingent factors. Failure to do so could result in biased tests. We also used control variables in our regression models to add value and certainty.
In the first model, as the first control variable, we used firm size (FS), determined by the logarithm of total assets, to establish the independent influences on financial performance. Empirical analysis found a link between business size and sustainability efficiency, as well as between firm size and certain financial performance indicators [123]. Shareholders, for example, may have greater expectations and concerns about the extent of responsibility for actions and activities carried out by larger companies. Withal, the size of the corporation may also impact the availability of tools that can be used to generate performance reports [124].
Consistent with previous studies [120,125,126], financial risk, determined by the debt ratio (DR), assessed by the total debt compared to the total assets, was also used as a second control variable. This variable accounts for risk related to the burden of debt. The debt level may have consequences for managerial behavior. In particular, it can limit a manager’s ability to pursue action and influence them to make decisions that are not in the best long-term interest of the organization [127].
In the second model, as the first control variable, we used firm size (FS), determined by the logarithm of total assets, in order to establish independent influences on market results. Investors are more confident in a major company’s financial success. Return on equity (ROE), measured by the net profit to the total shareholder equity, was also included as the second variable control because the yield of the shareholders’ financial investment in the company is a decisive factor for a company’s market value. ROE is a calculation of how efficiently a business makes use of resources to produce revenue. This rate is a measure of the return received by the owners of the company for the funds initially invested in the purchase of shares, which indicates the return on equity.
In the third model, conducted to assess the independent influences on the sustainable growth of companies, we used sales growth (SG), calculated as the percentage change in sales relative to the previous year’s revenues, as a first control variable, consistent with previous studies [113]. The ROA was also used as the second control variable, determined by net income to total assets, since the efficiency of using assets will produce maximum growth for the business.
Appendix A provides a description of the dependent, independent, and control variables used in this analysis.

3.3. Empirical Regression Models

In order to investigate the relationship between sustainability reporting, the management of environmental, social, and corporate governance (ESG) risks and financial performance, market performance, and sustainable growth, it is necessary to construct three multi-factorial linear regressions according to the general model represented in Equation (2):
Dependent Variable = f (Sustainability Reporting + ESG Risk Rating + Control Variables),
where the dependent variables are the financial performance (ROA), market performance (Tobin’s Q), and sustainable growth rate (SGR), and the independent factors are the following: Environmental, social, and governance (ESG) risk ratings (total, i.e., ESG risk, and for each of the components, i.e., ESG environment, ESG social, and ESG governance), sustainability reporting (GRI), and controversial event involvement (CEI). The control variables are firm size (FS) and leverage (debt ratio, DR) for the first regression model, FS and return on equity (ROE) for the second model, and ROA and sales growth (SG) for the third regression model.
More specifically, the multifactorial regression models we developed are presented below:
Model 1:
R O A = β 0 + β 1 G R I + β 2 E S G r i s k + β 3 E S G e n v i r o n + β 4 E S G s o c + β 5 E S G g o v + β 6 C E I + β 7 F S + β 8 D R + ε ,
Model 2:
T o b i n _ Q = β 0 + β 1 G R I + β 2 E S G r i s k + β 3 C E I + β 4 F S + β 5 R O E + ε ,
Model 3:
S S G = β 0 + β 1 G R I + β 2 E S G r i s k + β 3 E S G e n v i r o n + β 4 E S G s o c + β 5 E S G g o v + β 6 C E I + β 7 S G + β 8 R O A + ε ,
where β0, β1, …, β8 are the presumed parameters and ε denotes the measurement error term.
All data were analyzed using the SPSS statistical program. The statistical techniques used for data analysis, preceded by the validity of the models, are presented more accurately in the next section.

4. Empirical Results

4.1. Model Validity

To test the model validity, we analyzed whether observations were independent (i.e., analysis of the independence of residuals) by specific tests. The statements about multiple regression that we tested were the following: (a) The independent variables are collectively linearly related to the dependent variable; and (b) every independent variable is linearly related to the dependent variable. We also tested whether the data show residual homoscedasticity (equal variances in error), whether the data show no multicollinearity, and whether there were any significant outliers, high leverage points, or highly influential points.
For the three regression models, we initially encountered problems with multicollinearity [128], in the sense that the CEI and ESG governance variables in model 1, the CEI variable in model 2, and the ESG governance variable in model 3 achieved a VIF (variance inflation factor) value greater than 10. As a result, we decided to remove these variables from the analysis and it was necessary to re-run all the analyses carried out so far.
The assumption of the independence of observations in a multiple regression is structured to check for autocorrelation of the 1st order, which implies that adjacent observations (specifically their errors) are associated (i.e., not independent). Independence of errors (residuals) was present for all three models, as measured by a Durbin–Watson statistic of 1.415 in model 1, 2.278 in model 2, and 2.236 in model 3 (see Table 2), where the values are very similar to 2, so it can be agreed that there is independence of residuals.
To check for linearity, we evaluated (a) whether there was a linear relationship between the dependent and independent variables collectively by plotting a scatterplot of the studentized residuals against the (unstandardized) predicted values. We also evaluated (b) whether there was a linear relationship between the dependent variable and each of the independent variables by using partial regression plots between each independent variable and the dependent variable.
In all three models, since the residuals formed a horizontal band, the relationship between dependent variables and independent variables is likely to be linear. Whether there was a linear relationship between the dependent variable and each of the independent variables was established using partial regression plots. We observed that the partial regression plot shows an approximately linear relationship between the dependent variables (ROA, Tobin’s Q, SGR) and each independent variable. In addition, there was homoscedasticity, as assessed by visual inspection of a plot of the studentized residuals versus the unstandardized predicted values.
Multicollinearity occurs when two or more independent variables are strongly associated. Multicollinearity identification has two stages: Inspection of coefficients of correlation and the inspection of values of tolerance/VIF.
Following the analysis of the correlation between variables in the study, we noted that most of the correlations between independent variables had values of less than 0.7. In models 1 and 3, only the relationship between ESG environment and the ESG social variables was 0.789, while that between the firm size and debt ratio was 0.724 (in model 1).
Most importantly, we looked at the “tolerance” and “VIF” values in the coefficients table. In models 1 and 2, following the omission of the CEI and ESG governance variables, all tolerance values were greater than 0.1 (the lowest values were 0.297 in model 1 and 0.527 in model 2). In model 3, after omission of the ESG governance variable, all tolerance values were greater than 0.1 (the lowest was 0.357). As a result, we confident that the models do not feature a collinearity problem.
In addition, we performed diagnostic analysis of outliers, high-leverage points, and influential points. This was achieved using Cook’s distance, the leverage statistic, and other related metrics. This was very significant, as all these points may have a negative effect on the equation of regression used to estimate the value of the dependent variable depending on the independent variables. This could alter the performance provided by SPSS Statistics and decrease both the predictive accuracy of the results and the statistical significance.
Casewise diagnostics and the studentized deleted residuals technique were used to identify the outliers. The casewise diagnostics table highlights any cases where the standardized residual of that case is greater than ±3 standard deviations. In all three models, all cases featured standardized residuals less than ±3, but from the study of studentized deleted residuals, in the three models, we found variables with values greater than ±3 standard deviations, resulting in these outliers being excluded from the dataset.
To order to be able to run inferential statistics (i.e., to assess statistical significance), the prediction errors (i.e., the residuals) need to be normally distributed. We used two popular methods to test the assumption of normality of residuals, namely, a histogram with a superimposed normal curve and a P–P plot. Following the analysis, we noticed that although the points were not perfectly aligned along the diagonal line (the distribution was somewhat peaked), they were close enough to indicate that the residuals were sufficiently close to normal for the analysis to proceed. Since multiple regression analysis is fairly robust against deviations from normality, we accepted this result as an indication that no transformations would need to occur and that the assumption of normality had not be violated.

4.2. Correlation Analysis

Correlation analysis was used to determine the degree to which the variation of the dependent variable relates to the variation of the independent variables in each model. Table 3, Table 4 and Table 5 present the results of the analysis of the correlation between the variables in the study.
The product-moment correlation of Pearson was run to assess the relationships between the dependent variables (ROA, Tobin’s Q, and SGR) and independent variables. Following the study of Pearson correlation coefficient values, we noted the following:
-
In model 1, there was a statistically significant, moderately negative correlation between ROA and ESG with a correlation coefficient of −0.304, p < 0.0005. The increase in exposure to ESG risk was moderately correlated with a decrease in ROA. ROA showed, as expected, a statistically significant strong and negative correlation with FS and DR. ROA was negatively correlated with FS, having a coefficient of correlation of −0.595, p < 0.0001. ROA and DR were also negatively correlated with a correlation coefficient of −0.697, p < 0.0001. The increase in firm size and debt ratio was strongly correlated with the decline in ROA. These results were already reflected in the hypotheses tests, where the linear relationship between the ROA and the other variables in the model was anticipated.
-
In model 2, Tobin’s Q was negatively correlated with all independent variables in the study, but the only statistically significant correlation was with the GRI variable, showing a moderately negative correlation with a correlation coefficient of −0.349, p < 0.0005. The increase in GRI was moderately correlated with a decrease in Tobin’s Q, which is a rather surprising result, as sustainability reporting is expected to have a positive impact on market performance. The relationship with the other variables, including the ESG risk, although negative, was neutral.
-
In model 3, there was a statistically significant, small positive correlation between sustainable growth and GRI. There was, however, no statistically significant correlation between the SGR and the independent factors in the model.

4.3. Estimation Results

4.3.1. Determining Whether the Multiple Regression Model Is a Good Fit for the Data

There are a number of measures that one can use to determine whether a multiple regression model is a good fit for a given dataset. These measures include (a) the multiple correlation coefficient, (b) the percentage (or proportion) of variance explained, (c) the statistical significance of the overall model, and (d) the precision of the predictions from the regression model.
One of the important findings for the understanding of regression analysis, the R2 value, reflects how much (i.e., the percentage) variation of the dependent variable can be explained by an independent variable. A higher value of the R2 suggests a better linear relationship. For this analysis, we used the classification of regression relationships into four classes, based on the value of this measure, as follows [129]: A very strong relationship if R2 > 0.75, a strong relationship with the value of R2 within the range of 0.5–0.75, a weak relationship with the value of R2 within the range of 0.25–0.5, and a very poor relationship with the value of R2 < 0.25.
R2 was 56.2% for the first iteration, with a modified R2 of 50.1%, suggesting a large impact. Approximately 56% of the ROA volatility for the sampled companies can be explained by the selected dependent variables (GRI, ESG risk, ESG environment, ESG social, firm Size, and debt ratio). R2 was 22.4% for the second model, with a modified R2 of 14.6%, suggesting a very small impact. Approximately 22% of the Tobin’s Q volatility in the case of the sampled firms can be explained by the selected dependent factors (GRI, ESG risk, firm size, and return on Equity). R2 for the third model was 46% with a modified R2 of 36.8%, indicating a small to large impact. Approximately 46% of the sustainable growth volatility of the sampled companies can be explained by the selected dependent factors (GRI, ESG risk, ESG environment, ESG social, controversial event involvement, sales growth, and return on assets).
However, R2 is based on the sample and is considered a positively-biased estimate of the proportion of the variance of the dependent variable accounted for by the regression model (i.e., it is larger than it should be when generalizing to a larger population). Despite this criticism, it is still considered by some to be a good starting measure for understanding results [130].

4.3.2. Statistical Significance of the Model and Application of the ANOVA Method to the Null Hypothesis Test

In the results given by SPSS, the test coefficient F in the ANOVA table was used to determine the general predictive value of the regression model. Unless the results of the F test are not statistically important, the regression model does not have a reasonable predictive value.
The rule we applied in the calculations, taking into account the 5% significance point, was that if the likelihood of the F test is less than the 5% significance level, then at least one of the coefficients was statistically important, thus rejecting the null hypothesis. In other words, if the likelihood is higher, then all the coefficients have a value of zero from a statistical point of view, and, in this case, there is not enough proof to refute the null hypothesis. Nevertheless, the lack of evidence to refute the null hypothesis is not proof of acceptance of the null hypothesis [131].
Null Hypothesis H01.
There is no significant correlation between the ROA and the independent factors.
The ANOVA analysis indicated that the regression model of the dependent variable (ROA) was statistically important, since F(6.42) = 11,499, and the likelihood associated with the test was lower than the significance level of 0.05, p = 0.00, and the null hypothesis was therefore rejected. There was a statistically significant correlation between the dependent variables and the independent factors considered in the predictive utility model for ROA (GRI, ESG risk, ESG environment, ESG social, debt ratio, and firm size).
Null Hypothesis H02.
There is no significant correlation between Tobin’s Q and the independent factors.
The ANOVA study indicated that the regression model of the dependent variable (Tobin’s Q) was statistically important, since F(4.40) = 2887, and the likelihood associated with the test was lower than the significance level of 0.05, p = 0.34; thus, the null hypothesis was rejected. As a result, the independent factors considered in the Tobin’s Q predictive utility model have a statistically significant relation between this measure and the independent factors (GRI, ESG risk, return on equity, and firm Size).
Null Hypothesis H03.
There is no significant correlation between SGR and the independent factors.
The ANOVA analysis indicated that the regression model of the dependent variable (SGR) was statistically important, since F(7.41) = 4995, and the likelihood associated with the test was lower than the significance level of 0.05, p = 0.00; thus, the null hypothesis was rejected. There was a statistically significant correlation between this predictor and the independent factors considered in the predictive utility model for SGR (GRI, ESG risk, ESG climate, ESG social, controversial event involvement, return on assets, and sales growth).

4.3.3. Interpreting and Displaying the Regression Model Coefficients

The regression coefficients and standard errors for all three models can be found in Table 6, Table 7 and Table 8.
In the tables above, the model fit statistics and values of the coefficients were rounded to 2 decimal places in line with the 7th edition APA style [132].
The description of the coefficients for independent variables is given as follows:
Within model 1, the ESG environment and firm size independent variables were positively related to the dependent ROA variable. Nevertheless, other independent variables, such as GRI, ESG social, debt ratio, and ESG risk, were negatively related to the dependent variable. As a result, an increase in the probability of ESG is associated with a decrease in ROA. There was a reduction in the ROA, since the coefficient of slope was negative. The ESG risk and debt ratio are the only independent variables that are statistically relevant (i.e., p < 0.05), which means that they are distinct from 0 (zero). There were slope coefficients that were not statistically significant, which indicates that there were independent variables that were not statistically significant because their p-value was greater than 0.05. This is true for the GRI, ESG climate, ESG social, and firm size variables.
For model 2, the independent variable GRI and the control variables firm size and ROE were negatively related to the dependent Tobin’s Q variable. The ESG risk was positively linked to the dependent variable. As a result, an increase in ESG risk was correlated with an increase in the Tobin’s Q value. The GRI factor is the only independent factor that was statistically relevant (i.e., p < 0.01). There were slope coefficients which were not statistically significant, and they related to ESG risk, firm size, and ROE.
In model 3, the independent variable ESG environment and control variables sales growth and ROA were positively related to dependent variable sustainable growth. However, other independent variables, such as GRI, ESG risk, ESG social, and CEI, were negatively related to the dependent variable. As a result, an increase in the values of such variables was correlated with a decrease in sustainable growth. The only independent variables that were statistically relevant (i.e., p < 0.01), which means that they were different from 0 (zero), were the ESG environment and ESG social variables. There were slope coefficients that were not statistically significant for GRI, ESG risk, CEI, sales growth, and ROA.

4.4. Robustness Check

The next section deals with robustness tests to review the sensitivity of the results reported, in order to identify potential issues related to the collection of data samples or the specification of model valuation.
In line with other studies [125], we intended to examine additional measures for dependent variables in the three models. We considered the return on equity (ROE), measured by the reporting of the net profit generated by the company and the value of the equity, to be another measure of financial performance. Next, the price earnings ratio (PER), as a ratio between price and earnings, was considered as another measure of market performance, and asset growth (AG, compared to the previous year) was used as an alternative measure of sustainable growth.
We regressed all models again using these different dependent variables. The results of these robustness checks were consistent with the basic results and confirmed the findings in our models, which suggests that the statistical findings presented in this paper are fairly robust.

5. Discussion

The aim of this study has been to provide a clear understanding of the relationship between sustainability reporting, the performance of managing ESG factors and financial performance, market performance, and the sustainable growth of the companies sampled here. Three linear relationships have been established between the indicators of financial performance, market performance, and sustainable growth (i.e., ROA, Tobin’s Q, and SGR) and related sustainability indicators (i.e., GRI, ESG overall risk and the ESG components (ESG environment, ESG social, and ESG governance) and the CEI).
Consistent with the results, the lack of consistency in the reporting of sustainability means that quality data are not available in order to conduct studies that could address the issue correctly. Furthermore, the findings from studies involving sustainability reporting and financial performance support the idea that there is evidence of improved financial performance through sustainability reporting. The lack of theories supporting such a relationship means that the evidence of any causal relationship remains unclear and inconclusive [69,70,71,72,73].
In additional, Horvátová [104] conducted a meta-analysis of 64 results from 37 empirical studies and concluded that fragmentation and inconsistency prevailed due to method inconsistency. From a business perspective, our findings also suggest the necessity of the use of advanced regression models and longer periods of time to analyze the impacts of sustainability reporting on corporate financial performance.
The first multiple regression was used to predict ROA from GRI, ESG risk, ESG environment, ESG social, ESG governance, CEI, and the control variables of firm size and debt ratio. Linearity was assessed by partial regression plots and via the studentized residual plot against the predicted values. Residual independence was assessed with the Durbin–Watson statistic of 1.415. Homoscedasticity was assessed by visual inspection of the studentized residual plot versus non-standardized predicted values. We first encountered problems with multicollinearity for this model. To remedy this problem, we decided to remove the CIE and ESG governance variables from the analysis, and it was necessary to re-run all the analyses carried out so far. All cases featured standardized residuals of less than ±3 standard deviations, but in the analysis of the studentized deleted residual values, variables with values greater than ±3 standard deviations were detected, resulting in the removal of these outliers from the dataset. The assumption of normality, as assessed by the Q–Q plot, was met. The multi-regression model statistically significantly predicted ROA, with F(6.42) = 11.499, p < 0.0005, and adj. R2 = 0.50. All six variables that remained in the analysis after adjusting for non-multicollinearity assumptions were statistically significant for the forecast in the model, where p < 0.05. The individual predictors were further investigated and indicated that ESG risk (p < 0.05) and the debt ratio (p < 0.001) were significant predictors of the model.
A second multiple regression was run to predict Tobin’s Q from GRI, ESG risk, and the control variables of firm size and ROE. Linearity was evaluated by partial regression plots and the studentized residual plot against the predicted values. Residual independence was assessed via the Durbin–Watson statistic of 2.278. Homoscedasticity was assessed by visual inspection of the studentized residual plot versus non-standardized predicted values. We also encountered problems with multicollinearity for this model. In order to solve this problem, we decided to remove the CEI variable from the analysis, and it was necessary to re-run all the analyses carried out so far. All cases featured standardized residuals of less than ±3 standard deviations, but in the analysis of the studentized deleted residual values, variables with values greater than ±3 standard deviations were detected, resulting in the removal of these outliers from the dataset. The assumption of normality, as assessed by the Q–Q plot, was met. The multi-regression model statistically significantly predicted Tobin’s Q, with F(4.40) = 2.887, p < 0.0005, and adj. R2 = 0.15. GRI was the only independent factor that was statistically significant to the forecast (i.e., p < 0.05).
The third regression was carried out to predict sustainable growth from GRI, ESG risk, ESG environment, ESG social, ESG governance, CEI, and the control variables of sales growth and ROA. Linearity was assessed by partial regression plots and the studentized residual plot against the predicted values. Residual independence was assessed via the Durbin–Watson statistic of 2.236. Homoscedasticity was assessed by the visual inspection of the studentized residual plot versus the non-standardized predicted values. We encountered problems with multicollinearity for this model. In order to solve this problem, we decided to remove the variable ESG governance from the analysis, and it was necessary to re-run all the analyses carried out so far. All cases featured standardized residuals with standard deviations less than ±3, but in the analysis of the studentized deleted residual values, variables with values greater than ±3 standard deviations were detected, resulting in the removal of these outliers from the data set. The assumption of normality, as assessed by the Q–Q plot, was met. The results of the multiple linear regression indicated that there was a significant collective effect between SG and the independent variables considered in the model, with the result that the multiple regression model statistically significantly predicted SG, where F(7.41) = 4.995, p < 0.0005, and adj. R2 = 0.37. Together, all seven variables remained statistically significant for the forecast in the model, where p < 0.05. The individual predictors were further investigated and indicated that the ESG environment and the social ESG variables (p < 0.01) were significant predictors for the model.

6. Conclusions

This article has discussed how sustainability reporting and the inadequate management of ESG factors affects a company’s financial performance (i.e., return on assets), market performance (i.e., Tobin’s Q-value), and sustainable growth. The publication of non-financial statements is assumed to have a positive effect on ROA, Tobin’s Q, and sustainability growth, but ESG risk exposure is expected to have a negative effect on the dependent factors.
From the application of our model, an interesting finding was that sustainability reporting is not important for the financial performance metric. King and Lenox [133] also provided a possible reason for this, arguing that information about sustainability can take two years to influence financial performance.
In our analysis, we could not find evidence that market performance is positively affected by sustainability reporting. Caesaria and Basuki [54] previously provided the strongest support for the relationship between sustainability disclosure and corporate market performance. According to our findings, an organization that discloses information on sustainability aspects can decrease its market performance, assessed by the Tobin’s Q value testing.
In fact, the positive effect of the non-financial disclosure on the value of Tobin’s Q assumed in this article is due to the fact that this figure takes into account the changing expectations of investors regarding the company’s book value [109], that is to say, it takes into account the changing expectations regarding the different parameters affecting the assessment of future cash flows. It seems logical that the effect on the publication of a non-financial report on Tobin’s Q will be more short-term than on ROA. Tobin’s Q may change quickly as a result of both investor expectations of future cash flows and the value of the company.
As this study has demonstrated, sustainable growth is influenced by the environmental and social aspects of sustainability. Improved ESG social management supports the sustainable growth of the companies. Contrary to our assumptions, we found no relationship between the disclosure of sustainability and sustainability growth, between ESG risk and market performance, and between CEI and financial and market performance. The fact that information on sustainability reporting is not substantially linked to market performance indicates a more integrated and comprehensive reporting system [102]. It is also important to note that reporting alone has less meaning in itself, but it does have the potential to positively impact the market success of the company, as it provides information about the capacity of the firm to achieve sustainable development goals.
The findings obtained from our empirical study also suggest that the inadequate management of sustainability-related ESG factors has a substantial negative effect on the financial performance of reporting firms, as we predicted. In particular, our evidence indicates that the various aspects of sustainability (i.e., governance, social, and environmental) are not equally applicable to financial performance. Therefore, the implications of this research for practitioners are that the governance dimension is never important enough to justify any change in the financial performance of the company (in line with Hussain’s findings [102]), but poor management of the social aspect is negatively related to the financial performance.
At the same time, our research has found that the ESG disclosure cannot be limited to describe a company’s commitment to sustainability in a generic manner, emphasizing the adoption of specific codes of conduct and adherence to ethical values. According to this perspective, the company should be to clearly and systematically show how the various pillars—the infrastructure management, the customer interface, and the financial aspects—are impacted by social and environmental activities.
Likewise, the implication of this research for policy makers is that using ESG disclosure at the level of organizations in Romania can improve their corporate sustainability practices and can aid socially responsible firms in terms of having a well-functioning corporate governance system in line with designing for sustainable growth.
This research study has the following limitations: We found independent variables that were not statistically significant, among others. Our model-building method was considered in terms of theory-based criteria; more specifically, to assess an independent variable by its theoretical value is to determine whether to hold or delete an independent variable that is not statistically important in the regression model. Previous studies show that the independent variables considered in this study are related to the variables that are dependent on them. In our study, as we have shown in Section 2 of this paper, the dependence between financial and market performance and sustainability indicators is well established in the literature. It, therefore, made complete sense to include the sustainability reporting variable in the study, even though it was not statistically relevant in the second model.
The fact that the sample size was insufficient to show the true spectrum of the relationship may be a reason for the lack of statistical significance for these independent variables. In this analysis, the criterion for selecting the company component of the index was necessary due to the need for accessible information on financial statements and sustainability indicators. The selection of samples with specific criteria restricts the generalization of the findings of this study. Once the data are available, further research using a larger number of measurements can be carried out to check the validity of the findings of this study.

Author Contributions

Depending on their research interests and experience, all authors had important contributions to this paper: Conceptualization, I.C.I. and C.O.-S.; methodology, C.O.-S.; software, C.O.-S.; validation, S.S., C.O.-S.; formal analysis, I.C.I. and I.O.; investigation, S.S. and I.O.; resources, S.S.; data curation, C.O.-S.; writing—original draft preparation, C.O.-S., S.S., I.C.I. and I.O.; writing—review and editing, C.O.-S.; visualization, I.C.I. and I.O.; supervision, C.O.-S.; project administration, C.O.-S. All authors have read and agreed to the published version of the manuscript.

Funding

Project financed by Lucian Blaga University of Sibiu & Hasso Plattner Foundation research grants LBUS-IRG-2020-06.

Conflicts of Interest

The authors declare no conflict of interest.

Appendix A

Dependent Variables
IndicatorDescription
Return on Assets (ROA)ROA is calculated by dividing the net income by the total assets of the company. It is an indicator of the effectiveness of the global management of the assets of a company.
Tobin’s QThe Q factor can be written as the ratio between the market value and the asset replacement value (in the case of this study, the asset replacement value is the net book asset).
Sustainable Growth Rate (SGR)The SGR is the optimal growth rate of the company, without creating imbalances, due, for example, to the need to access additional capital from banks or financial institutions or by issuing shares. It is calculated as a product between net income ratio, asset turnover ratio, equity multiplier, and retention rate.
Independent Variables
IndicatorDescription
ESG RiskESG risk rating scores are a measure of unmanaged risk, which is defined as material ESG risk that has not been managed by a company.
CEIThis indicator assesses the level of involvement of the companies in controversial events that have an impact on the environment or society.
GRIThis indicator expresses sustainability reporting, i.e., if the companies published at least a sustainability report in the GRI Sustainability Disclosure Database during the period considered in this study.
Control Independent Variables
IndicatorDescription
Firm Size (FS)Firm size, measured by the logarithm of the total assets recorded in the balance sheet, is a control variable because investors have greater confidence in the financial potential of a large company and, as a result, the size of the company can influence the profitability of the company.
Debt Ratio (DR)The debt ratio, measured by the total debt to its total assets, represents the risk associated with the debt burden. It makes it possible to compare the leverage between different companies.
Sales Growth (SG)Sales growth, measured as a percentage change in sales compared to the previous year’s sales. It characterizes the total amount of income received by the company during the year.
Return on Equity (ROE)ROE is calculated by dividing the net income by shareholder equity. It actually refers to the efficiency with which the capital invested by the owners is used.

References

  1. James, M.L. The benefits of sustainability and integrated reporting: An investigation of accounting majors’ perceptions. J. Leg. Ethical Regul. 2014, 17, 93–113. [Google Scholar]
  2. Lopez, M.V.; Garcia, Q.A.; Rodriguez, L. Sustainable development and corporate performance: A study based on the Dow Jones Sustainability Index. J. Bus. Ethics 2007, 7, 285–300. [Google Scholar] [CrossRef]
  3. Cairms, R.D. On accounting for sustainable development and accounting for the environment. Resour. Policy 2006, 31, 211–216. [Google Scholar] [CrossRef]
  4. Gray, R. The social accounting project and accounting organizations and society: Privileging engagement, imaginings, new accountings and pragmatism over critique? Account. Organ. Soc. 2002, 27, 687–707. [Google Scholar] [CrossRef]
  5. Gray, R.; Milne, M. Sustainability reporting: Who’s kidding whom? Chart. Account. J. N. Z. 2002, 81, 66–70. [Google Scholar]
  6. Aras, G.; Crowther, D. Governance and sustainability: An investigation into the relationship between corporate governance and corporate sustainability. Manag. Decis. 2008, 46, 433–448. [Google Scholar] [CrossRef]
  7. Gao, S.; Zhang, J. Stakeholder engagement, social auditing and corporate sustainability. Bus. Process Manag. J. 2006, 12, 722–740. [Google Scholar] [CrossRef]
  8. Krzus, M.P. Integrated Reporting: If Not Now, When? Available online: https://www.mikekrzus.com/downloads/files/IRZ-Integrated-reporting.pdf (accessed on 15 May 2020).
  9. Matthews, M.R. Twenty-five years of social and environmental accounting research: Is there a silver jubilee to celebrate? Account. Audit. Account. J. 1997, 10, 481–531. [Google Scholar] [CrossRef]
  10. Lipunga, A.M. Integrated reporting in developing countries: Evidence from Malawi. J. Manag. Res. 2015, 7, 130. [Google Scholar] [CrossRef] [Green Version]
  11. Grigore, L.S.; Priescu, I.; Joita, D.; Oncioiu, I. The Integration of Collaborative Robot Systems and Their Environmental Impacts. Processes 2020, 8, 494. [Google Scholar] [CrossRef] [Green Version]
  12. Nuta, I.; Orban, O.; Grigore, L.S. Development and improvement of technology in emergency response. Proc. Econ. Financ. 2015, 32, 603–609. [Google Scholar] [CrossRef] [Green Version]
  13. Raucci, D.; Lara, T. Sustainability performance indicators and non-financial information reporting. evidence from the Italian case. Adm. Sci. 2020, 10, 13. [Google Scholar] [CrossRef] [Green Version]
  14. Margolis, J.D.; Walsh, J.P. Misery loves companies: Rethinking social initiatives by business. Adm. Sci. Q. 2003, 48, 268. [Google Scholar] [CrossRef] [Green Version]
  15. Orlitzky, M.; Schmidt, F.L.; Rynes, S.L. Corporate social and financial performance: A meta-analysis. Organ. Stud. 2003, 24, 403–441. [Google Scholar] [CrossRef]
  16. Yu, M.; Zhao, R. Sustainability and firm valuation: An international investigation. Int. J. Account. Inf. Manag. 2015, 23, 289–307. [Google Scholar] [CrossRef]
  17. Alshehhi, A.; Nobanee, H.; Khare, N. The impact of sustainability practices on corporate financial performance: Literature trends and future research potential. Sustainability 2018, 10, 494. [Google Scholar] [CrossRef] [Green Version]
  18. Ameer, R.; Othman, R. Sustainability practices and corporate financial performance: A study based on the top global corporations. J. Bus. Ethics 2012, 108, 61–79. [Google Scholar] [CrossRef]
  19. Goyal, P.; Rahman, Z.; Kazmi, A.A. Corporate sustainability performance and firm performance research Literature review and future research agenda. Manag. Decis. 2013, 51, 361–379. [Google Scholar] [CrossRef]
  20. Gomez-Trujillo, A.M.; Velez-Ocampo, J.; Gonzalez-Perez, M.A. A literature review on the causality between sustainability and corporate reputation: What goes first? Manag. Environ. Qual. 2020, 31, 406–430. [Google Scholar] [CrossRef]
  21. Gangi, F.; Daniele, L.M.; Varrone, N. How do corporate environmental policy and corporate reputation affect risk-adjusted financial performance? Bus. Strategy Environ. 2020, 29, 1975–1991. [Google Scholar] [CrossRef]
  22. Alon, A.; Vidovic, M. Sustainability performance and assurance: Influence on reputation. Corp. Reput. Rev. 2015, 18, 337–352. [Google Scholar] [CrossRef]
  23. Mustapha, N.A.; Hassan, R. Organizational efficacy and corporate sustainability in business performance: A literature review. Adv. Sci. Lett. 2018, 24, 3493–3497. [Google Scholar] [CrossRef]
  24. Appelbaum, S.H.; Calcagno, R.; Magarelli, S.M.; Saliba, M. A relationship between corporate sustainability and organizational change (part two). Ind. Commer. Train. 2016, 48, 89–96. [Google Scholar] [CrossRef]
  25. Daub, C.-H. Assessing the quality of sustainability reporting: An alternative methodological approach. J. Clean. Prod. 2007, 15, 75–85. [Google Scholar]
  26. Zorio, A.; García-Benau, M.A.; Sierra, L. Sustainability development and the quality of assurance reports: Empirical evidence. Bus. Strategy Environ. 2013, 22, 484–500. [Google Scholar] [CrossRef]
  27. Skouloudis, A.; Evangelinos, K.I. Sustainability reporting in Greece: Are we there yet? Environ. Qual. Manag. 2009, 19, 43–60. [Google Scholar] [CrossRef]
  28. Aras, G.; Crowther, D. Corporate sustainability reporting: A study in disingenuity? J. Bus. Ethics 2009, 87, 279–288. [Google Scholar] [CrossRef]
  29. Hahn, R.; Kühnen, M. Determinants of sustainability reporting: A review of results, trends, theory, and opportunities in an expanding field of research. J. Clean. Prod. 2013, 59, 5–21. [Google Scholar] [CrossRef]
  30. Kolb, A. Trajectories of sustainability reporting by MNCs. J. World Bus. 2010, 45, 367–374. [Google Scholar]
  31. Adams, S.; Simnett, R. Integrated reporting: An opportunity for Australia’s not-forprofit sector. Aust. Account. Rev. 2011, 21, 292–301. [Google Scholar] [CrossRef]
  32. Oncioiu, I.; Bunget, O.C.; Türkeș, M.C.; Căpuşneanu, S.; Topor, D.I.; Tamaș, A.S.; Rakoș, I.-S.; Ștefan Hint, M. The impact of big data analytics on company performance in supply chain management. Sustainability 2019, 11, 4864. [Google Scholar] [CrossRef] [Green Version]
  33. Branco, M.C.; Rodrigues, L.L. Social responsibility disclosure: A study of proxies for the public visibility of Portuguese banks. Br. Account. Rev. 2008, 40, 161–181. [Google Scholar] [CrossRef]
  34. WBCSD 2019 Addendum Report. Digital Deep Dive Analysis. Available online: https://docs.wbcsd.org/2019/10/WBCSD_Reporting_Matters_2019-Digital.pdf (accessed on 19 June 2020).
  35. Gasperini, A.; Stefano, Z. Confronto a due sulle non-financial information. Impresa Progett. 2017, 1, 1–10. [Google Scholar]
  36. Basalamah, A.S.; Johnny, J. Social and environmental reporting and auditing in Indonesia. Maintaining Organizational Legitimacy? Gadjah Mada Int. J. Bus. 2005, 7, 109–127. [Google Scholar] [CrossRef]
  37. Hohnen, P. The Future of Sustainability Reporting; EEDP Programme Paper; Chatham House: London, UK, 2012; Available online: https://www.chathamhouse.org/sites/default/files/public/Research/Energy,%20Environment%20and%20Development/0112pp_hohnen.pdf (accessed on 4 June 2020).
  38. Daizy, D.; Das, N. Sustainability reporting framework: Comparative analysis of global reporting initiatives and Dow Jones Sustainability Index. Int. J. Sci. Environ. Technol. 2014, 3, 55–66. [Google Scholar]
  39. Villiers, C.; Rinaldi, L.; Unerman, J. Integrated reporting: Insights, gaps and an agenda for future research. Account. Audit. Account. J. 2014, 27, 1042–1067. [Google Scholar] [CrossRef] [Green Version]
  40. Landau, A.; Rochell, J.; Klein, C.; Zwergel, B. Integrated reporting of environmental, social, and governance and financial data: Does the market value integrated reports? Bus. Strategy Environ. 2020, 29, 1750–1763. [Google Scholar] [CrossRef] [Green Version]
  41. Busco, C. Integrated Reporting: Concepts and Cases that Redefine Corporate Accountability; Springer International Publishing: New York, NY, USA, 2013. [Google Scholar]
  42. Cheng, M.; Green, W.; Conradie, P.; Konishi, N.; Romi, A. The international integrated reporting framework: Key issues and future research opportunities. J. Int. Financ. Manag. Account. 2014, 25, 90–119. [Google Scholar] [CrossRef] [Green Version]
  43. Abeysekera, I. A template for integrated reporting. J. Intellect. Cap. 2013, 14, 227–245. [Google Scholar] [CrossRef] [Green Version]
  44. Owen, G. Integrated reporting: A review of developments and their implications for the accounting curriculum. Account. Educ. 2013, 22, 340–356. [Google Scholar] [CrossRef]
  45. Frias-Aceituno, J.V.; Rodríguez-Ariza, L.; Garcia-Sánchez, I.M. Explanatory factors of integrated sustainability and financial reporting. Bus. Strategy Environ. 2014, 23, 56–72. [Google Scholar] [CrossRef]
  46. Jensen, J.C.; Berg, N. Determinants of traditional sustainability reporting versus integrated reporting. An institutionalist approach. Bus. Strategy Environ. 2012, 21, 299–316. [Google Scholar] [CrossRef]
  47. White, G.; Fall, B. How to report a company’s sustainability activities? Manag. Account. Q. 2005, 7, 36–43. [Google Scholar]
  48. Global Reporting Initiative (GRI). Sustainability and Reporting Trends in 2025—Preparing for the Future. Available online: http://crnavigator.com/materialy/bazadok/422.pdf (accessed on 10 June 2020).
  49. Sustainalytics. ESG Risk Ratings Methodology, Version 2.0. Available online: https://marketing.sustainalytics.com/acton/attachment/5105/f-f880b2ab-d172-4e46-971b-d3499a135b17/1/-/-/-/-/Sustainalytics_ESG%20Risk%20Rating_Methodology%20Abstract_Nov2019.pdf (accessed on 21 June 2020).
  50. Ngwakwe, C.C. Environmental responsibility and firm performance: Evidence from Nigeria. Proc. World Acad. Sci. Eng. Technol. 2008, 2, 1055–1062. [Google Scholar]
  51. Quazi, A.; Richardson, A. Sources of variation in linking corporate social responsibility and financial performance. Soc. Responsib. J. 2012, 8, 242–256. [Google Scholar] [CrossRef]
  52. Borodin, A.; Shash, N.; Panaedova, G.; Frumina, S.; Kairbekuly, A.; Mityushina, I. The impact of the publication of non-financial statements on the financial performance of companies with the identification of intersectoral features. Entrep. Sustain. Issues 2019, 7, 1666–1685. [Google Scholar] [CrossRef] [Green Version]
  53. Adams, C. Understanding Integrated Reporting: The Concise Guide to Integrated Thinking and the Future of Corporate Reporting; Routledge: Abigndon, UK, 2017. [Google Scholar]
  54. Caesaria, A.F.; Basuki, B. The study of sustainability report disclosure aspects and their impact on the companies’ performance. SHS Web Conf. 2017, 34, 08001. [Google Scholar] [CrossRef] [Green Version]
  55. Reddy, K.; Gordon, L.W. The effect of sustainability reporting on financial performance: An empirical study using listed companies. J. Asia Entrep. Sustain. 2010, 6, 19–42. [Google Scholar]
  56. Steyn, M. Organisational benefits and implementation challenges of mandatory integrated reporting. Sustain. Account. Manag. Policy J. 2014, 5, 476–503. [Google Scholar] [CrossRef]
  57. Ansari, N.; Cajias, M.; Bienert, S. The value contribution of sustainability reporting—An empirical evidence for real estate companies. ACRN Oxf. J. Financ. Risk Perspect. 2015, 4, 190–205. [Google Scholar]
  58. Loh, L.; Thomas, T.; Yu, W. Sustainability reporting and firm value: Evidence from Singapore-listed companies. Sustainability 2017, 9, 2112. [Google Scholar] [CrossRef] [Green Version]
  59. Lourenco, I.C.; Callen, J.L.; Branco, M.C.; Curto, J.D. The value relevance of reputation for sustainability leadership. J. Bus. Ethics 2014, 119, 17–28. [Google Scholar] [CrossRef]
  60. Lackmann, J.; Ernstberger, J.; Stich, M. Market reactions to increased reliability of sustainability information. J. Bus. Ethics 2012, 107, 111–128. [Google Scholar] [CrossRef]
  61. Iatridis, G. Environmental disclosure quality: Evidence on environmental performance, corporate governance and value relevance. Emerg. Mark. Rev. 2013, 15, 579–653. [Google Scholar] [CrossRef]
  62. Waddock, S.A.; Graves, S.B. Finding the link between stakeholder relations and quality of management. J. Invest. 1997, 6, 20–24. [Google Scholar] [CrossRef]
  63. Vafaei, A.; Taylor, D.; Ahmed, K. The value relevance of intellectual capital disclosures. J. Intellect. Cap. 2011, 12, 407–429. [Google Scholar] [CrossRef]
  64. Aerts, W.; Cormier, D.; Magnan, M. Corporate environmental disclosure, financial markets and the media: An international perspective. Ecol. Econ. 2008, 64, 643–659. [Google Scholar] [CrossRef]
  65. Cormier, D.; Magnan, M. The revisited contribution of environmental reporting to investors’ valuation of a firm’s earnings: An international perspective. Ecol. Econ. 2007, 62, 613–626. [Google Scholar] [CrossRef]
  66. Buallay, A. Is sustainability reporting (ESG) associated with performance? Evidence from the European banking sector. Manag. Environ. Qual. Int. J. 2018, 30, 98–115. [Google Scholar] [CrossRef]
  67. Brown, D.L.; Guidry, R.P.; Patten, D.M. Sustainability reporting and perceptions of corporate reputation: An analysis using fortune. In Sustainability, Environmental Performance and Disclosures; Emerald Group Publishing Limited: Bingley, UK, 2009; Volume 4, pp. 83–104. [Google Scholar]
  68. Albuquerque, R.; Durnev, A.; Koskinen, Y. Corporate social responsibility and asset pricing in industry equilibrium. Manag. Sci. 2012, 1–19. [Google Scholar] [CrossRef]
  69. Klassen, R.K.; McLaughlin, C.P. The impact of environmental management on firm performance. Manag. Sci. 1996, 42, 1199–1214. [Google Scholar] [CrossRef]
  70. Lorraine, N.H.; Collison, D.J.; Power, D.M. An analysis of the stock market impact of environmental performance information. Account. Forum 2004, 28, 7–26. [Google Scholar] [CrossRef]
  71. Cohen, M.A.; Fenn, S.A.; Konar, S. Environmental and Financial Performance: Are They Related? Working paper; Owen Graduate School of Management, Vanderbilt University: Nashville, TN, USA, 1997; Available online: http://citeseerx.ist.psu.edu/viewdoc/download?doi=10.1.1.498.9820&rep=rep1&type=pdf (accessed on 15 June 2020).
  72. Feldman, S.J.; Soyka, P.A.; Ameer, P. Does improving a firm’s environmental management system and environmental performance result in a higher stock price? J. Invest. 1996, 6, 87–97. [Google Scholar] [CrossRef]
  73. Murray, A.; Sinclair, D.; Power, D.; Gray, R. Do financial markets care about social and environmental disclosure? Further evidence and exploration from the UK. Account. Audit. Account. J. 2006, 19, 228–255. [Google Scholar] [CrossRef]
  74. Friedman, M. Capitalism and Freedom: With the Assistance of Rose D. Friedman; University of Chicago Press: Chicago, IL, USA, 1962. [Google Scholar]
  75. Mackey, A.; Mackey, T.B.; Barney, J.B. Corporate social responsibility and firm performance: Investor preferences and corporate strategies. Acad. Manag. Rev. 2007, 32, 817–835. [Google Scholar] [CrossRef]
  76. Zivin, J.G.; Small, A. A Modigliani-Miller theory of altruistic corporate social responsibility. BE J. Econ. Anal. Policy 2005, 5, 10. [Google Scholar]
  77. Cordeiro, J.J.; Sarkis, J. Environmental proactivism and firm performance: Evidence from security analyst earnings forecasts. Bus. Strategy Environ. 1997, 6, 104–114. [Google Scholar] [CrossRef]
  78. Preston, L.E.; O’bannon, D.P. The corporate social-financial performance relationship. Bus. Soc. 1997, 36, 419–429. [Google Scholar] [CrossRef]
  79. Shane, P.B.; Spicer, B.H. Market response to environmental information produced outside the firm. Account. Rev. 1983, 58, 521–538. [Google Scholar]
  80. Hamilton, J.T. Pollution as news: Media and stock market reactions to the toxics release inventory data. J. Environ. Econ. Manag. 1995, 28, 98–113. [Google Scholar] [CrossRef]
  81. Farneti, F.; Guthrie, J. Sustainability reporting by Australian public sector organisations: Why they report. Account. Forum. 2009, 33, 89–98. [Google Scholar] [CrossRef]
  82. Lins, C.; Althoff, R.; Meek, A. Sustainability Reporting in the Mining Sector: Value Association and Materiality; FBDS, Fundacao Brasileira: Rio de Janeiro, Brazil, 2008. [Google Scholar]
  83. Gray, R. Social, environmental and sustainability reporting and organisational value creation? Whose value? Whose creation? Account. Audit. Account. J. 2006, 19, 793–819. [Google Scholar] [CrossRef]
  84. Schreck, P. Reviewing the business case for corporate social responsibility: New evidence and analysis. J. Bus. Ethics Springer 2011, 103, 167–188. [Google Scholar] [CrossRef]
  85. Waworuntu, S.R.; Wantah, M.D.; Rusmanto, T. CSR and financial performance analysis: Evidence from top ASEAN listed companies. Procedia Soc. Behav. Sci. 2014, 164, 493–500. [Google Scholar] [CrossRef] [Green Version]
  86. Ioannou, I.; Sarafeim, G. The consequences of mandatory corporate sustainability reporting: Evidence from four countries. Harv. Bus. Sch. Res. Work. Pap. 2014, 11–100. [Google Scholar] [CrossRef] [Green Version]
  87. Wibowo, I.; Sekar, A.F. Dampak Pengungkapan SR terhadap Kinerja Keuangan dan Pasar Perusahaan. In Proceedings of the Jurnal Simposium Nasional Akuntansi XVII, Lombok, Indonesia, 24–27 September 2014. [Google Scholar]
  88. Gilley, K.M.; Worrell, D.L.; Davidson, W.N.; El–Jelly, A. Corporate environmental initiatives and anticipated firm performance: The differential effects of process-driven versus product-driven greening initiatives. J. Manag. 2000, 26, 1199–1216. [Google Scholar] [CrossRef]
  89. King, A.A.; Lenox, M.J. Does it really pay to be green? An empirical study of firm environmental and financial performance: An empirical study of firm environmental and financial performance. J. Ind. Ecol. 2001, 5, 105–116. [Google Scholar] [CrossRef] [Green Version]
  90. Watson, K.; Klingenberg, B.; Polito, T.; Geurts, T.G. Impact of environmental management system implementation on financial performance: A comparison of two corporate strategies. Manag. Environ. Qual. Int. J. 2004, 15, 622–628. [Google Scholar] [CrossRef] [Green Version]
  91. Link, S.; Naveh, E. Standardization and discretion: Does the environmental standard ISO 14001 lead to performance benefits? IEEE Trans. Eng. Manag. 2006, 53, 508–519. [Google Scholar] [CrossRef]
  92. Aragón-Correa, J.A.; Rubio-López, E.A. Proactive corporate environmental strategies: Myths and misunderstandings. Long Range Plan. 2007, 40, 357–381. [Google Scholar] [CrossRef]
  93. Pava, M.L.; Krausz, J. The association between corporate social-responsibility and financial performance: The paradox of social cost. J. Bus. Ethics 1996, 15, 321–357. [Google Scholar] [CrossRef]
  94. Murray, K.B.; Vogel, C.M. Using a hierarchy-of-effects approach to gauge the effectiveness of corporate social responsibility to generate goodwill toward the firm: Financial versus non-financial impacts. J. Bus. Res. 1997, 38, 141–159. [Google Scholar] [CrossRef]
  95. Godfrey, P.C.; Hatch, N.W. Researching corporate social responsibility: An agenda for the 21st century. J. Bus. Ethics 2007, 70, 87–98. [Google Scholar] [CrossRef]
  96. Park, K.-H.; Byun, J.; Choi, P.M.S. Managerial overconfidence, corporate social responsibility activities, and financial constraints. Sustainability 2019, 12, 61. [Google Scholar] [CrossRef] [Green Version]
  97. Sukcharoensin, S. The determinants of voluntary CSR disclosure of Thai listed firms. Int. Proc. Econ. Dev. Res. 2012, 46, 61–65. [Google Scholar]
  98. Arshad, M.G.; Anees, F.; Ullah, M.R. The impact of corporate social responsibility on firm’s financial performance. Int. J. Appl. Res. 2015, 4, 9–28. [Google Scholar]
  99. Sitepu, S.S. Pengaruh Pengungkapan Tanggung Jawab Sosial terhadap Kinerja Perusahaan, Skripsi S1; Universitas Gadjah Mada: Yogyakarta, Indonesia, 2009. [Google Scholar]
  100. Sekarsari, K. Pengaruh Environmental Disclosure terhadap Profitabilitas, Skripsi S1; Universitas Gadjah Mada: Yogyakarta, Indonesia, 2008. [Google Scholar]
  101. Soana, M.-G. The relationship between corporate social performance and corporate financial performance in the banking sector. J. Bus. Ethics 2011, 104, 133–148. [Google Scholar] [CrossRef]
  102. Hussain, N. Impact of Sustainability Performance on Financial Performance: An Empirical Study of Global Fortune (N100) Firms; Working Paper, 2015/01; Ca’ Foscari University of Venice: Venice, Italy, 2015. [Google Scholar]
  103. Tariq, H.; Albetairi, A.; Kukreja, G.; Hamdan, A. Integrated reporting and financial performance: Empirical evidences from Bahraini listed insurance companies. Account. Financ. Res. 2018, 7, 102. [Google Scholar]
  104. Horváthová, E. Does environmental performance affect financial performance? A metaanalysis. Ecol. Econ. 2010, 70, 52–59. [Google Scholar] [CrossRef]
  105. Higgins, R.C. How much growth can a firm afford? Financ. Manag. 1977, 6, 7–16. [Google Scholar] [CrossRef]
  106. Firer, C. Investment basics: XXXI. Sustainable growth models. Invest. Anal. J. 1995, 57, 24–41. [Google Scholar] [CrossRef]
  107. Ataünal, L.; Osman, A.; Aybars, G.A. Does high growth create value for shareholders? Evidence from S&P500 firms. Eur. Financ. Account. J. 2016, 2016, 25–38. [Google Scholar]
  108. Ramezani, C.; Soenen, L.; Jung, A. Growth, corporate profitability, and value creation. Financ. Anal. J. 2001, 58, 56–67. [Google Scholar] [CrossRef] [Green Version]
  109. Oprean-Stan, C.; Stan, S.; Brătian, V. Corporate sustainability and intangible resources binomial: New proposal on intangible resources recognition and evaluation. Sustainability 2020, 12, 4150. [Google Scholar] [CrossRef]
  110. Wiengarten, F.; Lo, C.; Lam, J. How does sustainability leadership affect firm performance? The choices associated with appointing a chief officer of corporate social responsibility. J. Bus. Ethics Springer 2017, 140, 477–493. [Google Scholar] [CrossRef]
  111. Kiessling, T.; Isaksson, L.; Yasar, B. Market orientation and CSR: Performance implications. J. Bus. Ethics 2015, 137, 269–284. [Google Scholar] [CrossRef]
  112. Ching, H.Y.; Gerab, F.; Toste, T.H. The quality of sustainability reports and corporate financial performance: Evidence from Brazilian listed companies. SAGE Open 2017, 7, 1–9. [Google Scholar] [CrossRef]
  113. Hussain, N.; Rigoni, U.; Cavezzali, E. Does it pay to be sustainable? Looking inside the black box of the relationship between sustainability performance and financial performance. Corp. Soc. Responsib. Environ. Manag. 2018, 25, 1198–1211. [Google Scholar] [CrossRef] [Green Version]
  114. Ray, K.K.; Mitra, S.K. Firm’s financial performance and sustainability efforts: Application of classifier models. Glob. Bus. Rev. 2018, 19, 722–736. [Google Scholar] [CrossRef]
  115. Buallay, A. Between cost and value: Investigating the effects of sustainability reporting on a firm’s performance. J. Appl. Account. Res. 2019, 20, 481–496. [Google Scholar] [CrossRef]
  116. Szegedi, K.; Khan, Y.; Lentner, C. Corporate social responsibility and financial performance: Evidence from Pakistani listed banks. Sustainability 2020, 12, 4080. [Google Scholar] [CrossRef]
  117. Kang, C.; Germann, F.; Grewal, R. Washing away your sins? Corporate social responsibility, corporate social irresponsibility, and firm performance. J. Mark. 2016, 80, 59–79. [Google Scholar] [CrossRef]
  118. Delmas, M.A.; Nairn-Birch, N.; Lim, J. Dynamics of environmental and financial performance: The case of greenhouse gas emissions. Organ. Environ. 2015, 28, 374–393. [Google Scholar] [CrossRef]
  119. Curaj, A. Capital Intelectual. Available online: https://www.slideshare.net/andreeacalin77/capital-intelectual-15384059 (accessed on 12 May 2020).
  120. Xu, J.; Wang, B. Intellectual capital, financial performance and companies’ sustainable growth: Evidence from the Korean manufacturing industry. Sustainability 2018, 10, 4651. [Google Scholar] [CrossRef] [Green Version]
  121. Chen, M.C.; Cheng, S.J.; Hwang, Y. An empirical investigation of the relationship between intellectual capital and companies’ market value and financial performance. J. Intellect. Cap. 2005, 6, 159–176. [Google Scholar] [CrossRef]
  122. Gómez-Bezares, F.; Przychodzen, W.; Przychodzen, J. Corporate sustainability and shareholder wealth—Evidence from British companies and lessons from the crisis. Sustainability 2016, 8, 276. [Google Scholar] [CrossRef] [Green Version]
  123. Fischer, T.M.; Sawczyn, A.A. The relationship between corporate social performance and corporate financial performance and the role of innovation: Evidence from German listed firms. J. Manag. Control 2013, 24, 27–52. [Google Scholar] [CrossRef]
  124. Herbohn, K.; Walker, J.; Loo, H.Y.M. Corporate social responsibility: The link between sustainability disclosure and sustainability performance. Abacus 2014, 50, 422–459. [Google Scholar] [CrossRef]
  125. Xu, X.L.; Yang, X.N.; Zhan, L.; Liu, C.K.; Zhou, N.D.; Hu, M.M. Examining the relationship between intellectual capital and performance of listed environmental protection companies. Environ. Prog. Sustain. Energy 2017, 36, 1056–1066. [Google Scholar] [CrossRef]
  126. Nimtrakoon, S. The relationship between intellectual capital, firms’ market value and financial performance: Empirical evidence from the ASEAN. J. Intellect. Cap. 2015, 16, 587–618. [Google Scholar] [CrossRef]
  127. Barnett, M.L.; Salomon, R.M. Does it pay to be really good: Addressing the shape of the relationship between social and financial performance. Strateg. Manag. J. 2012, 33, 1304–1320. [Google Scholar] [CrossRef]
  128. Hair, J.F.; Black, W.C.; Babin, B.J.; Anderson, R.E. Multivariate Data Analysis, 7th ed.; Pearson: Harlow, UK, 2014. [Google Scholar]
  129. Cohen, J.; Cohen, P.; West, S.G.; Aiken, L.S. Applied Multiple Regression/Correlation Analysis for the Behavioral Sciences, 3rd ed.; Lawrence Erlbaum Associates: Mahwah, NJ, USA, 2003. [Google Scholar]
  130. Draper, N.R.; Smith, H. Applied Regression Analysis, 3rd ed.; Wiley: New York, NY, USA, 1998. [Google Scholar]
  131. Laerd Statistics. Multiple Regression Using SPSS Statistics. Statistical Tutorials and Software Guides. 2015. Available online: https://statistics.laerd.com/ (accessed on 3 June 2020).
  132. American Psychological Association. Publication Manual of the American Psychological Association, 7th ed.; American Psychological Association: Washington, DC, USA, 2020. [Google Scholar]
  133. King, A.; Lenox, M. Exploring the locus of profitable pollution reduction. Manag. Sci. 2002, 48, 289–299. [Google Scholar] [CrossRef] [Green Version]
Figure 1. ESG Risk Ratings, a two-dimensional framework between exposure and management. Source: Sustainalytics ESG risk rating methodology [49].
Sustainability 12 08536 g001
Figure 2. Significant controversy level categories (Sustainalytics, Inc) Source: Sustainalytics ESG risk rating methodology [49].
Sustainability 12 08536 g002
Table 1. Source of information and method of measurement for variables in the study. GRI: Global Reporting Initiative; ESG: Environmental, social, and governance. CEI: Controversial event involvement.
Proposed VariablesSource of Information and Method of Measurement
Sustainability reportingGRI Sustainability Disclosure Database.
Recorded as 1 if at least one sustainability report was published during the analyzed period.
Recorded as 0 if no sustainability report was published during the analyzed period.
ESG risk rating
(total rating and component ratings of the environmental, social, and governance factors)
Yahoo Finance, using the Sustainalytics methodology (https://www.sustainalytics.com/esg-ratings).
There are five risk categories (negligible, low, medium, high, and severe). The rating scale is from 0 to 100, with 100 being the most severe rating.
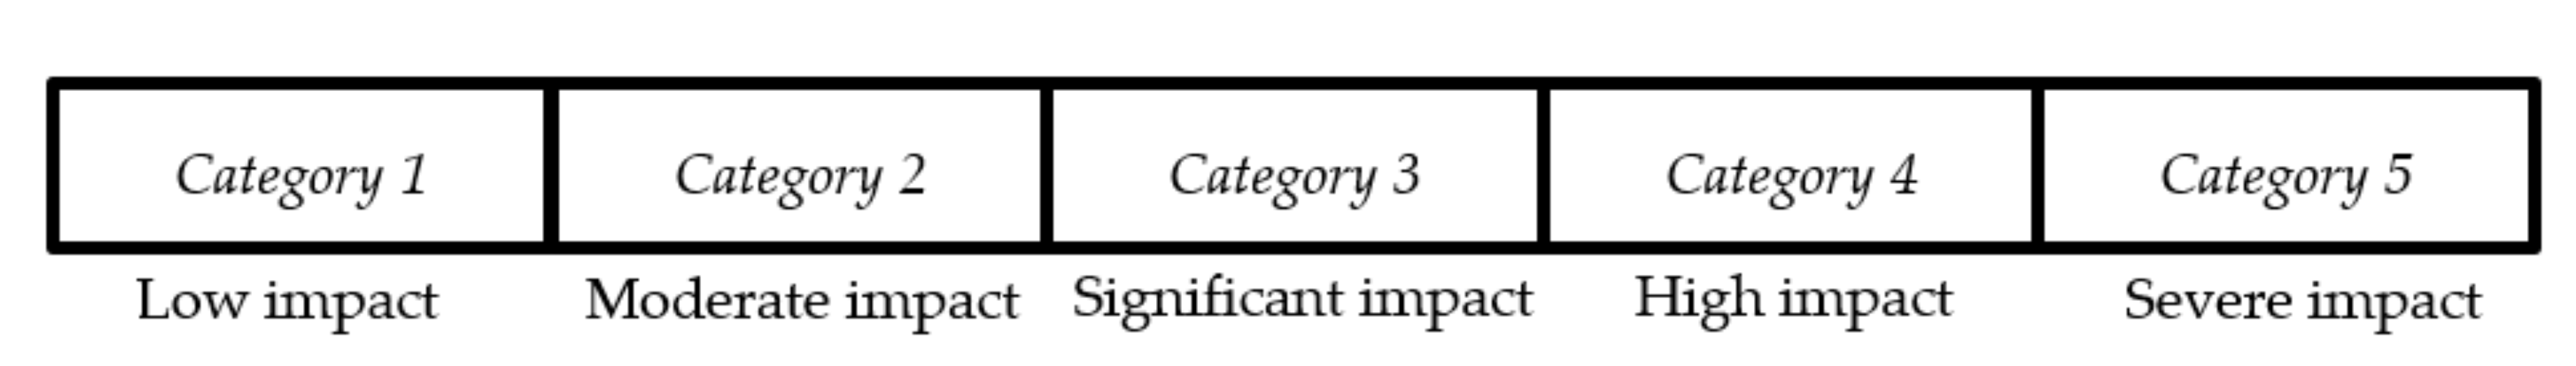
Controversial event involvementYahoo Finance, using the Sustainalytics methodology (https://www.sustainalytics.com/esg-ratings).
Each score for CEI was categorized from category 1 (low impact on the environment and society, posing negligible risks to the company) to category 5 (severe impact on the environment and society, posing serious risks to the company): Category 1 (low impact); category 2 (moderate impact); category 3 (significant impact); category 4 (high impact); and category 5 (severe impact).
Financial and market informationAnnual financial statements collected from the Yahoo Finance Datastream.
Table 2. Model summary.
ModelRR SquareAdjusted R SquareStd. Error of the EstimateDurbin–Watson
10.750 a0.5620.5010.02183144212161.415
20.473 b0.2240.146169.83853195215682.278
30.678 c0.4600.3680.04615315546462.236
Source: Author’s own analysis. Generated by SPSS. a. Predictors: (Constant), ESG_Risk, ESG_Social, debt ratio, GRI, firm size, ESG_Environment, dependent variable: Return on Assets; b. Predictors: (Constant), ESG_Risk, GRI, return on Equity, firm size, dependent variable: Tobin_Q; c. Predictors: (Constant), return on assets, ESG_Environment, GRI, sales growth, ESG_Risk, controversial events involvement, ESG_Social, dependent variable: Sustainable Growth.
Table 3. Pearson correlations results for the main study variables (model 1).
Model 1Return on AssetsGRIESG_RiskESG
Environment
ESG
Social
Firm SizeDebt Ratio
Return on Assets1
GRI0.0711
ESG_Risk−0.304 *0.1851
ESG_Environment−0.0440.113−0.1191
ESG_Social−0.0470.045−0.0410.789 **1
Firm Size−0.595 **0.0690.357 *0.0540.0821
Debt Ratio−0.697 **−0.1380.1200.106−0.0590.724 **1
* Statistically significant at a p < 0.05 level. ** Statistically significant at a p < 0.01 level.
Table 4. Pearson correlation results for the main study variables (model 2). ROE: Return on equity.
Model 2Tobin_QGRIESG RiskFirm SizeROE
Tobin_Q1
GRI−0.349 *1
ESG_Risk−0.0820.1851
Firm Size−0.1010.0690.357 *1
ROE−0.0750.067−0.278−0.380 **1
Source: Author’s own analysis. Generated by SPSS. * Statistically significant at a p < 0.05 level. ** Statistically significant at a p < 0.01 level.
Table 5. Pearson correlations for main study variables (model 3). SGR: Sustainable growth rate. ROA: Return on assets.
Model 3SGRGRIESG_RiskESG
Environment
ESG
Social
CEISales GrowthROA
SGR1
GRI0.2581
ESG_Risk−0.0400.1851
ESG_Environment0.1630.113−0.1191
ESG_Social0.0560.045−0.0410.789 **1
CEI−0.1300.0360.282 *−0.063−0.1241
Sales Growth−0.0760.0990.2650.0900.1110.444 **1
ROA0.1760.071−0.304 *−0.044−0.047−0.308 *−0.2551
Source: author’s own analysis. Generated by SPSS. * Statistically significant at a p < 0.05 level. ** Statistically significant at a p < 0.01 level.
Table 6. Multiple regression results for ROA.
ROAB95% CI for BSE BβR2ΔR2
LLUL
Model 0.560.50 ***
Constant0.108−0.010.220.06
GRI−0.003−0.020.010.01−0.04
ESG_Environment0.0010.000.000.000.21
ESG_Social−0.001−0.000.000.00−0.25
ESG Risk−0.001 *−0.000.000.00−0.23 *
Firm Size0.006−0.010.020.010.10
Debt Ratio−0.143 ***−0.20−0.090.03−0.83 ***
Source: Author’s own analysis. Generated by SPSS. Note. Model = “enter” method in SPSS Statistics; B = unstandardized regression coefficient; CI = confidence interval; LL = lower limit; UL = upper limit; SE B = standard error of the coefficient; β = standardized coefficient; R2 = coefficient of determination; ΔR2 = adjusted R2. * p < 0.05; *** p < 0.001.
Table 7. Multiple regression results for Tobin’s Q.
Tobin’s QB95% CI for BSE BβR2ΔR2
LLUL
Model 0.220.15 *
Constant1135.557 *89.102182.01517.77
GRI−214.632 **−356.04−73.2369.97−0.45 **
ESG_Risk3.329−5.6112.274.420.13
Firm Size−108.706−238.4020.9864.17−0.33
ROE−795.787−1704.65113.08449.69−0.30
Source: Author’s own analysis. Generated by SPSS. Note. Model = “enter” method in SPSS Statistics; B = unstandardized regression coefficient; CI = confidence interval; LL = lower limit; UL = upper limit; SE B = standard error of the coefficient; β = standardized coefficient; R2 = coefficient of determination; ΔR2 = adjusted R2. * p < 0.05; ** p < 0.01.
Table 8. Multiple regression results for Sustainable Growth Rate.
SGRB95% CI for BSE BβR2ΔR2
LLUL
Model 0.460.37 ***
Constant0.085 *0.0170.1520.033
GRI−0.018−0.0530.0180.018−0.118
ESG Risk−0.001−0.0020.0010.001−0.097
ESG_Environment0.004 **0.0020.0070.0010.686 **
ESG_Social−0.003 **−0.005−0.0010.001−0.522 **
CEI−0.018−0.0360.0010.009−0.258
Sales Growth3.062E−100.0000.0000.0000.233
ROA0.7610.285 **1.2370.2360.409 **
Source: Author’s own analysis. Generated by SPSS. Note. Model = “enter” method in SPSS Statistics; B = unstandardized regression coefficient; CI = confidence interval; LL = lower limit; UL = upper limit; SE B = standard error of the coefficient; β = standardized coefficient; R2 = coefficient of determination; ΔR2 = adjusted R2. * p < 0.05; ** p < 0.01; *** p < 0.001.
Publisher’s Note: MDPI stays neutral with regard to jurisdictional claims in published maps and institutional affiliations.

