Article

Spatio-Temporal Variations of CO2 Emission from Energy Consumption in the Yangtze River Delta Region of China and Its Relationship with Nighttime Land Surface Temperature

1
School of Tourism and Geographic Science, Yunnan Normal University, Kunming 650500, China
2
The Engineering Research Centre of GIS Technology in Western China, Ministry of Education of China, Yunnan Normal University, Kunming 650500, China
*
Authors to whom correspondence should be addressed.
Sustainability 2020, 12(20), 8388; https://doi.org/10.3390/su12208388
Submission received: 27 August 2020 / Revised: 6 October 2020 / Accepted: 7 October 2020 / Published: 12 October 2020
(This article belongs to the Special Issue Sustainable Cities: Challenges and Potential Solutions)

Abstract

:
The rapid development of industrialization and urbanization has resulted in a large amount of carbon dioxide (CO2) emissions, which are closely related to the long-term stability of urban surface temperature and the sustainable development of cities in the future. However, there is still a lack of research on the temporal and spatial changes of CO2 emissions in long-term series and their relationship with land surface temperature. In this study, Defense Meteorological Satellite Program’s Operational Linescan System (DMSP/OLS) data, Suomi National Polar-orbiting Partnership (NPP) Visible Infrared Imaging Radiometer Suite (VIIRS) composite data, energy consumption statistics data and nighttime land surface temperature are selected to realize the spatial informatization of long-term series CO2 emissions in the Yangtze River Delta region, which reveals the spatial and temporal dynamic characteristics of CO2 emissions, spatial autocorrelation distribution patterns and their impacts on nighttime land surface temperature. According to the results, CO2 emissions in the Yangtze River Delta region show an obvious upward trend from 2000 to 2017, with an average annual growth rate of 6.26%, but the growth rate is gradually slowing down. In terms of spatial distribution, the CO2 emissions in that region have significant regional differences. Shanghai, Suzhou and their neighboring cities are the main distribution areas with high CO2 emissions and obvious patch distribution patterns. From the perspective of spatial trend, the areas whose CO2 emissions are of significant growth, relatively significant growth and extremely significant growth account for 8.78%, 4.84% and 0.58%, respectively, with a spatial pattern of increase in the east and no big change in the west. From the perspective of spatial autocorrelation, the global spatial autocorrelation index of CO2 emissions in the Yangtze River Delta region in the past 18 years has been greater than 0.66 (p < 0.01), which displays significant positive spatial autocorrelation characteristics, and the spatial agglomeration degree of CO2 emissions continues to increase from 2000 to 2010. From 2000 to 2017, the nighttime land surface temperature in that region showed a warming trend, and the areas where CO2 emissions are positively correlated with nighttime land surface temperature account for 88.98%. The increased CO2 emissions lead to, to a large extent, the rise of nighttime land surface temperature. The research results have important theoretical and practical significance for the Yangtze River Delta region to formulate a regional emission reduction strategy.

1. Introduction

As the largest developing country in the 21st century, China has experienced the progressive transformation from planned economy to market economy and achieved a surprising economic growth over the past 30 years [1]. Since the reform and opening-up in 1978, the gross domestic product has been increasing with an average speed of 9.8% per year and ranked the third of the world in 2009 [2]. Driven by the fast economic development and the increase of primary energy consumption, the emission increase of CO2 in in eastern coastal areas has been accelerated significantly [3]. According to the statistics, the growth rate of CO2 emission in China per year has reached 10% since 2000. The overall CO2 emission in 2008 reached 8.325 billion tons for which China became the country with the largest emission in the world [4]. In one aspect, the huge emission of carbon and the higher acceleration impose a huge pressure on China for emission reduction [5]. A scientific and reasonable analysis on the variation of time and space for CO2 emission has become the fundamental precondition for the strategy of emission reduction. On the other aspect, the continuous increase of CO2 emission has generated a significant warming effect for the land surface temperature which not only impacts the residents’ health, production activities and atmospheric environment of cities, but also makes the soil infertile, impacts the water cycling system and even causes the irreversible destruction to the biological diversity [6,7]. The disclosure of the influence from CO2 emission on land surface temperature has become one of the key challenges for sustainable development.
The nighttime light data are of long duration and wide coverage etc. which are ideal for the exploration of city information [8]. Many scholars have successfully applied the DMSP/OLS data into such fields as population estimation [9], urban boundary extraction [10], power consumption estimation [11] etc. Since human activities are the major source of CO2 emission and DMSL/OLS data happens to effectively reflect the strength of human activities [12], many scholars at home and abroad have proved that the application of DMSP/OLS data into the estimation of CO2 emission is feasible. For example, Wang et al. [13] applied spatiotemporal modeling based on DMSP/OLS data to evaluate the CO2 emission on the municipal level in China from 1992 to 2013 and put forward a series of feasible policies for emission reduction. Shi et al. [14] compared and analyzed the temporal and spatial variation and contributory factors for CO2 emissions on the provincial and municipal level from 1997 to 2012 based on DMSP/OLS data. Cheng et al. [15] studied the spatio-temporal dynamics of CO2 strength in energy consumption on the provincial level from 1997 to 2010 and its dominant factors based on the method provided by the International Panel on Climate Change (IPCC). These research studies mainly discuss and explore CO2 emission on the provincial or municipal level, most of which were conducted before 2013. With the launch of a new generation of NPP/VIIRS nighttime light data, the research on the spatio-temporal dynamics of serialized CO2 emissions over a longer duration has become possible. Based on the DMSPOLS and NPP/VIIRS data, this research explores the spatio-temporal characteristics of serialized CO2 emissions on the municipal level with a longer duration, in order to determine the objective of emission reduction for the local governments and provide scientific basis for the preparation of a regional strategy for emission reduction. Besides, the current research on the influence of CO2 emissions on land surface temperature has always been an interesting topic. Research indicates that the concentration enrichment of CO2 emission means more absorption of heat which causes the variation of land surface temperature [16]. For example, Vostok ice-core data suggest that the land surface temperature and CO2 emissions have a close relationship in the past 160 thousand years [17]. Jones et al. [18] discovered that fossil fuel and bio-fuel black carbon has significantly contributed to the climate warming in the last 50 years of the 20th century through the inspection and analysis based on the observation data of global near-surface temperature in the last century. Through selecting the global time series data in 161 years and applying the linear method and non-linear method to inspect the casual relationship between CO2 emissions and air temperature, Bai et al. [19] proved that CO2 emissions are the contributor for the climate warming. Das et al.’s [20] research suggests that the fossil fuel consumption may cause the CO2 level to rise to one and half times by the year 2020 in comparison to that of the 2008 level, thus causing an increase in the surface temperature by 0.0008 percent per annum. The above stated research studies have obtained comparatively ideal research achievements. However, the current research on the influence of CO2 emissions on land surface temperature is still comparatively insufficient and does not consider that factors such as solar radiation difference in daylight and human activities will influence the result of the correlation analysis on CO2 emissions and land surface temperature. Therefore, this research selects the nighttime land surface temperature as the data source since the data of nighttime land surface temperature have higher precision compared to the data of land surface temperature in daylight, and they are more typical.
The Yangtze River Delta is the region with the highest population density and level of urbanization in China [21]. This region’s rapid economic growth inevitably resulted in a high concentration of energy consumption, which greatly increased CO2 emissions. To cope with the huge pressure of emission reduction and enhance the sustainable development of cities, the scientific and precise analysis on the temporal and spatial variation of CO2 emissions in the Yangtze River Delta and its relationship with the nighttime land surface temperature may determine the objective of emission reduction for the local governments and provide the theoretical basis and data support for the improvement of the urban ecological environment. The present study combined Geographic Information System (GIS) technology and remotely sensed data to construct a carbon emissions simulation model for the Yangtze River Delta region. The model was based on the theory of sustainable urban development and on DMSP/OLS data, NPP/VIIRS data, statistics on energy consumption and some basic geographic information data. The temporal and spatial origin, and the distribution pattern of CO2 emissions were determined using trend and spatial autocorrelation analyses. Pearson’s correlation coefficient was used to analyze the relationship between CO2 emissions and night surface temperature.

2. Datasets

2.1. Study Area

Located in the lower reaches of the Yangtze River, the Yangtze River Delta is one of the largest urban agglomerations in China and has also been the region with the fastest economic development since China’s reform and opening up [22]. The range which the study selects contains Shanghai, Zhejiang (Hangzhou, Ningbo, Wenzhou, Shaoxing, Huzhou, Jiaxing, Jinhua, Quzhou, Zhoushan, Taizhou, Lishui), Jiangsu (Nanjing, Wuxi, Xuzhou, Changzhou, Suzhou, Nantong, Lianyungang, Huai’an, Yancheng, Yangzhou, Zhenjiang, Taizhou, Suqian), Anhui (Hefei, Bengbu, Wuhu, Huainan) Ma’anshan City, Huaibei City, Tongling City, Anqing City, Huangshan City, Fuyang City, Suzhou City, Chuzhou City, Lu’an City, Xuancheng City, Chizhou City, Bozhou City), as shown in Figure 1. This area belongs to subtropical humid monsoon climate, with elevation below 1749 m, and most of the areas are plain, located at Shanghai, Jiangsu, Northern Anhui and Northern Zhejiang. The Yangtze River Delta, as an important intersection of the “Belt and Road” and the Yangtze River Economic Belt, is gradually developing into an influential world-class metropolis, and playing an important role in China’s social development [23].

2.2. Data Sources and Processing

Data sources include DMSP/OLS Data, NPP/VIIRS Data, energy consumption statistics, nighttime land surface temperature data and other relevant data.
DMSP/OLS nighttime light data. These data come from the stable noctilucent remote sensing image which is provided by National Oceanic and Atmospheric Administration (NOAA) and whose spatial resolution is 0.008333 degrees and whose range of digital number (DN) value is 0~63. The larger the DN value, the higher the light intensity. Three satellites, namely, F15 (2000–2007), F16 (2004–2009) and F18 (2010–2013), were used for data acquisition. Because the DMSP satellite is influenced by measurement error, attenuation of detection ability, atmosphere and so on, relative radiometric correction must be conducted when studying and using DMSP/OLS Data [24]. By referring to the correction of nighttime light data by Elvidge et al. [25] and Wu et al. [26], this study uses ArcGIS 10.2 as the data processing platform and conducts the following four steps to correct DMSP/OLS data: (a) create China regional nighttime light database (the spatial resolution of the data after resampling is 1 km × 1 km) through projection change, resampling, clipping and other processing; (b) to correct the DN value with multi-sensor data in the same year to form the unique nighttime light data each year; (c) to correct the continuity of time series to ensure the latter DN value of the annual pixel is greater than that of the previous year; and (d) create the nighttime light database of the Yangtze River Delta through the clipping of nighttime light data based on the administrative division map of the Yangtze River Delta.
NPP/VIIRS nighttime light data. The data are from the National Geophysical Data Center of the United States. The selected years are 2012–2017. The spatial resolution of the original data was 0.004167 degrees, and it was converted to 1 km × 1 km by resampling. Different from DMSP/OLS data, NPP /VIIRS data do not remove the influence of Aurora, firelight and other background noise [27,28]. These accidental factors will affect the accuracy of CO2 Emission Simulation and must be removed. Considering that the NPP/VIIRS data are missing in some areas from May to July, and in order to make full use of the information of each image, the data from January to April and August to October each year are corrected, and then the annual NPP/VIIRS composite data are obtained according to the monthly NPP/VIIRS composite data [29]. Then, in order to overcome the influence of different satellite sensors, the “two-step” proposed by Zhao et al. [30] is used to correct the continuity of DMSP/OLS and NPP/VIIRS data. Finally, we get the nighttime light data of 2000–2017 time series, and Figure 2 shows the time change of total DN values of nighttime light data in the Yangtze River Delta from 2000 to 2017. In Figure 2, TDN represents the total DN value of nighttime light data in the entire Yangtze River Delta.
Statistical data of energy consumption in the Yangtze River Delta. The energy consumption data used to calculate CO2 emissions are from the reference energy terminal consumption in the energy consumption balance table of Zhejiang, Anhui, Jiangsu and Shanghai in China Energy Statistical Yearbook. China Energy Statistical Yearbook is from China National Knowledge Infrastructure. Due to the lack of some energy consumption statistics from 2000 to 2002, the selected time range of energy statistics is 2003–2017.
Nighttime land surface temperature (NLST) data. From the data of MOD11A2 provided by National Aeronautics and Space Administration (NASA), the time resolution is 8 days and the spatial resolution is 1 km × 1 km. First, the Modis Reprojection Tool (MRT) software was used to project and format the MOD11A2 data [31]. The MRT software was provided by NASA. Second, to eliminate the influence of outliers, the maximum value composition (MVC) [32] was used to synthesize the 8-day data into annual data. Finally, the data were spliced and trimmed to obtain the annual nighttime land surface temperature data of the Yangtze River Delta urban agglomeration for 2000 to 2017.
Relevant auxiliary data. It mainly includes China’s national boundaries, provincial and municipal administrative divisions in the Yangtze River Delta, and the data is from the national geographic information resources directory service system.

3. Methods

3.1. Spatialization of CO2 Emissions

(1) CO2 emission calculation. According to the statistical data of energy consumption in the Yangtze River Delta region and the 2006 greenhouse gas emission inventory released by the Intergovernmental Panel on climate change of the United Nations, the CO2 emission generated by energy consumption is calculated as follows:
S C E P R O = 44 12 × j = 1 10 K j E j
In this formula, S C E P R O represents the CO2 emission of a province (city), the subscript j represents the energy type, E j represents the consumption of energy j (unit: 10,000 tons of standard coal), and K j represents the CO2 emission coefficient of energy j (unit: 10,000 tons of carbon/10,000 tons of standard coal). See reference [5] for the CO2 emission coefficient of each energy.
(2) The CO2 emission simulation model was established. Based on lighting data and CO2 emission data, Meng et al. [33] concluded that there is a linear correlation between carbon emissions and night lighting data. By analyzing the total amount of lighting and carbon emissions from energy consumption in the Henan Province of China, Gu et al [34] also concluded that there is a linear correlation between the two factors. Therefore, using the correlation between the total CO2 emissions and the total DN value of nighttime light in each municipal administrative region in China, five commonly used correlation models (linear model, exponential model, logarithmic model, power function model, quadratic polynomial model) are selected to explore the correlation between CO2 emissions and the total DN value of nighttime lighting. The results show that the fitting degrees of the linear model, exponential model, logarithmic model, power function model and quadratic polynomial model are 0.775, 0.794, 0.570, 0.615 and 0.778, respectively. Among them, the exponential model has the best fitting degree. However, further research shows that the average relative error of Shanghai from 2000 to 2017 is 23.90%, which is obviously underestimated, which may be due to the saturation of lighting. It is difficult to eliminate the problem completely in data correction, and there are still some errors in the city with high light intensity. In order to further improve the accuracy and reliability of CO2 emission simulation value of each province (city), the relationship models between carbon emission and the DN value sum of Zhejiang, Jiangsu, Anhui and Shanghai are established, respectively. The results show that the fitting effect of the partition model is better than that of the overall model, which can make up for the underestimation of carbon emission in Shanghai. The R2 of Zhejiang, Jiangsu, Anhui and Shanghai were 0.953, 0.988, 0.976 and 0.870, respectively, which passed the significance test of 0.01. At the same time, considering the accuracy of downscaling model inversion, a linear fitting model without intercept is adopted:
Eit = ki × DNit
In the formula, the independent variable DNit represents the total DN value of nighttime lighting of i province (city) in t year, the dependent variable Eit represents the statistical value of CO2 emission of i province (city) in t year, and ki is the corresponding coefficient of i province (city) (Table 1).

3.2. Trend Analysis

Regression analysis can be used to calculate the temporal variation characteristics of a single pixel, and then reflect the spatial variation law of the whole region [34]. Based on the CO2 emission data set from 2000 to 2017, the linear regression analysis of CO2 emission was carried out with pixel as the basic unit. See reference [35] for the specific calculation formula.
In addition, in order to better reflect the spatial variation characteristics of CO2 emissions in the Yangtze River Delta region, slope is divided into five grades by the standard deviation classification method: basically unchanged, weakly significant growth, significant growth, relatively significant growth and extremely significant growth.

3.3. Spatial Automocorrelation Analysis

Spatial autocorrelation is used to describe the potential interdependence and aggregation characteristics of variable attribute values in the same region. Spatial autocorrelation analysis includes global spatial autocorrelation and local spatial autocorrelation [36]. This paper selects the global Moran’s I index, which is widely used to reflect the concentration degree of CO2 emissions in the Yangtze River Delta region. Local spatial autocorrelation is used to determine the specific location of spatial agglomeration [37,38].

4. Results

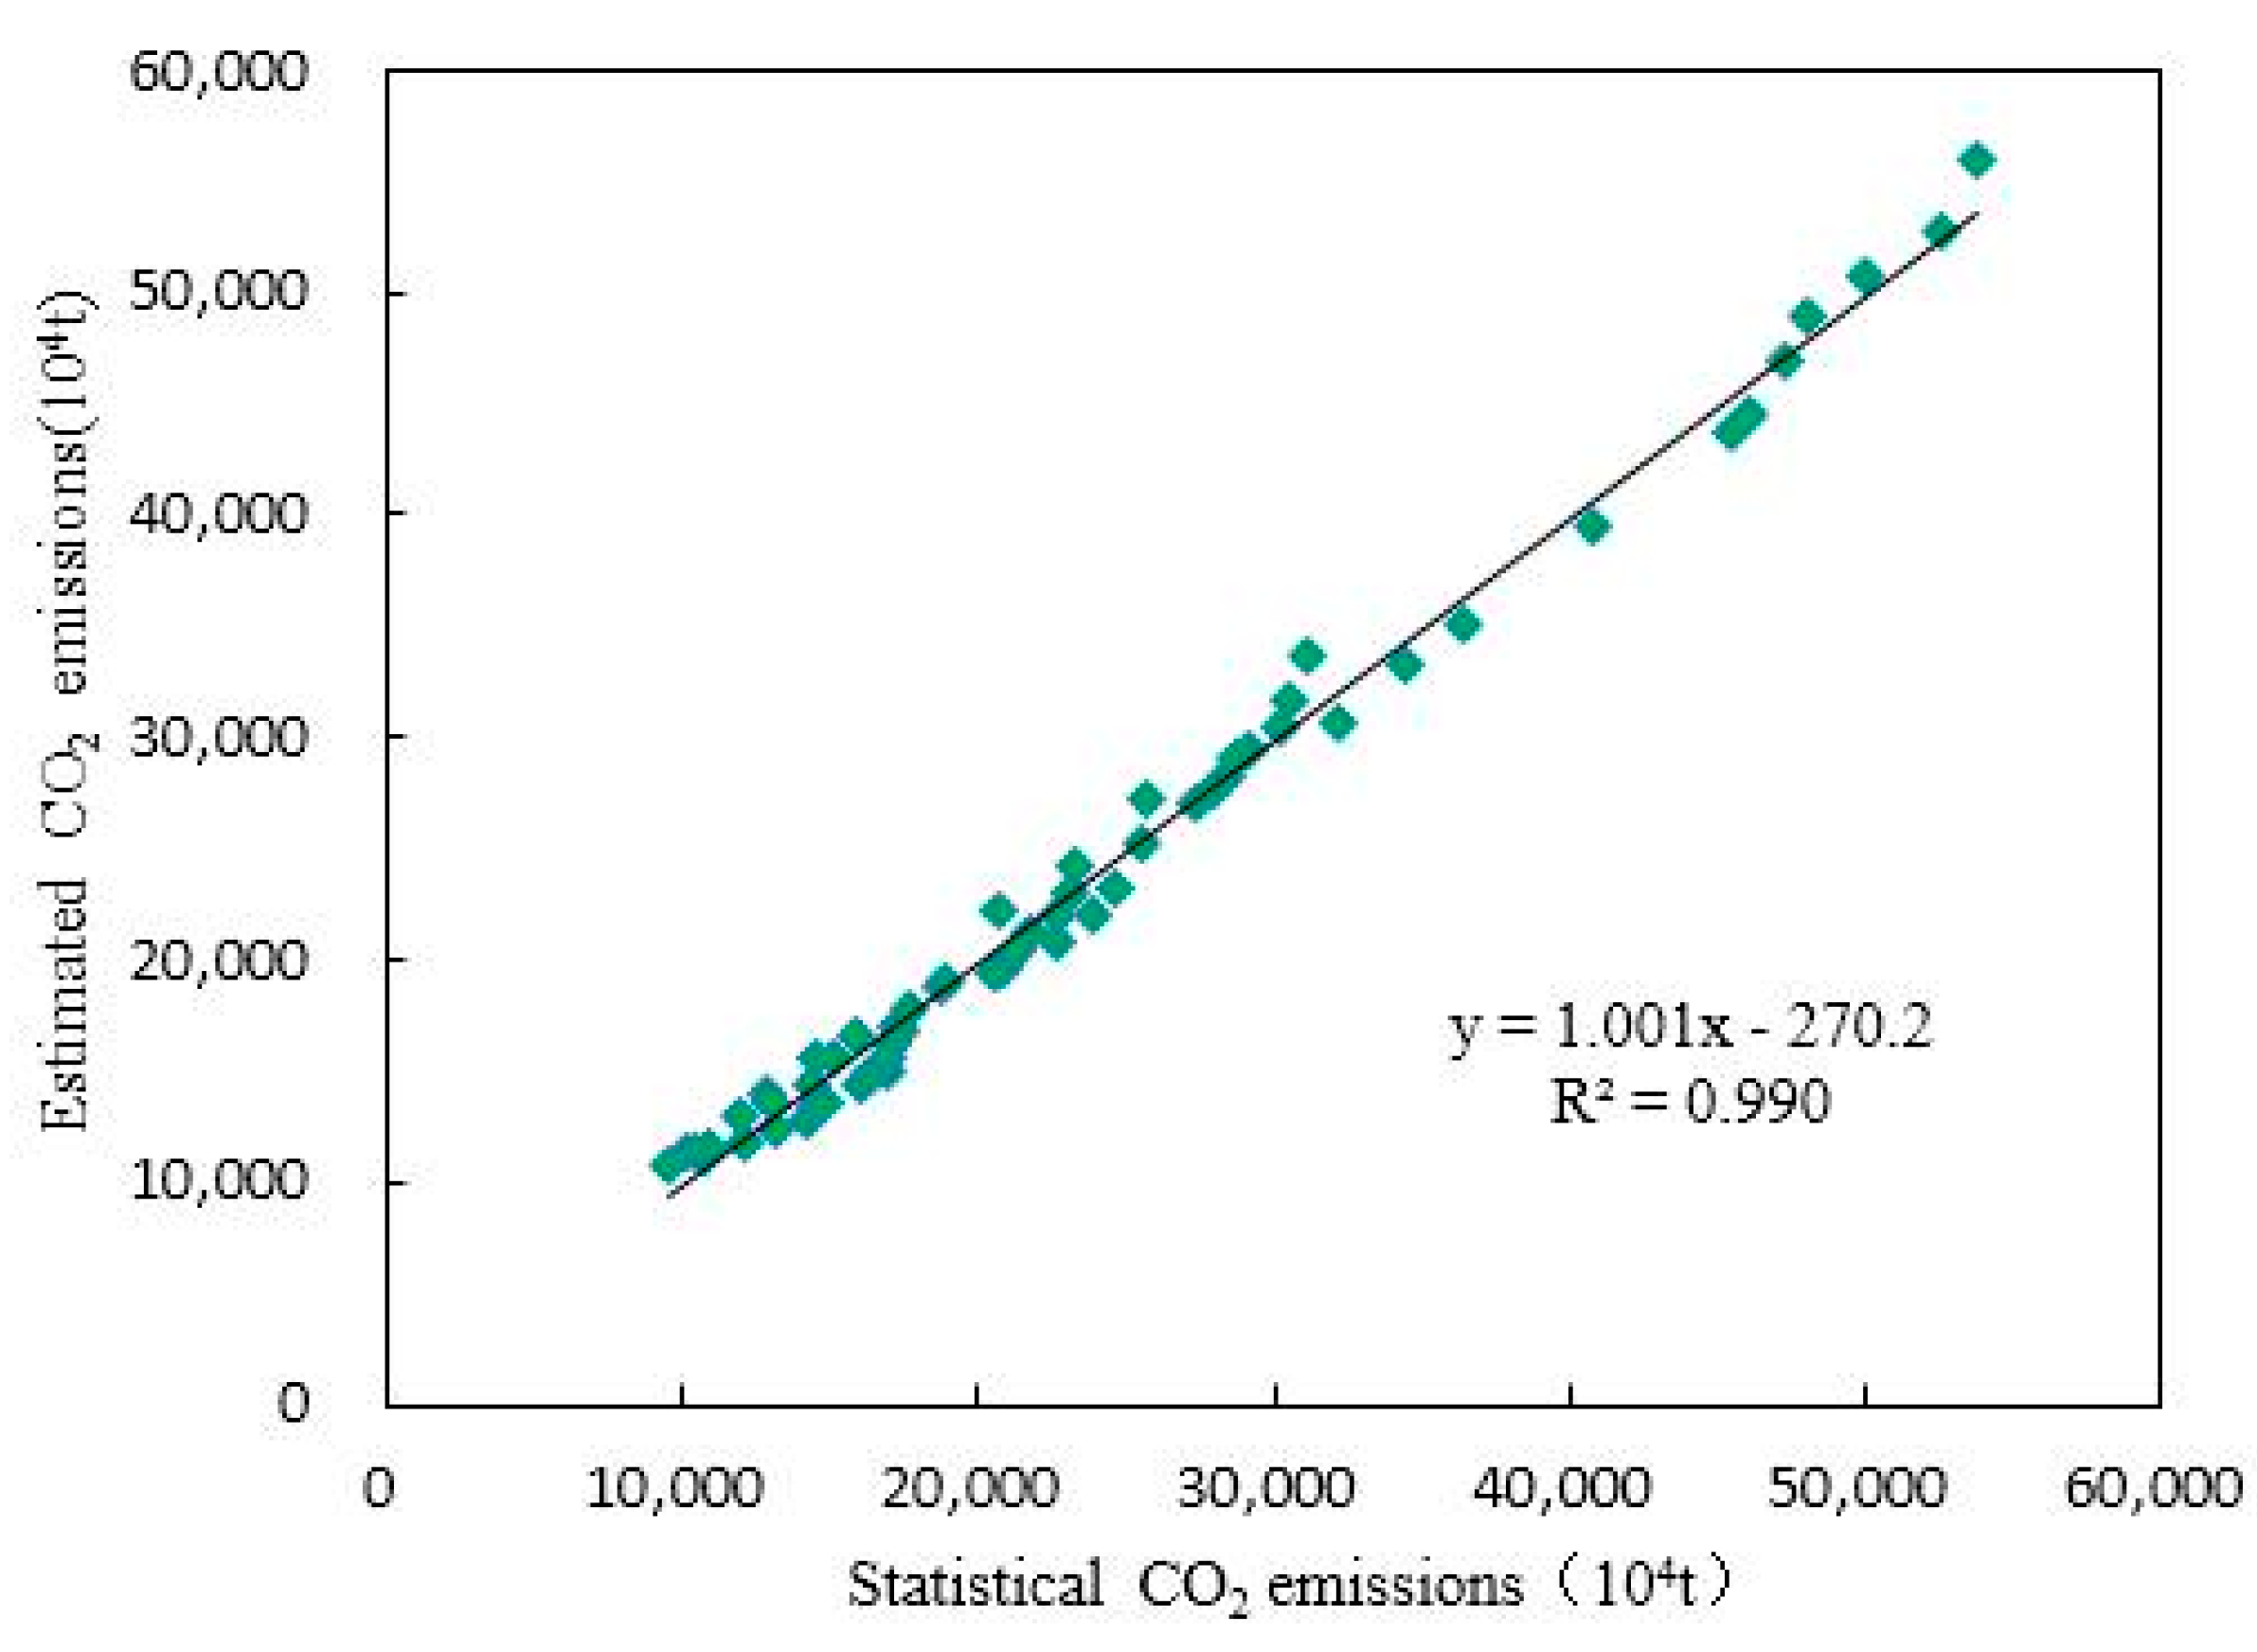
4.1. Accuracy Evaluation of Simulated CO2 Emissions

In order to evaluate the accuracy and reliability of the simulated CO2 emission value, this study adopted the following two methods for accuracy testing: one is to perform regression analysis on the statistical data and simulated data of CO2 emissions and make a determination based on the correlation coefficient R2 (Figure 3); the second is to calculate the relative error between the CO2 emission statistics and simulation data in different regions in different years (Table 2). It can be seen from Figure 3 that the CO2 emission statistics data and the simulated data show an obvious linear correlation, and the correlation is high (R2 = 0.990), which passed the significance test of 0.01. It can be seen from Table 2 that the relative errors between the statistical values and the simulated values of CO2 emissions in the Yangtze River Delta from 2003 to 2017 are all within 10%. The annual average relative errors of Zhejiang, Jiangsu, Anhui and Shanghai are −0.21%, 0.25%, 1.81% and −5.17%. It can be seen that the accuracy of the CO2 emission simulation based on nighttime light data is better, and this accuracy can meet the requirements of CO2 emission change research.

4.2. Temporal Characteristics

From 2000 to 2017, the Yangtze River Delta region’s CO2 emissions experienced a significant increase (Figure 4), with an average annual growth rate of 6.26%. From 2000 to 2005, from 2005 to 2010 and from 2010 to 2017, the average annual growth rates of CO2 emissions in the Yangtze River Delta were 9.42%, 6.79%, and 4.59%, indicating that the CO2 emissions in the Yangtze River Delta are increasing, but the growing speed is gradually slowing down, which is mainly due to the impact of economic and social development goals and the continuous improvement of the energy consumption system. For example, during the “Eleventh Five-Year Plan” period, the Chinese government made optimizing the industrial structure and improving the efficiency of resource utilization its main goals for economic and social development. During the “Twelfth Five-Year Plan” period, the Chinese government set the goals of reducing energy consumption per unit of gross domestic product (GDP) by 16% and CO2 emissions per unit of GDP by 17% [14]. The implementation of these policies has played a positive role in mitigating the growth of CO2 emissions. From the perspective of the spatial agglomeration degree, the global Moran’s I in the Yangtze River Delta from 2000 to 2017 was between 0.663 and 0.731, both reaching a significant level of 0.01 (Figure 4). It shows that CO2 emissions in the Yangtze River Delta are positively correlated with each other, and CO2 emissions have significant spatial agglomeration characteristics. From 2000 to 2010, Moran’s I showed a clear upward trend, with a growth rate of 0.6%•a−1, indicating that the spatial accumulation of CO2 emissions continued to increase, the accumulation of CO2 emissions increased, and the spatial heterogeneity among regions is weakened. From 2011 to 2017, the Moran’s I index of CO2 emissions stabilized at 0.7301–0.7309, and the spatial distribution pattern of emissions in the Yangtze River Delta was basically unchanged. The main reason was that the CO2 emissions in the Yangtze River Delta experienced an obvious upward process from 2000 to 2010, especially in Shanghai, Suzhou, Wuxi, Changzhou. The spatial distribution characteristics of CO2 emissions tend to be from broken distribution to sheet distribution, and the connectivity between CO2 emission patches tends to be saturated.

4.3. Spatial Distribution Characteristics

Based on the nighttime light data of DMSP/OLS and NPP/VIIRS, the spatial distribution of CO2 emissions on the pixel scale in the Yangtze River Delta is simulated. Figure 5 shows the spatial distribution of CO2 emissions in the Yangtze River Delta from 2000 to 2017, and it uses equal intervals to divide it into 8 levels, 0–0.1, 0.1–0.2, 0.2–0.3, 0.3–0.4, 0.4–0.5, 0.5–0.6, 0.6–0.7, 0.7–max (unit: 104 t/km2). The area occupied by 0–0.1 dropped from 73.26% in 2000 to 23.94% in 2017, while the areas occupied by 0.1–0.2, 0.2–0.3, 0.3–0.4, 0.4–0.5, 0.5–0.6, 0.6–0.7, 0.7–max are on the rise. The proportion of area occupied by 0.7–max rose from 3.08% in 2000 to 15.48% in 2017. From the perspective of spatial distribution, there are obvious regional differences in CO2 emissions in the Yangtze River Delta. Shanghai, Suzhou and its neighboring cities are the main distribution areas with high CO2 emissions. They are distributed in obvious patches. These regions have a high level of urbanization development, highly dense population, and carried out a large number of economic activities. The low-value areas of CO2 emissions are mainly distributed in Lishui and Quzhou of Zhejiang Province, and Lu’an, Anqing, Chizhou of Anhui Province. These cities have relatively low energy consumption and low CO2 emissions.
Figure 6 shows the spatial agglomeration of CO2 emissions in the Yangtze River Delta from 2000 to 2017. The High-High (HH) aggregation zone indicates that the CO2 emissions of a certain space unit and its surrounding space units are very high, and the Low-Low (LL) aggregation zone indicates that the CO2 emissions of a space unit and its surrounding space units are very low. The High-Low (HL) aggregation zone indicates that the high value is surrounded by the low value, and the Low-High (LH) aggregation zone means that the low value is surrounded by the high value. It can be seen from Figure 6 that the spatial agglomeration characteristics of CO2 emissions in different regions are significantly different. The HH aggregation zone is mainly distributed in Shanghai, southern Jiangsu and northern Zhejiang. The area occupied has increased from 26,949 km2 in 2000 to 50,382 km2 in 2017. The connectivity of these areas is significantly enhanced, and there is a certain link between the CO2 emissions of these regions, and they affect each other. From 2000 to 2010, the degree of spatial agglomeration of CO2 emissions changed significantly. The average annual growth rate of the area occupied by the HH aggregation zone was 5.46%. From 2011 to 2017, the HH aggregation zone showed a clear patchy distribution, and the degree of inter-annual spatial agglomeration was not changed obviously, the average annual growth rate of the occupied area is 0.97%. The HL aggregation zone and the LH aggregation zone occupy a small area and are mainly distributed in areas with large differences in CO2 emissions. The HL aggregation zones are scattered, most of which are located in cities with relatively low economic development in Anhui and Zhejiang, while the LH aggregation zone is attached to the periphery of HH aggregation zone in a band, and its area proportion fluctuates from 2.45% to 3.27%. The LL aggregation zone occupies the largest area. The main distribution areas of the LL aggregation zone have basically remained unchanged in the past 18 years, mainly in Anhui Province and the western and southern parts of Zhejiang Province. These regions have relatively low CO2 emissions and the mutual influences between regions are smaller [39,40].

4.4. Spatial Trend Characteristics

The spatial change trend of carbon emissions in the Yangtze River Delta region from 2000 to 2017 is studied based on the unary linear regression model (Figure 7). The research results show that (a) during 18 years from 2000 to 2017, the overall CO2 emissions of that region showed an upward trend, and the basically unchanged area accounted for the largest proportion of area, accounting for 70.14% (Table 3), and it is mainly distributed in Anhui Province and the western and southern regions of Zhejiang Province, and these regions have relatively low CO2 emissions, and the inter-annual changes are not obvious. (b) The areas whose CO2 emissions were of relatively significant growth accounted for 4.84%, which mainly include Shanghai, Suzhou, southern Nantong, northern Wuxi, northern Zhenjiang, southern Yangzhou and central Nanjing. The areas whose CO2 emissions were of extremely significant growth accounted for the smallest part, namely, 0.58% or 1989km2, which mainly include Shanghai. (c) The study found that in some large, medium and small urban centers (such as Shanghai, Hefei, Wuxi, etc.), the type of CO2 emission growth is weak and significant. The possible reason is that the population density tends to be saturated in the urban center, which leads to the decrease of the CO2 emission growth rate. The regions with significant growth, relatively significant growth and extremely significant growth are distributed in a circle. This is closely related to the spatial expansion of the city. With the continuous outward expansion of the city, the CO2 emission in the peripheral area of the city center increases rapidly.

5. Relationship between CO2 Emissions and Nighttime Land Surface Temperature

5.1. Comparative Analysis of Temporal and Spatial Changes

There is a statistic on the annual mean nighttime land surface temperature in 2000–2017 to make a figure of nighttime land surface temperature an anomaly in the Yangtze River Delta (Figure 8). The result shows that the nighttime land surface temperature increase is 0.57 °C/10a in the area, which is more than the rising rate of average surface temperature in China in the past 60 years (0.23 °C/10a) [40], so it means that the nighttime land surface temperature in Yangtze River Delta is warming. Compared with the emission change of CO2, both of them are increasing; but they are different. The CO2 emission is rising up with straight line while the nighttime land surface temperature is in upward trend of fluctuation. There is correlation analysis on the carbon emission and nighttime land surface temperature in Yangtze River Delta in 2000–2017, and the result shows that there is positive correlation between the two parties with the correlation coefficient of 0.413 and p value of 0.088.
To compare and analyze the spatial distribution characteristics of CO2 emissions and nighttime land surface temperature, the average value of the CO2 emission and nighttime land surface temperature in 2000–2017 with a grid computing tool ArcGIS 10.2 is used (Figure 9). Through the comparison and analysis of the spatial distribution law of CO2 emissions and nighttime land surface temperature, it could be seen that there is high consistency between CO2 emissions and nighttime land surface temperature in the spatial distribution. Especially, Shanghai, Suzhou, Wuxi, Nanjing and Zhenjiang are the most significant since they are the main distribution area with high CO2 emission, and are flaky in distribution. Accordingly, the nighttime land surface temperature is also in flaky distribution. In Fuyang, Bozhou, Huaibei, Suzhou of Anhui Province, the CO2 emission is scattered, and the nighttime land surface temperature is also in the same feature. What is more, most of the areas with low values of CO2 emission and nighttime land surface temperature are Chizhou, Xuancheng, Huangshan of Anhui Province and Lishui and Wenzhou of Zhejiang Province.
Figure 10a is divided into four grades (Table 4) with standard deviation classification: area of low emission (0–0.05), area of medium emission (0.05–0.41), area of higher emission (0.41–0.77) and area of high emission (0.77–2.91). The area proportions are 20.97%, 63.68%, 7.66% and 7.69%, respectively. Here is the result of the study. The nighttime land surface temperature is the lowest, 25.84 °C, in the area with low CO2 emission; the temperature soars to 27.32 °C with a year-on-year increase of 5.73% in the area with medium CO2 emission; the temperature is 28.09 °C in the area with higher CO2 emission, so there is a year-on-year increase of 8.71% compared with the area with low CO2 emission. The temperature is 28.80 °C in the area with high CO2 emission, so there is a year-on-year increase of 11.5% compared with the area with low CO2 emission. It could be seen that the nighttime land surface temperature would rise up along with the increase of the CO2 emission, so there is a certain correlation relationship between CO2 emission and nighttime land surface temperature.

5.2. Scale Analysis within the Year

To show the correlation degree between CO2 emission and nighttime land surface temperature based on the spatial distribution map of CO2 emission and nighttime land surface temperature in 2000–2017, a grid is built with the data management tool of ArcGIS 10.2, statistics on total CO2 emissions per grid (SCE) are made and the maximum (NLSTmax), minimum (NLSTmin) and average (NLSTmean) nighttime land surface temperature are acquired, and finally, the correlation coefficient of the CO2 emission and the maximum, minimum and average of and the nighttime land surface temperature are calculated through Pearson correlation analysis method (Table 5). The study result shows that there is a significant positive correlation relationship between the CO2 emission and the maximum, minimum and average of and the nighttime land surface temperature, and all of them have passed the significance test of 0.05. However, the correlation degrees of CO2 emission and nighttime land surface temperature in different years are various. In 2015, there is the most significant correlation between the CO2 emission and the maximum, minimum and average of the nighttime land surface temperature with the correlation coefficients of 0.444, 0.506 and 0.590. In other years, the correlation in 2019 is lower and the correlation coefficients are 0.085, 0.244 and 0.282.

5.3. Interannual Scale Analysis

To disclose the correlation relationship between CO2 emission and nighttime land surface temperature in a partial area, it is selected with the CO2 emission and nighttime land surface temperature in 2000–2017 in the Yangtze River Delta as analysis indexes for the analysis on the correlation relationship (n = 18). Figure 10a is the spatial distribution of the correlation coefficient between CO2 emission and nighttime land surface temperature at the pixel scale, and the correlation coefficient is between −0.67 and 0.99. There is a significance test for the coefficient and then it would be divided into an extremely significant positive correlation (coefficient ranging from 0.5897 to 0.9946, p < 0.01), very significant positive correlation (coefficient ranging from 0.4683 to 0.589, p < 0.05), relatively significant positive correlation (coefficient ranging from 0.4000 to 0.44683, p < 0.1), weak significant positive correlation (coefficient ranging from 0 to 0.40000, p > 0.1), weak significant negative correlation (coefficient ranging from −0.40000 to 0, p > 0.1), relatively significant negative correlation (coefficient ranging from −0.4683 to −0.4000, p < 0.1), very significant negative correlation (coefficient ranging from −0.5897 to −0.4683, p < 0.05) and extremely significant negative correlation (coefficient ranging from −0.6727 to −0.5897, p < 0.01). All of these are represented with ESPC, VSPC, RSPC, WSPC, WSNC, RSNC, VSNC and ESNC and shown in Figure 10b. The result shows that there is regional difference of CO2 emission on nighttime land surface temperature. The correlation relationship between CO2 emission and nighttime land surface temperature is mainly the positive one, and the area of positive correlation is 88.98%. The area of very significant positive correlation and extremely significant positive correlation is 42,030 km2, accounting for 12.08%, and they are mainly in Northern Lianyungang, central Yangzhou, Western Jiaxing, Eastern Huzhou, eastern Hangzhou, northern Shaoxing, central Ningbo, Eastern Taizhou and Eastern Wenzhou. Meanwhile, there is less of an area of negative correlation and they are mainly in Northwest Anhui Province, Jinhua, Quzhou and Lishui in Zhejiang Province. The area of extremely significant negative correlation and the very significant negative correlation only takes up 0.02%. The increase in CO2 emission should not be ignored as a factor in the increase in the nighttime land surface temperature in the Yangtze River Delta. However, CO2 emissions are not the only factor responsible for this increase. There are complex factors affecting the temperature, including climate change, the distribution of the population and vegetation coverage which all have an impact. The present study only explored the relationship between CO2 emission and nighttime land surface temperature (Table 6). Consequently, a further study involving a comprehensive analysis of the impacts of all factors on the nighttime land surface temperature is required.

6. Conclusions

This paper calculates the CO2 emissions in the Yangtze River Delta region based on energy consumption statistics, and then combines night lighting data to realize the spatial informatization of CO2 emissions in a long time series, which can solve the defect of insufficient energy consumption statistics at the municipal level. In terms of data acquisition, energy consumption statistics come from the National Bureau of Statistics, DMSP/OLS data come from the National Oceanic and Atmospheric Administration of the United States, and NPP/VIIRS data come from the National Geophysical Data Center of the United States. All the above data can be obtained free of charge. In the aspect of data processing, the data processing is carried out according to the existing correction method of night light data, which is simple and feasible. In terms of CO2 emission simulation, it is feasible to use the linear simulation model without intercept to retrieve the spatial information of CO2 emissions in the Yangtze River Delta region in this study, and the simulation accuracy is relatively high (the relative error is within 10%), which is a reliable new type of CO2 emission spatialization method. However, in the process of realizing the spatialization of CO2 emissions in the Yangtze River Delta region, there are still some problems: the relative error of CO2 emissions in Shanghai from 2005 to 2016 is negative, and CO2 emissions are obviously underestimated, which is due to the difficulty of completely eliminating the saturation problem of DMSP/OLS data during correction. Secondly, in the process of processing NPP/VIIRS data, due to some missing data from May to July, annual NPP/VIIRS data can only be synthesized based on monthly NPP/VIIRS data from January to April and August to December. To sum up, although there is a certain deviation in the simulation results of CO2 emissions, the simulation accuracy of CO2 emissions in the Yangtze River Delta region from 2003 to 2017 is controlled within 10%, which can meet the requirements of CO2 emission change research.
Under the background of rapid urbanization, CO2 emissions in the Yangtze River Delta region showed an obvious upward trend from 2000 to 2017, but the growth rate of CO2 emissions in the Yangtze River Delta region is gradually slowing down. In terms of spatial distribution, affected by the level of urbanization development, the CO2 emissions in the Yangtze River Delta region are obviously different from those in the east and west. The high-value areas of CO2 emissions are mainly distributed in the eastern coastal regions, with Shanghai being the most obvious. From the perspective of spatial agglomeration degree, CO2 emissions in the Yangtze River Delta region showed significant positive spatial autocorrelation from 2000 to 2017, and the main distribution areas of HH and LL agglomeration areas of CO2 emissions remained basically unchanged. The spatial distribution pattern of CO2 emissions in the Yangtze River Delta region showed a certain path-dependent effect.
In the past 18 years, the nighttime land surface temperature in the Yangtze River Delta region has shown a warming trend, and the spatial distribution of nighttime land surface temperature and CO2 emissions has a high consistency. There is a significant positive correlation between CO2 emissions and the maximum, minimum and average nighttime land surface temperature in each year, reaching a significant level of 0.05. On the interannual scale, the correlation degree between CO2 emissions and nighttime land surface temperature is different in different regions, but the relationship between CO2 emissions and nighttime land surface temperature is mainly positive, with the area with positive correlation reaching more than 85%, so there is certain correlation relationship between CO2 emissions and nighttime land surface temperature.

Author Contributions

K.Y. and S.Z. designed and performed this research; J.Z. performed the experiments and drafted the manuscript; Y.Z. and Y.M. edited the manuscript. All authors have read and agreed to the published version of the manuscript.

Funding

Funding: This research was funded by the National Natural Science Foundation of China (41461038), Yunnan Provincial Science and Technology Project (2011XX2005) and Specialized Research Fund for the Doctoral Program of Higher Education (20115303110002).

Acknowledgments

The authors would like to thank the anonymous reviewers and editor for constructive comments and suggestions.

Conflicts of Interest

The authors declare no conflict of interest.

Data Availability

The data that support the findings of this study are available from the corresponding author upon reasonable request.

References

  1. Li, Y.; Wei, Y.H. The spatial-temporal hierarchy of regional inequality of China. Appl. Geogr. 2010, 30, 303–316. [Google Scholar] [CrossRef]
  2. You, J. China’s energy consumption and sustainable development: Comparative evidence from GDP and genuine savings. Renew. Sustain. Energy Rev. 2011, 15, 2984–2989. [Google Scholar] [CrossRef]
  3. Zhang, L.; Huang, Y.; Li, Y.; Cheng, X. An Investigation on Spatial Changing Pattern of CO2 Emission in China. Resour. Sci. 2010, 32, 211–217. [Google Scholar]
  4. Cheng, L.; Jian, W.; Jia, Y.; Ming, L. Research on Regional Carbon Emissions in China. Acta Geosci. Sin. 2010, 31, 727–732. [Google Scholar]
  5. Su, Y.; Chen, X.; Li, Y. China’s 19-year city-level carbon emissions of energy consumptions, driving forces and regionalized mitigation guidelines. Renew. Sustain. Energy Rev. 2014, 35, 231–243. [Google Scholar] [CrossRef]
  6. Fan, M.; Yue, T.; Chen, C.; Sun, X. Spatial Change Trends of Temperature and Precipitation in China. J. Geo Inf. Sci. 2011, 13, 526–533. [Google Scholar] [CrossRef]
  7. Hafner, J. Urban heat island modeling in conjunction with satellite-derived surface/soil parameters. J. Appl. Meteorol. 1999, 38, 448–465. [Google Scholar] [CrossRef] [Green Version]
  8. Wang, Z.; Yang, S.; Wang, S. Monitoring evolving urban cluster systems using DMSP/OLS nighttime light data: A case study of the Yangtze River Delta region, China. J. Appl. Remote Sens. 2017, 11, 046029. [Google Scholar] [CrossRef]
  9. Chen, L.; Xun, L.; Yao, Y.; Cheng, D. Effects of population agglomeration on urban economic growth in China. Acta Geogr. Sin. 2018, 73, 1107–1120. [Google Scholar]
  10. Liu, X.; Ning, X.; Wang, H.; Wang, C.; Zhang, H.; Meng, J. A Rapid and Automated Urban Boundary Extraction Method Based on Nighttime Light Data in China. Remote Sens. 2019, 11, 1126. [Google Scholar] [CrossRef] [Green Version]
  11. Shi, K.; Yang, Q.; Fang, G.; Yu, B.; Chen, Z.; Yang, C.; Wu, J. Evaluating spatiotemporal patterns of urban electricity consumption within different spatial boundaries: A case study of Chongqing, China. Energy 2019, 167, 641–653. [Google Scholar] [CrossRef]
  12. Su, Y.; Chen, X.; Ye, Y.; Wu, Q.; Kuang, Y. The characteristics and mechanisms of carbon emissions from energy consumption in China using DMSP/OLS night light imageries. Acta Geogr. Sin. 2013, 68, 1513–1526. [Google Scholar]
  13. Wang, S.; Liu, X. China’s city-level energy-related CO2 emissions: Spatiotemporal patterns and driving forces. Appl. Energy 2017, 200, 204–214. [Google Scholar] [CrossRef]
  14. Shi, K.; Yu, B.; Zhou, Y.; Chen, Y.; Yang, C.; Chen, Z.; Wu, J. Spatiotemporal variations of CO2 emissions and their impact factors in China: A comparative analysis between the provincial and prefectural levels. Appl. Energy 2019, 233, 170–181. [Google Scholar] [CrossRef]
  15. Cheng, Y.; Wang, Z.; Ye, X.; Wei, Y.H. Spatiotemporal dynamics of carbon intensity from energy consumption in China. J. Geogr. Sci. 2014, 24, 631–650. [Google Scholar] [CrossRef] [Green Version]
  16. Jarvis, A.; Leedal, D.; Taylor, C.; Young, P. Stabilizing global mean surface temperature: A feedback control perspective. Environ. Model. Softw. 2009, 24, 665–674. [Google Scholar] [CrossRef]
  17. Ayeni, B.J.; Pilat, R. Crude Oil Reserve Estimation: An Application of the Autoregressive Integrated Moving Average Model. J. Pet. Sci. Eng. 1992, 8, 13–28. [Google Scholar] [CrossRef]
  18. Jones, G.; Christidis, N.; Stott, P. Detecting the influence of fossil fuel and bio-fuel black carbon aerosols on near surface temperature changes. Atmos. Chem. Phys. 2010, 10, 799–816. [Google Scholar] [CrossRef]
  19. Bai, W.; Yang, G.; Zhang, X. Research on multiple statistical causal about carbon emission increases with temperature rise. J. Guizhou Coll. Financ. Econ. 2013, 5, 46–51. [Google Scholar]
  20. Das, D.; Srinivasan, R.; Sharfuddin, A. Fossil fuel consumaption, carbon emissions and temperature variation in India. Energy Environ. 2011, 22, 695–709. [Google Scholar] [CrossRef]
  21. Lu, H.; Zhang, M.; Sun, W.; Li, W. Expansion Analysis of Yangtze River Delta Urban Agglomeration Using DMSP/OLS Nighttime Light Imagery for 1993 to 2012. ISPRS Int. J. Geo Inf. 2018, 7, 52. [Google Scholar] [CrossRef] [Green Version]
  22. Du, Y.; Xie, Z.; Zeng, Y.; Shi, Y.; Wu, J. Impact of urban expansion on regional temperature change in the Yangtze River Delta. J. Geogr. Sci. 2007, 4, 387–398. [Google Scholar] [CrossRef]
  23. Gu, C.; Hu, L.; Zhang, X.; Wang, X. Climate change and urbanization in the Yangtze River Delta. Habitat Int. 2011, 35, 544–552. [Google Scholar] [CrossRef]
  24. Wang, T.; Zhang, G.; Li, P.; Li, F. Analysis on the driving factors of urban expansion policy based on DMSP/OLS remote Sensing image. Acta Geod. Cartogr. Sin. 2018, 47, 42–49. [Google Scholar]
  25. Elvidge, C.D.; Ziskin, D.; Baugh, K.E.; Tuttle, B.; Ghosh, T.; Pack, D.; Erwin, E.; Zhizhin, M. A Fifteen Year Record of Global Natural Gas Flaring Derived from Satellite Data. Energies 2009, 2, 595–622. [Google Scholar] [CrossRef]
  26. Wu, J.; He, S.; Peng, J.; Li, W.; Zhong, X. Intercalibration of DMSP-OLS night-time light data by the invariant region method. Int. J. Remote Sens. 2013, 34, 7356–7368. [Google Scholar] [CrossRef]
  27. Elvidge, C.D.; Baugh, K.; Zhizhin, M.; Hsu, F. Why VIIRS data are superior to DMSP for mapping nighttime lights. Proc. Asia Pac. Adv. Netw. 2013, 35, 62–69. [Google Scholar] [CrossRef] [Green Version]
  28. Schroeder, W.; Oliva, P.; Giglio, L.; Csiszar, I.A. The new VIIRS 375 m active fire detection data product: Algorithm description and initial assessment. Remote Sens. Environ. 2014, 143, 85–96. [Google Scholar] [CrossRef]
  29. Shi, F.; Yu, B.; Huang, Y.; Hu, Y.; Yin, B.; Chen, Z.; Chen, L.; Wu, J. Evaluating the ability of NPP-VIIRS nighttime light data to estimate the gross domestic product and the electric power consumption of China at multiple scales: A comparison with DMSP-OLS data. Remote Sens. 2014, 6, 1705–1724. [Google Scholar] [CrossRef] [Green Version]
  30. Zhao, J.; Ji, G.; Yue, Y.; Lai, Z.; Chen, Y.; Yang, D.; Yang, X.; Wang, Z. Spatio-temporal dynamics of urban residential CO2 emissions and their driving forces in China using the integrated two nighttime light datasets. Appl. Energy 2019, 235, 612–624. [Google Scholar] [CrossRef]
  31. Stow, D.; Petersen, A.; Hope, A.; Engstrom, R. Greenness trends of Arctic tundra Vegetation in the 1990s: Comparison of two NDVI datasets from NOAA AVHRR systems. Int. J. Remote Sens. 2007, 28, 4807–4822. [Google Scholar] [CrossRef]
  32. Holben, N. Characteristics of maximum-value composite images from temporal AVHRR data. Int. J. Remote Sens. 1986, 7, 1417–1434. [Google Scholar] [CrossRef]
  33. Meng, X.; Han, J.; Huang, C. An Improved Vegetation Adjusted Nighttime Light Urban Index and Its Application in Quantifying Spatiotemporal Dynamics of Carbon Emissions in China. Remote Sens. 2017, 9, 829. [Google Scholar] [CrossRef] [Green Version]
  34. Gu, Y.; Feng, X.; Fan, L.; Guan, Z.; Feng, D.; Gao, Y. Spatial analysis of carbon emissions from region energy consumption based on night light data. Sci. Surv. Mapp. 2017, 42, 140–146. [Google Scholar]
  35. Yang, Q.; Wang, T.; Chen, H.; Wang, Y. Characteristics of vegetation cover change in Xilin Gol League based on MODIS EVI data. Trans. Chin. Soc. Agric. Eng. 2015, 31, 191–198. [Google Scholar]
  36. Zhu, W.; Jia, S.; Lu, A.; Yan, T. Analyzing and modeling the coverage of vegetation in the Qaidam Basin of China: The role of spatial autocorrelation. J. Geogr. Sci. 2012, 22, 346–358. [Google Scholar] [CrossRef]
  37. Yan, D.; Lei, Y.; Shi, Y.; Zhu, Q.; Li, L.; Zhang, Z. Evolution of the spatiotemporal pattern of PM2.5 concentrations in China–A case study from the Beijing-Tianjin-Hebei region. Atmos. Environ. 2018, 183, 225–233. [Google Scholar] [CrossRef] [Green Version]
  38. Anselin, L. Local indicators of spatial association—LISA. Geogr. Anal. 1995, 27, 93–115. [Google Scholar] [CrossRef]
  39. Li, F.; Zhou, C.H. Spatial autocorrelation analysis on regional economic disparity of northeast economic region in China. Chin. J. Popul. Resour. Environ. 2009, 7, 27–31. [Google Scholar]
  40. Zhao, J.; Zhu, Y.; Duan, G.; Yang, K. Spatial and temporal dynamics of vegetation in Xishuangbanna from 2001 to 2015 based on MOD13Q1 data. Chin. J. Ecol. 2019, 38, 1083–1092. [Google Scholar]
Figure 1. The location of research area.
Sustainability 12 08388 g001
Figure 2. Total digital number (TDN) values in the Yangtze River Delta region from 2000 to 2017.
Sustainability 12 08388 g002
Figure 3. Scatter diagram between CO2 emissions calculated from statistical data and CO2 emissions simulated from nighttime light data.
Sustainability 12 08388 g003
Figure 4. Temporal variation of CO2 emissions and global Moran’s I during 2000–2017.
Sustainability 12 08388 g004
Figure 5. Spatial distribution of CO2 emissions during 2000–2017.
Sustainability 12 08388 g005
Figure 6. Local spatial autocorrelation analysis map of CO2 emissions from 2000 to 2017.
Sustainability 12 08388 g006
Figure 7. Spatial trend characteristics of CO2 emissions during 2000–2017.
Sustainability 12 08388 g007
Figure 8. Temporal variation of nighttime surface temperature during 2000–2017.
Sustainability 12 08388 g008
Figure 9. Spatial distribution pattern of CO2 emissions (a) and nighttime land surface temperature (b) in the Yangtze River Delta from 2000 to 2017.
Sustainability 12 08388 g009
Figure 10. Correlation coefficient (a) and significance level (b) of CO2 emissions and nighttime land surface temperature from 2000 to 2017. Note: ESPC: extremely significant positive correlation; VSPC: very significant positive correlation; RSPC: relatively significant positive correlation; WSPC: weak significant positive correlation; WSNC: weak significant negative correlation; RSNC: relatively significant negative correlation; VSNC: very significant negative correlation; ESNC: extremely significant negative correlation.
Sustainability 12 08388 g010
Table 1. Coefficient of linear model of CO2 emission.
Province (City)ZhejiangJiangsuAnhuiShanghai
Coefficient (k)0.01890.02150.01620.0475
Coefficient of determination (R2)0.95330.98780.97750.8704
Table 2. Relative error between CO2 emissions calculated from statistical data and CO2 emissions simulated from nighttime light data (%).
YearZhejiangJiangsuAnhuiShanghaiYangtze River Delta
20038.224.583.4313.227.36
20046.477.7510.915.187.58
2005−0.125.9510.03−2.593.32
2006−5.311.048.16−5.57−0.42
2007−8.89−4.753.79−9.81−4.92
2008−7.78−3.52−0.74−8.36−5.10
2009−5.78−3.793.83−8.81−3.64
2010−1.11−3.31−1.29−10.99−4.18
2011−1.02−3.860.32−10.20−3.69
2012−1.25−3.31−5.20−10.14−4.98
2013−0.65−0.56−4.51−12.16−4.47
20140.961.63−2.52−8.49−2.11
20151.071.48−2.40−5.64−1.37
20163.860.38−1.10−4.01−0.22
20178.184.014.440.794.36
Table 3. Area and proportion of different growth types.
Change TypesArea (km2)Area Ratio (%)Cumulative Percentage (%)
Basically unchanged240,51970.1470.14
weakly significant growth53,70015.6685.80
Significant growth30,1088.7894.58
Relatively significant growth16,5974.8499.43
Extremely significant growth19890.58100
Table 4. Different CO2 Emission Grades and Their Correspondent Nighttime Land Surface Temperature in Yangtze River Delta.
CO2 Emission GradeArea with Low EmissionArea with Medium EmissionArea with Higher EmissionArea with High Emission
Nighttime Land Surface Temperature (°C)25.8427.3228.0928.80
Area (km2)71,909218,36726,26726,370
Percentage (%)20.9763.687.667.69
Table 5. Correlation coefficients of CO2 emissions and the maximum, minimum and average nighttime land surface temperature.
YearSCE and NLSTmaxSCE and NLSTminSCE and NLSTmeanYearSCE and NLSTmaxSCE and NLSTminSCE and NLSTmean
20000.376 **0.284 **0.404 **20090.085 *0.244 **0.282 **
20010.327 **0.284 **0.389 **20100.275 **0.312 **0.410 **
20020.148 **0.200 **0.236 **20110.438 **0.416 **0.526 **
20030.232 **0.305 **0.416 **20120.266 **0.266 **0.334 **
20040.160 **0.262 **0.339 **20130.387 **0.431 **0.574 **
20050.436 **0.255 **0.374 **20140.362 **0.277 **0.395 **
20060.303 **0.252 **0.335 **20150.444 **0.506 **0.590 **
20070.369 **0.341 **0.410 **20160.268 **0.337 **0.394 **
20080.407 **0.454 **0.577 **20170.372 **0.407 **0.480 **
Note: * means p < 0.05; ** means p < 0.01.
Table 6. Correlation between CO2 emissions and nighttime land surface temperature.
Correlationp ValueArea (km2)Percentage (%)Cumulative Percentage (%)
ESPCp < 0.0111,2483.28 3.28
VSPCp < 0.0530,1768.80 12.08
RSPCp < 0.1031,0349.05 21.13
WSPCp > 0.10232,69367.8588.98
WSNCp > 0.1037,54210.9599.93
RSNCp < 0.101370.04 99.97
VSNCp < 0.05690.02 99.99
ESNCp < 0.01140.00 100

