Abstract
Product–service systems (PSS) accelerate the transition of value creation patterns for manufacturing industries, from product design and production to the delivery of overall solution integrating products and services. Existing PSS configuration solutions provide customers with preferable product modules and service modules characterized by the module granularity. Every service module is essentially a whole service flow. However, the performance of the PSS configuration solution is greatly influenced by service details. In summary, this paper studied the configuration optimization of product-oriented PSS using a fine-grained perspective. A multilayer network composed of (i) a product layer, (ii) a service layer, and (iii) a resource layer was constructed to represent the elements (product parts, service activities, resources) and relationships in PSS. Service activities selection and resource allocation were considered jointly to construct the mathematical model of PSS configuration optimization, thus enabling the calculation of optimizing objectives (time, cost, and reliability) under constraints closer to the actual implementation. The importance degree of service activity was considered to improve the performance of service activities with higher importance. Corresponding algorithms were improved and applied for obtaining the optimal solutions. The case study in the automotive industry shows the various advantages of the proposed method.
1. Introduction
Manufacturing industries are experiencing a transition of value creation patterns from the design and production of products to the design and the delivery of services based on products, to accommodate increasingly global competition and customer-centered business settings [1]. As an overall solution that effectively integrates products and services [2], product–service systems (PSS) [3,4,5] play a vital role in accelerating this transition for manufacturers. By prolonging the service life of products and commoditizing the related services, PSS can change the revenue models and pricing capabilities for manufacturers [6,7]. This exemplifies a new source of competitive advantage and differentiation. Furthermore, compared to traditional business models, PSS has the potential to reduce environmental impact, thus receiving much attention as one strategic alternative for the sustainable development of firms [8,9,10].
PSS can be divided into three types: (a) product-oriented PSS, (b) use-oriented PSS, and (c) result-oriented PSS [5]. In product-oriented PSS, customers buy the product as usual; a service is also sold to customers additionally, which then will be operated on products or provided to customers [11]. This means that the product is the principal purpose, so the service is rendered to help customers achieve a better user experience. This paper focuses extensively on product-oriented PSS.
Services help to attain higher margins, but performing the transition or maintaining the success of service strategy is still a challenge for companies [12]. With the increase in service offers, higher costs or failures in achieving expected returns sometimes occur [13,14]. To overcome this glitch in the profit generation and commercial success, companies should target the role of PSS design [15,16]. Many studies have focused on PSS design to provide support, such as design frames [17,18,19], design methods [20], modularization approaches [21,22], configuration and evaluation methods [23,24,25].
Product–service integration solutions provided to customers include product modules and service modules [26]. There are usually many possible PSS solutions. A PSS configuration is the construction of technical systems by selecting and assembling preferable modules from a predefined product and service library according to customers’ needs under certain constraints [27]. Thus, PSS configuration is an imperative part of PSS design. Studies on PSS configuration have mainly focused on the PSS configuration framework [24,28], customer perception in PSS configuration [29], the extraction of PSS configuration rules [30,31,32,33], and PSS configuration optimization methods [23,34]. Most studies on PSS configuration, especially research on PSS configuration optimization, commonly deal with some predefined level of module granularity. Overall, the product module granularity is introduced to achieve flexible manufacturing systems for product functions realization. With regard to service module granularity, every service module is essentially a whole service flow, depending on the specific module’s granularity level. However, it presently lacks the PSS configuration on a finer granularity level, which can inspire the final configuration’s optimization.
Considering the balance between differentiated customization and mass production, inappropriate product module granularity will increase managerial difficulty and manufacturing cost [35]. Services are generally under-designed in comparison to physical products [36]. Also, service modules are not restricted to physical artefacts. Thus, service modules should be designed considering a finer granularity level, so they can integrate tangible and non-tangible artefacts. Recent studies on service modules in PSS have mainly focused on the identification and evaluation of customer requirements [37,38], modularization and related quantification [39,40], and the evaluation of internal and external performance (such as cost, customer satisfaction, service cycle time, availability, and reliability) [11,41]. Modularization can normalize the PSS configuration and improve its suitability. However, a service module in PSS is essentially a composition of service activities. It is coarse-grained to use a whole service flow as a service module unit in PSS configuration. Therefore, configuring a PSS in finer granularity by using service activity as the minimum configuration unit is proposed and developed in this paper.
There are various methods to optimize the composition of service activities, which can be embodied in the following three approaches [42]:
(1) Service composition solver based on artificial intelligence planning, which can automatically generate service activities composition according to customer demands;
(2) The method based on semantics, studying the service matching and composability;
(3) The service workflow-based semiautomatic service composition method, which is the most widely used one.
In this context, Zhu et al. [43] proposed an ontology-based service process model to support decision-making for maintenance, repair, and overhaul services in the aerospace industry. Cao et al. [44] transformed the service process model into a process structure tree to consider service process structuration and service activities selection simultaneously. Wang et al. [45] advocated a model of service activities composition based on stochastic Petri net. Hu et al. [46] modeled the service process by logical Petri net to study the structural transformation of the service process.
The above-mentioned studies only focused on service activities selection. The impact of resource allocation on service activity has not been considered during the service activities selection. Service activities selection and resource allocation were consequently divided into two independent processes. In a practical situation, the performance of service activity operation will be altered based on different resource allocation instances. It is necessary to combine service activities selection and resource allocation into a whole process during the PSS configuration optimization. Furthermore, most of the previous studies highlighted multi-objective optimization of the overall solution, but high-importance service activities usually exert a greater impact on the solution, compared to low-importance services. Therefore, the importance degree of service activity is also taken into consideration in this paper, to improve the performance of service activities with higher importance.
Based on the above analysis, it was found that: (a) PSS configuration is an imperative part of PSS design; (b) existing PSS configuration solutions are obtained in the module granularity; and (c) the significant impact of service details on the performance of a PSS configuration solution has not been given sufficient attention in recent research studies. PSS configuration optimization is, therefore, studied from a fine-grained perspective in this paper. The optimization is performed by combining service activities selection and resource allocation. As a result, the PSS configuration solutions provided to the customer will be more refined and precise. In particular, the optimizing objectives, which present the performance of the solutions, will be calculated closer to the actual implementation.
The complex network is chosen as the framework for the PSS modeling because its structural properties enable the exploration of the interactions between products, resources, and service activities. The mathematical characteristics of complex networks are very useful for analyzing the characteristics of complex systems. However, it is difficult for a general complex network to effectively reveal the multilayered or multidimensional relationships in a complex system when the scale of the system increases substantially. Many approaches have been proposed to enrich the representation of networks. Hypernetworks [47,48,49] are developed based on the definition of the hypergraphs to generalize the multidimensional relationships, in which multi-elements are connected rather than only two elements. Multilayer networks [50] are applied to describe the complex structures of systems, which include different types of relationships between their components. Originally, multilayer networks were proposed to express different types of relationships between one single type of elements in different layers [51,52]. More recently, they have been used to model other systems, including those with different types of elements. Omodei et al. [53] proposed a method based on the multilayer networks of citations and disciplines to assess the interdisciplinary importance of scholars, institutions, and countries. Additionally, Pasqual and Weck [54] introduced a multilayer network model integrating three coupled layers (product layer, change layer, and social layer) to analyze and manage engineering change propagation. Leng and Jiang [55] also offered a multilayer network model comprising processes, machines, and work in processes to assess dynamic scheduling in a radio frequency identification-driven discrete manufacturing system.
Based upon the comparison of the general complex network, hypernetwork, and multilayer network, it is obvious that a multilayer network can perfectly accommodate multiple heterogeneous elements and provide a better description of relationships between heterogeneous elements than a general complex network or hypernetwork. Therefore, a multilayer network, as a special type of complex network, is applied for the modeling of PSS in this paper.
The organization of this paper is as follows. In Section 2, this paper’s research problem is described and the framework is then introduced. The PSS multilayer network model is constructed in Section 3. Section 4 establishes the mathematical model of PSS configuration. This section also delineates the improved optimization algorithms and their applications for obtaining the optimal solutions. Moreover, a case is studied in Section 5 to discuss the feasibility and effectiveness of this method. Section 6 highlights the benefits and the contributions to the sustainability of the proposed approach. Finally, conclusions are stated in Section 7.
2. Problem Description and Framework
In product-oriented PSS, products are delivered to customers as tangible objects in a definite time, just after the PSS configuration solution is accepted. However, that is not the case with services. Services are provided to customers only when the customer requests or the service premises are satisfied and operation of services is affected by the real-time conditions of PSS. Service details, which include service activities selection and resource allocation, are consequently not strictly determined when the PSS configuration solution is accepted. Contracts to implement corresponding service functions are provided to the customer. But service details definitely impact the performance of the PSS configuration solution. Service time depends on service activities selection, cost and reliability are accurately influenced by resource allocation. Thus, the PSS configuration should be optimized by combining service activities selection and resource allocation. In this way, the PSS solutions obtained after optimization will be more precise, and the results based on the optimizing objectives (executing time, executing cost, and executing reliability) will be closer to the actual implementation.
The framework of this fine-grained configuration optimization of the product-oriented PSS is shown in Figure 1. A PSS model is constructed based on a three-layer network, which contains product and services selected by the customer, and the resources in the system. A node in every layer (product layer, service layer, resource layer) of the multilayer network respectively represents an element (product, service, resource). The relationships between homogeneous elements in a layer and the relationships between heterogeneous elements in different layers are represented as edges. With appropriate decomposition, PSS can be clearly described by the proposed multilayer network. Elements and relationships in PSS can be expressed by connection matrixes, which make the description of the mathematical model and realization of optimization more convenient. By using this PSS multilayer network model, the importance degrees of service activities are analyzed based on the attributes of the multilayer network. A mathematical model based on the connection matrixes is constructed to express the objectives and constraints of PSS configuration optimization, and the corresponding solution algorithm is proposed to solve the mathematical model of optimization.
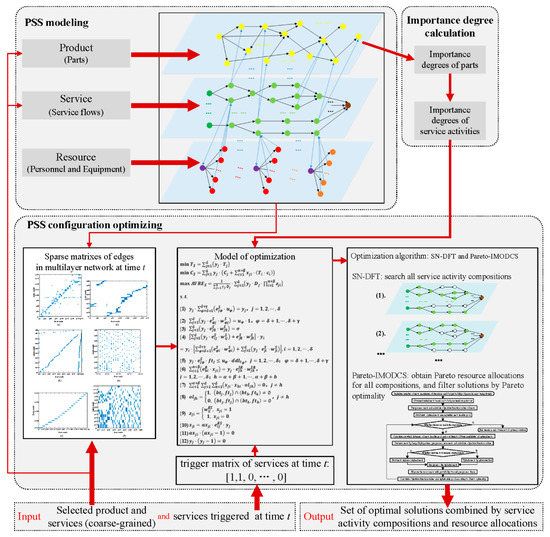
Figure 1.
Framework of the proposed method.
3. PSS Multilayer Network Model
The PSS multilayer network () is composed of the product layer (), service layer (), resource layer (), and set of inter-layer edges () which connect layers to each other. Therefore, there are three types of nodes and five kinds of edges considered in . Specifically, nodes in , nodes in , and nodes in are denoted as sets , , and , respectively; edges in , edges in , edges in , inter-layer edges between and , and inter-layer edges between and are denoted as sets , , , , and , respectively. The inter-layer edges between and are not considered in this model.
Then, is described by Formula (1):
A product can be decomposed into parts according to required granularity. is formed by part nodes (p) connecting to each other by interrelationships between parts. consists of service flows, each of which is described by a service trigger node (ss), numbers of service activity nodes (sa), and a service end node (se) logically associated with each other. contains resources required by service activities, including personnel resources (pr) and equipment resources (er), as resource types are denoted as kr. contains , , and the weights on inter-layer edges. Detailed descriptions of , , , and are given in the following subsections.
3.1. Product Layer
A node in is described by Formula (2):
where is the set of basic information, including information such as name, quality, and material. is the set of accepted service records. is the set of working statuses, including various data of physical status, material status, and environmental status. All statuses vary with time t. For any whose status data cannot be monitored, .
There are four types of interactions among parts [56]: spatial-type interaction, energy-type interaction, information-type interaction, and material-type interaction. These interactions could be extracted from the product design manually. If provides spatial reference (adjacency or orientation) to , then . If provides or transmits energy to , then . If provides or transfers information to , then . If determines or impacts the material selection of , then . If there are one or more interactions from to , then , denotes the directed edge from to ; otherwise, . Obviously, .
In order to describe the overall strength of the relationship between and , the weight on is represented by the value , following Formula (3):
where , , , and , respectively, represent the proportion of , , , and in the edge . is defined in [0,1]. If the four types of interactions are equal in importance, then .
is consequently represented by Formula (4):
3.2. Service Layer
Services in a product lifecycle can be classified into two types: production services and product services. All services in are product services.
3.2.1. Service Trigger Node
A node in is as described by Formula (5):
where is the set of parts whose working statuses are monitored by . is the set of triggering conditions of , is the triggering condition for working statuses of to trigger . denotes the status of : if triggering conditions are satisfied, the status will be , where and are, respectively, the start time and the deadline of the entire service set according to customer requirements; otherwise, the status will be .
3.2.2. Service Activity Node
The function of service activity is to change the status of the service activity receiver [57]. Service activity is operated by the specified resources and executed on the specified component. By decomposing the service flow at specified granularity, the corresponding set of service activities could be obtained. A service activity node in is as described by Formula (6):
where is the set of service execution records of . and are the theoretical executing time and fixed cost for operating , which are extracted from historical data. denotes the reliability of that which can be completed in time . It is represented by the ratio between the number of times that has been completed in time and the total number of times that has been executed. . is set of service objects of . denotes the status of : is idle status, denotes working status. is the beginning time of , ending time is defined as .
3.2.3. Service End Node
A service end node is put in to distinguish whether the service flow is finished at the end of . An edge between and means that is the last service activity in the service flow.
3.2.4. Edges in Service Layer
Regarding and as the activities of “trigger service” and “end service”, respectively, then , , and are homogeneous. Edges between and , edges between and , and edges between and are all denoted by ; , . defined in the interval [0,1] denotes weight on . when . The description of an edge between two nodes considers the following cases:
- Between and : if is the first one executed in the service flow triggered by , then , . can participate in different service flows triggered by , denoted as with , will not output any weight to ; between and ;
- Between and : if is the last one in the service flow being executed, then ; for any and between and ;
- Between and : if and are in same service flow and are executed in time sequence, then . Otherwise, .
There are three types of correlations among service activities [58]: correlation of function similarity, correlation of function complementary, and no correlation. If two service activities have a correlation of function similarity, their function might be identical, inclusive, or partially similar. If two service activities have a correlation of function complementary, the composable situation might be accurate composition, inclusive composition, blocked composition, or crossed composition.
According to the above correlations, logical relationships among service activity nodes are divided into serial relationship, parallel relationship, and selective relationship. Two activities in a serial relationship are sequentially executed in chronological order. Two activities in a parallel relationship are executed at the same time, and only when they are fully completed will the execution of subsequent activities begin. In a selective relationship, there are multiple activities for selection: if only one of them is executed, then the execution of subsequent activities will begin.
The in-degree and out-degree of in are denoted as and which are described by Formulas (7) and (8):
Then, the description of the three types of logical relationships is expanded as follows:
- If and are in a serial relationship, and , then , , ;
- If n nodes () are in a selective relationship, and , then , , . In this case, and . If is selected, then , ;
- If n nodes () are in a parallel relationship, and , then , , , and , . In this case, and .
Connections of these logical relationships are shown in Figure 2. If is replaced by a service trigger node, then .
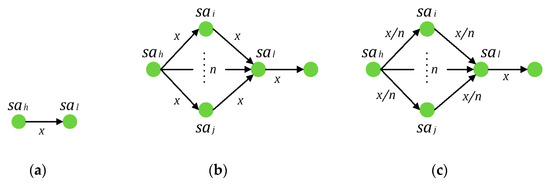
Figure 2.
Logical relationships among service activity nodes. (a) Serial relationship; (b) selective relationship; (c) parallel relationship.
Then, the logical relationship between nodes in can be distinguished by values of and . However, if has multi inputs and multi outputs, as depicted in Figure 3a, the logical relationship between and other nodes will be uncertain. The virtual service activity node is applied to prevent that. Then, will become a node with a single input or single output, as shown in Figure 3b,c. There is not any essential service content in a virtual service activity node, so , , , , , and does not require any resources.
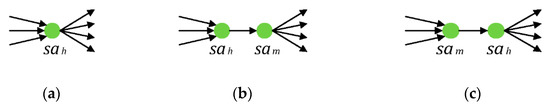
Figure 3.
Different connection situations of . (a) Multiple inputs and multiple outputs; (b) Multiple inputs and single output; (c) Single input and multiple outputs.
If connects the other nodes, which are in selective relationships and parallel relationships, intricately, it will be impractical to distinguish different relationships by values of and . As shown in Figure 4a, when , relationships among , , , and cannot be distinguished directly. In order to solve this situation, there will be two situations to integrate in the virtual service activity nodes and , as follows:
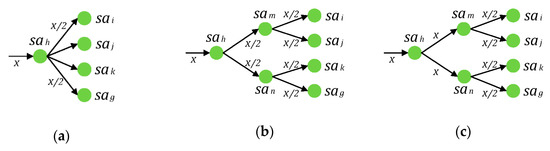
Figure 4.
The logical relationship between and . (a) It cannot be distinguished; (b) It is selective relationship; (c) It is parallel relationship.
- means that and are in a selective relationship; and are in a selective relationship. Meanwhile, (or ) and (or ) are in a parallel relationship, as expressed in Figure 4b.
- , means that and are in a parallel relationship; and are in a parallel relationship. Meanwhile, two parallel clusters are in a selective relationship, as indicated in Figure 4c.
Assuming that the number of and in are indicated, respectively, by and γ, and there is only one , then the description of is consequently shown by Formula (9):
3.3. Resource Layer
The node or in is described by Formula (10):
where is the set of records of services operated by , is the cost for working in one unit of time, denotes the status of . If , then could accept a new assignment of the service activity; if , it means is in working status and will not accept any new assignments until the service activity is working on is finished. If there are not any resource contents in , then , , .
If there is a subordinate relationship between and , which means that the resource type of is , then . This denotes that there is a directed edge from the father node to the child node . Otherwise, . For any , .
Assuming that quantities of , and in are indicated by , , and , respectively, then the description of is shown by Formula (11):
3.4. Inter-Layer Edges
The service content is determined by the working status of products, while service activities are executed on products by required resources. In the PSS multilayer network, some inter-layer edges exist between and , the rest exist between and .
3.4.1. Inter-Layer Edges Between and
For and , if , then , which denotes the directed inter-layer edge from to . This means that is one of the service objects of . Otherwise, . Meanwhile, only makes sense between and ; for or , .
Therefore, the set of inter-layer edges between and is as described by Formula (12):
3.4.2. Inter-Layer Edges Between and
Inter-layer edges between and include directed inter-layer edges from service nodes to resource nodes and directed inter-layer edges from resource nodes to service nodes. Their descriptions are depicted below:
- The execution of service activities demands the resources be in corresponding specific kinds and quantities. If demands the resources whose type is , then , which denotes a directed inter-layer edge from to and the quantity demand is represented by integer weight . Otherwise, , . Meanwhile, only makes sense between and ; for other nodes, ;
- If , , and , it means that is assignable to , then , which denotes a directed inter-layer edge from to . Otherwise, . Meanwhile, only makes sense between and ; for other nodes, . The reliability of being completed in time by is denoted by weight in [0,1].
Every has a different knowledge level and proficiency level about different . Assuming denotes the number of times that has been completed in the time by , denotes the total number of times that has participated in the execution of , then between and is represented by . Every has a constant function in a different . Assuming denotes the number of times that any has been completed in time by and denotes the total number of times that has participated in the execution of any , then between and is represented by .
The set of inter-layer edges between and , and the set of weights on these inter-layer edges are described by Formula (13):
Therefore, is as given by Formula (14):
4. PSS Configuration Optimization
In most practical cases, many services are usually triggered at the same time. Consequently, the configuration optimization should be designed by considering multi-services. After any is triggered, service activities selection and resource allocation should be accomplished under given constraints to obtain the PSS configuration under constraint conditions.
Let us assume that the number of triggered is up to the point of time . If is triggered and is represented by following Formula (15), then the situation of all is represented by trigger matrix with :
As a result, service activities selection is regarded as a selection of the paths with multi as start points in . It is necessary to consider the executing time, cost, and reliability of in the selective relationship. The allocation of resources is viewed as resource allocation for multitasks (service activities), in which the cost and reliability of different are considered. Therefore, the services solution is optimized with the goal of executing time minimization, cost minimization, and reliability maximization.
4.1. Importance Degree of Service Activity
When a certain type of resource is required by several service activities simultaneously, then those resources with higher reliability should be allocated to more important service activities. Product parts are the objects of service activities; hence, the importance degree of product parts exerts a decisive influence on the importance degrees of service activities. Consequently, the importance degree of product parts is taken as the base of calculation for the importance degree of service activities, which provides a theoretical reference for the resource allocation.
Today, network-based importance measurement is thoroughly developed and widely applied. Various measure methods can be summarized as:
(1) Importance calculation methods based on neighbor relationships between nodes, such as degree centrality or semi-local centrality [59];
(2) Path-based importance calculation methods, such as closeness centrality and betweenness centrality;
(3) Importance calculation methods based on eigenvectors, such as search algorithm LeaderRank [60] and SRank [61] based on algorithm PageRank [62];
(4) Importance calculation methods based on node removal and contraction, in which the importance degree of nodes is measured by the variation in network attributes after node removal or contraction [63].
4.1.1. Importance Degree of Product Parts
Importance calculation methods based on eigenvector are applied in this paper. In the concept of PageRank and LeaderRank, the importance of a page in a network is determined by the number and the quality of other pages pointing to it. However, the importance of in is ascertained by the number and quality of other nodes it points to. This makes PageRank and LeaderRank unsuitable for calculating the importance degree of product parts. Referring to the weighted LeaderRank [64], PartRank is proposed to calculate the importance degree of product parts. Details are illustrated as follows.
A ground node , which connects with every part node by a bidirectional edge, is introduced. Then and , . Based on the concept of weighted LeaderRank, nodes with higher input intensity embody a higher probability of being visited by . Inversely, with a higher output intensity is more likely to visit in . is consequently described by formula (16), where is a free parameter, is total number of nodes in (excluding ). is described as Formula (17):
The importance degrees are calculated iteratively until they reach a steady state. Assuming that calculation reaches a steady state at step , then the importance degree of will be allotted to every . The importance degree of is denoted as , calculated as Formula (18),
where is the input intensity of in .
4.1.2. Importance Degree of Service Activities
Knowing that the service object of sa is and if is operated on with a high importance degree, a designer should pay more attention to that . denotes the cross layer importance degree of , which is related to the product parts on which operates. The value of is determined by with the highest in the set of service objects of . is consequently calculated by Formula (19):
After being normalized, the importance degree of is denoted as , where max is the maximum of all in . Therein, the virtual service activity node does not have any service object, so the importance degree of every virtual service activity node is consequently 0.
4.2. Mathematical Model
Define the binary variable to indicate whether is selected, and define the binary variable to indicate whether to allocate to , by the Formulas (20) and (21), respectively:
The mathematical model of PSS configuration optimization is constructed by Formulas (A1)–(A15) in Appendix A. The objective functions are given by Formulas (A1)–(A3) and constraints are given by the Formulas (A4)–(A15).
The objective function of executing time minimization is described by Formula (A1). The executing times of service activities are assumed to be fixed parameters, and they are not impacted by resource allocation. denotes the sum of executing times for all selected .
The objective function of cost minimization is described by Formula (A2). The executing cost of includes the fixed cost and the work costs of all resources allocated to , which are related to the executing times of . denotes the sum of executing costs of all selected .
The objective function of reliability maximization is described by Formula (A3). The executing reliability of is determined by of all that are allocated to . Therefore, a logic function , which depends on as the formula (A12) is defined. Then, , denoting the executing reliability of , is described as . The target of reliability is always to maximize the executing reliability of the whole solution, which is related to the of all selected . However, if a certain type of resource is required by several service activities with overlapping service times, the allocation result of that type tends to make a with a higher importance degree for reaching a higher . Therefore, is defined as the average executing reliability of all selected , which is shown by Formula (22):
The of a with higher has a greater impact on the value of .
When and is assigned to , allocating to might be feasible. Therefore, is defined by the formula (A13). Here, means is allocated to successfully, means is not allocated to . Constraints for and are shown by Formulas (A14) and (A15). Constraints for the three objective functions are developed as indicated below:
- All selected service activities must be part of the construction for the triggered service flows. They are represented by Formula (A4);
- Every service flow starts with the triggered , and the out-degree of is 1. This is expressed by Formula (A5);
- The number of triggered is . All triggered service flows end at . Consequently, the in-degree of is . This is shown by Formula (A6);
- If all selected service activities constitute complete service flows, there will not be any selective relationship between selected and . As a result, the sum of weights on edges from triggered and selected to will equal to the sum of weights on edges from to and selected . This is shown by Formula (A7);
- For every triggered , . Every triggered flow must be completed within the service time range requested by a customer, as illustrated in Formula (A8);
- The resources allocated to the selected must satisfy the constraints as the resource type and the quantity demands of . This constraint is denoted by Formula (A9);
- Every can only participate in a maximum of one service activity at the same time. For all service activities that is allocated to, their service time intervals cannot overlap. Defining oljh indicates whether there is any overlap between the service time intervals of and , as shown in Formula (A11). That constraint is described by Formula (A10).
4.3. Obtaining the Optimal Solutions
To obtain the optimal solutions by the trigger matrix and the proposed mathematical model, the solving procedures are as follows.
- Step 1:
- Obtaining as the service activities solution set for , the number of solutions is denoted as . If , obtain by Depth-First Traversal (DFT), wherein is the set of all service activities selected in the time traversal; if , is not activated, then , , wherein . is different from ordinary complex networks, and as a consequence, the traditional DFT is unsuitable for . Depth-First Traversal based on service layer (SL-DFT) is designed and detailed in Section 4.3.1.
- Step 2:
- Solutions of service activities for each triggered are arranged by permutation and combination. Obtaining a solutions set of service activities as for system, , .
- Step 3:
- Using the Pareto-improved multiple-objective discrete cuckoo search algorithm (Pareto-IMODCS) [23] to obtain the set of optimal solutions of resource allocation for each as , the number of solutions is denoted as . Pareto optimality and Pareto-IMODCS are detailed in Section 4.3.2 and Section 4.3.3, respectively.
- Step 4:
- Merging all into one as , filter to obtain the set of non-dominated solutions as based on Pareto optimality. is the final set of optimal solutions.
4.3.1. Obtaining Solutions of Service Activities by SL-DFT
Obtaining by SL-DFT involves searching all paths from to in . Assuming the current visited node is :
- If and , then add node into the path and continue searching from ;
- If and , nodes satisfying are in a selective relationship, then select one of these to visit. Assuming that the selected node is , continue to search from until all paths from to are obtained, then backtrack to , selecting an unvisited node from nodes satisfying to visit. This new search forms a new path, so nodes visited in the search from can still be visited. Repeat this step until all nodes satisfying are visited;
- If and , it means nodes satisfying are in a parallel relationship. Then, select one to visit and continue searching until the visited node satisfies and , which means is the confluence node of these parallel paths. Then, backtracking to , select an unvisited node from nodes satisfying to visit. Repeat this step until nodes satisfying are all visited. Add all nodes visited in this step into the path and continue to search from .
After all paths from to are obtained, if is a service trigger node, then end the search. Otherwise, backtrack to the node before . Based on the above search, service activity compositions obtained by SL-DFT satisfy the constraints as given by Formulas (A4)–(A7).
4.3.2. Pareto Optimality
In the optimizing process, the solution with smaller executing time, smaller executing cost, and greater executing reliability is considered better. However, objectives in one solution might conflict with each other in reality. Traditional linear weighting methods are unsuitable for solving such multi-objective optimization, which could be solved based on Pareto optimality [65].
If and satisfy that , and , and at least one of these inequalities is a strict inequality, then dominates . If is not dominated by any , then is a non-dominated solution, which is the Pareto optimal solution.
4.3.3. Obtaining Optimal Solutions of Resource Allocation by Pareto-IMODCS
Let us assume that the number of in is regardless of , , and virtual service activity nodes. The types and quantities of resources that every demands can be determined based on the multilayer network model. Then, each possible resource allocation solution is represented by a cuckoo nest: the dimension of nest represents the th resource instance for the th resource type demand of the th in set ; various instances in each dimension are all represented by decimal integers. The subscript number of the service activity node corresponding to the th is denoted as . The subscript number of the resource type node corresponding to the th resource type is denoted as . and facilitate in decoding the nest into the corresponding resource allocation solutions, which satisfy the constraint defined by Formula (A9).
The original Pareto-IMODCS algorithm is detailed in reference [23]. If multiple in demand same type of resources in the same time interval, the solution obtained by the original Pareto-IMODCS algorithm might allocate the same resource instance to multiple simultaneously. This does not comply with the constraint described by Formula (A10). To avoid this, a “nest pre-processing” step is added to Pareto-IMODCS. The specific procedures of the improved Pareto-IMODCS algorithm to obtain Pareto optimal solutions for each are shown in Figure 5.
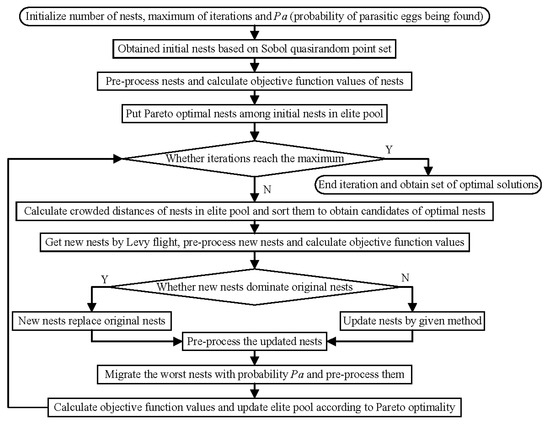
Figure 5.
Procedures of the improved Pareto-improved multiple-objective discrete cuckoo search algorithm (Pareto-IMODCS) algorithm.
The procedure “nest pre-processing” is specified as: for any two dimensions as and , when and , it means that the same resource instance is allocated to multiple dimensions. If or , it denotes that service activities related to and are the same one or their working time intervals overlap, then and .
5. Case Study
In this section, a case study for the PSS of an automobile enterprise is provided to validate the proposed multilayer network-based PSS model and the fine-grained PSS configuration optimization method. A product was delivered to a customer with a contract to implement eight selected services (running system maintenance, steering system maintenance, braking system repair, etc.). These services could be decomposed as service flows consisting of service activities. For example, running system maintenance was decomposed as the maintenance of axles, maintenance of suspensions, maintenance of shock absorbers, maintenance of wheels, and maintenance of frames. As indicated, the PSS of the automobile enterprise was modeled as a multilayer network, which included 193 product nodes, 89 service nodes (1 , 80 , and 8 ), and 140 resource nodes (70 , 50 , and 20 ).
When services are triggered, a set of PSS configuration solutions should be provided to the customer for making a final decision. The customer’s desired performances for the final solution were the minimal executing time and cost and maximal executing reliability. The designer had a PSS configuration optimization task at time , which contained the configuration of services as running system maintenance () and steering system maintenance (). The network status of the case at time is modeled in Figure 6, in which the sparse matrixes of edges denoting corresponding relationships among nodes in multilayer network are detailed in Figure 7.
Figure 6.
Network status at time t.
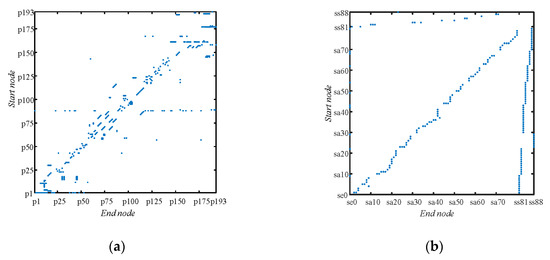
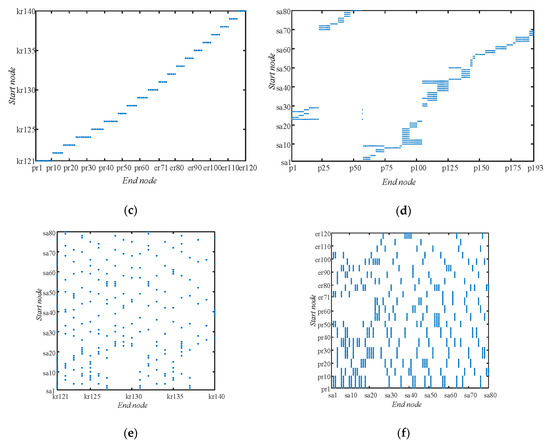
Figure 7.
The sparse matrixes of edges at time . (a) Sparse matrixes of edges in ; (b) sparse matrixes of edges in ; (c) sparse matrixes of edges in ; (d) sparse matrixes of inter-layer edges from to ; (e) sparse matrixes of inter-layer edges from to ; (f) sparse matrixes of inter-layer edges from to .
According to the PSS configuration optimization task, the trigger matrix at time was [1 1 0 0 0 0 0 0]. Structures of triggered service flows in service layer are detailed in Figure 8. The executing time, cost, and reliability of related are detailed in Table 1. It is evident that and were virtual service activity nodes. The cost for all working in one unit of time is shown in Figure 9.
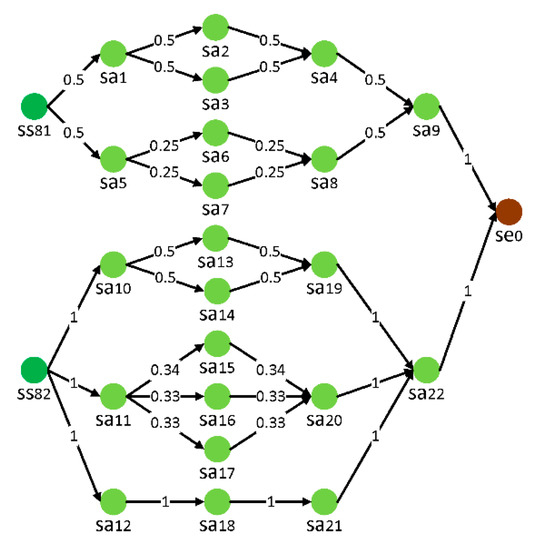
Figure 8.
Triggered service flows in the service layer at time t.

Table 1.
The executing time, cost, and reliability of related service activities.
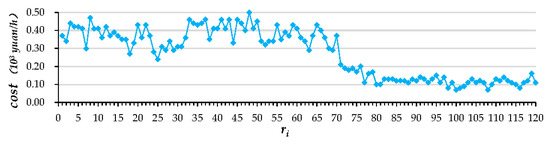
Figure 9.
Cost for all resources.
In the above-mentioned network status and solution constraints, all paths from triggered to and all paths from triggered to were searched by SL-DFT. Then, one from both sets of paths was selected to form service activity compositions. Pareto optimal solutions of resource allocation for every service activity composition were obtained by using the mentioned improved Pareto-IMODCS algorithm. Relevant parameters of the algorithm were as follows: the number of initial nests was 200, the probability of cuckoo eggs being found was 0.25, the maximum number of iterations for a nest was 3000, and the number of times of an iteration run was 10. Then, solutions of all compositions were filtered according to Pareto optimality. As a result, 14 non-dominated solutions were obtained, which were recorded as set A (Table 2).
Table 2.
Solutions in set A.
5.1. Comparison with Method For Selecting Service Activities Before Resource Allocation
To validate the effectiveness of combining service activities selection and resource allocation, the same case was solved with another method as a contrast. In summary, the details were as follows:
Firstly, all paths from triggered to were searched by SL-DFT and all service activity compositions were obtained. Next, all compositions were filtered by objective functions as executing time, cost, and reliability to obtain Pareto optimal service activity compositions. Then, Pareto optimal solutions of resource allocation for each composition were acquired using the improved Pareto-IMODCS with same parameters as last time. Finally, all solutions were filtered according to Pareto optimality. As a result, six non-dominated solutions were recorded as set B (Table 3).
Table 3.
Solutions in set B.
By analyzing solutions in Table 2 and Table 3, it can be found that set A and set B share four common solutions. Nevertheless, set A also contains other solutions in which service activity compositions are different from solutions in set B. The other two solutions in set B (solutions B5 and B6) are dominated by solution A3. Obviously, combining the service activities selection and resource allocation effectively enriches the diversity of the optimal solution set by retaining more non-dominated solutions. The last ones might have been hindered by using the method where service activities selection finished individually before resource allocation.
5.2. Comparison with the Method Using Different Objective Functions
By calculating the importance degrees of service activities related to triggered and , it was found that the importance degree of is significantly higher than other service activities. Reverting to the actual setting of the case, was frame maintenance in the running system maintenance. The frame is the base of the whole automobile assembly, which makes frame maintenance more important compared to other activities in the maintenance of the running system and the steering system.
To validate the maximization of , an objective function which improves the executing reliability of service activities with higher importance degrees, the same case was solved in another way, as follows.
The value 1 was given to the weights of all in the objective function of executing reliability, regardless of the importance degrees of the service activities. The altered objective function of the executing reliability is shown in Formula (23), where denotes the overall executing reliability of all selected activities. As a result, 13 Pareto optimal solutions were obtained, which were recorded as set C.
The executing reliabilities of () in different solutions with set A and set C are shown in Figure 10. The values of in set A are all higher than those in set C. The values of in solution A3 and C11 are the highest in set A and set C, respectively. Service activity compositions in solution A3 and C11 are the same. Comparing and analyzing these two solutions shows why maximizing , as one of the objective functions, could facilitate more beneficial solutions, in which service activities with higher importance degrees have higher executing reliabilities.
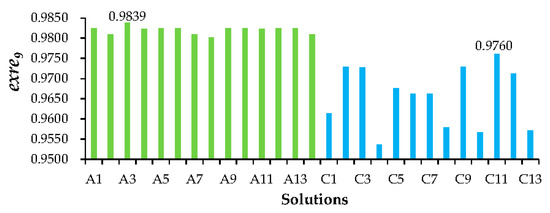
Figure 10.
in different solutions in set A and set C.
The Gantt chart of selected service activity nodes in solution A3 and C11 is depicted in Figure 11. From the perspective of the service time interval, overlaps with and , overlaps with , overlaps with other nodes. Situations of service time interval overlap between service activities are intricate. Consequently, resource allocation of one activity might influence another one and indirectly impact other activities.
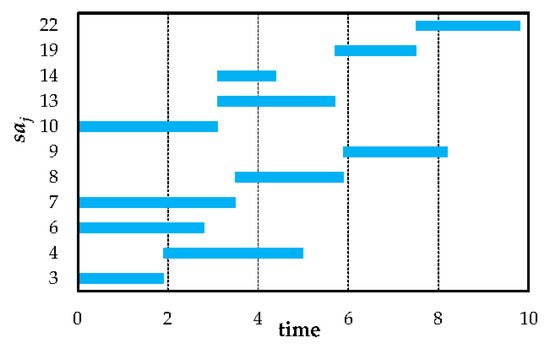
Figure 11.
Gantt chart of selected service activity nodes.
The types and quantities of resources demanded by , , , and are shown in Table 4. The actual situation of resource allocation about the related to in solution A3 and C11 is illustrated in Table 5. on the edges that connect and (all and that are related to , , , and ) are detailed in Figure 12 and Figure 13.
Table 4.
Resource quantity demands of
Table 5.
that are allocated to , , , and .
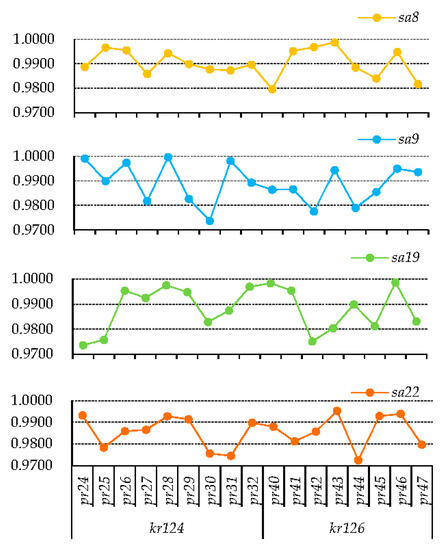
Figure 12.
on edges that connect to , , , and .
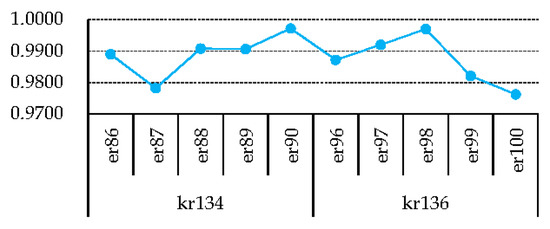
Figure 13.
on edges that connect to all .
The decision process in multi-objective optimization is complicated. In solution C11, with the highest is not allocated to in the process of overall executing reliability maximization. In solution A3, , , , and are all allocated to . of these four resources is the highest among the same type of resources. In turn, the in solution A3 is higher than solution C11. For the remaining three , for whom the importance degrees are not conspicuously higher than each other, the resource allocation is not only based on , but also on the cost (as shown in Figure 9). By including the importance degree of with the objective function of executing reliability as weight, it enables more important to have higher executing reliabilities, by allocating with the highest to this . If the importance degree of is significantly higher, the impact on the overall executing reliability and executing cost will be tolerable.
6. Discussion
As an imperative part of PSS design, PSS configuration is usually studied in a predefined level of module granularity [21,22]. The service modules in existing studies of PSS [23,34] are essentially whole service flows, which can be decomposed into service activities. In the studies of service activity composition [42,45], the impact of resource allocation on service activity is not considered during the service activities selection. This paper studied the PSS configuration in a finer granularity level to inspire the final configuration’s optimization. By combining service activities selection and resource allocation, the proposed approach enriched the diversity of the optimal solution set by retaining more non-dominated solutions. These solutions might be eliminated in advance within the process of service activities selection, when service activities selection and resource allocation are divided into two independent processes in the PSS configuration optimization. Furthermore, the above-mentioned existing studies highlight the multi-objective optimization of the overall solution. The proposed approach improves the executing reliabilities of service activities with a higher importance degree, by allocating resources with higher reliabilities to them. In terms of modeling, a multilayer network model can provide a better description of relationships among three types of elements (product parts, service activities, and resources), compared to an ontology-based model [43], structure tree model [44], and Petri net model [45,46]. The mathematical characteristics of multilayer networks are useful for analyzing the importance degree of product parts and service activities. The sparse matrixes of edges in multilayer networks are applicable as the input of the proposed optimization algorithm.
This paper focused on product-oriented PSS. Adding services to traditional products is used in product-oriented PSS as an approach to reach sustainability [66]. The ultimate purpose of the proposed approach is to achieve PSS configuration optimization. Even if the purpose of sustainability is not directly mentioned, the PSS configuration optimization is still related to achieving sustainability. Optimization of the executing time means a reduction in energy consumption and decreased work time of workers and equipment. The reduced resource utilization can lead to the concept of sustainability in PSS [5]. The optimization of executing costs is an economic benefit. The optimization of executing reliability can also be regarded as a guarantee of the optimization of executing time and cost. Furthermore, one goal of the proposed multi-objective optimization is to improve customer satisfaction. Economic perspective and customer satisfaction are also important measurement indicators of sustainability [9].
7. Conclusions
PSS enables manufacturing companies to provide customers with solutions by integrating preferable product modules and service modules. How to optimize PSS configuration in a fine-grained perspective when modules are confirmed represents an important issue for PSS management. A PSS multilayer network-based method combining service activities selection and resource allocation was developed to obtain optimal PSS solutions. Product parts, services, and resources were mapped as different layers in a PSS multilayer network. In particular, the mapping rules from logical relationships among service activities to edges among nodes were developed to model service layers appropriately. Service activities selection and resource allocation were combined to evaluate the objective functions of solutions systematically and precisely. The importance degree of a service activity was proposed to ascertain the priority of service activities in resource allocation. The advantages of the proposed method are as follows:
- The impact of resources on the cost and reliability of service activities is thoroughly considered, which can affect the PSS configuration optimization equally with service activities. A combination of service activities selection and resource allocation can make the calculation of optimizing indexes closer to the actual implementation;
- The PSS multilayer network model, which accommodates heterogeneous nodes and relationships without distortion, can be transformed into matrices to present information. It helps designers understand the construction of the PSS and build optimization functions easily;
- Cross layer importance degree can sort the service activities based on the importance of the product parts and the objects of service activities.
Although the approach optimizes PSS configuration in a more fine-grained perspective, it also has some limitations. The combination of service activities selection and resource allocation leads to more complexity within the calculation. The optimization is based on a given product in a situation where customers have explicit targets on product module selection. Further work would consider improving the algorithm to shorten the calculation’s response time. Besides, the multilayer network-based modeling method might be extended to the design of use-oriented PSS and result-oriented PSS to satisfy demands for different types of PSS.
Author Contributions
Conceptualization, Z.Z. and D.X.; methodology, Z.Z. and D.X.; software, D.X.; validation, Z.Z., D.X., E.O. and H.C.; formal analysis, D.X.; investigation, D.X.; resources, Z.Z.; data curation, D.X.; writing—original draft, D.X.; writing—review and editing, Z.Z., D.X., E.O. and H.C.; supervision, Z.Z.; project administration, Z.Z.; funding acquisition, Z.Z. All authors have read and agreed to the published version of the manuscript.
Funding
This research was funded by the National Natural Science Foundation of China, grant number 51205242, and the Shanghai Science and Technology Innovation Action Plan, grant number 16111106402.
Conflicts of Interest
The authors declare no conflict of interest.
Appendix A
References
- Meier, H.; Völker, O.; Funke, B. Industrial product-service systems (IPS 2). Int. J. Adv. Manuf. Technol. 2011, 52, 1175–1191. [Google Scholar] [CrossRef]
- Lindahl, M.; Sundin, E.; Sakao, T. Environmental and economic benefits of Integrated Product Service Offerings quantified with real business cases. J. Clean. Prod. 2014, 64, 288–296. [Google Scholar] [CrossRef]
- Mont, O.K. Clarifying the concept of product–service system. J. Clean. Prod. 2002, 10, 237–245. [Google Scholar] [CrossRef]
- Tukker, A.; Tischner, U. Product-services as a research field: Past, present and future. Reflections from a decade of research. J. Clean. Prod. 2006, 14, 1552–1556. [Google Scholar] [CrossRef]
- Baines, T.S.; Lightfoot, H.W.; Evans, S.; Neely, A.; Greenough, R.; Peppard, J.; Roy, R.; Shehab, E.; Braganza, A.; Tiwari, A. State-of-the-art in product-service systems. Proc. Inst. Mech. Eng. Part B 2007, 221, 1543–1552. [Google Scholar] [CrossRef]
- Tukker, A. Product services for a resource-efficient and circular economy—A review. J. Clean. Prod. 2015, 97, 76–91. [Google Scholar] [CrossRef]
- Rapaccini, M. Pricing strategies of service offerings in manufacturing companies: A literature review and empirical investigation. Prod. Plan. Control. 2015, 26, 1247–1263. [Google Scholar] [CrossRef]
- Tukker, A. Eight types of product–service system: Eight ways to sustainability? Experiences from SusProNet. Bus. Strategy Environ. 2004, 13, 246–260. [Google Scholar] [CrossRef]
- Lee, S.; Geum, Y.; Lee, H.; Park, Y. Dynamic and multidimensional measurement of product-service system (PSS) sustainability: A triple bottom line (TBL)-based system dynamics approach. J. Clean. Prod. 2012, 32, 173–182. [Google Scholar] [CrossRef]
- Sakao, T. Engineering PSS (Product/Service Systems) toward sustainability: Review of research. In Handbook of Sustainable Engineering; Kauffman, J., Lee, K., Eds.; Springer: Dordrecht, The Netherlands, 2013; pp. 597–613. [Google Scholar]
- Pascual, R.; Siña, M.; Santelices, G.; Román, M.; López Droguett, E. Optimal channel coordination in use-based product-service system contracts. Int. J. Prod. Res. 2017, 55, 6946–6956. [Google Scholar] [CrossRef]
- Benedettini, O.; Neely, A.; Swink, M. Why do servitized firms fail? A risk-based explanation. Int. J. Oper. Prod. Manag. 2015, 35, 946–979. [Google Scholar] [CrossRef]
- Gebauer, H.; Fleisch, E. An investigation of the relationship between behavioral processes, motivation, investments in the service business and service revenue. Ind. Mark. Manag. 2007, 36, 337–348. [Google Scholar] [CrossRef]
- Neely, A. Exploring the financial consequences of the servitization of manufacturing. Oper. Manag. Res. 2008, 1, 103–118. [Google Scholar] [CrossRef]
- Cavalieri, S.; Pezzotta, G. Product–Service Systems Engineering: State of the art and research challenges. Comput. Ind. 2012, 63, 278–288. [Google Scholar] [CrossRef]
- Matschewsky, J.; Kambanou, M.L.; Sakao, T. Designing and providing integrated product-service systems–challenges, opportunities and solutions resulting from prescriptive approaches in two industrial companies. Int. J. Prod. Res. 2018, 56, 2150–2168. [Google Scholar] [CrossRef]
- Hussain, R.; Lockett, H.; Vasantha, G.V.A. A framework to inform PSS Conceptual Design by using system-in-use data. Comput. Ind. 2012, 63, 319–327. [Google Scholar] [CrossRef]
- Song, W.; Sakao, T. A customization-oriented framework for design of sustainable product/service system. J. Clean. Prod. 2017, 140, 1672–1685. [Google Scholar] [CrossRef]
- Mourtzis, D.; Fotia, S.; Vlachou, E.; Koutoupes, A. A Lean PSS design and evaluation framework supported by KPI monitoring and context sensitivity tools. Int. J. Adv. Manuf. Technol. 2018, 94, 1623–1637. [Google Scholar] [CrossRef]
- Marilungo, E.; Peruzzini, M.; Germani, M. Review of Product-Service System Design Methods. In Product Lifecycle Management in the Era of Internet of Things, Proceedings of the IFIP International Conference on Product Lifecycle Management, Doha, Qatar, 19–21 October 2015; Springer: Cham, Switzerland, 2016; pp. 271–279. [Google Scholar]
- Geng, X.; Xu, S.; Ye, C. Module configuration approach for product service system design driven by customer requirements. Comput. Integr. Manuf. Syst. 2016, 22, 55–61. [Google Scholar]
- Sun, J.; Chai, N.; Pi, G.; Zhang, Z.; Fan, B. Modularization of product service system based on functional requirement. Procedia CIRP 2017, 64, 301–305. [Google Scholar] [CrossRef]
- Zhang, Z.; Shang, Y.; Sun, J.; Fan, B. Product services system configuration optimization based on multi-objective discrete cuckoo search algorithm. Comput. Integr. Manuf. Syst. 2017, 23, 1774–1786. [Google Scholar]
- Shen, J.; Erkoyuncu, J.A.; Roy, R.; Wu, B. A framework for cost evaluation in product service system configuration. Int. J. Prod. Res. 2017, 55, 6120–6144. [Google Scholar] [CrossRef]
- Zhang, Z.; Xu, D.; Ostrosi, E.; Yu, L.; Fan, B. A systematic decision-making method for evaluating design alternatives of product service system based on variable precision rough set. J. Intell. Manuf. 2019, 30, 1895–1909. [Google Scholar] [CrossRef]
- Li, H.; Ji, Y.; Gu, X.; Qi, G.; Tang, R. Module partition process model and method of integrated service product. Comput. Ind. 2012, 63, 298–308. [Google Scholar] [CrossRef]
- Long, H.; Wang, L.; Shen, J.; Wu, M.; Jiang, Z. Product service system configuration based on support vector machine considering customer perception. Int. J. Prod. Res. 2013, 51, 5450–5468. [Google Scholar] [CrossRef]
- Wu, B.; Fan, S.; Yu, A.J.; Xi, L. Configuration and operation architecture for dynamic cellular manufacturing product–service system. J. Clean. Prod. 2016, 131, 716–727. [Google Scholar] [CrossRef]
- Long, H.J.; Wang, L.Y. A rough set based approach to knowledge acquisition for product service system configuration. Appl. Mech. Mater. 2012, 220–223, 2534–2539. [Google Scholar] [CrossRef]
- Zhang, Z.; Chai, N.; Ostrosi, E.; Shang, Y. Extraction of association rules in the schematic design of product service system based on Pareto-MODGDFA. Comput. Ind. Eng. 2019, 129, 392–403. [Google Scholar] [CrossRef]
- Liu, Y.; Zhang, Z.F.; Yao, D.; Chu, X.N. Extraction of Product Service System Configuration Rules Based on Multi-objective DPSO Algorithm. J. Shanghai Jiaotong Univ. 2015, 49, 1123–1130. [Google Scholar]
- Shen, J.; Wu, B.; Yu, L. Personalized configuration rules extraction in product service systems by using Local Cluster Neural Network. Ind. Manag. Data Syst. 2015, 115, 1529–1546. [Google Scholar] [CrossRef]
- Long, H.; Wang, L.; Zhao, S.; Jiang, Z. An approach to rule extraction for product service system configuration that considers customer perception. Int. J. Prod. Res. 2016, 54, 5337–5360. [Google Scholar] [CrossRef]
- Li, H.; Ji, Y.; Chen, L.; Jiao, R.J. Bi-level coordinated configuration optimization for product-service system modular design. IEEE Trans. Syst. Man Cybern. Syst. 2015, 47, 537–554. [Google Scholar] [CrossRef]
- Yan, H.; Zhong, W. Modular decomposition model of complex product system and its application. J. Beijing Univ. Aeronaut. Astronaut. 2017, 43, 654–659. [Google Scholar]
- Pezzotta, G.; Pirola, F.; Pinto, R.; Akasaka, F.; Shimomura, Y. A Service Engineering framework to design and assess an integrated product-service. Mechatronics 2015, 31, 169–179. [Google Scholar] [CrossRef]
- Shimomura, Y.; Nemoto, Y.; Ishii, T.; Nakamura, T. A method for identifying customer orientations and requirements for product–service systems design. Int. J. Prod. Res. 2018, 56, 2585–2595. [Google Scholar] [CrossRef]
- Szwejczewski, M.; Goffin, K.; Anagnostopoulos, Z. Product service systems, after-sales service and new product development. Int. J. Prod. Res. 2015, 53, 5334–5353. [Google Scholar] [CrossRef]
- Fargnoli, M.; Haber, N.; Sakao, T. PSS modularisation: A customer-driven integrated approach. Int. J. Prod. Res. 2018, 57, 1–17. [Google Scholar] [CrossRef]
- Mourtzis, D.; Fotia, S.; Boli, N.; Vlachou, E. An approach for the modelling and quantification of PSS customisation. Int. J. Prod. Res. 2018, 56, 1137–1153. [Google Scholar] [CrossRef]
- Pezzotta, G.; Pirola, F.; Rondini, A.; Pinto, R.; Ouertani, M.-Z. Towards a methodology to engineer industrial product-service system–Evidence from power and automation industry. CIRP J. Manuf. Sci. Technol. 2016, 15, 19–32. [Google Scholar] [CrossRef]
- Zhang, M.-W.; Zhang, B.; Liu, Y.; Na, J.; Zhu, Z.-L. Web service composition based on QoS rules. J. Comput. Sci. Technol. 2010, 25, 1143–1156. [Google Scholar] [CrossRef]
- Zhu, H.; Gao, J.; Li, D.; Tang, D. A Web-based Product Service System for aerospace maintenance, repair and overhaul services. Comput. Ind. 2012, 63, 338–348. [Google Scholar] [CrossRef]
- Cao, J.; Wang, J.; Zhao, H.; Sun, X. A service process optimization method based on model refinement. J. Supercomput. 2013, 63, 72–88. [Google Scholar] [CrossRef]
- Wang, Y.; Lin, C.; Ungsunan, P.D.; Huang, X. Modeling and survivability analysis of service composition using Stochastic Petri Nets. J. Supercomput. 2011, 56, 79–105. [Google Scholar] [CrossRef]
- Hu, Q.; Du, Y.; Yu, S. Service net algebra based on logic Petri nets. Inf. Sci. 2014, 268, 271–289. [Google Scholar] [CrossRef]
- Johnson, J. Hypernetworks in the Science of Complex Systems; Imperial College Press: London, UK, 2013. [Google Scholar]
- Johnson, J.H. Hypernetworks: Multidimensional relationships in multilevel systems. Eur. Phys. J. Spec. Top. 2016, 225, 1037–1052. [Google Scholar] [CrossRef]
- Johnson, J.H. Hypernetworks for reconstructing the dynamics of multilevel systems. In Proceedings of the European Conference on Complex Systems, Oxford, UK, 22–29 September 2006. [Google Scholar]
- Kivelä, M.; Arenas, A.; Barthelemy, M.; Gleeson, J.P.; Moreno, Y.; Porter, M.A. Multilayer networks. J. Complex Netw. 2014, 2, 203–271. [Google Scholar] [CrossRef]
- De Domenico, M.; Solé-Ribalta, A.; Cozzo, E.; Kivelä, M.; Moreno, Y.; Porter, M.A.; Gómez, S.; Arenas, A. Mathematical formulation of multilayer networks. Phys. Rev. X 2013, 3, 041022. [Google Scholar] [CrossRef]
- De Domenico, M.; Granell, C.; Porter, M.A.; Arenas, A. The physics of spreading processes in multilayer networks. Nat. Phys. 2016, 12, 901–906. [Google Scholar] [CrossRef]
- Omodei, E.; De Domenico, M.; Arenas, A. Evaluating the impact of interdisciplinary research: A multilayer network approach. Netw. Sci. 2017, 5, 235–246. [Google Scholar] [CrossRef]
- Pasqual, M.C.; de Weck, O.L. Multilayer network model for analysis and management of change propagation. Res. Eng. Des. 2012, 23, 305–328. [Google Scholar] [CrossRef]
- Leng, J.; Jiang, P. Dynamic scheduling in RFID-driven discrete manufacturing system by using multi-layer network metrics as heuristic information. J. Intell. Manuf. 2019, 30, 979–994. [Google Scholar] [CrossRef]
- Eppinger, S.D.; Browning, T.R. Design Structure Matrix Methods and Applications; MIT Press: Cambridge, MA, USA, 2012. [Google Scholar]
- Tomiyama, T. Service engineering to intensify service contents in product life cycles. In Proceedings of the Second International Symposium on Environmentally Conscious Design and Inverse Manufacturing, Tokyo, Japan, 11–15 December 2001; pp. 613–618. [Google Scholar]
- Cheng, Y.; Zhao, D.; Tao, F.; Zhang, L.; Liu, Y. Complex networks based manufacturing service and task management in cloud environment. In Proceedings of the 2015 IEEE 10th Conference on Industrial Electronics and Applications, Auckland, New Zealand, 15–17 June 2015; pp. 242–247. [Google Scholar]
- Chen, D.; Lü, L.; Shang, M.-S.; Zhang, Y.-C.; Zhou, T. Identifying influential nodes in complex networks. Phys. A 2012, 391, 1777–1787. [Google Scholar] [CrossRef]
- Lü, L.; Zhang, Y.-C.; Yeung, C.H.; Zhou, T. Leaders in social networks, the delicious case. PLoS ONE 2011, 6, e21202. [Google Scholar] [CrossRef]
- Gu, Y.; Zhu, Z. Node Ranking in Complex Networks based on LeaderRank and Modes Similarity. J. Univ. Electron. Sci. Technol. China 2017, 46, 441–448. [Google Scholar]
- Brin, S.; Page, L. The anatomy of a large-scale hypertextual web search engine. Comput. Netw. ISDN Syst. 1998, 30, 107–117. [Google Scholar] [CrossRef]
- Restrepo, J.G.; Ott, E.; Hunt, B.R. Characterizing the dynamical importance of network nodes and links. Phys. Rev. Lett. 2006, 97, 094102. [Google Scholar] [CrossRef]
- Li, Q.; Zhou, T.; Lü, L.; Chen, D. Identifying influential spreaders by weighted LeaderRank. Phys. A 2014, 404, 47–55. [Google Scholar] [CrossRef]
- Dudas, C.; Ng, A.H.; Pehrsson, L.; Boström, H. Integration of data mining and multi-objective optimisation for decision support in production systems development. Int. J. Comput. Integr. Manuf. 2014, 27, 824–839. [Google Scholar] [CrossRef]
- Manzini, E.; Vezzoli, C.; Clark, G. Product-service systems: Using an existing concept as a new approach to sustainability. J. Des. Res. 2001, 1, 27–40. [Google Scholar] [CrossRef]
© 2020 by the authors. Licensee MDPI, Basel, Switzerland. This article is an open access article distributed under the terms and conditions of the Creative Commons Attribution (CC BY) license (http://creativecommons.org/licenses/by/4.0/).