Abstract
Carsharing is an emerging commute mode in China, which may produce social and environmental benefits. This paper aims to develop a commute mode choice model to explore influential factors and quantify their impacts on the potential demand for carsharing in Shanghai. The sample data were obtained from a revealed preference (RP) and stated preference (SP) survey and integrated with level-of-service attributes from road and transit networks. The RP survey collected commuters’ trip information and socioeconomic and demographic characteristics. In the SP survey, four hypothetical scenarios were designed based on carsharing’s unit price to collect commuters’ willingness to shift to carsharing. Data fusion method was applied to fuse RP and SP models. The joint model identified the target group of choosing carsharing with certain socioeconomic and demographic attributes, such as gender, age, income, household member, household vehicle ownership, and so on. It also indicates that the value of time (VOT) for carsharing is 35.56 RMB Yuan (5.08 US Dollar)/h. The elasticity and marginal effect analysis show that the direct elasticity of carsharing’s fare on its potential demand is −0.660, while the commuters, who have a more urgent plan on car purchase or are more familiar with the carsharing service, have much higher probabilities to choose carsharing as their commute modes. The developed model is expected to be applied to the urban travel demand model, providing references for the formulation of carsharing operation scheme and government policy.
1. Introduction
Carsharing is a travel mode that replaces car ownership with car use rights. It provides members access to a fleet of autos for short-term use throughout the day, and therefore reduces the need for one or more personal vehicles [1]. Carsharing originated in Europe and dated back to the 1940s. It became prevalent in the 1990s and has been further popularized in Europe and extended to North America, South America, Asia, and Australia in the past 20 years [2]. There are various carsharing models in existence, the earliest of which was the round-trip model. More recently, different carsharing models have emerged, including one-way (free-floating or station-based) and peer-to-peer carsharing [3]. On the one hand, carsharing meets motorized travel demands while reducing travel costs. On the other hand, it plays a certain role in producing environmental and social benefits. The impact on the environment is mainly reflected in reducing greenhouse gas emissions [4,5,6,7]. Recently, more and more studies begin to focus on the use of electric vehicles in Carsharing [8,9]. Shaheen et al. also suggested that carsharing and zero-emission vehicles (ZEVs) could be integrated to create a more sustainable transportation system [10]. Some studies indicate a considerable reduction in vehicle ownership and vehicle kilometers traveled (VKT). The result of Martin et al.’s study [11] showed that the average number of vehicles per household of carsharing members in North America fell from 0.47 to 0.24. A more recent study of car2go users in five North American cities by Martin and Shaheen [12] found that each carsharing vehicle removed between 7 and 11 vehicles from the road. Nijland [13] found that in the Netherlands car ownership of carsharing users decreased by more than 30%, and the VKT decreased by 15% to 20%. In terms of the impact of transportation systems, the current role of carsharing in replacing other travel modes is still controversial [14]. Some studies have shown that carsharing members shift to transit, bicycle, and walking [15]; others have shown that carsharing has a substitution effect on public transit and increases the VKT [16]. Otherwise, carsharing can also be a potential solution to address first- and last-mile connection with public transit [17].
High-speed motorization in China’s cities has brought about a series of problems such as parking difficulties, air pollution, energy consumption, as well as traffic control and safety issues [18,19,20]. Carsharing has been introduced and is now in its nascent stage of development in China. After 2011, commercial carsharing services emerged gradually in major cities, such as “chefenxiang” in Hangzhou, EVCARD in Shanghai, and Gofun in Beijing. However, since people know little about carsharing, the study on people’s willingness to use carsharing will contribute to the promotion of carsharing in China and the development of a multimodal and sustainable urban transportation system [21]. Commute trips are the basis for ensuring residents’ daily work and life, accounting for a large proportion of travel demand during the morning and evening peaks [22]. Carsharing can enlarge the mode choice set by providing an alternative flexible commute mode. How to estimate the potential commute demand of carsharing and quantify its influential factors have become important research topics.
Some scholars developed discrete choice models to analyze residents’ willingness to use carsharing and its influential factors. Usually, a stated preference (SP), or revealed preference (RP) and stated preference (SP), survey is conducted to obtain the data for analysis. Cervero [23] developed a binary logit model to analyze the preference for carsharing in San Francisco. The main influential factors were the travel time difference between auto and public transit, gender, annual income, etc. The binomial logit model was also used in Cartenì et al.’s study [24] to analyze the mode choice between carsharing and private car. The key finding from the choice model and the follow-up elasticity analysis was that travel cost has a much greater impact than travel time on affecting carsharing choice. Similarly, in De Luca and Di Pace [25], travel cost was identified as one of the critical factors based on an SP survey. The estimation results of bivariate probit model in Becker et al. [26] demonstrated both free-floating and station-based carsharing services could attract younger and educated people, which were in line with the key findings from the other two studies [27,28] dedicated to revealing the influence of socioeconomic factors on the general carsharing choice. Based on the SP survey data, Catalano et al. [29] developed a commute mode choice model in Palermo, Italy. The result indicated that one-way travel time, cost, parking time, and the number of cars available to each family member were the main factors influencing commuters’ willingness. Additionally, under a future scenario characterized by several policy actions for limiting private mode use, the carsharing market share could increase to 10%. Ordered logit model was also applied to capture the willingness (divided into five levels: Definitely no, probably no, maybe, probably yes, and absolutely yes) to use Greek electric vehicle (EV) carsharing in Efthymiou’s study [30]. The findings showed that people with annual income between 15 K and 25 K Euros were more willing to accept carsharing, and carsharing were more attractive to commuters who used bus, trolley, or tram and were more environmentally conscious.
The research on carsharing in China mainly focuses on first-tier cities such as Shanghai and Beijing. There are great differences in the degree of motorization [31] and taxi market [32] between China and other countries, which may lead to great differences in the willingness to use carsharing. Wang et al. [32] conducted an SP survey on Shanghai residents and developed an ordered logit model of carsharing use willingness (divided into five levels from low to high). The results showed that people interested in carsharing were younger, more likely to be well educated, had longer commute distance, and had fewer cars. Wang and Yan [33] also conducted an empirical study of willingness (divided into three levels: Willing to use, neutral, and not willing to use) to use EV carsharing in Shanghai. The results of the multinomial logistic regression analysis showed that the demographic characteristics of people choosing EV carsharing were male, aged between 18 and 30 years old, and usually took subway and bus as the daily travel modes. In order to explore the market potential of carsharing system in Beijing, Yoon and Chery [34] developed a binary logit model on whether they would like to use carsharing in one-way and round-trip travel based on RP and SP survey data. The results showed that age, income, gender, gated apartment residence, car ownership, comfort index of subways users, shelter mode, and so on were important influential factors.
But there is insufficiency in existing studies: (1) Only level-of-service (LOS) attributes of current RP travel mode were generally obtained from the commute information recalled by respondents, whereas LOS attributes of other RP travel modes were not obtained, which suffered from information inadequacy. LOS attributes in SP hypothetical scenarios are often set up by researchers, which are not necessarily combined with the actual trip origins and destinations. (2) In fact, a few carsharing companies are already operating in the market. Some residents may have contacted and used carsharing. The impacts of familiarity with carsharing and user experience on use willingness were neglected, and analysis of which is helpful for operating enterprises to evaluate the significance of their marketing promotion. (3) Although a part of studies developed a mode choice model for all travel modes including carsharing, they only considered travel modes in SP context. There lacks research combining SP choices with actual RP choices.
To supplement the insufficiency, this study completed the following tasks: (1) RP/SP commute information and socioeconomic and demographic attributes of commuters in Shanghai were collected through a survey. Different SP scenarios were designed based on carsharing unit price to test price sensitivity and calculate the value of time (VOT). Zone-to-zone skim matrices of LOS attributes were generated based on the actual road network and transit networks in Shanghai. Based on these skim matrices, LOS attributes of RP/SP travel modes in the sample were obtained, which greatly improve the diversity and accuracy of LOS attributes. (2) The respondents’ familiarity with carsharing (EVCARD, a one-way station-based EV carsharing service in Shanghai, as the research object in this study) was collected to test the impacts of different levels of familiarity on their willingness to use carsharing. (3) Based on data fusion method, a joint RP and SP commute mode choice model was developed. The developed model is expected to be applied to the urban travel demand model, providing references for the formulation of carsharing operation scheme and government policy.
This paper focuses on the identification of factors influential to the potential commute demand on carsharing in the joint RP/SP model. The rest of this paper is organized as follows. The next section introduces the RP/SP data fusion method for model development. Section 3 presents data sources and sample description. In Section 4, the joint RP/SP model is developed so as to specify the influential factors and their impacts on potential demand of carsharing. Key explanatory variables in carsharing utility function are selected for elasticity and marginal effect analysis. The last section concludes this paper and discusses future research directions.
2. Methodology
2.1. Joint RP and SP MNL Model
This section presents the data fusion method for integrating RP and SP data. Although RP surveys can reflect a traveler’s actual mode choice, there are also some shortcomings, such as failure to get travelers’ preferences on alternatives that do not exist in the market, or that travelers have not yet been familiar with. SP surveys allow for a flexible design of hypothetical scenarios related to key attributes and can obtain multiple observations on one individual. SP surveys can help researchers to capture the individual behavior and perception more accurately [35], and to achieve an effective valuation of attributes [36], which is especially suitable for the analysis of the impact of an alternative being newly introduced into the market. However, SP data may not produce reliable forecasts of real choices due to the fact that the hypothetical scenario is not exactly the same as the choice scenario in the real world. An RP/SP data fusion can take advantage of the complementary strengths of each data source and improve the model precision [37].
In a traditional multinomial logit (MNL) model, the error term in each random utility function is assumed to follow i.i.d. (identical and independent distribution) of standard Gumbel. The assumption is based upon two properties of the Gumbel distribution: One is its similarity to the normal distribution, while the other is the achievement of a closed-form expression for the likelihood function after being integrated with the utility maximization theory [38,39,40]. However, since error terms may have unequal variances when choice data are derived from different sources, the model cannot be developed by pooling those data directly.
In this study, a practical method is applied to integrate RP and SP data by introducing a scale parameter. This method was initially applied in the transportation field by Morikawa et al. [41]. Suppose that the ratio between error variances in the RP and SP data can be expressed as or , then two random variables with equal variance can be obtained. The model is illustrated in the following framework:
RP model:
SP model:
where is the utility of Alternative i for Individual n; is the systematic component of ; is the random component of ; is the mode choice set of Individual n; is the probability that Individual n chooses Alternative i; is the choice indicator of Alternative i for Individual n; is the vector of same explanatory variables of Alternative i for Individual n in RP and SP; and are vectors of different explanatory variables of Alternative i for Individual n in RP and SP; , , and are vectors of unknown parameters; is the scale parameter; superscript RP and SP indicate different data sources.
Model parameters (including the scale parameter ) can be estimated by maximizing the following joint log-likelihood function [42] so that an effective data fusion and consistent model estimation can be realized:
where and represent the samples in the RP and SP data.
In NLOGIT software [43], the estimation problem can be solved by setting up an artificial tree structure [44]. Two subsets can be formed by incorporating RP and SP alternatives respectively. RP alternatives are placed in a nest directly below the “root” while SP alternatives are each placed in a single alternative nest. By this means, one can scale up or down all utility functions in the SP context by the same factor .
This study focuses on seven main commute travel modes: Car, Taxi, Rail, Bus, Rail & Bus (a combination of rail and bus), Non-motor (including non-motorized vehicles and walking), and Carsharing. Then the nesting structure is supposed to be like Figure 1.
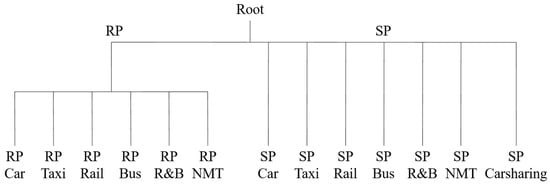
Figure 1.
Nesting structure for joint model estimation.
2.2. Choice Set Restriction
In this study, the universal choice set is defined to contain seven main modes in Figure 1. Since not all modes in the universal choice set are available to every traveler, the choice set needs to be differentiated for each traveler.
The choice set for each traveler is developed in the following ways:
- Car mode is not available if a traveler does not have a household private car.
- Taxi mode is available for all the travelers.
- If the rail/bus in-vehicle time from the zone-to-zone skim matrices (see Section 3.2) takes a missing value because the trip origin or destination does not have good access to rail/bus station (the cut-off access distance for bus station is set to 2 km, and for rail is set to 5 km), the Rail/Bus mode is not available for the traveler in this trip.
- If either of the in-vehicle times of rail and bus take a missing value, Rail & Bus mode is not available for the traveler in this trip.
- According to the cumulative distribution curve of trip distance of non-motorized trips derived from the Shanghai transport survey report [45], 99% of non-motorized trips are less than 25 km. We assumed that non-motor mode is not available if non-motor trip distance exceeds 25 km.
- In the survey, only a small part of the commuters who are willing to shift to carsharing do not have a driver’s license yet, but they are still potential users of carsharing. And it is not difficult to obtain a driver’s license in China. For this consideration, carsharing mode is assumed available for all the travelers.
3. Data Sources and Description
3.1. Web-Based Travel Survey on Carsharing
EVCARD in Shanghai is a one-way station-based EV carsharing service that is charged on travel time (minutes) or daily basis. The users can achieve self-service car rental and pay online through mobile EVCARD APP or its website. During July to September 2018, an RP&SP survey on commuters’ willingness to use EVCARD for commute was conducted in Shanghai through an online survey platform and 887 valid observations on morning peak commuters were collected.
The questionnaire was designed to involve three parts:
- The first part (RP part) collected full-mode commute trip information, including origin and destination locations (ODs), current commute mode, travel modes of accessing and egressing public transit stations, trip beginning and ending times, and the number of companions.
- The second part (SP part) gathered a potential mode shift to EVCARD under four hypothetical scenarios. First, the basic operational characteristics and usage process of EVCARD were briefly introduced to respondents, as shown in Figure 2. Then, four hypothetical scenarios were designed based on carsharing’s unit price to test price sensitivity, which were 0.4, 0.6, 0.8, and 1.0 RMB Yuan/min, respectively. We conducted a pre-survey in May 2018 with a sample size of 77, and four SP unit price levels were designed as 0.2, 0.4, 0.6, and 0.8 RMB Yuan/min based on the actual unit price of EVCARD in Shanghai, which is 0.6 RMB Yuan/min. The analysis of the pre survey showed that almost all respondents were willing to shift to carsharing when the unit price is 0.2 RMB Yuan/h, which means that we have assumed a relatively low price setting. Thus, we designed four unit price levels starting from 0.4 RMB Yuan/min with an increment of 0.2 RMB Yuan/min in order to have an adequate price variance as well as the exact unit price in SP scenarios. Respondents answered whether they would like to shift to EVCARD for commute under two hypothetical scenarios that appeared at equal probability randomly, which could not only reduce the complexity and improve the quality of questionnaire, but also collect information in scenarios with different levels of carsharing’s unit price. Thus, the final sample comprises a total of 3229 observations (887 RP observations and 2342 SP observations).
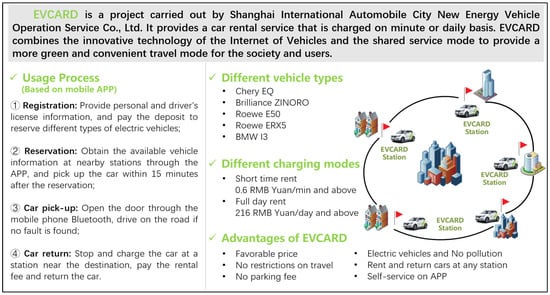 Figure 2. Introduction to EVCARD carsharing service (translated from Chinese).
 - The third part collected the socioeconomic and demographic characteristics of commuters, including gender, age, education, personal monthly income, marital status, residence type, household member, household vehicle ownership, car purchase plan, and familiarity with EVCARD and so on.
3.2. Zone-to-Zone Skim Matrices
Shanghai residential committees, road network, and transit network (including rail/bus lines, rail/bus stops) were integrated based on the TransCAD software platform, as shown in Figure 3. The residential committee is the basic administrative unit of residents in Shanghai. There are 5432 residential committees in the entire city, which are considered as traffic analysis zones (TAZs). The centroids of TAZs are used to locate the starting points and ending points of trips.
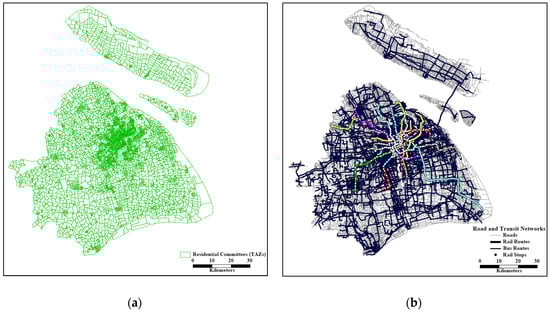
Figure 3.
Network map in TransCAD. (a) Shanghai residential committees; (b) Shanghai road and transit networks.
Based on the integrated data, the zone-to-zone skim matrices of LOS attributes were generated for all travel modes across five time-of-day periods (before morning peak: 0:00–7:00; morning peak: 7:00–9:00; flat period: 9:00–17:00; evening peak: 17:00–19:00; after evening peak: 19:00–24:00). Major LOS attributes include car in-vehicle time, public transit in-vehicle time, cost, station access/egress distance, initial waiting time, transfer waiting time, transfer walking time, etc. In view of the motor driving characteristics of taxi and carsharing, this study used car in-vehicle time and distance as the in-vehicle time and distance for taxi, and calculated taxi fare matrices according to actual taxi fare pricing rules in Shanghai. Also, car in-vehicle times were used as carsharing in-vehicle times, and then carsharing fare matrices were calculated according to the carsharing unit price in the four hypothetical SP scenarios. The LOS data were then merged into mode choice data according to zone ID and trip beginning time period.
3.3. Sample Description
3.3.1. OD Distribution
Based on the RP data, the spatial distribution of commute ODs in the morning peak period (7:00–9:00 AM) is shown in Figure 4. It shows that the scope of the survey basically covers the whole city of Shanghai, and residential and work locations are most densely distributed in the city center, but sparsely distributed in the suburbs. It is basically in line with the actual population and employment distribution of Shanghai.
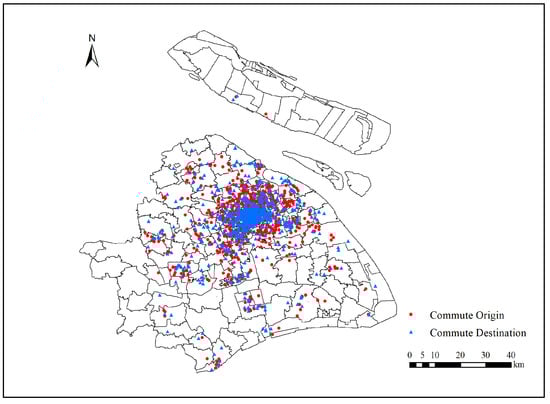
Figure 4.
Spatial distribution of ODs.
3.3.2. Mode Shares and Mode Shifts
Mode shares of six travel modes in RP and mode shifts to carsharing in different SP scenarios are shown in Figure 5. It shows that when the carsharing’s unit price increases, the willingness drops significantly, indicating that commuters are quite sensitive to the price. Taxi commuters are the most willing to shift to carsharing, maybe due to lower carsharing’s fare compared with taxi. Car users are also very willing to shift, probably because if they use carsharing, they do not need to consider the parking space, parking fee, and fuel cost, etc. The shift ratio of bus is also relatively high, maybe due to the long waiting time, slow speed, and discomfort of buses. In contrast, rail and non-motor users are less willing to shift. Probably because the rail has met the commuters’ needs for speed, convenience, and comfort, and carsharing does not show an obvious advantage over non-motor in short-distance commute. The shift ratio of Rail & Bus is lowest, probably because the commute distance is overlong and the cost of using carsharing will be very expensive. Generally speaking, the shift ratio seems over optimistic, probably because it is assumed that the EVCARD stations and vehicles can fully meet the respondents’ demand in the SP scenarios. However, most respondents have not experienced carsharing. In the real situation, there is a case where station parking space cannot be found or no vehicle is available near stations.
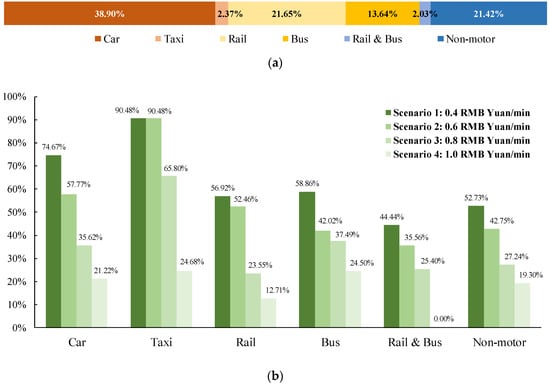
Figure 5.
Mode share and mode shift. (a) Mode shares in RP context; (b) mode shifts in SP scenarios.
3.3.3. Level-of-Service Attributes
Based on zone-to-zone skim matrices and observed commute trip OD pairs, LOS attributes were merged into mode choice data by zone ID (matched by trip OD). The description of LOS attributes is shown in Table 1. In the RP context, in terms of average in-vehicle time, car is close to rail, whereas bus and Rail & Bus rise significantly. It should be pointed out that the time variable is not used as the evaluation standard of public transit station access/egress, but the distance variable. Because travelers can take a variety of modes to get to the public transit stations, such as walking, bicycling, and electric vehicles, which have different travel speeds and different times at the same distance, so the distance variable can ensure a smaller bias. The average rail access distance is slightly longer than the average rail egress distance, possibly due to the denser distribution of rail stations in workplaces than in residential areas. The average bus access and egress distances are both smaller than those of the rail because the bus line and station coverage rate are much greater than that of rail in Shanghai. The average initial waiting time and transfer waiting time of rail are shorter than those of bus and vary much less, indicating that rail system provides a higher service frequency and the distribution is more even among different lines. The average trip distance for non-motor mode is 3.79 km, which is quite close to 4.1 km in the Shanghai transport survey report [45]. In SP contexts, only LOS attributes of the commuters who shift to carsharing are described. The car in-vehicle time multiplied by the carsharing’s unit price of different SP scenarios can get the carsharing fares.

Table 1.
Description of LOS Attributes.
3.3.4. Socioeconomic and Demographic Attributes
Description on socioeconomic and demographic attributes of commuters in the sample are shown in Table 2. Females are slightly more than males. The average age of commuters is about 32 years old, most of them are among 21–50 years old. Personal monthly income is mainly distributed between 4.5 K and 15 K RMB Yuan, with an average value of 10.6 K RMB Yuan. Most commuters have a bachelor’s degree, a full-time job, a driving license, are married, and live with family. Nearly 60% of commuters have a car purchase plan in five years. Their willingness to use carsharing may encourage them to abandon their car purchase plans and shift to carsharing, thus reducing private car ownership. Nearly 85% of commuters have not heard of or never used EVCARD, and less than 3% of them frequently use it, indicating that most residents are not familiar with carsharing. EVCARD still has much room for improvement in advertising and encouraging consumers to experience.
Table 2.
Description of socioeconomic and demographic attributes (N = 887).
4. Empirical Results
4.1. Model Estimation Results
Based on the RP/SP data fusion method, the estimation results of the RP/SP joint model are shown in Table 3. The RP setting involves six commute modes, while the SP setting introduces a new carsharing mode. The explanatory variables and coefficients of the same six modes in the RP and SP models are the same and equal, the carsharing mode contains independent explanatory variables and coefficients. Since the scale parameter, = 1.1114, is statistically significant from 1.0, the RP choice data have different variances in random utilities from the SP choice data. All the selected explanatory variables have significant and expected impacts on mode choice probabilities, and the sign of coefficients reflects positive or negative effects.
Table 3.
Estimated results of joint RP and SP model.
Firstly, the coefficients and impacts of significant variables in the carsharing utility function are discussed in detail below.
- The coefficient of carsharing fare is significantly negative, implying that commuters are not inclined to choose carsharing when the fare increases. Since the carsharing fare is perfectly correlated with its in-vehicle time, the utility function only contains the fare variable with a coefficient of −0.0749. VOT can also be known as how much travelers are willing to pay to reduce travel time, i.e., the value of travel time savings (VTTS). Estimation of VOT can support the policy designs of transport operators and hence make adjustments on prices and levels of service offered. Because the driving characteristics of the carsharing are identical with those of the car, the coefficient of car in-vehicle time, which is −0.0444, can be borrowed to calculate the VOT of carsharing. Thus, the VOT of carsharing is 35.56 RMB Yuan (5.08 US Dollar)/h calculated by the ratio between the coefficients of car in-vehicle time and carsharing fare, which is less than the sample average hourly wage of 61 RMB Yuan (8.71 US Dollar)/h (the average monthly income of the sample is 10.6 K RMB Yuan, and the normal working hours per year is 2080 h) and is within a reasonable range. The result in this paper is consistent with that in Li’s research [47], but smaller than that in De Luca [25]. In the former research in Taiyuan, China, the VOT is 22.0 RMB Yuan (3.14 US Dollar)/h in mid-distance (2–5 km) trip and 81.1 RMB Yuan (11.59 US Dollar)/h in long-distance (more than 5 km) trip. The VOT value in this paper is estimated without distinguishing the distance, thus it is between the two values. In the latter research in Salerno, Italy, the VOT is 10 Euros (11.18 US Dollar)/h. Also, Wang et al. [48] derived a VOT value of 9.06 US Dollar/h for the carsharing service in Seattle. It can be seen that the VOT value varies widely among countries because of different monetary and transportation backgrounds.
- The more companions, the less cost per person shares, the more willing commuters are to use carsharing. Similarly, the coefficients of the number of companions in taxi utility functions is also positive.
- Unlike previous studies in San Francisco [23], Basel, Switzerland [26], Shanghai [33], and Beijing [34], women in this study and studies in Peshawar, Pakistan [49], and Salerno, Italy [25] are found more willing to use carsharing, probably because most commuters in the sample come from families with cars, where men are often main car users. In this case, women may prefer to use carsharing if they want to use a motorized private commute mode.
- The age term and age squared term indicate that the probability of commuters choosing carsharing increases with age and peaks at 26 years old. This is consistent with the results obtained from the studies in London [50], Greece [30], and Shanghai [32,33], that younger people are more willing to accept carsharing. Young people at this age have just started to work and probably cannot afford to buy cars, but they have a high demand for commute mobility. Thus, carsharing becomes a good choice for them. As commuters’ age increases, the probability of choosing carsharing gradually decreases, probably because they can afford to buy cars and need to allocate more expenditure to household consumption.
- Carsharing is more attractive to high-income groups, possibly because they are less sensitive to the cost. The studies in Basel, Switzerland [26], London [50], Puget Sound [27], and Beijing [34] also drew similar conclusions. But the study in Greece [30] showed that carsharing was more appealing to low- and middle-income groups.
- Commuters with infants or preschool children at home are more willing to use carsharing, presumably because they need to pick up spouses or children, and carsharing can meet the needs for travel flexibility and convenience.
- People who have a car purchase plan within one or two years have an urgent need for motorized travel, therefore they prefer to choose carsharing to meet the current travel needs before purchasing vehicles.
- The coefficient of familiarity with EVCARD is positive, and commuters are more willing to use carsharing with the increase of the degree of familiarity. Carsharing operating companies should enhance advertising and consider taking measures to lower the threshold for the first use of carsharing.
- Commuters with Shanghai C licensed cars are restricted to travel only in the suburbs of Shanghai, and commuters with motorcycles are also restricted from traveling on certain roads and areas, and their travel is greatly affected by weather and environment. These two types of commuters prefer to choose carsharing with unrestricted travel privilege and comfortable sheltered environment. Conversely, the ownership of private bicycles may indicate that commuters’ short-distance travel needs have been met, so they are reluctant to spend more and do not need to shift to carsharing.
- Parking space will be scarcer when the population density in origin (O) zone is higher. When the job density in destination (D) zone is higher, it shows that the zone is likely to belong to a commercial district and parking fees will be more expensive. In these cases, commuters are more willing to shift carsharing with exclusive but free parking spaces. Additionally, it was found that carsharing was more attractive to individuals residing in higher-density areas in Le Vine’s [50] and Dias’s [27] researches. Similarly, the coefficient of job density variable in D zone is also negative in the car utility function.
Secondly, the coefficients of LOS variables in utility functions of other modes are explained and compared.
- The coefficient of car’s in-vehicle time is less than that of taxi. They are respectively 2.71 and 2.57 times as much as that of rail and of bus. It indicates that people’s tolerance for car’s in-vehicle time is higher than that of taxi, but significantly smaller than that of public transit. It is probably because drivers need to concentrate on driving and are prone to fatigue, but commuters taking public transit can use smartphones to entertain or relax, which reduces their sensitivity to time.
- Accessibility to public transit stations is an important factor influencing commuters’ public transit choice probability, and long access/egress distance to the station will discourage commuters from choosing public transit.
- The initial waiting time, transfer waiting time, and transfer walking time of bus have a greater negative impact on the probability of commuters choosing bus than in-vehicle time. Because waiting and transferring environment of bus is not comfortable, and commuters are generally in a state of anxious waiting or in a hurry. Similarly, excessive transfers and overlong waiting time of Rail & Bus will reduce the probability of commuters choosing this mode.
- Unlike carsharing and taxi, the higher the number of companions on the commute way, the lower the probability of choosing bus and non-motor modes. It is inconvenient for many people to use bus and non-motor modes together, and the cost or resources required are proportional to the number of their companions in these two modes, unlike in motor vehicles.
Finally, the impacts of different socioeconomic and demographic attributes of other modes are discussed.
- In the car mode, commuters who are between 26 and 35 years old, full-time workers, living with children, tend to use private car most because they need to go home in time to take care of their children or take them to and from school. Thus, they have a high demand for mobility and prefer to commute by car. In addition, the costs of car purchase, fuel consumption, and maintenance are high, it is, therefore, more suitable for the long-term use of high-income groups.
- Women with higher education years and income are more willing to use taxis to commute. They have higher requirements for travel comfort and are insensitive to travel costs.
- Women are more likely to commute by public transit, possibly because men in the family are usually the main user of private cars, and most families in Shanghai own only one private car. Commuters with preschool or schoolchildren are not inclined to choose public transit, presumably because they generally need to pick up their children and private mode is more convenient. Since married people will consider choosing a convenient and time-saving travel mode to take care of family members, they are unwilling to choose Rail & Bus.
- The commuters who are well educated are more willing to use rail. The reason may be that these people usually work in white-collar jobs, and their work places are concentrated in urban or commercial areas being well covered by rail stations. Full-time workers and full-time students are more willing to commute by rail due to time and speed requirements.
- Full-time students (mainly high school and university students) are more likely to use non-motorized travel mode, possibly because they mostly walk to school or live in school.
4.2. Elasticity and Marginal Effect Analysis
Based on the developed model, the key carsharing explanatory variables are selected to calculate the direct/cross elasticities and marginal effects, the results are shown in Table 4. The elasticity of a continuous variable is calculated as the percentage of the probability change in each mode caused by 1% increase in the variable. The marginal effect of a discrete variable is calculated as the probability change in each mode caused by the change of the variable (e.g., the variable “number of companions” increases by one person; for the variable “familiarity with carsharing”, all the commuters are assumed to choose the reference category “has never heard of carsharing” and then shift to choosing the category being evaluated).
Table 4.
Elasticities and marginal effects of selected key carsharing explanatory variables.
The direct elasticity of carsharing fare is −0.660. It means if carsharing fare goes up by 10%, carsharing commuters will decrease by 6.60%. It indicates that carsharing commuters are sensitive to travel expenditures. The cross elasticities of carsharing fare on motor mode and public transit mode are roughly equal (range from 0.414 to 0.487), which implies that when carsharing service is more appealing, the increasing demand mainly comes, not only from motor mode, but also from public transit mode. The higher the personal monthly income, the more willing commuters are to use carsharing, but the direct elasticity is about 42% of that of the carsharing fare, reasonably reflecting commuters’ willingness to purchase the carsharing service with personal income increase, as well as potential demand increase with economic development. When the number of companions increases by one person, the average commute cost decreases for each person, and the probability of commuters’ choosing carsharing increases by 0.0248, whereas this change has little effect on other modes. The probability of commuters choosing carsharing increases by 0.1882 or 0.1324 when they have a car purchase plan within 1 year or 1–2 years compared with those having no car purchase plan. It indicates that car purchase plan is a key factor affecting commuters’ willingness to use carsharing mode. These commuters have relatively urgent demands on travel mobility. The willingness of this group of commuters may result in more use of carsharing and then potentially contributes to a reduction in vehicle ownership. Compared with commuters who have never heard of EVCARD, the commuters who are more familiar with EVCARD have a much higher probability to choose carsharing. In the meanwhile, the familiarity with EVCARD has a great negative impact on the probability of commuters choosing car mode possibly because there is a competition between private car and carsharing.
5. Conclusions and Discussions
Based on the RP & SP data fusion method with a scale adjustment parameter, this paper developed a commute mode choice model in Shanghai to identify influential factors of potential demand of carsharing and quantify their impacts. The sample data were obtained from an RP and SP survey and integrated with LOS attributes derived from road and transit networks. Commute trip information, willingness to use carsharing, and socioeconomic and demographic attributes of commuters were collected from a web-based questionnaire survey. In the SP survey, four hypothetical scenarios were designed based on carsharing’s unit price to collect commuters’ willingness to shift to carsharing. The descriptive analysis showed that taxi users are the most willing to shift to carsharing, followed by car users and bus users, whereas rail and non-motor users shift least.
The results of empirical analysis reveal several meaningful findings for policy making. (1) The estimation results of joint RP/SP model show that the VOT of carsharing is 35.56 RMB Yuan (5.08 US Dollar) per hour. According to the VOT value, carsharing operators make adjustments on prices and levels of service offered, and the government can formulate relevant carsharing charging policies. (2) Carsharing commuters are sensitive to carsharing fare. When carsharing fare goes up by 10%, carsharing commuters will decrease by 6.60%. The roughly equal cross elasticities of carsharing fare on motor mode and public transit mode indicates that the increasing demand mainly comes from both motor and public transit modes. Therefore, the policy measures on private car are in absolute need and should be implemented alongside any carsharing promotion policies [47]. (3) When the number of companions increases, commuters are more willing to use carsharing. Commuters who are women, young people around 26 years old, with higher monthly income, living with infants or preschool children, owning Shanghai C licensed cars or motorcycles, with higher population density or job density in residential district are more likely to use carsharing. Carsharing operators can take corresponding measures to attract target population to register and use this service. (4) Whether commuters have a car purchase plan or not and their familiarity with EVCARD are important factors affecting the probability of choosing carsharing. Advertisement can be enhanced from multiple channels, so as to attract more commuters to use carsharing. In addition, relevant measures can be taken to lower the threshold for the first use of carsharing, such as reducing the amount of deposit, implementing promotional policies, etc.
The RP&SP survey and joint modeling method used in this paper has potential to be applied to investigate potential demand of emerging travel modes, such as e-hailing, taxipooling, bikesharing, customized buses, etc. [37,51,52], in the mobile internet environment. It should be pointed out that the coefficient of the public transit cost is not significant. This may be due to the high correlation between public transit cost and in-vehicle time or the lack of changes in the sample. The market share of a new mode estimated through the SP survey is based on hypothetical scenarios that ignore substantial complicated factors in the real world. Therefore, market changes directly observed in the SP survey need to be treated cautiously. The constant term of the utility function for a new travel mode obtained from SP data often can be greatly biased.
In future studies, additional attempts can be made in the following two respects: (1) In the model application, it is suggested that the Choice-Based Sampling Method [53] can be applied to adjust the constant term of carsharing referring to the market share of existing carsharing operators. (2) Then the adjusted model can be integrated into a citywide travel demand model to forecast the overall demand for carsharing.
Author Contributions
All authors contributed to the research presented in this paper. Conceptualization, Q.D. and X.Y.; methodology, X.Y.; formal analysis, Q.D. and X.Y.; data curation, Q.D. and J.L.; writing—original draft preparation, Q.D.; writing—review and editing, X.Y. and K.W.; funding acquisition, X.Y. All authors have read and agreed to the published version of the manuscript.
Funding
This research is partially supported by the general project “Study on the Mechanism of Travel Pattern Reconstruction in Mobile Internet Environment” (No. 71671129) and the key project “Research on the Theories for Modernization of Urban Transport Governance” (No. 71734004) from the National Natural Science Foundation of China.
Conflicts of Interest
The authors declare no conflict of interest.
References
- Shaheen, S.; Cohen, A.; Farrar, E. Carsharing’s impact and future. Shar. Econ. Relev. Transp. 2019, 4, 87–120. [Google Scholar]
- Shaheen, S.A.; Cohen, A.P. Carsharing and personal vehicle services: Worldwide market developments and emerging trends. Int. J. Sustain. Transp. 2013, 7, 5–34. [Google Scholar] [CrossRef]
- Shaheen, S.; Cohen, A.; Chan, N.; Bansal, A. Sharing Strategies: Carsharing, Shared Micromobility (Bikesharing and Scooter Sharing), Transportation Network Companies, Microtransit, and Other Innovative Mobility Modes. In Transportation, Land Use, and Environmental Planning; Elsevier: Berkeley, CA, USA, 2020; pp. 237–262. [Google Scholar]
- Martin, E.W.; Shaheen, S.A. Greenhouse gas emission impacts of carsharing in North America. IEEE Trans. Intell. Transp. Syst. 2011, 12, 1074–1086. [Google Scholar] [CrossRef]
- Baptista, P.; Melo, S.; Rolim, C. Energy, environmental and mobility impacts of car-sharing systems. Empirical results from Lisbon, Portugal. Procedia-Soc. Behav. Sci. 2014, 111, 28–37. [Google Scholar] [CrossRef]
- Vasconcelos, A.S.; Martinez, L.M.; Correia, G.H.; Guimarães, D.C.; Farias, T.L. Environmental and financial impacts of adopting alternative vehicle technologies and relocation strategies in station-based one-way carsharing: An application in the city of Lisbon, Portugal. Transp. Res. Part D Transp. Environ. 2017, 57, 350–362. [Google Scholar] [CrossRef]
- Chen, T.D.; Kockelman, K.M. Carsharing’s life-cycle impacts on energy use and greenhouse gas emissions. Transp. Res. Part D Transp. Environ. 2016, 47, 276–284. [Google Scholar] [CrossRef]
- Shaheen, S.; Martin, E.; Bansal, A. One-Way Electric Vehicle Carsharing in San Diego: An Exploration of the Behavioral Impacts of Pricing Incentives on Operational Efficiency. Transp. Sustain. 2018. [Google Scholar] [CrossRef]
- Mounce, R.; Nelson, J.D. On the potential for one-way electric vehicle car-sharing in future mobility systems. Transp. Res. Part A Policy Pract. 2019, 120, 17–30. [Google Scholar] [CrossRef]
- Shaheen, S.; Martin, E.; Totte, H. Zero-emission vehicle exposure within US carsharing fleets and impacts on sentiment toward electric-drive vehicles. Transp. Policy 2020, 85, A23–A32. [Google Scholar] [CrossRef]
- Martin, E.; Shaheen, S.; Lidicker, J. Carsharing’s Impact on Household Vehicle Holdings; UCD-ITS-RR-10-05; Institute of Transportation Studies, University of California: Davis, CA, USA, 2010. [Google Scholar]
- Martin, E.; Shaheen, S. Impacts of car2go on Vehicle Ownership, Modal Shift, Vehicle Miles Traveled, and Greenhouse Gas Emissions: An Analysis of Five North American Cities; Transportation Sustainability Research Center, UC Berkeley: Berkeley, CA, USA, 2016; Volume 3. [Google Scholar]
- Nijland, H.; van Meerkerk, J. Mobility and environmental impacts of car sharing in The Netherlands. Environ. Innov. Soc. Transit. 2017, 23, 84–91. [Google Scholar] [CrossRef]
- Kopp, J.; Gerike, R.; Axhausen, K.W. Do sharing people behave differently? An empirical evaluation of the distinctive mobility patterns of free-floating car-sharing members. Transportation 2015, 42, 449–469. [Google Scholar] [CrossRef]
- Martin, E.; Shaheen, S. The impact of carsharing on public transit and non-motorized travel: An exploration of North American carsharing survey data. Energies 2011, 4, 2094–2114. [Google Scholar] [CrossRef]
- Walb, C. Evaluation of the Short-Term Auto Rental (STAR) Service in San Francisco, CA; US Department of Transportation, Urban Mass Transportation Administration: Washington, DC, USA, 1986.
- Shaheen, S.; Chan, N. Mobility and the sharing economy: Potential to facilitate the first-and last-mile public transit connections. Built Environ. 2016, 42, 573–588. [Google Scholar] [CrossRef]
- Zou, Y.; Ash, J.E.; Park, B.-J.; Lord, D.; Wu, L. Empirical Bayes estimates of finite mixture of negative binomial regression models and its application to highway safety. J. Appl. Stat. 2018, 45, 1652–1669. [Google Scholar] [CrossRef]
- Tang, J.; Liang, J.; Han, C.; Li, Z.; Huang, H. Crash injury severity analysis using a two-layer Stacking framework. Accid. Anal. Prev. 2019, 122, 226–238. [Google Scholar] [CrossRef] [PubMed]
- Zou, Y.; Zhong, X.; Tang, J.; Ye, X.; Wu, L.; Ijaz, M.; Wang, Y. A Copula-Based Approach for Accommodating the Underreporting Effect in Wildlife‒Vehicle Crash Analysis. Sustainability 2019, 11, 418. [Google Scholar] [CrossRef]
- Crainic, T.G.; Perboli, G.; Rosano, M. Simulation of intermodal freight transportation systems: A taxonomy. Eur. J. Oper. Res. 2018, 270, 401–418. [Google Scholar] [CrossRef]
- Wu, Z.; Ye, X. Joint modeling analysis of trip-chaining behavior on round-trip commute in the context of Xiamen, China. Transp. Res. Rec. J. Transp. Res. Board 2008, 2076, 62–69. [Google Scholar] [CrossRef]
- Cervero, R.; Creedman, N.; Pai, M.; Pohan, M. City Carshare: Assessment of Short-Term Travel-Behavior Impacts. 2002. Available online: https://escholarship.org/uc/item/7fn8966c (accessed on 14 January 2020).
- Cartenì, A.; Cascetta, E.; de Luca, S. A random utility model for park & carsharing services and the pure preference for electric vehicles. Transp. Policy 2016, 48, 49–59. [Google Scholar]
- De Luca, S.; Di Pace, R. Modelling users’ behaviour in inter-urban carsharing program: A stated preference approach. Transp. Res. Part A Policy Pract. 2015, 71, 59–76. [Google Scholar] [CrossRef]
- Becker, H.; Ciari, F.; Axhausen, K.W. Comparing car-sharing schemes in Switzerland: User groups and usage patterns. Transp. Res. Part A Policy Pract. 2017, 97, 17–29. [Google Scholar] [CrossRef]
- Dias, F.F.; Lavieri, P.S.; Garikapati, V.M.; Astroza, S.; Pendyala, R.M.; Bhat, C.R. A behavioral choice model of the use of car-sharing and ride-sourcing services. Transportation 2017, 44, 1307–1323. [Google Scholar] [CrossRef]
- Prieto, M.; Baltas, G.; Stan, V. Car sharing adoption intention in urban areas: What are the key sociodemographic drivers? Transp. Res. Part A Policy Pract. 2017, 101, 218–227. [Google Scholar] [CrossRef]
- Catalano, M.; Lo Casto, B.; Migliore, M. Car sharing demand estimation and urban transport demand modeling using stated preference techniques. Eur. Transp. 2008, 40, 33–50. [Google Scholar]
- Efthymiou, D.; Antoniou, C.; Waddell, P. Factors affecting the adoption of vehicle sharing systems by young drivers. Transp. Policy 2013, 29, 64–73. [Google Scholar] [CrossRef]
- Chen, X.; Cheng, J.; Ye, J.; Wang, D. Analysis of Carsharing Users and Demand Spatio-Temporal Characteristics. J. Tongji Univ. 2018, 46, 796–803. [Google Scholar]
- Wang, M.; Martin, E.W.; Shaheen, S.A. Carsharing in Shanghai, China: Analysis of Behavioral Response to Local Survey and Potential Competition. Transp. Res. Rec. J. Transp. Res. Board 2012, 2319, 86–95. [Google Scholar] [CrossRef]
- Wang, N.; Yan, R. Research on Consumers’ Use Willingness and Opinions of Electric Vehicle Sharing: An Empirical Study in Shanghai. Sustainability 2016, 8, 7. [Google Scholar] [CrossRef]
- Yoon, T.; Cherry, C.R.; Jones, L.R. One-way and round-trip carsharing: A stated preference experiment in Beijing. Transp. Res. Part D Transp. Environ. 2017, 53, 102–114. [Google Scholar] [CrossRef]
- Majumdar, B.B.; Mitra, S. Valuing factors influencing bicycle route choice using a stated-preference survey. J. Urban Plan. Dev. 2017, 143, 04017001. [Google Scholar] [CrossRef]
- Basu, D.; Maitra, B. Stated preference approach for valuation of travel time displayed as traffic information on a VMS board. J. Urban Plan. Dev. 2009, 136, 214–224. [Google Scholar] [CrossRef]
- Li, D.; Ye, X.; Ma, J. Empirical Analysis of Factors Influencing Potential Demand of Customized Buses in Shanghai, China. J. Urban Plan. Dev. 2019, 145, 05019006. [Google Scholar] [CrossRef]
- Ye, X.; Garikapati, V.M.; You, D.; Pendyala, R.M. A practical method to test the validity of the standard Gumbel distribution in logit-based multinomial choice models of travel behavior. Transp. Res. Part B Methodol. 2017, 106, 173–192. [Google Scholar] [CrossRef]
- Wang, K.; Ye, X.; Pendyala, R.M.; Zou, Y. On the development of a semi-nonparametric generalized multinomial logit model for travel-related choices. PLoS ONE 2017, 12, e0186689. [Google Scholar] [CrossRef] [PubMed]
- Ye, X.; Wang, K.; Zou, Y.; Lord, D. A semi-nonparametric Poisson regression model for analyzing motor vehicle crash data. PLoS ONE 2018, 13, e0197338. [Google Scholar] [CrossRef] [PubMed]
- Morikawa, T.; Ben-Akiva, M.; Yamada, K. Forecasting intercity rail ridership using revealed preference and stated preference data. Transp. Res. Rec. J. Transp. Res. Board 1991, 1328, 30–35. [Google Scholar]
- Zhang, R.; Ye, X.; Wang, K.; Li, D.; Zhu, J. Development of Commute Mode Choice Model by Integrating Actively and Passively Collected Travel Data. Sustainability 2019, 11, 2730. [Google Scholar] [CrossRef]
- Greene, W.H. NLOGIT Version 6 Reference Guide; Econometric Software, Inc.: Plainview, NY, USA, 2016. [Google Scholar]
- Hensher, D.A. Stated preference analysis of travel choices: The state of practice. Transportation 1994, 21, 107–133. [Google Scholar] [CrossRef]
- Fifth Shanghai Comprehensive Transport Survey; Shanghai Urban and Rural Construction and Transportation Development Research Institute: Shanghai, China, 2015.
- Tabulation on the 2010 Population Census of the People’s Republic China. Available online: http://www.stats.gov.cn/tjsj/pcsj/rkpc/6rp/indexch.htm (accessed on 11 July 2019).
- Li, W.; Kamargianni, M. Steering short-term demand for car-sharing: A mode choice and policy impact analysis by trip distance. Transportation 2019, 1–33. [Google Scholar] [CrossRef]
- Wang, X.; MacKenzie, D.; Cui, Z. Complement or Competitior? Comparing car2go and Transit Travel Times, Prices, and Usage Patterns in Seattle. In Proceedings of the Transportation Research Board 96th Annual Meeting, Washington, DC, USA, 8–12 January 2017; p. 17. [Google Scholar]
- Ullah, I.; Liu, K.; Vanduy, T. Examining Travelers’ Acceptance towards Car Sharing Systems—Peshawar City, Pakistan. Sustainability 2019, 11, 808. [Google Scholar] [CrossRef]
- Le Vine, S.; Polak, J. The impact of free-floating carsharing on car ownership: Early-stage findings from London. Transp. Policy 2019, 75, 119–127. [Google Scholar] [CrossRef]
- Zhong, J.; Ye, X.; Wang, K.; Li, D. A Modeling Analysis of Impact from E-Hailing Service on Non-Work Travel Mode in Shanghai, China. Transp. Res. Rec. 2018, 2672, 125–134. [Google Scholar] [CrossRef]
- Ma, C.; He, R.; Zhang, W. Path optimization of taxi carpooling. PLoS ONE 2018, 13, e0203221. [Google Scholar] [CrossRef] [PubMed]
- Manski, C.F.; Lerman, S.R. The Estimation of Choice Probabilities from Choice Based Samples. Econometrica 1977, 45, 1977–1988. [Google Scholar] [CrossRef]


© 2020 by the authors. Licensee MDPI, Basel, Switzerland. This article is an open access article distributed under the terms and conditions of the Creative Commons Attribution (CC BY) license (http://creativecommons.org/licenses/by/4.0/).