Abstract
Natural ventilation through window openings is an inexpensive and effective solution to bring fresh air into internal spaces and improve indoor environmental conditions. This study attempts to address the “indoor air quality–thermal comfort” dilemma of naturally ventilated office buildings in the Mediterranean climate through the effective use of early window design. An experimental method of computational modelling and simulation was applied. The assessments of indoor carbon dioxide (CO2) concentration and adaptive thermal comfort were performed using the British/European standard BS EN 15251:2007. The results indicate that when windows were opened, the first-floor zones were subjected to the highest CO2 levels, especially the north-facing window in the winter and the south-facing window in the summer. For a fully glazed wall, a 10% window opening could provide all the office hours inside category I of CO2 concentration. Such an achievement requires full and quarter window openings in the cases of 10% and 25% window-to-floor ratios (WFR), respectively. The findings of the European adaptive comfort showed that less than 50% of office hours appeared in category III with cross-ventilation. The concluding remarks and recommendations are presented.
1. Introduction
In urban areas, people spend most of their time (nearly 90%) indoors while performing different daily activities, where the concentration of most indoor pollutants is about 20% higher than in the outdoor environment [1]. Therefore, maintaining comfortable and healthy conditions for occupants is one of the major building tasks. Indoor air quality (IAQ) has a significant impact on human health and comfort. Modern lifestyle requires paying more attention to the provision of better thermal comfort and healthier indoor conditions for occupants, while advancements in technology and mechanical systems have created the means of achieving this goal. However, sustainability standards and green building guidelines require less dependence on active strategies to minimise energy consumption, and consequently, reduce buildings’ carbon footprints.
Carbon dioxide (CO2) is one of the most common gases found in our atmosphere. It can be used as a good indicator of human bio-effluent concentration. An indoor CO2 measurement provides a dynamic measure of the balance between carbon dioxide generation in the space, representing occupancy, and the amount of low CO2 concentration in the outside air introduced for ventilation. Air movement has a significant influence on perceived indoor air quality [2]. Researchers claim that the air tightening within an occupied zone of air-conditioned spaces will result in complaints of unsatisfactory indoor air. Field studies suggest that the elevated airspeed within an occupied zone can possibly achieve thermal comfort even at higher temperatures and improve the perceived indoor air quality [3].
In recent studies, the utilization of natural ventilation, as a prevalent and effective passive strategy, to remove indoor pollutants and maintain indoor air quality along with indoor thermal comfort of various building programs is being challenged. The findings of previous studies recommend conflicting objectives and emphasise the need to pursue a more integrative approach to indoor environmental quality by tackling more than one criteria simultaneously [2].
Windows are the main and most popular means in which natural ventilation can be allowed into a building’s indoor spaces. Natural ventilation through windows can be based on pressure difference (also called wind-driven natural ventilation) or thermal difference (in single-sided ventilation or when placing windows or openings at different heights in cross-ventilation) between inside and outside or between the openings [4]. Occupant-controlled windows are considered an effective method for maintaining indoor air quality and thermal comfort conditions. Window-based natural ventilation can replace mechanical ventilation and air condition systems (in free-running buildings or periodically) [5], thus reducing a significant amount of energy consumption and CO2 emissions [6]. Accordingly, window design has a strong relationship with natural ventilation performance in different types of buildings. Window design is an early decision task of architects that requires sufficient knowledge supported by experiments and quantitative data.
Studies confirm that window-based natural ventilation is an inexpensive and practical method to bring fresh air into internal spaces and enhance indoor air quality and thermal comfort [6,7,8,9]. Yet, opening windows in the warm months may result in indoor overheating; consequently, an “indoor air quality-thermal comfort” dilemma exists [10,11,12]. Previous studies have mainly studied natural ventilation performance only in terms of indoor air quality or thermal comfort. This study attempts to address the “indoor air quality-thermal comfort” dilemma of naturally ventilated office buildings in the Mediterranean climate through the effective use of early window design. It examines the potential performance of single-sided and cross-ventilation by investigating different window design scenarios, including window size, orientation, location (different floor levels), and possible opening behaviour (by occupants). Architects unconsciously limit the amount of airflow coming into a building from openings when they choose a particular window size, orientation, and type in the early design stage. Nowadays, for instance, modern office buildings with large glazed walls have limited windows for natural ventilation, or a particular type of windows has a limited opening area, which might reduce ventilation and cooling capabilities of ambient air, especially in naturally ventilated buildings. An adequately designed window can lead to maximising the free-running period—no mechanical systems are used for ventilation and air-conditioning—and thus saving a considerable amount of energy. Therefore, architects need to understand the traces of window design decisions in terms of natural ventilation performance. Accordingly, the outcomes of this research can help architects to make informed choices when they decide on the different parameters related to window design considering both indoor air and thermal conditions, simultaneously, in the early design stage.
2. The Effect of Building Envelope Design on Indoor Environmental Performance
A building envelope separates the indoor spaces from the outdoor environment. It is an external layer of the building that protects the internal environment from harsh environmental conditions and facilitates climate control. Therefore, the climatic design of a building envelope has an impact on its indoor air quality, thermal and visual performance, and energy consumption. In the Mediterranean climate, it is important to limit the amount of heat gain through the design of the building envelope and utilise effective natural ventilation strategies to cool down the internal spaces in the summer months.
Turkish researchers [13] examined the impact of passive solar building components on the energy performance of residential units in Turkey’s different climates. The results revealed that the building aspect ratio has less influence on the total energy demand compared to the window size and insulation materials. Moreover, compact forms and large-size windows are the most preferable combination in the cool climates, while the situation is the total reverse in the warm climates. Based on the concept of passive and non-passive spaces developed by Baker and Steemers [14] and adopted by Steadman et al. [15] for the energy classification of built forms, Ratti et al. define a ‘passive zone’ as one that can successfully be treated using passive strategies [16]. According to empirical observations, a ‘passive zone’ is considered twice the ceiling height. A similar study [17] proved that minimising the building’s shape coefficient reduces heat loss in winter; however, it negatively affects the ‘passive zone’ by reducing the availability of natural ventilation and daylight. Thus, an envelope less exposed to the outside environment increases the energy demand for artificial lighting and ventilation. While the ‘passive zone’ has been considered a better indicator for energy consumption [15], it can consume even more energy compared to the non-passive zone if the glazing is not designed to prevent overheating in the summer and heat loss in the winter.
Moreover, researchers [18] studied various building forms and plan layout designs to access passive strategies in relation to thermal comfort and natural ventilation in a university building. They found that plans longer than 15 m could lower the effect of natural ventilation to provide thermal comfort. Other studies examined the potential of different building forms to reduce solar radiation [19], thermal performance, and energy use [20]. Studies confirmed that room height has a considerable influence on energy demand, such that the energy consumption increases by 1% for each 10 cm increase in ceiling height [21]. Although a reduction in ceiling height offers less exposed surface areas, it can result in higher indoor temperatures and consequently, less thermally comfortable indoor spaces, especially in the warm and hot climates [22]. The building orientation also has a considerable effect on energy consumption and thermal comfort as it is implicated in the levels of solar radiation, daylighting, and air movement [23]. Regardless of building form, buildings arranged longitudinally along the south and north require 10% less energy than those aligned longitudinally along the east and west in a hot and humid climate [20]. A study [24] assessed both IAQ and thermal comfort, as one package, in recently built energy-efficient houses. The findings indicate that in these airtight houses, mechanical ventilation has to be working constantly to maintain indoor environmental conditions. Another study combined objective environmental variables and subjective comfort evaluation to assess indoor air quality and thermal comfort based on Weber/Fechner’s law and Predicted Mean Vote (PMV) [25].
Previous studies focused less on examining the relationships between window design and natural ventilation, as well as the effect of different window design parameters on the indoor CO2 concentration and thermal comfort performance. A larger part of existing research concentrates either on the reduction of energy demand [6,13,26,27] or improving thermal comfort levels by exploring a particular building component [28,29].
Window Design in Relation to CO2 and Thermal Comfort in Naturally Ventilated Buildings
Windows are designed at the early architectural design phase where designers decide on most of the envelope-related elements. These decisions have a significant influence on building performance in terms of indoor air quality, thermal comfort, visual comfort, daylighting, and eventual energy consumption [6,20,30,31]. Different climatic conditions require specific envelope design considerations to achieve an environmentally responsive envelope design. In the Mediterranean climate, there is a need to limit the amount of solar heat gain in the summer and heat loss in the winter, especially through window openings. Besides, window-based natural ventilation can be exploited efficiently to cool down internal spaces in the warm months.
Natural ventilation in buildings mainly occurs through intended envelope openings (e.g., windows or doors) and infiltration (leakage of the building surfaces) as a result of differences in pressure between the inside and outside [32]. In unconditioned spaces, therefore, natural ventilation is the only method to dilute indoor air contaminants, particularly the carbon dioxide exhaled by occupants. There are several strategies for natural ventilation, such as single-flow ventilation, cross-flow ventilation, internal ventilation, and the thermal chimney effect. This study examines single-side and cross-flow ventilation strategies with different window design strategies. Numerous studies have assessed various window parameters in relation to particular building performance objectives or multiple performance criteria. Most countries follow certain building code and design guidelines to specify the window-to-wall ratio (WWR) or window-to-floor area ratio (WFR). The impact of WWR on different building performance goals has been studied more frequently [33,34,35,36,37,38].
Alibaba [39] studied the heat and airflow behaviour of naturally ventilated offices in a Mediterranean climate (i.e., Famagusta, North Cyprus). One aspect of the study was examining the effect of different window-to-wall ratios and window openings on the air change rates (ach) per hour. The maximum ach was achieved when the building had a 100% WWR with fully open windows, whereas the minimum ach was recorded in the case of 10% WWR with a 20% window opening. Mora-Pérez et al. [6] studied natural ventilation design decisions concerning energy efficiency and CO2 emission of a residential building in the Mediterranean region. The authors claimed that the building’s natural ventilation behaviour was improved by 9.7% with a new opening alternative.
Research into the indoor air quality of naturally ventilated high-occupancy research student offices at Beijing University, China [40] investigated the carbon dioxide concentration and indoor climate (i.e., dry-bulb air temperature and relative humidity) during the heating period. The quantitative measurements show that the indoor CO2 level exceeded the threshold of 1000 ppm throughout most of the occupied time each day. The average exposure to CO2 concentration over the threshold was 3.68 h per occupant per day. Therefore, these offices do not meet the IAQ requirements and users tend to suffer health consequences. Laska and Dudkiewicz [41] studied CO2 concentration in a naturally ventilated lecture room at the Wroclaw University of Science and Technology, Poland. The city is characterised by a mild and moderately warm climate. The collected data from field measurements validated a model previously derived for school classrooms [42]. The authors argue that this model is also applicable for calculating the CO2 concentration in auditorium lecture rooms where the occupants are the main source of pollution. The measured values of CO2 concentration were compared to the acceptable level of carbon dioxide defined in the European Standard 13779:2008 and a questionnaire survey based on personal discomfort. The results of this experimental study indicate that during a 90-min lecture, the concentration was within the permissible levels and the occupants were satisfied. However, when the room was fully occupied, the indoor environment failed to provide suitable health conditions. These conclusions indicate that naturally ventilated indoor spaces need to be regularly aired to maintain the comfort conditions and productivity of users.
In the literature survey, researchers mainly depend on CO2 concentration (ppm) as a proper indicator to assess natural ventilation performance [12,30,40,41,42,43] in reference to the 1000 ppm threshold defined by the World Health Organisation (WHO) [44]. In other words, CO2 levels higher than 1000 ppm denote insufficient ventilation. Exceeding this threshold can cause sick building syndrome (SBS) problems for residents, such as headaches and respiratory problems [7,45,46,47,48]. Nevertheless, in naturally ventilated buildings, where occupants have full access to openable windows, minimal indoor CO2 levels might be preferable. Considering that CO2 concentration in the air is about 350–450 ppm, appropriately designed windows and opening portions can reduce the internal CO2 level.
Researchers in Spain [49] investigated the potential of adaptive thermal comfort for existing dwellings in the Mediterranean climate. The authors declared that both EN 15251:2007 and American Society of Heating, Refrigerating, and Air-Conditioning Engineers (ASHRAE) 55-2017 are applicable to the considered conditions and both standards presented comparable results, noting that EN 15251:2007 standard can predict worse conditions than the American model. Other researchers [50] confirm that regional adaptive comfort indicators showed more reliable results than the ASHRAE adaptive model for school buildings in the Mediterranean climate. A similar study in the same country [51] applied adaptive thermal comfort in Mediterranean office buildings. They found that natural ventilation through window openings (manual or mechanical) provided up to 30% more occupancy hours that are comfortable based on the EN 15251:2007 standard, and with window-material improvements, that percentage could be raised to more than 50%.
Salvalai et al. [52] studied the thermal comfort and energy performance of several low-energy cooling concepts for office buildings in six different European climate zones. A series of dynamic simulations were performed based on the PMV (ISO 7730:2005) and adaptive (EN 15251:2007) thermal comfort models. The findings indicate that natural ventilation has a greater potential for the Northern and Central parts of Europe compared to Southern Europe due to the presence of higher ambient air temperatures in the later climate. Even in European climates, solely implementing passive cooling methods has its limitations in terms of achieving thermal comfort. From an architectural perspective, an adequate knowledge on window design and natural ventilation relationship, considering a particular local condition, can guide architects toward selecting an optimum window design that maximises natural ventilation and passive cooling performance [52,53]. Croitoru et al. [54] investigated the thermal comfort of a low energy office building in the temperate climate of Romania. The study compared real-life experimental results with the subjective responses from a questionnaire on the thermal sensation votes. The thermal comfort results placed the free-running building in Category I and Category II of European adaptive comfort (EN 15251:2007).
3. Materials and Methods
An experimental method of computational modelling and simulation techniques was used to collect and analyse numerical data. This study phase encompasses the selection of building performance simulation (BPS) tool, describing features of the hypothetical building case, and identifying performance criteria and assessment methods. Figure 1 illustrates the research methodology flowchart.

Figure 1.
The methodology flowchart.
3.1. Building Performance Simulations (BPS)
Developed by Environmental Design Solutions Limited (EDSL), TAS Engineering software version 9.4.4 [55] is used to conduct the computational thermal simulations and fulfil the aim of the study. TAS Engineering software is a complete solution for the dynamic simulation and thermal analysis of buildings. TAS software is “an industry-leading building modelling and simulation tool capable of performing hourly dynamic thermal simulation for the world’s largest and most complex buildings” [55]. As a complete solution for the thermal simulation of new and existing buildings, the software scope facilitates a methodical workflow. The ‘3D Modeller’ can create building models for simulation and performing daylight analyses. The ‘Building Simulator’ allows for the addition of apertures, internal gains, constructions, and the performance of dynamic simulations. Finally, the ‘Result Viewer’ is for storing, viewing and exporting hourly results in both 2D and 3D.
3.2. Climate Analysis of Famagusta
This study phase of the methodology identifies the contextual climate conditions through comprehensive weather classification and analysis. Although several methods have been introduced by scholars, the Köppen-Geiger Climate Classification [56,57] is considered one of the most reliable and widely used systems for classifying climates. This system divides climates into five main climate groups, with each group further divided based on the monthly and annual averages of precipitation and temperature patterns. According to the Köppen-Geiger Climate Classification system, the five main climate groups are A (tropical), B (arid), C (warm temperate), D (continental), and E (polar).
Based on the Köppen-Geiger Climate Classification, Famagusta’s climate (latitude 35.0° N and longitude 33.0° E) is the Csa (Mediterranean climate), which is characterised by dry and hot summers and rainy, rather changeable, winters. The warm period starts in May and lasts until the end of September. While the cool period is between November and March, April and October are rather moderate months.
The driving forces in natural ventilation are temperature and wind; therefore, the significant factors are the outdoor and indoor conditions that should be considered when studying natural ventilation. On average, July is the warmest month in the year, while the hottest temperature occurs in July and August with a mean daily outdoor temperature of 28 °C. January is the coldest month in the year, for which the average daily outdoor temperature is about 11 °C. The average annual day temperature is 25 °C and the average annual night temperature is 13 °C. Temperatures vary significantly between day and night, which ranges between, approximately, 10 °C in the winter to 12 °C in the summer. Furthermore, December and June represent the most and least humid months of the year with approximately 73% and 64% humidity ratios, respectively. The average annual percentage of relative humidity is about 69%. The city’s dominating winds are from the west, north in winter and west, south in summer. These wind directions may improve the effectiveness of natural ventilation when the windows are aligned with these orientations. For reference, the windiest and calmest days are recorded in February and September with the daily average wind speed of 5.2 m/s and 3.3 m/s, respectively. Table 1 and Table 2 outline the climatic conditions of the study location. Figure 2 shows the wind rose of Famagusta.

Table 1.
Monthly average temperatures and relative humidity based on Famagusta weather data.
Table 2.
Monthly average wind speed and predominant wind directions based on Famagusta weather data.
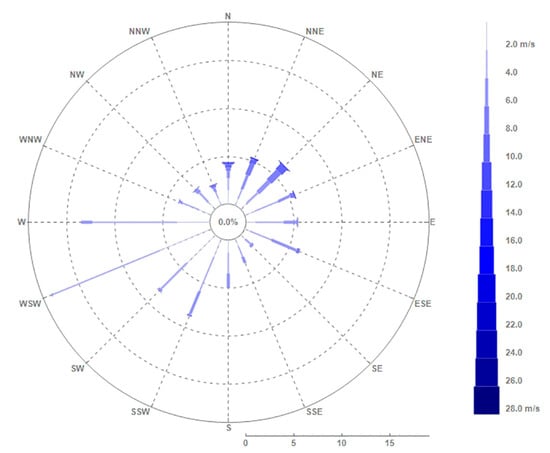
Figure 2.
The wind rose of Famagusta based on its weather file data [55].
3.3. Building Case and Window Design Features
This study targets the early envelope, particularly window, design of office buildings in the Mediterranean climate. To replicate common building designs in the study location and to test different window orientations and floor locations, a hypothetical building was designed as a three-storey office building with four thermal zones on each floor, as presented in Figure 3. Each zone had an area of 50.0 m2 with a 1:1 length-to-width ratio, also called the space aspect ratio (7.1 m × 7.1 m). The height of the ceiling was fixed at 3.0 m as the normal ceiling height recommended by the local building design regulation of the study location [58]. The minimum window-to-floor ratio accepted by the North Cyprus Chamber of Architects is 10% WFR [58]. The other scenarios included 25% and 50% (full glass in this building case). The natural ventilation patterns were single-side ventilation in the cases of 10% and 25% WFR, as well as cross ventilation in the case of 50% WFR. The authors tested various aperture opening scenarios ranging from closed to fully opened windows for the different orientations. It is important to mention that neither external solar shadings nor internal blinds were used to reflect common office design practice or the worst status of windows in response to excessive solar impact. Table 3 presents the considered building and window design parameters as well as different simulation scenarios. Table 4 and Table 5 show the transparent and opaque construction materials and their specifications that are commonly utilised for building construction in North Cyprus.
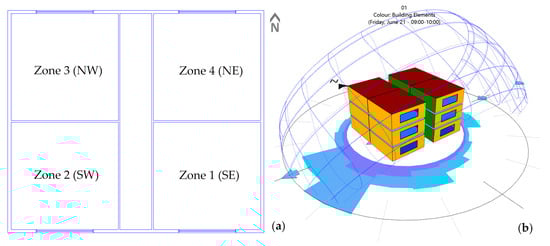
Figure 3.
The office building (a) typical floor plan and (b) three-dimensional (3D) view in the case of a 10% window-to-floor (WFR) ratio with assigned north- and south-facing windows.
Table 3.
Building geometric parameters and various simulation scenarios.
Table 4.
Glazing material properties generated by TAS software [55].
Table 5.
Opaque construction materials and specifications generated by TAS software [55].
3.4. Parameters of Thermal Simulations and Internal Conditions
The internal conditions were set as natural ventilation without any plant. Therefore, there were no active systems running for heating, cooling, or mechanical ventilation. The internal heat gain sources and coefficients are specified based on the TAS system parameters [55], as shown in Table 6. The Chartered Institution of Building Services Engineers (CIBSE) Guide A: Environmental Design [59] benchmark allowances were used to identify the values of internal heat gains, as summarised in Table 7. The metabolic rate was predicted to be 1.2 met of 1.8 m2 Du Bois area of an average adult doing sedentary office work, which indicates a heat release of 126 W/person [60].
Table 6.
The sources of internal heat gains and coefficient limitations based on TAS system parameters [55].
Table 7.
Inputs for internal gains based on the Chartered Institution of Building Services Engineers (CIBSE) Guide A benchmark allowances [55] and American Society of Heating, Refrigerating, and Air-Conditioning Engineers (ASHRAE) fundamentals [57].
To calculate the pollutant (i.e., CO2) generation rate, ASHRAE fundamentals [61] and ASHRAE 62.1 standard [62] suggest that the CO2 generation rate, for an average-sized adult performing sedentary office activities (1.2 met) is 0.0052 L/s (0.312 L/min). Referring to the range of 6 m2 (open office) to 10 m2 (single office) floor area per person required by office design guidelines and recommended area per person [57,61,62,63], each zone was designed to accommodate 6 people. Thus, the total CO2 generation for a single zone will be 2.24 L/h/m2. An amount of 7.5 L/s (15 cfm) per person of outdoor air can, therefore, dilute the polluted air. Natural ventilation through openable windows is the main conduit for the flow of air in and out. According to ‘Tas Theory Manual’ [64], the wind pressure coefficients are defined in a way that the wind pressure on an aperture is:
where is the wind pressure coefficient, is the air density, and is the wind speed at the building height .
All the parameters affecting wind pressure coefficient were based on the metrological weather data of Famagusta, as well as the terrain roughness was set to urban and cities category with terrain-dependent coefficients of exponent () and boundary layer thickness (). Finally, the occupancy schedule was set to weekdays (Monday to Friday) and office working hours only (09:00 to 17:00) for both internal conditions and aperture openings. Therefore, the total working days is 261 days and the total simulated hours is 2088 h. Generated by the North Cyprus metrological office and Famagusta weather station, the weather file data—in the format of TAS weather data (.twd)—of Famagusta was entered, which contains all the geographical data and variables for each hour of a year.
3.5. Performance Criteria and Assessment Methods
Window design and natural ventilation are associated with many aspects of building indoor environmental quality (IEQ). The scope of this study involves an evaluation of the relationship between window design and natural ventilation in terms of CO2 and thermal comfort performance. The following sections describe the assessment methods of these performance criteria.
3.5.1. Assessment of Carbon Dioxide (CO2) Performance
High carbon dioxide concentration indoors can be an indicator of poor air circulation or under-ventilation. An indoor concentration greater than 1000 ppm of CO2 is indicative of a potential indoor air quality problem [44]. CO2 concentration below 1000 ppm usually indicates that the ventilation is adequate to deal with the normal products associated with human occupancy. In addition, the British and European standard BS EN 15251:2007 [65] categorises CO2 levels above the outdoor concentration into four categories, as demonstrated in Table 8.
Table 8.
Building categories according to CO2 levels above outdoor level based on British and European standard BS EN 15251 [65] and BS EN 13779 [66] standards.
Due to the existence of a close relationship between CO2 production and body odour, CO2 level increases or decreases in relation to human metabolic activity. Since CO2 is a good indicator of human metabolic activity, it could also be used as a tracer for other human-emitted bio-effluents. Moreover, CO2 can be used to measure or control any per-person ventilation rate, regardless of the perceived level of bio-effluents or body odour in a given space. In fact, the 1000 ppm guideline for CO2 recommended by the World Health Organisation [44] and used in ANSI/ASHRAE Standard 62.1 [62] is the equilibrium level for 15.0 cfm/person (7.0 L/s), assuming a 400 ppm outside CO2 level. More recently, ANSI/ASHRAE Standard 62.1 indicated that comfort (odour) criteria are likely to be satisfied when the ventilation rate is set so that the 1000 ppm of CO2 threshold is not exceeded [62]. Accordingly, the average duration (hour) of exposure to carbon dioxide concentration more than 1000 ppm per person per day can be measured [40].
3.5.2. Thermal Comfort Assessment Using an Adaptive Model
In the 1970s, an adaptive comfort theory challenged the steady-state comfort theory, which suggested that comfort was time-dependent considering human thermal adaptation (i.e., behavioural, physiological, and psychological) to their environment over time. Thus, the building occupants might accept conditions that would otherwise have been predicted to be unsatisfactory for the PMV model [67], specifically in the hot conditions of naturally ventilated buildings [68]. The model hypothesis is that contextual factors influence building residents’ preferences and thermal expectations [69,70]. The concept of the adaptive comfort model is that outdoor climate impacts indoor comfort as occupants can adapt to different conditions throughout different times of the year. The results of field studies revealed that users of naturally ventilated buildings typically accept a wider range of temperatures than those in air-conditioned buildings as their preferred temperature depends on outdoor conditions [2,71]. The model works efficiently in an environment where the monthly mean temperature stays above 10 °C and below 33.5 °C, which corresponds to the weather conditions of Famagusta, North Cyprus.
Similar to the acceptability limits of 80% and 90% defined by the ASHRAE 55 standard [60], the British and European standard of BS EN 15251:2007 [64] introduced a similar categorisation using Equation (2) while accepting slightly higher degrees than the American standard. It was proposed that an exponentially weighted outdoor running mean temperature could account for this time-dependency. Therefore, the BS EN15251:2007 standard defines the exponentially weighted running mean temperature Trm for any given day through Equation (3), which was originally developed by Nicol and Humphreys [72].
where Tcomf is the indoor comfortable operative temperature (°C) and Trm is the exponentially weighted running mean temperature (°C), α is a constant between 0 and 1 and Tod−1 is yesterday’s daily mean outdoor temperature, the day before (Tod−2), the day before that (Tod−3), and so on.
The temperatures become less significant as time progresses, with the speed of decay depending on the value of the constant α. The lower the value of α, the less significant the weighting of past temperatures. Moreover, the equation’s developers suggested α = 0.8 as an appropriate value according to their SCAT database [72]. Table 9 explains that the standard defines three categories of comfort ranges for different expectations. Moreover, occupants accept temperatures within the comfort ranges as comfortable, and consider temperatures outside of the upper and lower limits too hot and too cold, respectively.
Table 9.
Thermal comfort categories and acceptable ranges based on the European adaptive model [65].
4. Simulation Results and Analysis
The main findings of this study can be divided into two parts. First, the results of the effect of window design and natural ventilation on CO2 concentration are presented and analysed. Second, the results of thermal comfort performance using an adaptive model are provided and analysed, followed by the discussion of main findings and conclusions drawn from the experimental results in the followed sections.
4.1. Effect of Window Design and Natural Ventilation on CO2 Concentration
The measurements of indoor carbon dioxide levels were initiated with a 10% window-to-floor ratio as the minimum window area required by the building guidelines in North Cyprus. The window opening ratios ranged from fully closed to fully opened windows, while the window orientations were south-, east-, north-, and west-facing windows, divided into four thermal zones on each floor. To explore the impact of single-side and cross-flow ventilation, various window sizes (i.e., 10%, 25%, and 50% WFR), openings (i.e., 0%, 10%, 25%, 50%, 75%, and 100%), and different window orientations are applied to all zones in the ground, first, and second floor. Initially, a fully closed (0% open) window corresponds to a situation where neither openable windows nor mechanical ventilation is provided. In the free-running period, however, this is not a practical scenario because window-based natural ventilation might be the only means to modify indoor conditions in terms of air quality and thermal comfort. In air-conditioned buildings, the case represents having no adequate mechanical or mixed-mode ventilation. The CO2 amount of difference for adjacent zones having the same window orientation and design was less than 2 ppm; therefore, the results of the similarly performing zones were excluded.
4.1.1. Results of Single-Sided Natural Ventilation
The indoor carbon dioxide level exceeded the ANSI/ASHRAE 62.1 and WHO recommended threshold (1000 ppm), in all the cases of different window sizes and orientations, when the windows are fully closed. Figure 4 illustrates the percentages of office hours where the CO2 level is below the WHO threshold (1000 ppm) for first floor zones having a 10% WFR with single-side ventilation. Table 10 summarises the number of annual occupancy hours appearing in each CO2 category based on the BS EN 15251:2007 standard. When the 10% (or 25%) window-to-floor ratio is closed at all times, none of the zones provides any office working hours that the CO2 concentration appears under the category I (<750 ppm) and II (750–900 ppm). When the 10% WFR is opened by 10% during occupancy hours (08:00–17:00), considerable improvement can be seen for all window orientations.
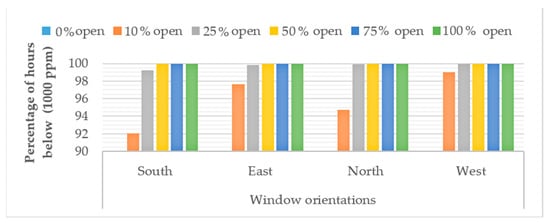
Figure 4.
Percentages of office occupancy hours that the CO2 level is below the WHO threshold (1000 ppm) for first floor windows in the case of a 10% WFR with single-side ventilation.
Table 10.
The number of office occupancy hours appearing in the CO2 categories of BS EN 15251:2007 standard for first floor zones.
When single-side ventilation of a 10% WFR is opened by 10%, the east-facing windows provide more hours within the category I (<750 ppm) for the ground- and second-floor zones, followed by south-facing windows. Zone 1 (SE) had the most efficient natural ventilation performance that dilutes the maximum amount of CO2 and provides 837 and 790 h (out of 2088 annual occupancy hours) of category I through east- and south-facing windows, respectively. Conversely, most of the category II (750–900 ppm) hours can be seen on the second-floor zones, which ranges between 1514–1770 h in zone 9 (south- and east-facing windows) and 1727–1785 h in zone 11 (north- and west-facing windows). In addition, the zones with south- and east-oriented windows have not recorded any hours in either category III or IV on the second floor. These results were also approximately noticed in the eastern and western windows of the ground floor.
Overall, in the cases of single-sided natural ventilation, the west-facing windows provided the maximum number of annual occupancy hours within category II when the 10% WFR is 10% opened, followed by east-facing windows. Moreover, increasing the ratio of window openings (e.g., equal to or greater than 25%) improves the natural ventilation performance of western and eastern windows, while the south-oriented windows become the least effective window orientation. The performance of different window orientations is convergent in the greater opening ratios, such as 75% window opening and onward, with approximately providing all the annual occupancy hours inside category I. The single-side natural ventilation performance of a 10% WFR having 50% of the area opened is similar to a 25% WFR with a 10% window opening. Furthermore, if a 25% WFR is opened by 25%, all the office working hours appear inside Category I.
Figure 5 and Figure 6 demonstrate the level of CO2 concentration in warm and cool periods for different window orientations and opening ratios in the case of single-side ventilation for 25% and 10% WFR, respectively. The findings presented in Figure 4 and Figure 5 explain that ground floor zones have a maximum CO2 level when the windows are fully closed. While, first floor zones have the highest CO2 concentration when the windows are opened by any opening ratios, particularly the south-facing window in the summer (855 ppm) and north-facing window in the winter (845 ppm). The performance of south- and east-facing windows are noticeably higher than north- and west-facing windows on each floor. In the summer months, all the window orientations perform better than the winter period, except south-facing windows, which show the opposite results. A window opening of 25% provided category I for any window orientation, where the range was between 580–685 ppm in both the warm and cool periods. The various window opening ratios for a 25% WFR show an identical pattern to the 10% WFR with the only difference being that a lesser CO2 concentration was achieved.
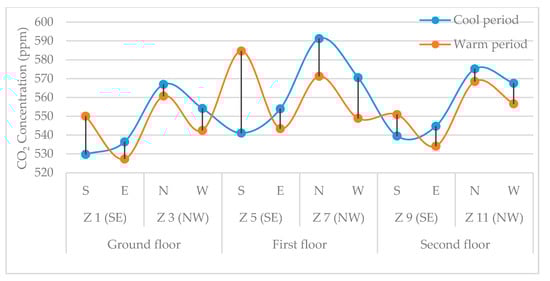
Figure 5.
The CO2 concentration (ppm) in cool and warm months in the case of single-side ventilation with a 25% WFR and 10% opened windows.
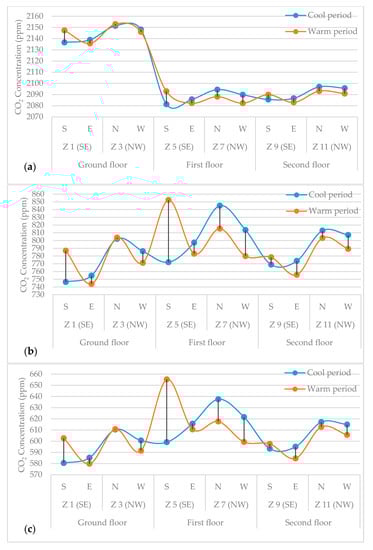
Figure 6.
The CO2 concentration (ppm) in cool and warm months in the case of single-side ventilation with a 10% WFR and (a) closed windows, (b) 10%, and (c) quarter opened windows.
4.1.2. Results of Cross-Flow Natural Ventilation
A cross-flow ventilation strategy was assigned to 10% and 50% (fully glazed wall) WFRs, for which significant improvements can be noticed compared to single-side ventilation scenarios. Table 11 summarises the number of annual occupancy hours appearing in each CO2 category based on the BS EN 15251:2007 standard in the case of cross-ventilation. For a 10% WFR, an opening of 10% can ensure most of the office occupancy hours inside category I and II. This fracture of opening in the case of fully glazed wall offers all the 2088 annual office hours within the category I. This objective can be achieved with 25% window opening in the case of a 10% WFR. Overall, the second floor zones showed better results in its natural ventilation potentials. Taking the second floor as the ideal natural ventilation performance, the most effective window orientations were a combination of the south- and east-facing windows (Zone 9: 1901 h of category I), followed by north- and east-facing windows (Zone 12: 1710 h of category I). However, the least performing window combination for the cross-ventilation method was north- and west-oriented windows (Zone 11: 1487 h of category I).
Table 11.
The number of annual occupancy hours appearing in the CO2 categories based on BS EN 15251:2007 standard in the case of cross-flow ventilation.
Finally, Figure 7 and Figure 8 display the CO2 level in warm and cool months for different zones in the case of cross-flow ventilation for a 10% WFR and fully glazed external wall, respectively. In both window sizes, a 10% window opening can place all the annual occupancy hours inside category I for each zone. Overall, opening 10% of the windows can lower the CO2 level to under 720 ppm for a 10% WFR and 470 ppm for a fully glazed wall in both winter and summer. In the cool and warm periods, second floor zones record less CO2 concentration than first and ground floor. Noticeably, the zones with a combination of south and east windows for cross ventilation are more effective than any other window orientations in both the summer and winter months. However, the zones with cross-flow ventilation from the north- and west-facing windows perform less well than other window orientations, particularly in the warm period. Nevertheless, in the cool period, window combinations for cross ventilation show similar results, except a combination of south and east window, which recorded lower CO2 levels.
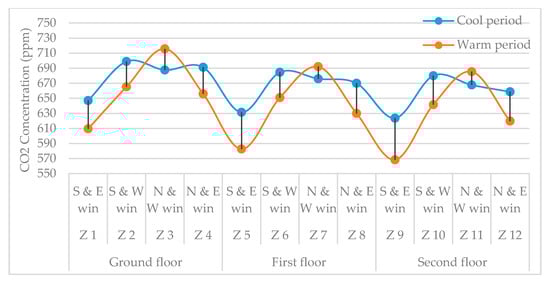
Figure 7.
The CO2 concentration (ppm) in cool and warm months in the case of cross-flow ventilation with a 10% WFR and 10% opened windows.
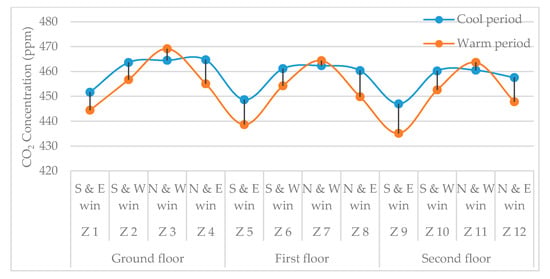
Figure 8.
The CO2 concentration (ppm) in cool and warm months in the case of cross-flow ventilation with a 50% WFR and 10% opened windows.
4.2. Results of Adaptive Thermal Comfort
4.2.1. Findings of Single-Sided Natural Ventilation Using an Adaptive Model
The results of single-side natural ventilation show that when the zones are assigned the minimum window-to-floor ratio (10%), different performances can be noticed with respect to various window orientations, opening ratios, and floor locations, as reported in Table 12. Firstly, in the case of fully closed windows, the zones provide minimal hours that are comfortable based on the adaptive comfort categories of the BS EN 15251:2007 standard, noting second-floor zones perform better compared to the first floor and ground floor zones, respectively. When a 10% window area was opened, the south-facing windows produce more thermally uncomfortable indoor environments than the other window orientations, followed by eastern windows. Conversely, north- and west-facing windows provide more hours of adaptive comfort, respectively.
Table 12.
The number of comfort hours for adaptive model categories based on BS EN 15251:2007 standard in the case of 10% WFR with single-side ventilation.
Nevertheless, the results of the quarter, half, three-quarter, and full window openings display contradictory window and natural ventilation performances compared to previous scenarios. When a quarter of the 10% WFR was opened, south-facing windows on the second floor achieved the highest number of thermal comfort hours inside Category I and II of the European adaptive comfort model, specifically 611 and 858 h, respectively, out of 2088 annual office working hours. While the other window orientations provided a convergent number of comfortable hours on this floor, which ranged between 555 to 573 h in Category I and 783 to 807 in Category II, it is worth mentioning that the east window represents the least efficient case. On the other hand, southern windows are less effective on the ground and first floors when only a quarter of the window area is opened during office working hours. West- and north-facing windows offer more hours that are comfortable than eastern windows.
In contrast to the 10% and 25% window openings, the southern and eastern windows can perform better than west- and north-facing windows if half, three-quarter, or the full area of the windows is kept open during office hours, regardless of whether it is located on the ground, first, or the second floor. Moreover, through this particular opening ratio, ground floor windows are more efficient than the first- and second-floor windows for all window orientations. Opening 50% of the southern window in zone 1 (SE) provides 918 and 1045 h, zone 5 (SE) contributes to 825 and 987 h, and zone 9 (SE) allocates 803 and 985 h in category I and category II of the adaptive model, respectively.
In the case of a 25% window-to-floor ratio, as presented in Table 13, north- and east-oriented windows performed slightly better only when 10% of the window area was open, compared to the same scenario of 10% WFR. Conversely, northern and western window orientations presented a less effective performance in all window-opening ratios on each floor location. In contrast to the 10% WFR case, increasing the opened portion for south- and east-facing windows offer more hours in category I and II on each floor. The other window orientations reduce their efficiency with a larger window opening area regardless of the floor location. Overall, the order of most and least efficient window orientations is almost the same as to the 10% WFR. Figure 9 and Figure 10 illustrate the effect of window design on the thermal comfort performance of a naturally ventilated office building during cool and warm periods. Both 10% and 25% window-to-floor ratios manifest comparable results with the domination of too warm percentages in the summer months nearly in all window-opening ratios. By looking at a 10% window opening in both the window sizes, one can notice that approximately all window orientations are considered too warm during the summer months. Furthermore, in the cool period, south-facing windows represent the worst scenarios when the windows are closed, particularly on the ground and the first floor, with comfort around only 30% of the time, while 70% is considered too warm as a reason of overheating, mostly by internal gains, as well as solar radiation. A 10% window opening offers the least amount of hours that are considered comfortable according to category III of the European adaptive model, which is less than 10% during the warm period. Nevertheless, a slightly better performance can be seen in the case of 25% WFR.
Table 13.
The number of comfort hours for adaptive model categories based on BS EN 15251:2007 standard in the case of 25% WFR with single-side ventilation.
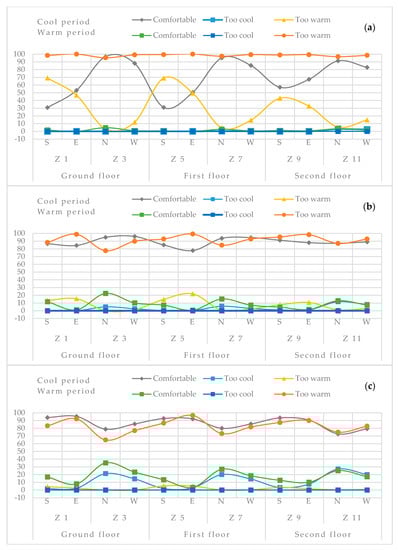
Figure 9.
Percentages of thermal sensation in cool and warm months based on category III of the European adaptive model in the case of a 10% WFR for (a) 10%, (b) quarter, and (c) half-opened windows.
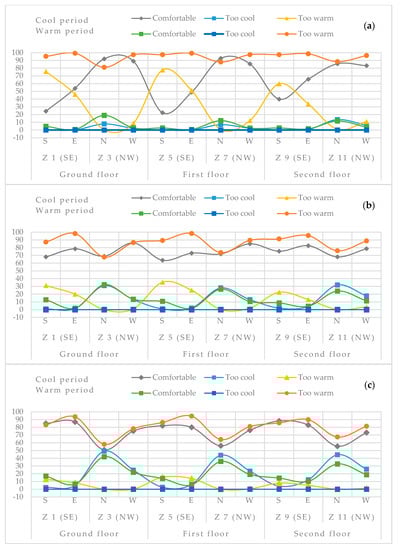
Figure 10.
Percentages of thermal sensation in cool and warm months based on category III of the European adaptive model in the case of a 25% WFR for (a) 10%, (b) quarter, and (c) half-opened windows.
When opening quarter of the window area, nearly all window orientations perform better than the 10% window opening in both seasons, noting that the eastern windows are less effective than other window directions. The case of 25% WFR slightly improves thermal performance in the warm period but reduces the number of acceptable hours in the winter through the increase in cooler sensations. The half window opening enhances indoor thermal comfort in the warm period while simultaneously decreasing the number of hours that appear in the acceptable range of category III of adaptive comfort.
4.2.2. Findings of Cross-Flow Natural Ventilation Using Adaptive Model
Table 14 and Table 15 outline the number of office occupancy hours appearing in the European adaptive comfort categories in the case of 10% and 50% WFR with cross-ventilation. In the case of a fully glazed external wall, cross-ventilation improves indoor thermal comfort when increasing window opening ratios. When opening 10% of the window area, the zones that have a window combination of the north- and west-facing windows for the 10% WFR and east-facing windows for the fully glazed wall display better results. Conversely, increasing the window opening from 25% to 100% can gradually provide a greater number of comfortable hours for the zones with a window combination of the south- and east-oriented windows and a 10% WFR as well as south- and west-facing windows for the fully glazed wall. Such increments in window opening confirm that cross ventilation form north- and west-oriented windows have the least efficient natural ventilation performance compared to other window orientations in any window size and opening ratio.
Table 14.
The number of comfort hours for adaptive model categories based on BS EN 15251:2007 standard in the case of 10% WFR with cross-ventilation strategy.
Table 15.
The number of comfort hours for adaptive model categories based on BS EN 15251:2007 standard in the case of 50% WFR with cross-ventilation strategy.
Cross ventilation through a 10% WFR with various window orientations, openings, and floor locations are presented in Figure 11. First, a 10% window opening is least effective in the overheating period but performs better than other scenarios in the winter months. About 30% to 40% of the occupancy hours were thermally acceptable when a half area of the window was opened in the warm period. Fully opened windows raise this percentage, with 50% of the office occupancy time being comfortable. In general, having cross ventilation through a combination of the north- and west-facing windows is the most effective case in the warm period, in nearly all opening scenarios. Although this situation could also be observed in the cool period if only 10% of the window area is opened. A scenario of having cross ventilation from the south- and east-oriented windows performed better in the winter months and at opening ratios larger than 10%.
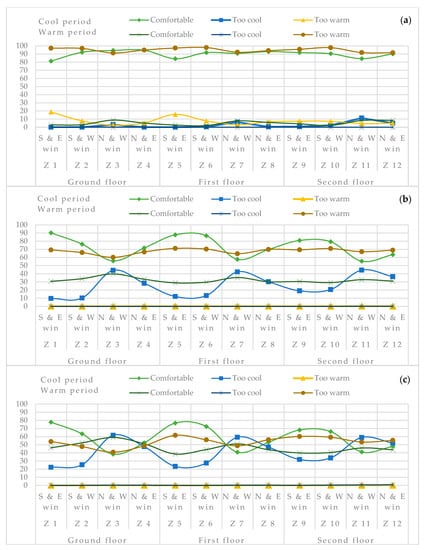
Figure 11.
Percentages of thermal sensation in cool and warm months based on category III of the European adaptive model in the case of a 10% WFR with cross-ventilation for (a) 10%, (b) half, and (c) fully opened windows.
The sun’s intense rays reduced the effectiveness of cross-ventilation in the case of fully glazed external windows, as illustrated in Figure 12. Unshaded large glass surfaces can receive a significant amount of harmful solar radiation, which results in space overheating in the summer months. It was observed that a 10% window opening led to more than 50% too warm condition even in the winter for the windows that receive a greater amount of solar radiation (i.e., south- and east-oriented). Despite the fact that greater window openings can cool down the indoor temperature, the too cool condition raises in the zones with the north-and west-facing windows when the windows are kept open during the occupancy hours in the cool period. The occurrences of zone overheating stayed similar to testing various window-opening scenarios. Therefore, protecting windows or solar control is highly recommended if better thermal comfort conditions are desired in naturally ventilated office buildings in the Mediterranean climate.
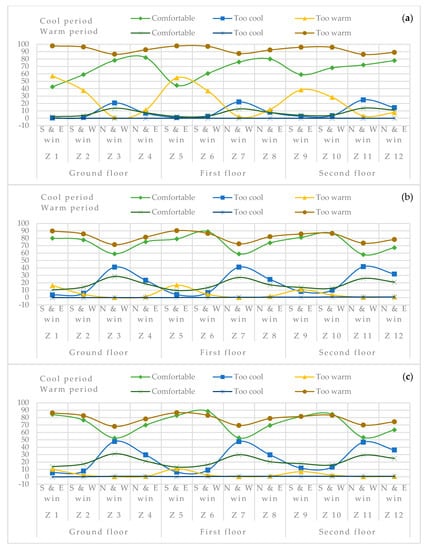
Figure 12.
Percentages of thermal sensation in cool and warm months based on category III of the European adaptive model in the case of a fully glazed wall with cross-ventilation for (a) 10%, (b) half, and (c) fully opened windows.
5. Discussion and Concluding Remarks
5.1. Window and Natural Ventilation Performance in Terms of “Indoor CO2 Level and Thermal Comfort”
Opening a window is a common and simple way of using natural ventilation to provide fresh air and cool the internal spaces of a building, but the airflow that occurs in this process is rather complicated due to the involvement of several parameters. The level of airspeed, wind direction, the temperature difference between inside and outside, pressure variations, and turbulence characteristics determine the amount of air coming through the openings. From an architectural point of view, the amount of airflow also depends on the size, orientation, location, fracture of opening, and type of window. Single-sided natural ventilation can become more complex compared to cross-flows by reason of involving both wind and thermal effects at the same time. In single-sided ventilation, the airflow through openings is mainly driven by the turbulence in the wind, in which space blocks the prevailing wind [4].
The results of this study indicate that, in the case of closed windows of any window size, location, or orientation, an average CO2 concentration exceeding 2000 ppm can lead to various symptoms, and occupants are more likely to complain of headache, fatigue, and tiredness. In the free-running period, the window opening is a fundamental method of ventilation and air conditioning; thus, occupants use windows and other physiological adaptation mechanisms to maintain indoor air and thermal conditions. Therefore, closing windows is not acceptable neither for indoor air nor for thermal comfort conditions, even in the winter months. Moreover, in all the window orientations, first-floor zones recorded the worst ventilation performance in terms of CO2 contamination as a reason for occurrence possible wind turbulence.
Table 16 presents the most and least effective window orientations, in terms of providing a maximum number of hours within category I CO2 concentration based on the BS EN 15251:2007 standard, against different ventilation strategies, window sizes, and opening ratios. In the case of single-sided ventilation, the west- and east-facing windows provided more hours inside category I and II, while the south-facing windows represented the least effective orientation. These findings comply with the predominant wind directions and air velocity in Famagusta, presented in Section 3.2. A 10% WFR needs to be fully opened to provide all the occupancy hours inside category I, while for a 25% WFR, any window orientation having an opening ratio ranging between 25% to fully opened widows can ensure category I of the CO2 concentration for the 2088 occupancy hours. Cross-ventilation scenarios are more efficient in terms of allowing a greater amount of airflow to pass through openings. Cross-flow by a window combination of the south- and east-facing windows is the most effective case. Conversely, the north- and west-oriented windows offer the least effective cross-ventilation scenario.
Table 16.
The most and least effective window orientations for providing a maximum number of acceptable hours based on the CO2 concentration category I (BS EN 15251:2007).
Table 17 outlines the most and least effective window orientations, in terms of providing a maximum number of acceptable hours according to the European adaptive comfort categories, against different ventilation strategies, window sizes, and opening ratios. In the case of small windows, the least amount of airflow cannot overcome the overheating problem caused by internal gains and direct solar radiation. Therefore, northern windows (in the case of single-side ventilation) as well as north- and west/east-facing windows (in the case of cross-ventilation) provide more acceptable hours of the European adaptive comfort categories due to their receiving a lesser amount of solar radiation. The southern windows (in the case of single-side ventilation) as well as a combination of the south- and east-facing windows (in the case of cross-ventilation) present less effective scenarios. Nevertheless, larger window sizes and opening ratios allow a greater amount of fresh air, from the predominant wind directions of the study location, to enter and cool the spaces; thus, southern windows, as well as south- and east/west-facing windows, turn out to be more effective window orientations.
Table 17.
The most and least effective window orientations for providing a maximum number of acceptable hours based on the European adaptive comfort (BS EN 15251:2007).
In general, northwest zones performed better compared to southeast zones on all the floors. Referring to a previous study [5], one interpretation for this situation might be the lesser amount of solar radiation received by those zones due to unshaded windows and inappropriate window material. When a zone has a north-facing window, a greater number of comfortable hours can be achieved. West-oriented windows come in at the second position, followed by the east- and south-oriented windows, respectively. Owing to the fact that unshaded south windows can result in the overheating of internal spaces, one can perceive that in the cases of closed and 10% opened windows, the south-facing windows produce thermally uncomfortable indoor environments. In these cases, the amount of airflow from natural ventilation cannot confront the elevated temperature from external and internal gains. Therefore, the zones with south-oriented windows can have minimal comfortable hours based on adaptive comfort categories.
However, it was observed that three-quarter and full window openings result in a less effective window and natural ventilation relationship in terms of thermal comfort performance compared to quarter and half window openings. This is because larger opening portions can increase the risk of overheating and overcooling on the indoor environment due to the extreme outdoor conditions in both summer and winter periods. Furthermore, larger window areas and opening ratios allow a greater amount of airflow from natural ventilation, while this does not guarantee improved indoor thermal conditions. A larger window area contributes to more heat gain and loss if a suitable window material is not selected or the window area is not protected from direct sun radiation. In contrast to the 10% WFR case, increasing the opened portion for south- and east-facing windows offer more hours in category I and II on each floor. The other window orientations reduce their efficiency with a larger window opening area regardless of the floor location. In the case of a fully glazed external wall, cross-ventilation improves indoor thermal comfort when increasing window-opening ratios.
5.2. Concluding Remarks and Recommendations
In the Mediterranean climate, window-based natural ventilation has a significant potential to improve indoor environmental conditions in free-running period. Therefore, the effectiveness of natural ventilation is extremely associated with early window design and post-occupancy user behaviour. In naturally ventilated buildings, indoor air quality and thermal comfort have a close correlation with each other, thus an “indoor air quality–thermal comfort” dilemma exists. This study examined the relationship between window design and natural ventilation performance in the Mediterranean office buildings in terms of the level of CO2 concentration and thermal comfort condition. The study applied an experimental method of computational modelling and simulation utilising TAS Engineering software to perform dynamic thermal simulations. The building was designed as a three-storey office building with four thermal zones on each floor, while different window sizes, orientations, and opening scenarios were studied for both single-side and cross-ventilation strategies. Carbon dioxide concentration categories and the adaptive comfort model were determined and assessed based on the BS EN 15251:2007 standard. The study was limited to a three-storey office building, a floor layout with a 1:1 aspect ratio, common materials in envelope construction of the study location, unshaded windows (neither from external nor from internal sides), and a high-occupancy office. Therefore, it presents the following concluding remarks:
- Closed windows for any window size, orientation and location cannot provide any office working hours that the CO2 concentration appears under category I and II according to the BS EN 15251: 2007 standard. In addition, the CO2 level exceeds the recommended threshold (1000 ppm); it also reaches 2000 ppm, for which occupants may suffer from sick building syndrome (SBS).
- In the free-running period, a window opening is the main method of ventilation and cooling, thus occupants use windows as well as other physiological adaptation mechanisms to maintain indoor air and thermal conditions. Therefore, closing windows is not acceptable, neither for indoor air nor for thermal comfort conditions, even in the winter months.
- Natural ventilation performance depends on the direction of the wind, air velocity, and the turbulence characteristics of the wind.
- From an architectural point of view, window design, including various parameters, highly effects natural ventilation performance. Thus, architects should study and understand the relationship between window design and natural ventilation in a particular climatic condition, to help them make informed decisions in the early design stage.
- Cross-ventilation scenarios are more efficient in terms of allowing a greater amount of airflow to pass through openings. Cross-flow by a window combination of the south- and east-facing windows is the most effective case. Conversely, the north- and west-oriented windows offer the least effective cross-ventilation scenario.
- Despite the existence of a cross-ventilation strategy, the sun’s harmful rays could reduce the potential of this effective passive strategy. It was observed that larger window sizes and opening ratios could decrease the effectiveness of window and natural ventilation due to the extreme outdoor weather conditions in both the summer and winter months.
- Overall, the results of unshaded windows of this study indicate that single-sided ventilation through a small window size (i.e., 10% WFR) with half to fully opened area can be more effective than larger window sizes of the same ventilation strategy, and even more effective than cross-ventilation of various window designs in adjacent walls.
- Floor location has its effect on the window and natural ventilation performance in a way that the windows of the higher floor zones are more effective than those in the lower floors do.
- Natural ventilation performance decreases in the first-floor zones, showing higher carbon dioxide levels, namely for the south-facing window in the summer and north-facing window in the winter.
- Natural ventilation performance shows less efficient in terms of diluting CO2 contaminant in the cool period compared to the warm period.
- Unshaded windows, even with the most effective design and ventilation strategy, can only provide 50% to 60% of the office occupancy time as thermally acceptable for adaptive thermal comfort.
- To adopt passive design strategies effectively in the Mediterranean climatic, it is important to consider every building envelope element, such as the optimal window design attributes, window-to-floor area, window type, appropriate glazing materials, window orientation, and the required shading ratios to improve indoor thermal comfort and reduce CO2 levels. More studies are required to address conflicting performance criteria simultaneously in naturally ventilated office buildings.
- A performance-based window design model can guide architects toward making knowledge-based and informed-decisions in the early architectural design stages.
Author Contributions
H.K.A. and H.Z.A. conceived and designed the concept and outline for the article; H.K.A. performed the experiments, simulations, and wrote the manuscript; H.Z.A. supervised, provided sources, comments, and suggestions for the paper. All authors have read and agreed to the published version of the manuscript.
Funding
This research received no external funding.
Conflicts of Interest
The authors declare no conflict of interest.
References
- Lai, H.K.; Kendall, M.; Ferrier, H.; Lindup, I.; Alm, S.; Hänninen, O.; Jantunen, M.; Mathys, P.; Colvile, R.; Ashmore, M.R.; et al. Personal Exposures and Microenvironment Concentrations of PM2.5, VOC, NO2 and CO in Oxford, UK. Atmos. Environ. 2004, 38, 6399–6410. [Google Scholar] [CrossRef]
- DeDear, R.J.; Brager, G.S. Thermal Comfort in Naturally Ventilated Buildings: Revisions to ASHRAE Standard 55. Energy Build. 2002, 34, 549–561. [Google Scholar] [CrossRef]
- Fang, L.; Wargocki, P.; Witterseh, T.; Clausen, G.; Fanger, P.O. Field Study on the Impact of Temperature, Humidity and Ventilation on Perceived Air Quality. In Proceedings of the Indoor Air Quality and Climate, Edinburgh, Scotland, 8–13 August 1999; pp. 107–112. [Google Scholar]
- Larsen, T.S.; Heiselberg, P. Single-sided natural ventilation driven by wind pressure and temperature difference. Energy Build. 2008, 40, 1031–1040. [Google Scholar] [CrossRef]
- Abdullah, H.K.; Alibaba, H.Z. Towards Nearly Zero-Energy Buildings: The Potential of Photovoltaic-Integrated Shading Devices to Achieve Autonomous Solar Electricity and Acceptable Thermal Comfort in Naturally ventilated Office Spaces. In Proceedings of the 16th International Conference on Clean Energy, Famagusta, North Cyprus, 9–11 May 2018; pp. 1–11. [Google Scholar]
- Mora-pérez, M.; Guillen-guillamón, I.; López-patiño, G.; López-jiménez, P.A. Natural Ventilation Building Design Approach in Mediterranean Regions—A Case Study at the Valencian Coastal Regional Scale (Spain). Sustainability 2016, 8, 855. [Google Scholar] [CrossRef]
- Wong, N.H.; Huang, B. Comparative Study of the Indoor Air Quality of Naturally Ventilated and Air-Conditioned Bedrooms of Residential Buildings in Singapore. Build. Environ. 2004, 39, 1115–1123. [Google Scholar] [CrossRef]
- Omrani, S.; Garcia-Hansen, V.; Capra, B.R.; Drogemuller, R. On the Effect of Provision of Balconies on Natural Ventilation and Thermal Comfort in High-Rise Residential Buildings. Build. Environ. 2017, 123, 504–516. [Google Scholar] [CrossRef]
- Taylor, P.; Liping, W.; Hien, W.N. Applying Natural Ventilation for Thermal Comfort in Residential Buildings in Singapore. Archit. Sci. Rev. 2011, 50, 224–233. [Google Scholar] [CrossRef]
- Dascalaki, E.G.; Sermpetzoglou, V.G. Energy Performance and Indoor Environmental Quality in Hellenic Schools. Energy Build. 2011, 43, 718–727. [Google Scholar] [CrossRef]
- Sharmin, T.; Gül, M.; Li, X.; Ganev, V.; Nikolaidis, I.; Al-Hussein, M. Monitoring Building Energy Consumption, Thermal Performance, and Indoor Air Quality in a Cold Climate Region. Sustain. Cities Soc. 2014, 13, 57–68. [Google Scholar] [CrossRef]
- Lei, Z.; Liu, C.; Wang, L.; Li, N. Effect of Natural Ventilation on Indoor Air Quality and Thermal Comfort in Dormitory during Winter. Build. Environ. 2017, 125, 240–247. [Google Scholar] [CrossRef]
- Inanici, M.N.; Demirbilek, F.N. Thermal Performance Optimization of Building Aspect Ratio and South Window Size in Five Cities Having Different Climatic Characteristics of Turkey. Build. Environ. 2000, 35, 41–52. [Google Scholar] [CrossRef]
- Baker, N.; Steemers, K. Energy and Environment in Architecture; Taylor & Francis: London, UK, 2003. [Google Scholar]
- Steadman, P.; Bruhns, H.R.; Holtier, S.; Gakovic, B. A Classification of Built Forms. Environ. Plan. B Urban Anal. City Sci. 2000, 27, 73–91. [Google Scholar] [CrossRef]
- Ratti, C.; Baker, N.; Steemers, K. Energy Consumption and Urban Texture. Energy Build. 2005, 37, 762–776. [Google Scholar] [CrossRef]
- Lin, M.; Pan, Y.; Long, W.; Chen, W. Influence of Building Shape Coefficient on Energy Consumption of Office Buildings in Hot-Summer-and-Cold-Winter Area of China. Build. Energy Effic. 2015, 10, 728–735. [Google Scholar]
- St. Clair, P.; Hyde, R. Towards a New Model for Climate Responsive Design at the University of the Sunshine Coast Chancellery. J. Green Build. 2010, 4, 3–20. [Google Scholar] [CrossRef]
- Chua, K.J.; Chou, S.K. Energy Performance of Residential Buildings in Singapore. Energy 2010, 35, 667–678. [Google Scholar] [CrossRef]
- Mirrahimi, S.; Mohamed, M.F.; Haw, L.C.; Ibrahim, N.L.N.; Yusoff, W.F.M.; Aflaki, A. The Effect of Building Envelope on the Thermal Comfort and Energy Saving for High-Rise Buildings in Hot-Humid Climate. Renew. Sustain. Energy Rev. 2016, 53, 1508–1519. [Google Scholar] [CrossRef]
- Ghafari, F.; Mirrahimi, S.Z.; Heidari, S. Influence of Ceiling Height on Heating Energy Consumption in Educational Building. In Proceedings of the 15th International Conference on Civil and Architecture Engineering, Pattaya, Thailand, 25–26 April 2018; pp. 1–7. [Google Scholar]
- Guimarães, R.P.; Carvalho, M.C.R.; Santos, F.A. The Influence of Ceiling Height in Thermal Comfort of Buildings: A Case Study in Belo Horizonte, Brazil. Int. J. Hous. Sci. 2013, 37, 75–85. [Google Scholar]
- Ralegaonkar, R.V.; Gupta, R. Review of Intelligent Building Construction: A Passive Solar Architecture Approach. Renew. Sustain. Energy Rev. 2010, 14, 2238–2242. [Google Scholar] [CrossRef]
- Mickaël, D.; Bruno, B.; Valérie, C.; Murielle, L.; Cécile, P.; Jacques, R.; Severine, K. Indoor Air Quality and Comfort in Seven Newly Built, Energy-Efficient Houses in France. Build. Environ. 2014, 72, 173–187. [Google Scholar] [CrossRef]
- Zhu, C.; Li, N. Study on Indoor Air Quality Evaluation Index Based on Comfort Evaluation Experiment. Procedia Eng. 2017, 205, 2246–2253. [Google Scholar] [CrossRef]
- Wang, J.; Li, J. Bio-Inspired Kinetic Envelopes for Building Energy Efficiency Based on Parametric Design of Building Information Modeling. In Proceedings of the 2010 Asia-Pacific Power Energy Engineering Conference (APPEEC), Chengdu, China, 28–31 March 2010; pp. 1–4. [Google Scholar]
- Abdullah, H.K.; Alibaba, H.Z. Retrofits for Energy Efficient Office Buildings: Integration of Optimized Photovoltaics in the Form of Responsive Shading Devices. Sustainability 2017, 9, 2096. [Google Scholar] [CrossRef]
- Alibaba, H.Z.; Ozdeniz, M.B. Energy Performance and Thermal Comfort of Double-Skin and Single-Skin Facades in Warm-Climate Offices. J. Asian Archit. Build. Eng. 2016, 15, 635–642. [Google Scholar] [CrossRef]
- Al-Tamimi, N.A.M.; Fadzil, S.F.S.; Harun, W.M.W. The Effects of Orientation, Ventilation, and Varied WWR on the Thermal Performance of Residential Rooms in the Tropics. J. Sustain. Dev. 2011, 4, 142–149. [Google Scholar] [CrossRef]
- Stabile, L.; Dell’Isola, M.; Russi, A.; Massimo, A.; Buonanno, G. The Effect of Natural Ventilation Strategy on Indoor Air Quality in Schools. Sci. Total Environ. 2017, 595, 894–902. [Google Scholar] [CrossRef]
- Costanzo, V.; Evola, G.; Marletta, L. A Review of Daylighting Strategies in Schools: State of the Art and Expected Future Trends. Buildings 2017, 7, 41. [Google Scholar] [CrossRef]
- International Organization for Standardization. EN ISO 16814—Building Environment Design—Indoor Air Quality—Methods of Expressing the Quality of Indoor Air for Human Occupancy; International Organization for Standardization: Geneva, Switzerland, 2008. [Google Scholar]
- Fadzil, S.F.S.; Abdullah, A.; Harun, W.M.W. The Impact of Varied Orientation and Wall Window Ratio (WWR) To Daylight Distribution in Residental Rooms. In Proceedings of the International Symposium on Construction in Developing Economies: Commonalities among Diversities (CIBW 107), Penang, Malaysia, 5 Octobar 2009; pp. 478–485. [Google Scholar]
- Wagdy, A.; Sherif, A.; Sabry, H.; Arafa, R.; Mashaly, I. Daylighting Simulation for the Configuration of External Sun-Breakers on South Oriented Windows of Hospital Patient Rooms under a Clear Desert Sky. Sol. Energy 2017, 149, 164–175. [Google Scholar] [CrossRef]
- AlAnzi, A.; Seo, D.; Krarti, M. Impact of Building Shape on Thermal Performance of Office Buildings in Kuwait. Energy Convers. Manag. 2009, 50, 822–828. [Google Scholar] [CrossRef]
- Pedrini, A.; Vilar De Carvalho, J.P. Analysis of Daylight Performance in Classrooms in Humid and Hot Climate. In Proceedings of the 30th International PLEA Conference, Ahmedabad, India, 16–18 December 2014; pp. 1–10. [Google Scholar]
- Aflaki, A.; Mahyuddin, N.; Al-Cheikh Mahmoud, Z.; Baharum, M.R. A Review on Natural Ventilation Applications through Building Façade Components and Ventilation Openings in Tropical Climates. Energy Build. 2015, 101, 153–162. [Google Scholar] [CrossRef]
- Alibaba, H.Z. Determination of Optimum Window to External Wall Ratio for Offices in a Hot and Humid Climate. Sustainability 2016, 8, 187. [Google Scholar] [CrossRef]
- Alibaba, H.Z. Heat and Air Flow Behavior of Naturally Ventilated Offices in a Mediterranean Climate. Sustainability 2018, 10, 3284. [Google Scholar] [CrossRef]
- Fan, G.; Xie, J.; Liu, J. Indoor Air Quality in a Naturally Ventilated Research Student Office in Chinese Universities during Heating Period. Procedia Eng. 2017, 205, 1272–1278. [Google Scholar] [CrossRef]
- Laska, M.; Dudkiewicz, E. Research of CO2 Concentration in Naturally Ventilated Lecture Room. In Proceedings of the International Conference on Advances in Energy Systems and Environmental Engineering (ASEE17), Wrocław, Poland, 2–5 July 2017; pp. 1–8. [Google Scholar] [CrossRef]
- Krawczyk, D.A.; Rodero, A.; Gładyszewska-Fiedoruk, K.; Gajewski, A. CO2 concentration in Naturally Ventilated Classrooms Located in Different Climates—Measurements and Simulations. Energy Build. 2016, 129, 491–498. [Google Scholar] [CrossRef]
- Ye, W.; Zhang, X.; Gao, J.; Cao, G.; Zhou, X.; Su, X. Indoor Air Pollutants, Ventilation Rate Determinants and Potential Control Strategies in Chinese Dwellings: A Literature Review. Sci. Total Environ. 2017, 586, 696–729. [Google Scholar] [CrossRef]
- WHO. Air Quality Guidelines for Europe, 2nd ed.; World Health Organization Regional Office for Europe, European Series, No. 91; WHO: Copenhagen, Denmark, 2000. [Google Scholar] [CrossRef]
- Jones, A.P. Chapter 3 Indoor Air Quality and Health. Dev. Environ. Sci. 2002, 1, 57–115. [Google Scholar] [CrossRef]
- Al Horr, Y.; Arif, M.; Katafygiotou, M.; Mazroei, A.; Kaushik, A.; Elsarrag, E. Impact of Indoor Environmental Quality on Occupant Well-Being and Comfort: A Review of the Literature. Int. J. Sustain. Built Environ. 2016, 5, 1–11. [Google Scholar] [CrossRef]
- Erdman, C.A.; Steiner, K.C.; Apte, M.G. Indoor Carbon Dioxide Concentrations and Sick Building Syndrome Symptoms in the Base Study Revisited: Analyses of the 100 Building Dataset. In Proceedings of the International Conference on Indoor Air, Monterey, CA, USA, 30 June–5 July 2002; Volume III, pp. 443–448. [Google Scholar]
- Vasile, V.; Petran, H.; Dima, A.; Petcu, C. Indoor Air Quality—A Key Element of the Energy Performance of the Buildings. Energy Procedia 2016, 96, 277–284. [Google Scholar] [CrossRef]
- Daniel, S.; Rubio-bellido, C.; Pulido-arcas, J.A. Adaptive Comfort Models Applied to Existing Dwellings in Mediterranean Climate Considering Global Warming. Sustainability 2018, 10, 3507. [Google Scholar] [CrossRef]
- Campano, M.Á.; Dom, S.; Fern, J.; Jos, J. Thermal Perception in Mild Climate: Adaptive Thermal Models for Schools. Sustainability 2019, 11, 3948. [Google Scholar] [CrossRef]
- Castaño-Rosa, R.; Rodríguez-Jiménez, C.E.; Rubio-Bellido, C. Adaptive Thermal Comfort Potential in Mediterranean Office Buildings: A Case Study of Torre Sevilla. Sustainability 2018, 10, 3091. [Google Scholar] [CrossRef]
- Salvalai, G.; Pfafferott, J.; Sesana, M.M. Assessing energy and thermal comfort of different low-energy cooling concepts for non-residential buildings. Energy Convers. Manag. 2013, 76, 332–341. [Google Scholar] [CrossRef]
- Engelmann, P.; Kalz, D.; Salvalai, G. Cooling concepts for non-residential buildings: A comparison of cooling concepts in different climate zones. Energy Build. 2014, 82, 447–456. [Google Scholar] [CrossRef]
- Croitoru, C.; Nastase, I.; Crutescu, R.; Badescu, V. Thermal comfort in a Romanian passive house. Preliminary results. Energy Procedia 2018, 85, 575–583. [Google Scholar] [CrossRef]
- EDSL. TAS Engineering; Environmental Design Solutions Ltd. (EDSL): Stony Stratford, UK, 2019. [Google Scholar]
- Peel, M.C.; Finlayson, B.L.; McMahon, T.A. Updated World Map of the Köppen-Geiger Climate Classification. Hydrol. Earth Syst. Sci. 2007, 11, 1633–1644. [Google Scholar] [CrossRef]
- Kottek, M.; Grieser, J.; Beck, C.; Rudolf, B.; Rubel, F. World Map of the Köppen-Geiger Climate Classification Updated. Meteorol. Zeitschrift 2006, 15, 259–263. [Google Scholar] [CrossRef]
- Union of The Chambers of Cyprus Turkish Engineers and Architects (KTMMOB). Chapter 96 Regulation: The Streets and Buildings Regulation. Available online: http://www.mimarlarodasi.org/tr/mevzuat/fasil-96-duzenleme/ (accessed on 21 May 2019).
- CIBSE. Guide A: Environmental Design; The Chartered Institution of Building Services Engineers (CIBSE): London, UK, 2015. [Google Scholar]
- ASHRAE. ANSI/ASHRAE Standard 55—Thermal Environmental Conditions for Human Occupancy; American National Standard Institute (ANSI) and American Society of Heating, Refrigerating, and Air-Conditioning Engineers (ASHRAE): Atlanta, GA, USA, 2017. [Google Scholar]
- ASHRAE. ASHRAE Handbook: Fundamentals; American Society of Heating, Refrigerating, and Air-Conditioning Engineers: Atlanta, GA, USA, 2013. [Google Scholar]
- ASHRAE. ANSI/ASHRAE Standard 62.1—Ventilation for Acceptable Indoor Air Quality; American National Standard Institute (ANSI) and American Society of Heating, Refrigerating, and Air-Conditioning Engineers (ASHRAE): Atlanta, GA, USA, 2019. [Google Scholar]
- Voss, J. Revisiting Office Space Standards.; Haworth, Inc.: Grand Rapids, MI, USA, 2000. [Google Scholar]
- EDSL. TAS Theory Manual; Environmental Design Solutions Ltd. (EDSL): Stony Stratford, UK, 2019; Available online: http://www.edsl.net/main/Support/Documentation.aspx (accessed on 13 December 2019).
- British Standards Institution (BSI). BS EN 15251—Indoor Environmental Input Parameters for Design and Assessment of Energy Performance of Buildings Addressing Indoor Air Quality, Thermal Environment, Lighting and Acoustics; British Standards Institution (BSI): London, UK, 2007. [Google Scholar]
- British Standards Institution (BSI). BS EN 13779—Ventilation for Non-Residential Buildings—Performance Requirements for Ventilation and Room-Conditioning Systems; British Standards Institution (BSI): London, UK, 2007. [Google Scholar]
- Fanger, P.O. Thermal Comfort; Danish Technical Press: Copenhagen, Denmark, 1970. [Google Scholar]
- Nguyen, A.T.; Singh, M.K.; Reiter, S. An Adaptive Thermal Comfort Model for Hot Humid South-East Asia. Build. Environ. 2012, 56, 291–300. [Google Scholar] [CrossRef]
- DeDear, R.J.; Brager, G.S. Developing an Adaptive Model of Thermal Comfort and Preference. ASHRAE Trans. 1998, 104, 145–167. [Google Scholar]
- Nicol, F.; Roaf, S. Pioneering: New Indoor Temperature Standards the Pakistan Project. Energy Build. 1996, 23, 169–174. [Google Scholar] [CrossRef]
- Humphreys, M.A.; Nicol, J.F.; Raja, I.A. Field Studies of Indoor Thermal Comfort and the Progress of the Adaptive Approach. Adv. Build. Energy Res. 2007, 1, 55–88. [Google Scholar] [CrossRef]
- Nicol, F.; Humphreys, M. Derivation of the Adaptive Equations for Thermal Comfort in Free-Running Buildings in European Standard EN15251. Build. Environ. 2010, 45, 11–17. [Google Scholar] [CrossRef]
© 2020 by the authors. Licensee MDPI, Basel, Switzerland. This article is an open access article distributed under the terms and conditions of the Creative Commons Attribution (CC BY) license (http://creativecommons.org/licenses/by/4.0/).