Article

Peculiarities of the Relation between Human and Environmental Wellbeing in Different Stages of National Development

by
Simona-Roxana Ulman
1,
Costica Mihai
2 and
Cristina Cautisanu
1,*
1
CERNESIM Environmental Research Center, Alexandru Ioan Cuza University of Iasi, 700505 Iasi, Romania
2
Faculty of Economics and Business Administration, Alexandru Ioan Cuza University of Iasi, 700505 Iasi, Romania
*
Author to whom correspondence should be addressed.
Sustainability 2020, 12(19), 8106; https://doi.org/10.3390/su12198106
Submission received: 22 August 2020 / Revised: 13 September 2020 / Accepted: 28 September 2020 / Published: 1 October 2020

Abstract

:
The literature formed around the concept of sustainable development emphasizes that its achievement depends on how its dimensions evolve. Considering that the economic dimension is not an end in itself, but a means for achieving the other two dimensions, we concentrated on the relation between environment and society. Using the framework of Sustainable Society Index, we applied path analysis for identifying the effects of human wellbeing components on environmental wellbeing for 71 countries around the world in 2016. The countries were grouped into two groups—factor-driven and innovation-driven economies—according to Global Competitiveness Report. The main results revealed that once the society develops, the pressure upon the environment tends to move from the necessity of offering the basic human needs to the one regarding superior societal needs. While the least developed nations have to pay attention especially to population growth, safe sanitation and health as primary channels of better protecting the environment, in the case of the most developed countries, the main directions of environmental improvement may be education and good governance. Thus, a high environmental concern has to be cultivated in the development process, whichever its stage, but with distinct directions of action, as shown by this study.

1. Introduction

Development represents the co-evolutionary process between knowledge, values, organizations, technology and environment; along its evolution, each of these components is linked to the others, determining also their modification at diverse levels [1] (p. 71). This perspective helps a better understanding of the problem of human interactions with the environment, emphasizing that it is not a simple [1] (p. 72) but a very complex relation, which needs extremely profound and attentive analyses. As Wackernagel and Rees [2] (p. XI) emphasized, environmental crisis is especially a behavioral and social one, the recognition of this assumption being the first step in the process of reducing human ecological impact. Taking this into consideration, and also the fact that the economic dimension is not an end in itself, but a means for achieving the ends of the other two dimensions of sustainability, i.e., the human and the environmental one, stress has been laid in this paper on the relation between environment and society, with its performance in terms of food and drink sufficiency, safe sanitation, education, health, gender equity, income distribution, population growth and good governance [3].
In this way, we support the view of a strong sustainability from the perspective of the necessity to protect the environment that, in our opinion, cannot be considered as possibly substituted by the human-made capital, as the neoclassical perspective of weak sustainability supports [1,4,5,6]. We encourage the alternative in which the human-made capital, with its main goal of satisfying human needs and, thus, of improving individuals’ standard of living, should be implemented and developed with an extensive orientation towards environmental protection. This endeavor assumes finding of proper eco-friendly solutions in order to avoid the negative environmental consequences on both the short and long run. While this may seem extremely difficult (even utopic or idealist) to put into practice, although desirable, largely stated within the academic literature devoted to sustainable development [7,8,9,10,11], this important goal also represents the motivational basis of our study. We do not fix such an ambitious objective of finding the main key solutions, but we try to observe the principle components of human wellbeing that (still) register a negative effect upon environmental wellbeing and its components, while also bringing into discussion the perspective of national development and its implications regarding the environment. In this way, we follow the same rationale of environmental Kuznets curve, yet take into consideration the social and not the economic dimension, and expect that improving its levels should lead to a higher demand for environmental quality, progressively reducing environmental deterioration. Thus, we analyze the effects of human wellbeing on environmental wellbeing in different stages of country development, considering that, once a society develops, its awareness on environmental problems should be more prominent, which, in time, is able to translate into improved levels of environmental quality. More concretely, we try to understand whether human wellbeing components register different effects on environmental wellbeing and its components as a function of the level of national development.
In this respect, we start from the well-known assumption that obtaining an acceptable standard of living for citizens generally assumes to sacrifice, to some extent, the environment. Evidence regarding this issue is manifest and abundant in the literature devoted to it [2,12,13,14,15,16]. In this context, our analysis starts from this premise, established as our first hypothesis:
Hypothesis 1 (H1).
The level of human wellbeing generally has a negative influence on the level of environmental wellbeing.
Moving on, in order to better understand where the potential gaps of this issue occur, we proceed to compare the relation between the two dimensions of sustainable development in terms of stages of development, as The Global Competitiveness Report [17] divides the countries of the world. Considering that our focus is on observing a relation that, at general level, is expected to be negative (according to our first hypothesis), we aimed to comparatively analyze this relation in the context of opposite stages of countries’ development, divided accordingly to two criteria: (1) the level of GDP per capita at market exchange rates and (2) the share of exports of mineral goods in total exports (goods and services). In this respect, we shall further focus on comparing the factor-driven (i.e., the countries from the first stage of development) and innovation-driven economies (i.e., the countries from the third stage). In line with well-known economic theory of stages of development, and as the Global Competitiveness Index (GCI) also assumes, in the first stage, the economy is factor-driven, meaning that the process of competing is based on its factor endowments, primarily unskilled labor and natural resources [17] (p. 37). In this way, in this first stage of development, keys to assure an increasing path of development are especially the following pillars of competitiveness: (a) institutions; (b) infrastructure; (c) macroeconomic environment; and (d) health and primary education; while for the last group, they are: (a) business sophistication and (b) innovation pillars [17] (pp. 37–41). As countries move into the innovation-driven stage, the high wages and the associated standard of living have to be sustained through the type of businesses able to compete with the most sophisticated production processes and through high levels of innovation [17] (p. 37), extensively depending on research and development and on a highly educated labor force. Taking into consideration the fact that the developed countries attained a high level of progress in terms of GDP and other related socio-economic dimensions, it is presumed that they exploit their relation to the environment in a specific and particular manner. Accordingly, in the context in which the less developed countries have to firstly concentrate on issues that have been successfully attained by the most developed ones, our attention focuses on the manner in which the environment is affected by the process of acquiring human wellbeing. Is it differently affected in terms of development stages? Which are the main pillars of human wellbeing that directly affect environmental wellbeing depending on the societal stages of development? Which are the main channels of improvement permitting to attain a higher level even in the case of innovation-driven economies? Is it possible to observe some beneficial issues that the less developed countries should take into consideration as examples to follow? To answer these questions, our second hypothesis is divided into two other secondary hypotheses closely related to one another, as follows:
Hypothesis 2a (H2a).
The level of human wellbeing has a negative influence on the level of environmental wellbeing in the first stage of development, constituted by factor-driven economies.
Hypothesis 2b (H2b).
The level of human wellbeing has a negative or even insignificant influence on the level of environmental wellbeing in the third stage of development, constituted by innovation-driven economies.
On the basis of these two hypotheses, the next step aims at deeply investigating the influence of the main categories of human wellbeing (i.e., basic needs, personal development and health, well-balanced society) upon environmental wellbeing. More than that, going deeper, we intend to observe the influence of their indicators—basic needs (sufficient food, sufficient drink, safe sanitation), personal development and health (education, healthy life, gender equality), a well-balanced society (income distribution, population growth and good governance)—on environmental wellbeing, expecting to obtain different results that could generate useful conclusions regarding the relation between human and environmental wellbeing in different stages of country development. In this context, the first part of our third hypothesis is:
Hypothesis 3a (H3a).
The main categories of human wellbeing (i.e., basic needs, personal development and health, well-balanced society) influence the environmental wellbeing in different ways, their effects also differing in terms of stages of national development.
Moving on, observing the effects of the categories of human wellbeing on each category of environmental wellbeing may be useful because it may represent the basis of some possible political recommendations for improving the care for environmental conditions. In this way, the second part of our third hypothesis is:
Hypothesis 3b (H3b).
The categories of human wellbeing (i.e., basic needs, personal development and health, well-balanced society) influence the categories of environmental wellbeing (i.e., natural resources, climate and energy) in different ways, their effects also differing in terms of stages of development.
In this way, anthropological environmental degradation becomes central by the effort made for observing the relations between (1) human and environmental wellbeing, (2) categories of human wellbeing and environmental wellbeing, and (3) indicators of human and environmental wellbeing, opting for an analysis advancing from general to particular aspects, in order to profoundly understand the main social drivers affecting the environment.
The paper has five sections. After the introductory section, Section 2 presents the general framework of the literature on the relationship between environmental and human wellbeing. Section 3 is comprised of the description of the data and used methodology. The results are presented in Section 4. The paper ends with discussions and conclusions in Section 5.

2. The Environmental and Human Wellbeing Concern: Main Peculiarities

Chapin III et al. [18] (p. 234) remember the extensively large alteration of global environment caused by humans, who, by their irrational ways of attaining growth objectives, changed the global biogeochemical cycles, transformed the land and enhanced the mobility of biota. Anthropological environmental degradation is also evidenced by Wackernagel and Rees [2] (p. XI), who consider that the environmental crisis is especially a behavioral and social one. In this way, as Constanza et al. [1] (p. 56) mention, humans are responsible for understanding their role in relation to the environment, which has to be sustainably managed.
In this regard, we turn our attention to Environmental Kuznets Curve (EKC) that posits an inverted-U relationship between pollution, as a representative indicator for environmental degradation, and economic growth (e.g., [19,20,21,22,23,24,25,26]). As [19] (p. 149) already mentioned, numerous theoretical and empirical papers have considered this broad relationship between economic development and environmental quality. The same assumption is valid nowadays, when it still represents a central point of interest for the economists preoccupied with the environment and its problems (e.g., [22,27,28,29,30,31,32]) in the context in which its analysis may contribute to a better understanding of the development process as a whole and may also represent a useful tool for outlining environmental political approaches. In our study, replacing the economic dimension with the social one, we intend to understand the relationship between human wellbeing and environmental wellbeing in opposite stages of development, i.e., the first and the last stage. This comparison is made with the aim of offering the strongest differences in terms of socio-environmental challenges on totally distinct levels of national development. The human wellbeing, once the GDP grows, is more and more improved through education, sociality, empathy, equality of chances, culture and attention to external facts, such as public goods, with a higher awareness of the necessity of protecting them for the sake of general wellbeing. In the literature, these facts are highlighted, emphasizing also the fact that people value environment more highly in the developed countries contrary to the developing ones, where jobs and income are the center of personal actions ([19] (pp. 147–148), [21] (p. 432), [24] (p. 174)). In this way, in the context of a higher concern and of an increased research knowledge about environmental quality and regulation [19] (p. 152), in the last stage of development, we expect to find out different relationships between the components of social and environmental wellbeing. Thus, it is possible to emphasize the fact that these relations register progress in terms of their peculiarities from one development stage to another and that it is not a static process. We expect our results to reveal that some social components, like attaining the basic needs, seem to be primordial and negatively affect environmental wellbeing in the first stage, while, in the case of developed countries, other components, especially the ones regarding personal development and well-balanced society (in terms of education, gender equality, income distribution or good governance), would represent more important causes of environmental degradation than offering the basic needs. In this respect, we point out that, from our point of view, social wellbeing, as an end of the economic dimension, should be put in the center of the discussion when the environment and its quality are analyzed, following the same rationale of the environmental Kuznets curve. We also think that, considering the components of social wellbeing (issues regarding basic needs, personal development and health and regarding well-balanced society) [3], this approach would create less polemics, as it addresses a more stable, more clear and logical relationship.
Moving on and pointing out that human and nature need co-integration [33], the actual issues regarding the environment become more and more complex [34] (p. A43), representing important threats to human wellbeing [35,36,37,38]; the crucial moment of learning how to advance without producing negative environmental side effects has arrived [8] (p. 17). Trying to respond to these concerns, we shall analyze (1) environmental wellbeing and its indicators, such as: biodiversity, renewable water resources, consumption, energy use and savings, greenhouse gases and renewable energy in relation to (2) human wellbeing and its indicators: sufficient food and drink, safe sanitation, education, health, gender equality, income distribution, population growth and good governance. This approach follows the main indicators of the Sustainable Society Index [3] and also two of the three areas of capital used and developed for general wellbeing [39] (p. 8) described by the Belgian Federal Planning Bureau (2005). Thus, in the next paragraphs, we present the environmental wellbeing components, focusing on their main peculiarities and also on the aspects that substantially contribute to the major concern of general environmental degradation. In addition, we point to some characteristics of each human wellbeing component and mark some findings of previous studies regarding the relation between them and the environment.

2.1. Environmental Wellbeing

(1) Biodiversity
The loss of biological diversity, or, in its abbreviated formulation, biodiversity [40] (p. 3), represents a major concern worldwide [13,18,40,41], the reduction of its rate and averting its dangerous change becoming an international essential goal [41] (p. 277). As Chapin III et al. [18] (p. 234) suggest, alteration of the global environment caused by human actions determined essential negative changes in biodiversity, damaging ecosystem processes and changing their capacity of resilience. In response to these problems, some requirements have to be implemented, regarding major changes in policy and human behavior [18] (p. 234), possibly regulated by means of political tools [18] (p. 241). In this respect, one of the main issues is of understanding the effects of human wellbeing components upon biodiversity, expressed by two sub-indicators: the 10-year change of forest area and the size of protected land areas as percentage of the total land area of a country [3].
(2) Renewable water resources
Water is one of the basic elements that support life on the planet, being indispensable to every form of life and to every human activity [42] (p. 290). In addition, a sustainable water resource system is the one able to satisfy the changing demands without system degradation [43] (p. 43). Unfortunately, as Mariolakos [44] (p. 147) suggests, one of the greatest problems of human society is the one related to water shortage, its main causes being: (i) demographic explosion, (ii) rising of living standards, (iii) short-term climatic changes, and (iv) management of water resources. In this way, in the supply-demand interaction, there is an increasing emphasis upon water management for reducing the demand [45] (p. 219). More than that, water sufficiency is not only a quantitative problem, it is also a qualitative one as, in cases of high pollution, it becomes inadequate as water supply [44] (p. 148). This is why attention should be paid to the factors that may affect the renewable water resources, which are expressed by an indicator measuring the water consumption per year as a percentage of the total available renewable water resources, including internal and external (flowing in from neighbor countries) water resources, with a calculation criteria comprising municipal water withdrawal, industrial water withdrawal and agricultural water withdrawal [3].
(3) Consumption
It is known that, if the biophysical limits are exceeded, then our path is not a sustainable one anymore, and also that ecological footprint is “an indicator of the degree to which biophysical limits have been approached or exceeded” [46] (p. 342)—the reason for including this indicator in the measurement of environmental wellbeing is evident. Thus, in some ways, ecological footprint may be considered an indicator for sustainability. It also may transmit information in terms of “fairness of consumption” [47] (p. 393) because it enables the estimation of resource consumption and waste assimilation requirements of a defined human population with the corresponding productive land area [2] (p. 9). According to the Sustainable Society Index, consumption is measured in terms of ecological footprint minus carbon footprint, the explanation being that it is already included in this index by the emission of greenhouse gases [3].
(4) Energy use
Although it is difficult to formulate a complete definition for energy, which is known to embody different meanings, its generally agreed description is “the capacity to do work” [48] (p. 2). The problem is the well-known fact of energy that decreases in quality, although it is never destroyed, and that ends up as waste heat [48] (p. 3). Energy pervades all sectors of society, i.e., economics, labor, environment, international relations, in addition to our own personal lives, in terms of housing, food, health, transportation, recreation and more [49] (p. 2). In the context in which it is fundamental to social development [50] (p. 1), with four primary uses: industrial, residential, commercial, and transport [48] (p. 9); [3], it is facile to understand why its efficient use is a major global concern [51] (p. 3). The general political intent is to change the current patterns of energy use and, to this end, it is essential to deeply understand the trends in energy efficiency and the other factors with significant influence upon energy consumption [51] (p. 16). As Hill et al. [50] (p. 2) mention, there has always been a close link between social development and energy use, but it is possible to escape from this vicious circle through innovation at this level; our study attempts at exactly analyzing this relation in terms of comparative stages of national development.
(5) Energy savings
In the countries that have become aware of their resource scarcity, specific targets are set, with the main goal of reducing the consumption of energy [3] and thus of registering increasing savings at this level. The literature makes a distinction between the behavioral and technical measures of energy saving [14,52]. In this context, as Poortinga et al. [53] (p. 49) mentioned, the most important element that seems to influence the acceptability of energy-saving measures is the energy-saving strategy. In addition, the attempt at designing new processes for energy savings is determined by concern in terms of higher yield of the process, lower consumption of natural resources and a higher economic performance [54] (p. 219). In this way, it seems that human actions are closely related to this indicator, being able to determine, as a function of the directions chosen to follow, whether its levels become higher and higher or, on the contrary, whether the tendency of a largely unreasonable consumption is maintained. Many studies have analyzed the relation between, on one hand, social and psychological factors and, on the other, energy-saving behavior [14,53,55,56], while others focused on the importance of social processes [57]. Adding to this, our study aims at observing the effect of the components of human wellbeing on energy saving and at understanding the main differences in terms of stages of development. More than that, as Abrahamse and Steg [58] (p. 719) emphasize, while the finding that households with higher incomes use more energy may be self-evident, from a different perspective, this type of households has more possibilities to adopt expensive energy-saving measures, thus being able to substantially reduce energy consumption. Extensively, we want to investigate this aspect at a higher level, in terms of stages of development.
(6) Greenhouse gases
As evidenced by Matthews et al. [59] (p. 288), the drivers of global change have to be set in the context of the changes also occurring in the atmosphere, showing that, although the term of sustainability is often used as implying some semi-equilibrium state, the atmosphere is unlikely to attend it over the next 200 years. In this respect, greenhouse gases, measured with an indicator using the common measure for Emission of Greenhouse Gases, i.e., the amount of emitted CO2—other GHG emissions, like CH4, N2O, HFCs, PFCs and SF6, not being included in it [3]—is by far the most essential factor contributing to the lack of equilibrium in the atmosphere, producing the global warming threat today [12] (p. XIV). Although its effect on Earth is a natural one, without which life as it exists today would not be possible [12] (p. XIV), since the Industrial Revolution this natural effect has been negatively influenced by human interface [12] (p. 10). In this context, it is important to find out the effects of human wellbeing dimensions upon it and, in this way, to directly respond to the issue.
(7) Renewable energy
Energy supply from renewables is an essential component in the strategy of every nation, especially of those whose responsibility for the environment and sustainability is present to a large extent [60] (p. XI). It expresses the share of energy produced by renewable sources as the percentage of the total energy (TPES, Total Primary Energy Supply), including hydro, geothermal, solar photovoltaic, solar thermal, tide, wave, ocean, wind, solid biomass, gases from biomass, liquid biomass and renewable municipal waste [3]. Renewable energy represents the type of “energy obtained from natural and persistent flows of energy occurring in the immediate environment” [60] (p. 7), and it is unexhausted, while the fossil and nuclear fuels are running lower every day [61] (p. 78). Due to the obvious benefits of such type of energy, i.e., jobs, new industries and exports, energy security and climate and environmental protection [61] (p. 76), Mallon [62] (pp. 5–13) mentions five myths regarding it, as follows: (1) the technical myth—the price of renewable energy will be reduced by technical breakthrough; (2) the myth of the righteous—a good idea will always prevail and intervention is unnecessary; (3) the hands-off myth—government intervention only undermines the proper working of markets; (4) one money myth—renewable energy is more expensive than thermal power; (5) the other money myth—because renewable energy is more expensive and capital-intensive, what best governments can do is to throw money at the problem. Anyway, the problem of finding solutions for an increasing amount of energy represents an urgent action, thus avoiding the potential worldwide social perturbations manifested in the process of fulfilling the basic human needs [63]. In this respect, [61] (p. 76) point out the fact that “the only logical and safe option is to channel all possible resources into a new world energy system, based on renewable energies,” being able to report a positive contribution to the economic, social and environmental wellbeing, called by [60] (p. 2), “a positive triple bottom line.”

2.2. Human Wellbeing

(1) Sufficient food
Sufficient food indicator is defined as the availability of at least a minimum level of dietary energy for each person, representing one of the basic conditions for people’s proper development [3]. According to a report coordinated by FAO, good nutrition is assumed to be ”the lifeblood of sustainable development” [64] (p. XIII), constituting one of the main components of basic needs and initially opening the way to expanding the real freedoms that people enjoy [65] (p. 3). This factor is a great challenge especially in factor-driven economies, included in the first stage of development, where the state of poverty attains extreme levels and the environmental conditions are not very friendly for facilitating proper conditions of life. This is why the relationship between environmental quality and basic needs, including sufficient food aspect, is generally shown to be negative in the third world [66,67]. In the other regions, the level of undernourished people is almost insignificant, and, in this way, it is not frequently taken into analysis as a main determinant of environmental wellbeing.
(2) Sufficient drink
Water is increasingly seen as one of the most critically stressed resources [68] (p. 264). Sufficient water means that at least 20 L of safe drinking water per person per day should be available within one kilometer of a user’s dwelling, from an improved water source, including: household connections, public standpipes, boreholes, protected dug wells, protected springs and rainwater collection [3]. Water poverty is defined as a situation in which a nation or region cannot afford the cost of sustainable clean water to all people at all times [68] (p. 263), being essentially a scarcity of readily available fresh water. It depends on the spatial variability and temporal fluctuations in supply and demand, not always conforming to the patterns of human demand [68] (p. 264).
(3) Safe sanitation
Sanitation includes the collection, transport, treatment and disposal or reuse of human excreta or domestic wastewater, whether through collective systems or by installations serving a single household or undertaking through improved water disposal facilities: connection to a public sewer, connection to a septic tank, pour-flush latrine, simple pit latrine and ventilated improved pit latrine [3]. The lack of safe sanitation increases the risk of population to be contaminated with infectious diseases [69,70], decreasing the life quality and contributing to poverty, as a main determinant factor. Apart from these negative aspects, it also represents a pollutant factor, damaging environmental wellbeing [70] (p. 440).
(4) Education
The human capital is an asset [71] (p. 12) that is increasingly more valued within all societies. In this regard, the main scope of education should be the development of the labor force’s competencies and, consequently, its marginal productivity, thus contributing to new social opportunities and to societal progress. People are aware of the main benefits received from investing in education and, as Kanbur and Squire [72] (p. 197) mention, it was found out that the number of years of education generally increases steadily as one moves up the income scale. Regarding the environment, several studies analyzed the relationship between the level of education and environmental concern, the results generally showing that higher levels of education are significantly associated with more pro-environmental attitudes [73,74,75,76,77,78]. In our study, education is analyzed considering the number of students enrolled in primary, secondary and tertiary levels of education, regardless of age, as percentage of the population of official school age for the three levels [3]. In this way, the approach is considered useful in understanding the effect induced by education to environmental wellbeing and not in analyzing the influence of education on individual environmental perceptions and attitudes or on the implication in pro-environmental activities.
(5) Healthy life
The state of personal health is one of the most important components of individuals’ quality of life. Considered among the dimensions of living standards, its absence or its low status can be related to concerns like vulnerability, risk, powerlessness and lack of voice [72] (p. 183). According to such an approach, it is closely linked to individual capabilities, along with aspects regarding income and education [65] (p. 19). Commonly, as [3] mention, the level of a country’s healthcare is measured using life expectancy at birth indicator at national level [79].
(6) Gender equality
Gender equality is one of the European Union’s fundamental values, carefully integrated into EU policies and funding programs [80] (p. 7). The concept of gender equality in the EU is designed in an interdependent manner and organized on four pillars: (1) family and (2) domestic violence—corresponding to the organization of intimacy; (3) gender inequality—corresponding to the organization of citizenship; and (4) work—corresponding to the organization of labor [80]. Gender relations, defined by Bock and Shortall [81] (p. 3) as the socially constructed form of relations among women and men, have been improving because of the manner in which the balance of power among women and men changed, in favor of the first. The problems related to gender gap can be divided into two distinct parts: the political-economic and the cultural-valuational ones [82] (p. 25). Although Kabeer [83] (p. 13) mentions that gender equality and women’s empowerment are an intrinsic rather than an instrumental goal, explicitly valued as an end in itself rather than as an instrument for achieving other goals, attaining a certain level of equality in terms of gender is also nurturing for the general goal of societal development, expanding the individual ability to do and be with lower gender distinction. Regarding its implication upon the environmental dimension, it was found out that females are more disposed than men to allocate from their time to participate in pro-environmental activities [84,85]. In other studies, results for gender were weak and inconsistent [73,78].
(7) Income distribution
Although (1) the income is just a means to our real ends, (2) other important ones do exist, and (3) interpersonal variations in the relation between the means and such various ends are always met [86] (p. 29); if considering that individuals are very different, with specific and diverse personal particularities, the inequality of income tends to represent “the primary focus of attention in the analysis of inequality” [86] (p. 28). As Galbraith [87] (p. 177) mentions, there is not sufficient data showing whether inequality is beneficial or harmful for growth, but it is certainty on the fact that a lower level of inequality positively contributes to economic performance, and also that a growing inequality translates into future economic crises. In this regard, Minsky [88] (p. 149) also mentions the Keynesian argument related to the influence of inequality on economic development, explaining that, if a moderate income distribution within society is socially desirable, the high ones, especially those coming from the patrimony, are harmful for development. This position is also confirmed by [3]. Moving on and observing the relationship between income inequality and environment analyzed within the studies devoted to it, the findings differ, being even contradictory in some cases. For example, Boyce [89] observes that a greater inequality increases the rate of environmental time preference, thus reducing the concern for the future and degrading more the environment. In the same direction, Marsiliani and Renström [90] find a negative correlation between inequality and environmental protection, explained by the fact that an unequal income distribution leads to less stringent environmental policies. Unlike them, Ravallion et al. [91] observe the unclear or ambiguous relative impact of rich and poor people on the environment. This situation may be explained by the fact that (1) income distribution is not related to environmental degradation, as Scruggs [92] argued, or that (2) the positive and negative influence of income inequality on the environment tends to counterbalance it [93] (p. 21).
(8) Population growth
The relationship between population growth and environmental quality has drawn the attention of economics since its first theoreticians. In the actual context of analysis, the neo-Malthusian and neo-Boserupian approaches play an important role, as they represent the two main and contradictory theoretical directions in the population-environment debates, providing divergent opinions about the effects of population growth on the environment [94] (p. 171). As a component of human wellbeing, population growth, translated into more inhabitants on earth, means a larger demand for a limited available space and resources on our planet, many of the latter ones not being renewable [3]. In this way, nowadays it is generally perceived as a pressure on environmental wellbeing.
(9) Good governance
Starting from the modality in which power is implemented in the management of a country, Weiss [95] (p. 797), underlying World Bank’s approach, mentions that governance is related to: (1) the form of political regime; (2) the process regarding exerting authority in the national management of a country in order to achieve development; and (3) the capacity of governments to design, formulate and implement policies and discharge functions. In this way, good governance is one of the most decisive points in the process of development, the adoption of its paradigm implying a very wide range of institutional preconditions for economic and political development [96,97].
Related to these three aspects, the level of good governance is more deeply analyzed from the perspective of six major issues regarding: (1) voice and accountability of a country’s citizens in terms of their capacity to participate in selecting their government, as well as freedom of expression, freedom of association, and free media; (2) political stability; (3) government effectiveness; (4) regulatory quality; (5) rule of law; and (6) corruption [3,79].

3. Data and Methods

The empirical analysis was focused on the relationship among the human and environmental components of sustainable development. Taking into consideration that, at global level, countries are heterogeneous as to their stage of development, we chose to classify them by their level of competitiveness.
In this regard, according to the Global Competitiveness Indicator Report 2016–2017 [17], countries are classified into five groups, as follows: (1) Stage 1 (Factor-driven economies), (2) Transition from stage 1 to stage 2, (3) Stage 2 (Efficiency-driven economies), (4) Transition from stage 2 to stage 3, and (5) Stage 3 (Innovation-driven economies).
We aimed at comparatively analyzing the countries from stages 1 and 3 concerning the relationship between two of the sustainable development components, namely the human and environmental one. In this way, we wanted to establish whether the stage of development plays an important role in the relationship between the two dimensions of sustainable development. Thus, we expect the stage of development to represent an important variable in our discussion regarding the relationship between environmental and human wellbeing. The last stage of development is the one that is attempted to be achieved by all the countries all over the world in their process of development, and it is presumed that the social pressure on environment is different here compared to the one exerted in the first stage. In this way, the main reasons of choosing to make a comparative analysis between the first stage of development and the third one are based on some logical arguments. Firstly, we consider that this comparison offers the possibility of observing in the most evident way the differences between the effects that human wellbeing has on environmental wellbeing. In this respect, opposed stages of development mean different national peculiarities and, in this way, the analyzed relationships are confronted and the major differences, in the case in which they appear, are possible to be appropriately revealed. Secondly, we expect to obtain several conclusions related to the following issues:
(1)
The main different directions through which the countries from the two opposed stages of development act to better protect their environmental wellbeing;
(2)
A perspective of the evolution of stress components on environment from one stage to another (i.e., from the social basic requirements like the basic needs in the least developed countries to more superior ones, related to the personal development and a well-balanced society in the most developed countries).
Table 1 lists the countries included in each of the two stages of development under analysis.
The data used in the study was collected from the Sustainable Society Index official website. We performed our empirical analysis on data recorded in 2016, the last year available for the Sustainable Society Index (SSI).
Academic literature created many composite indices aimed at quantifying the sustainability of a country: the Index for Sustainable Economic Welfare ISEW [98], the Sustainable Society Index [99], the Environmental Performance Index EPI [100], the Ecological Footprint EF [101], the Human Development Index HDI [102], etc.
We decided to use SSI instead of the other indices, based on the following motivations: (1) it comprises a large set of indicators regarding each sustainable development dimension (Figure 1), (2) the indicators included in the computation of the index come from a wide number of sources (Figure 1), and (3) the index was confirmed by the Joint Research Centre of the European Commission as an index “well-structured and guaranteeing a control process to ensure transparency and credibility of results” [103] (p. 7).
According to van de Kerk and Manuel [99], the SSI scores for each country are calculated as a geometric mean (Equation (1)):
S S I l = i j k ( d i j k l ) a i b i j c i j k
where l represents the country, i represents the wellbeing dimension (human, environmental or economic), j represents the category within each dimension, k represents the indicator within each category, dijkl represents the sustainable society score of a country l with respect to indicator k, ai is the weight of wellbeing dimension i, bij is the weight of category j, and cijk is the weight of indicator k.
The values of SSI indicators, categories and dimensions range between 0 and 10. If a country l is 100% sustainable for indicator k, category j or dimension i, it will be scored with 10. Otherwise, if country l is not at all sustainable for indicator k, category j or dimension i, it will be scored with 0.
In this paper, the authors used the following acronyms for the variables: (i) Human Wellbeing (HW) dimension with the Basic Needs (BN), Personal Development and Health (PDH), Well-balanced Society (WbS) categories and the Sufficient Food (SF), Sufficient to Drink (SD), Safe Sanitation (SS), Education (ED), Healthy life (HL), Gender Equality (GE), Income Distribution (ID), Population Growth (PG), Good Governance (GG) indicators; (ii) Environmental Wellbeing (EnvW) dimension with the Natural Resources (NR), Climate and Energy (CE) categories and the Biodiversity (BIODIV), Renewable Water Resources (RE_WATER), Consumption (CONS), Energy Use (EU), Energy Savings (ES), Greenhouse Gases (GHG), Renewable Energy (RE_EN) indicators; (iii) Economic Wellbeing (EcW) dimension.
As already mentioned, our study analyses mainly the environmental wellbeing in relation to human wellbeing in countries with different stages of development. Firstly, we want to observe how the human wellbeing components affect the environmental wellbeing in the countries from stage 1 and 3. To this end, we drew some path diagrams in which we studied the sign and significance of the coefficients corresponding to each of the direct effects of the human wellbeing components upon environmental wellbeing. Secondly, based on the main conclusions derived from the path analysis in terms of significant differences between efficiency-driven and innovation-driven economies regarding the relationships between human and environmental wellbeing, we specified some path models in which we studied the influence of the human wellbeing indicators on each environmental wellbeing indicator.
In path analysis, the models were specified considering the theory and findings of previous studies regarding the relationship among the components of human and environmental wellbeing. In this way, path analysis does not provide a way to specify the model, but rather estimates the effects of the variables once the model has been specified by the researcher on the basis of theoretical considerations [104] (p. 71). Path coefficients in path models are derived from the values of a Pearson product moment correlation coefficient and/or a standardized partial regression coefficient [105] (p. 11). In path models, estimation of parameters permits decomposition of the correlation matrix. Decomposition of a correlation matrix implies that the original correlation matrix can be completely reproduced if all parameters in a path model are specified [104] (p. 73). The validation of the path analysis results is based on the values of several criteria: Goodness-of-fit (GFI), Adjusted GFI (AGFI) and Normed fit index (NIF) [104] (p. 111).

4. Results

4.1. The Effects of Human Wellbeing on Environmental Wellbeing at General Level and also Separately in Stage 1 and 3

Our findings confirm both the results obtained in other studies and our first hypothesis, revealing that, at the level of all countries under analysis, a high level of HW has a negative influence on the level of EnvW (Coef = −0.585, Sig = 0.000), tending to decrease its level. Accordingly, certain conditions of living, such as achieving sufficient food and drink, safe sanitation, an appropriate level of education, gender equality and good governance, contribute in a negative way to environmental quality.
Further on, a separate analysis of stages 1 and 3 of national development shows that the direction of influence between the two important components of wellbeing is opposite, the difference being made by the stage of development to which the countries belong (Figure 2). Thus, the source of this influence has to be better explained by a deep understanding of the different factors determining this state-of-the-art. Therefore, our results regarding the opposite influence of human and environmental wellbeing in terms of stages of development (negative in stage 1 with Coef = −0.787 and Sig = 0.000 and positive in stage 3 with Coef = 0.588 and Sig = 0.003) represent the second step of analysis, confirming our second hypothesis and determining the need for further investigation of the relations between human and environmental wellbeing components that have to be deeply analyzed to find out what causes this difference.

4.2. The Effects of the Main Categories of Human Wellbeing on Environmental Wellbeing

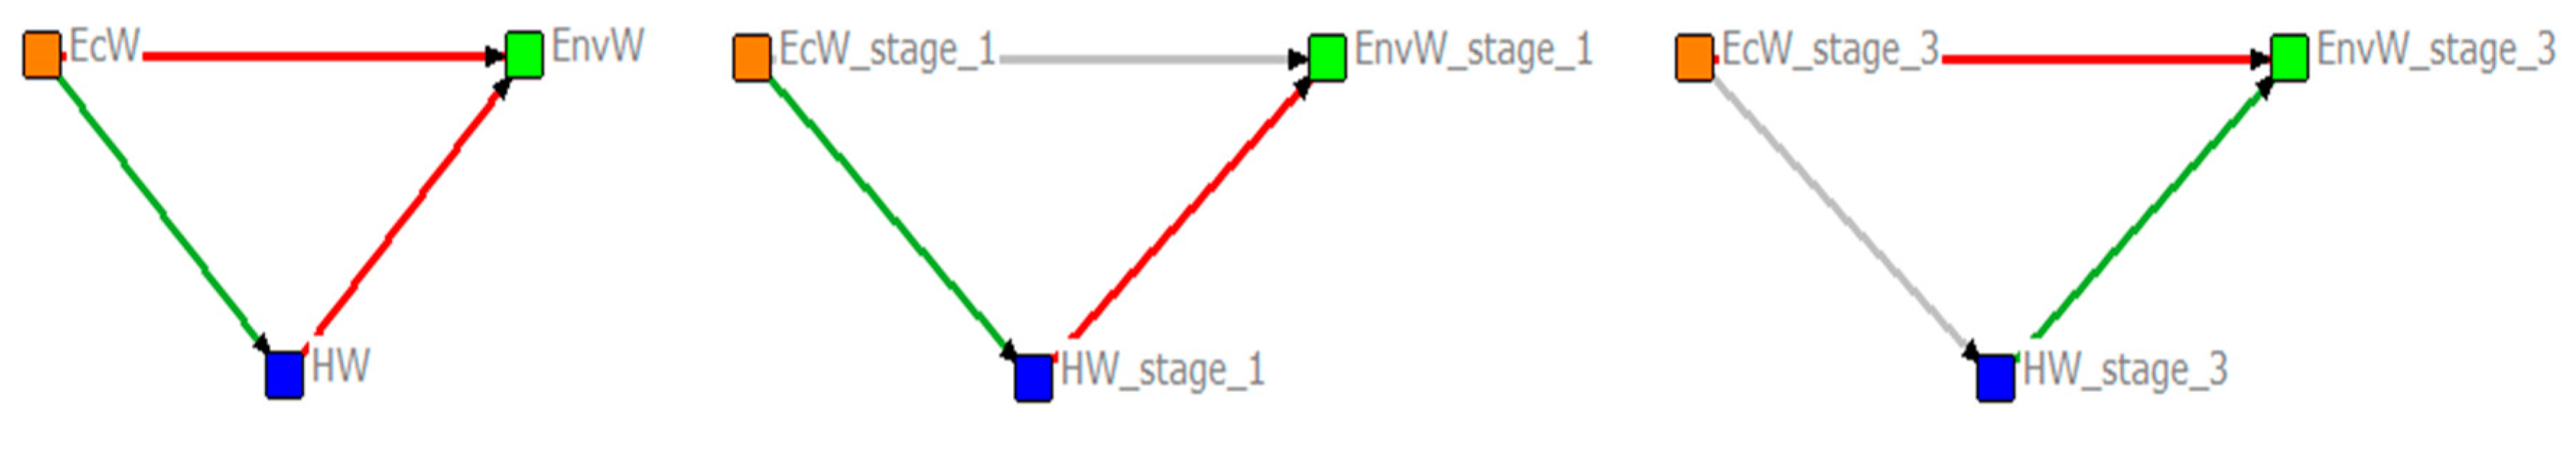
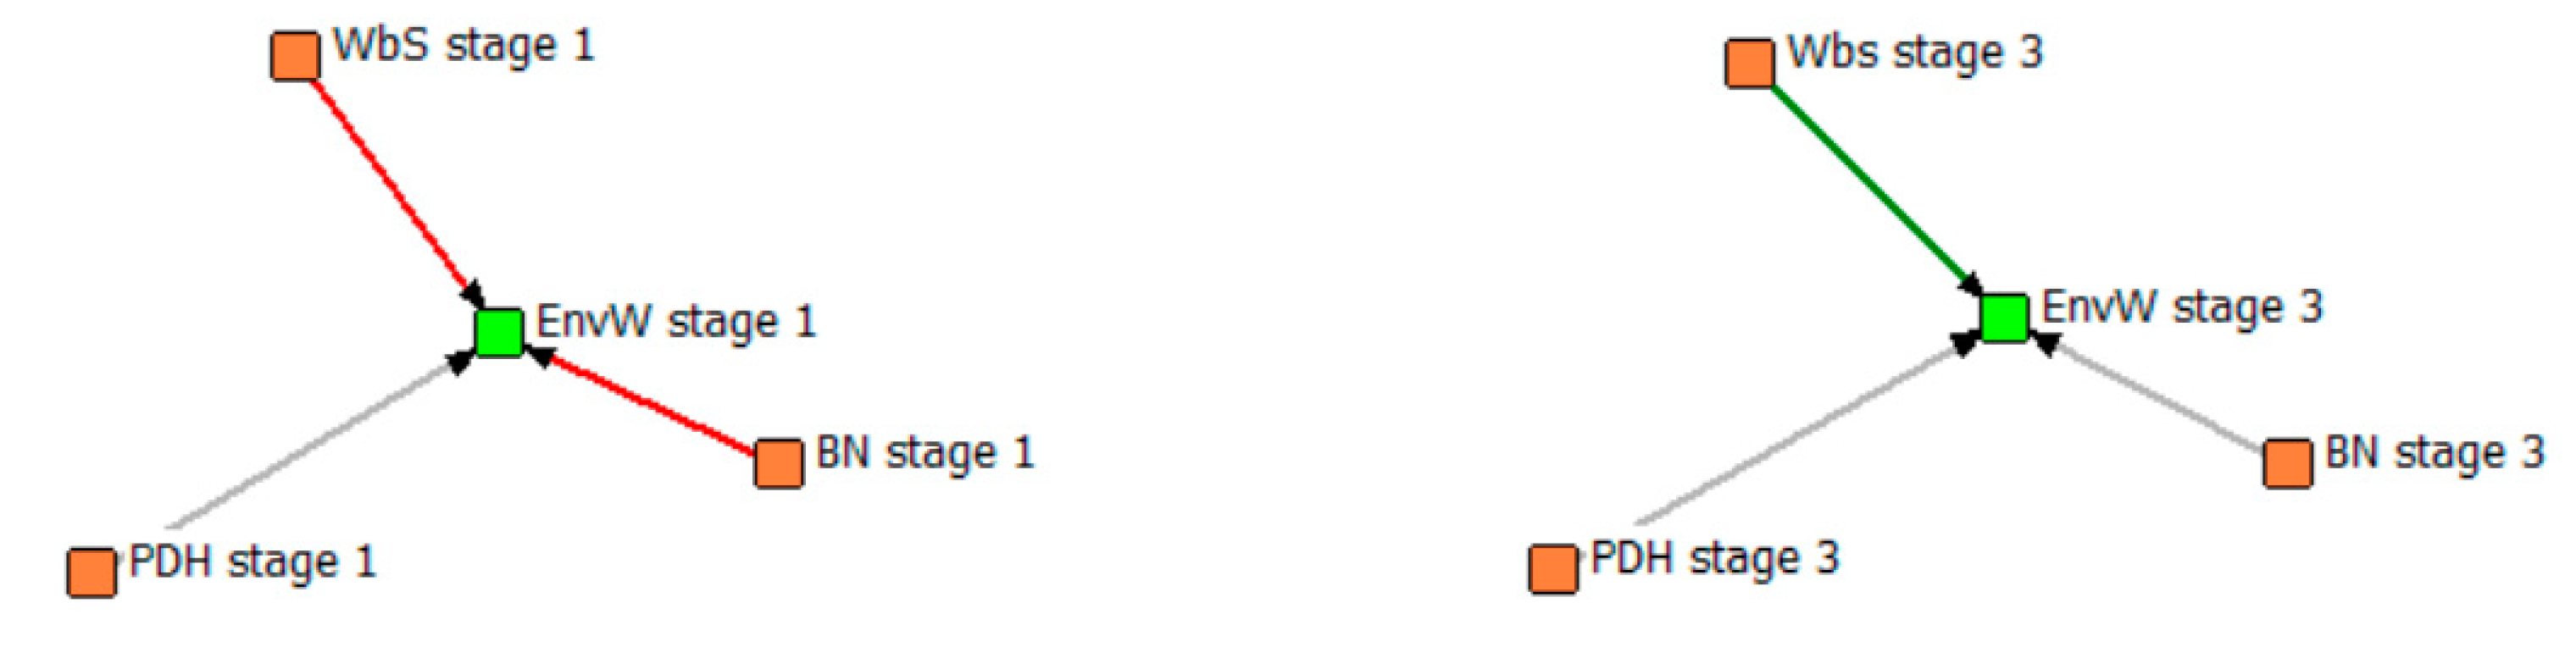
In the first stage of development, EnvW is negatively influenced by the BN (Coef = −0.270, Sig = 0.022) and WbS (Coef = −0.415, Sig = 0.007) indicators, meaning that a high level of independent variables determines a low level of environmental wellbeing (Figure 3). Therefore, a high level of basic needs and a well-balanced society in the countries from the first stage of development have a negative effect on environmental wellbeing, thus inducing its low level. In other words, in the factor-driven economies, assuring the basic needs and a balanced society can be made at the expense of environmental wellbeing. On the contrary, in the case of innovation-driven economies, a well-balanced society registers a positive effect on environmental wellbeing (Coef = 0.248, Sig = 0.074). In both stages of development, PDH does not register a significant effect upon EnvW (in stage 1 the Coef = 0.031 and Sig = 0.968; in stage 3 the Coef = −0.166 and Sig = 0.670).
In this way, the difference is made by the fact that, on one hand, BN has a negative effect on EnvW in the countries from the first stage of development while, in the developed countries, its effect is not significant and, on the other hand, the WbS indicator registers effects on the EnvW in both stages of development, but in opposite ways, i.e., negative in the first stage and positive ones in the last stage (Table 2). Thus, a society that offers an approximate equilibrium regarding the distribution of income of the richest 10% to the poorest 10% of the people in a country, with a decreasing number of inhabitants instead of a continuous and rapid growth, faced nowadays in many countries of the world, together with a good governance have a positive effect on environmental wellbeing, but only in the case of developed countries.
On the contrary, in factor-driven economies, these aspects analyzed together have a negative influence, although, at first sight, they should also contribute to a higher level of environmental wellbeing (Table 2).
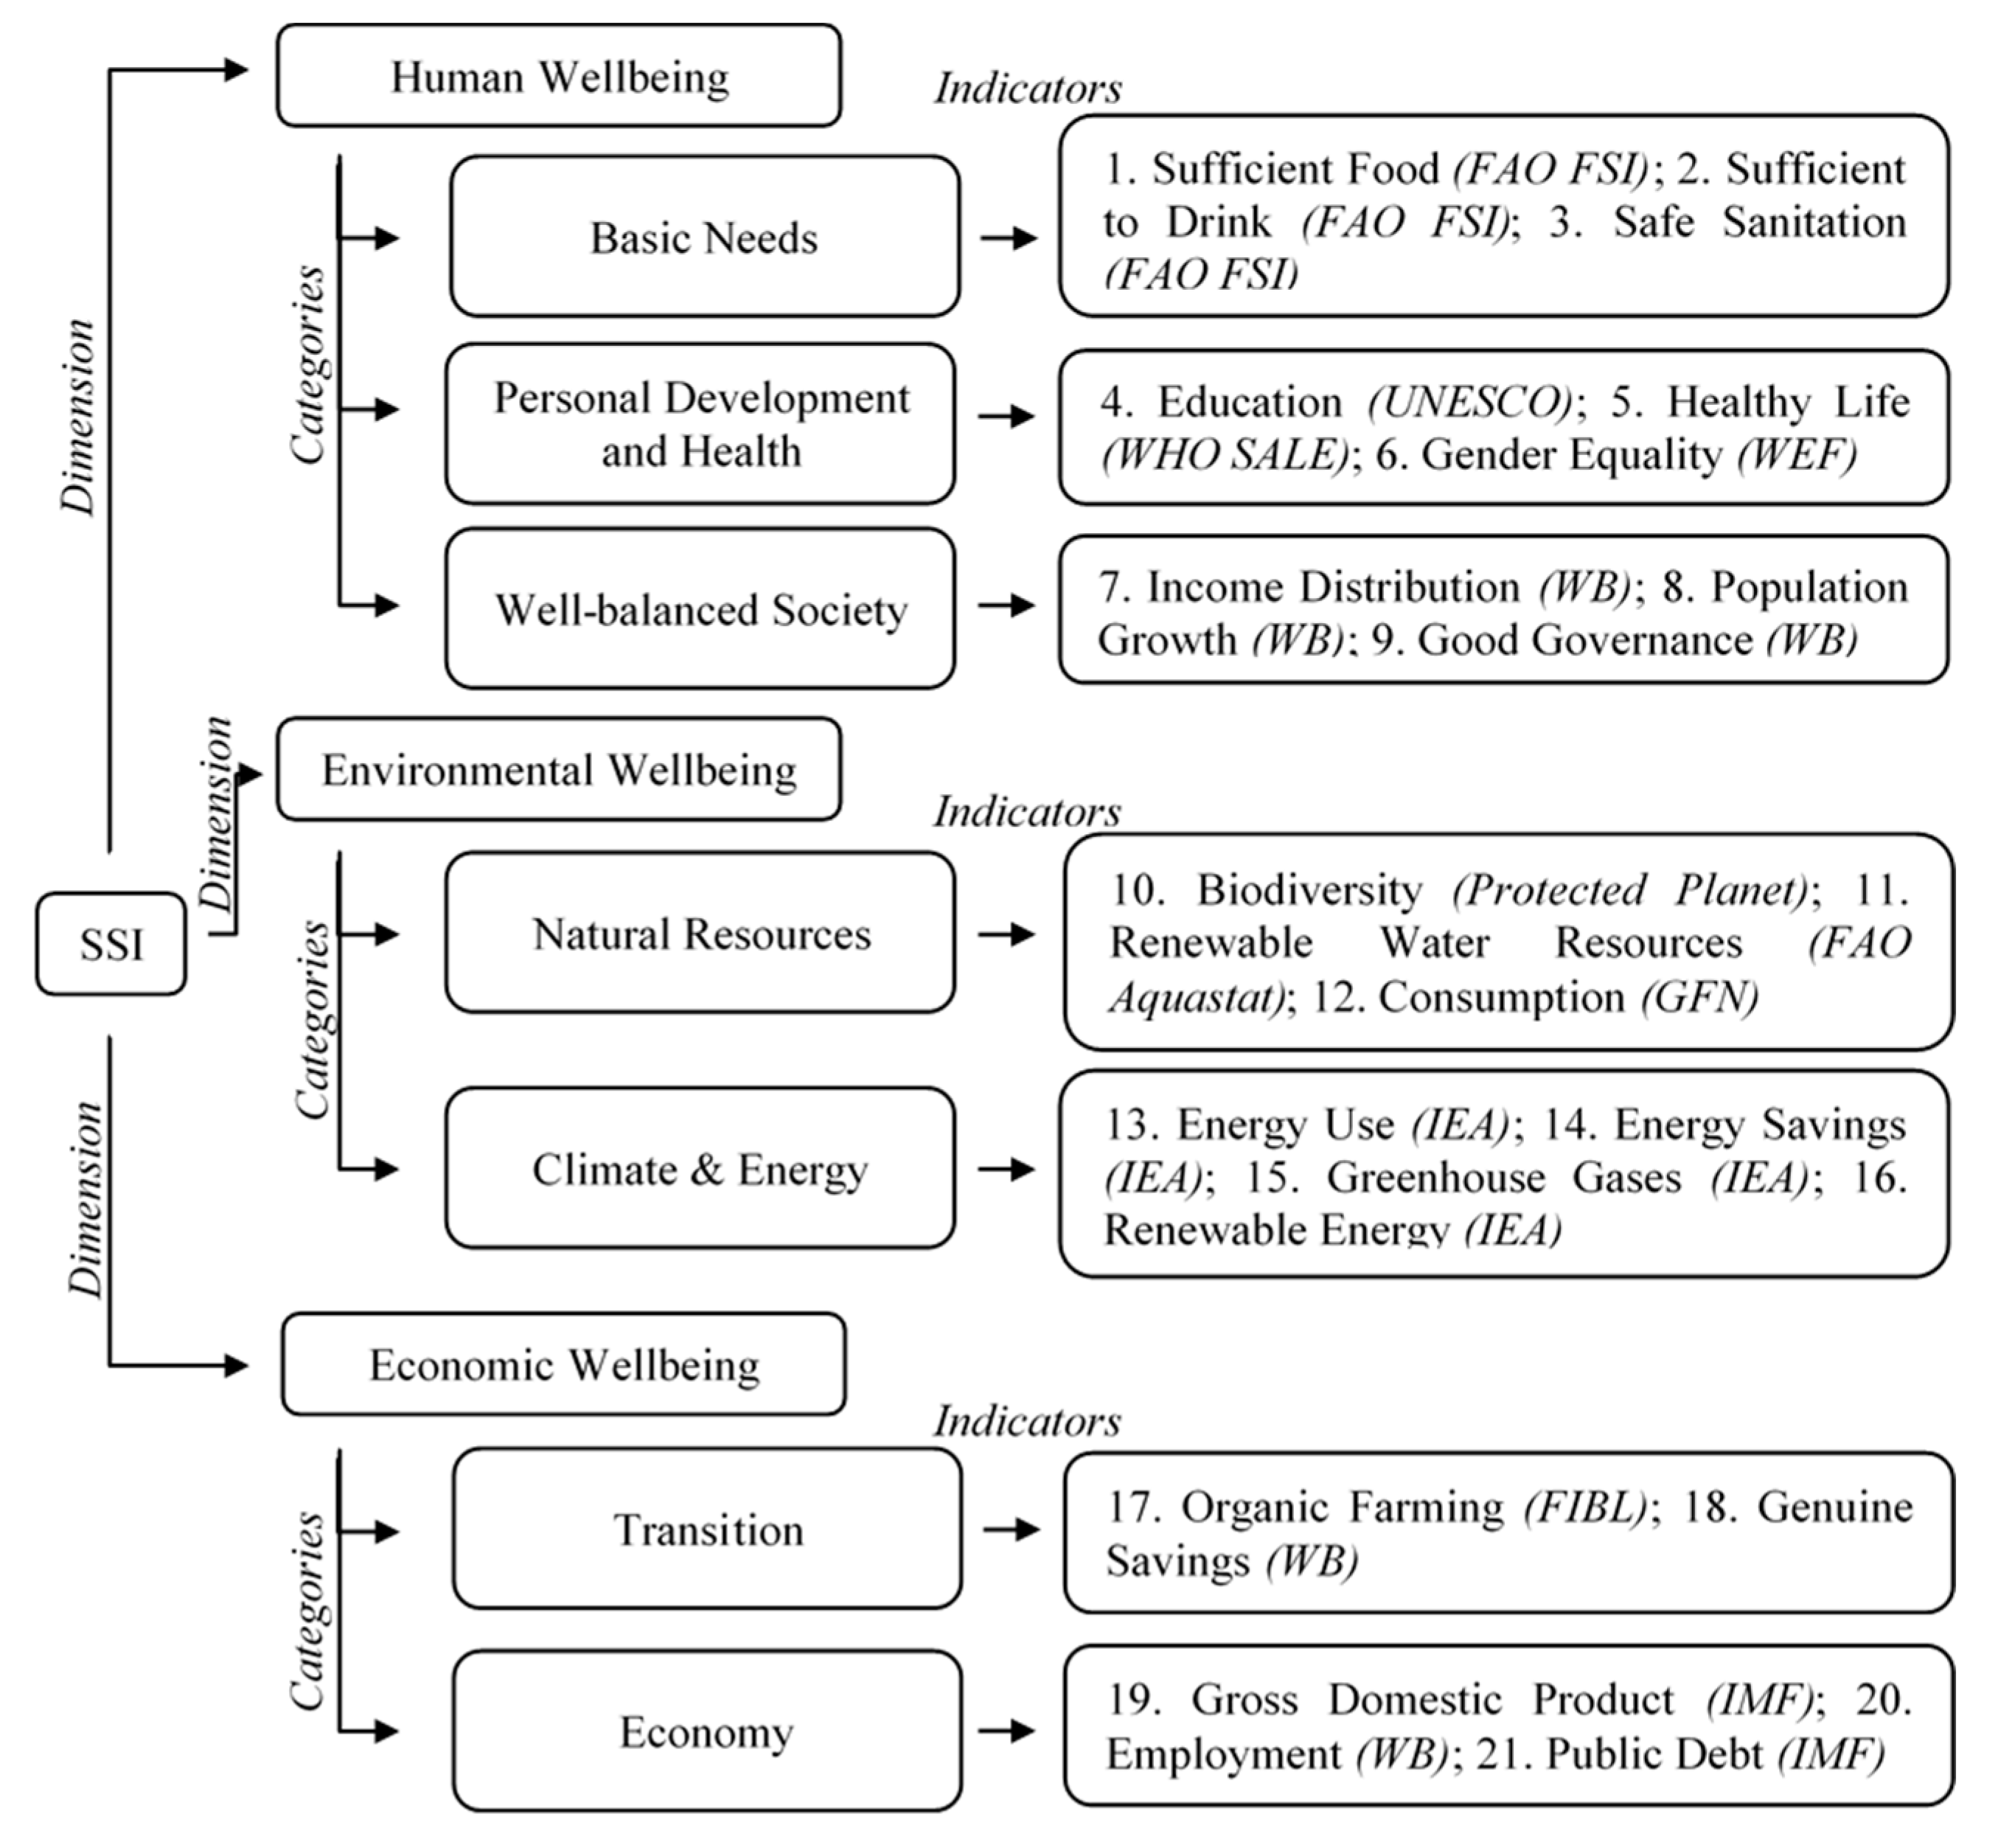
In this context, it is useful to analyze firstly the deeper relations among the components of BN, i.e., SS, SD, SS, and also the ones related to BIODIV: RE_WATER; CONS; EU; ES; GHG; RE_EN, as components of EnvW, and secondly among those of the WbS indicators, i.e., ID; PG; GG, and the abovementioned environmental ones.
Also, although the PDH indicator registers no significant effect on EnvW in both stages of development, we consider it useful to analyze the effects of its components (ED; HL; GE) for finding the potentially significant one that otherwise would be neglected.

4.3. The Effects of the Categories and Indicators of Human Wellbeing on Environmental Wellbeing

(1) The effects of the components of Basic Needs on Environmental Wellbeing
Analysis of the influence of basic needs components shows that, in the first stage of development, two of the three ones are significant, yet differently influence environmental wellbeing (Table 3). Thus, a sufficient quantity of safe drinking water registers positive effects on environmental wellbeing (Coef = 0.177, Sig = 0.095) while, contrary to our expectations, safe sanitation contributes to it in a negative way (Coef = −0.167, Sig = 0.004). A possible explanation is that, while safe sanitation tends to be accomplished at more acceptable levels, it is done without much care on the consequences of this action upon the environment. A deeper overview should be obtained when the analysis takes into consideration the level of safe sanitation and its effects on the components of environmental wellbeing.
These results show that the basic needs components do not have significant effects on environmental wellbeing in the last stage of development, formed by the economies based on innovation and business sophistication (Coef = 1.559 and Sig = 0.119 for SF, Coef = 1.321 and Sig = 0.547 for SD and Coef = 0.895 and Sig = 0.361 for SS). On the contrary, in the factor-driven economies, two of the three components of the basic needs dimension are significant and, unexpectedly, one of them has a negative effect.
(2) Effects of the components of Personal Development and Health on Environmental Wellbeing
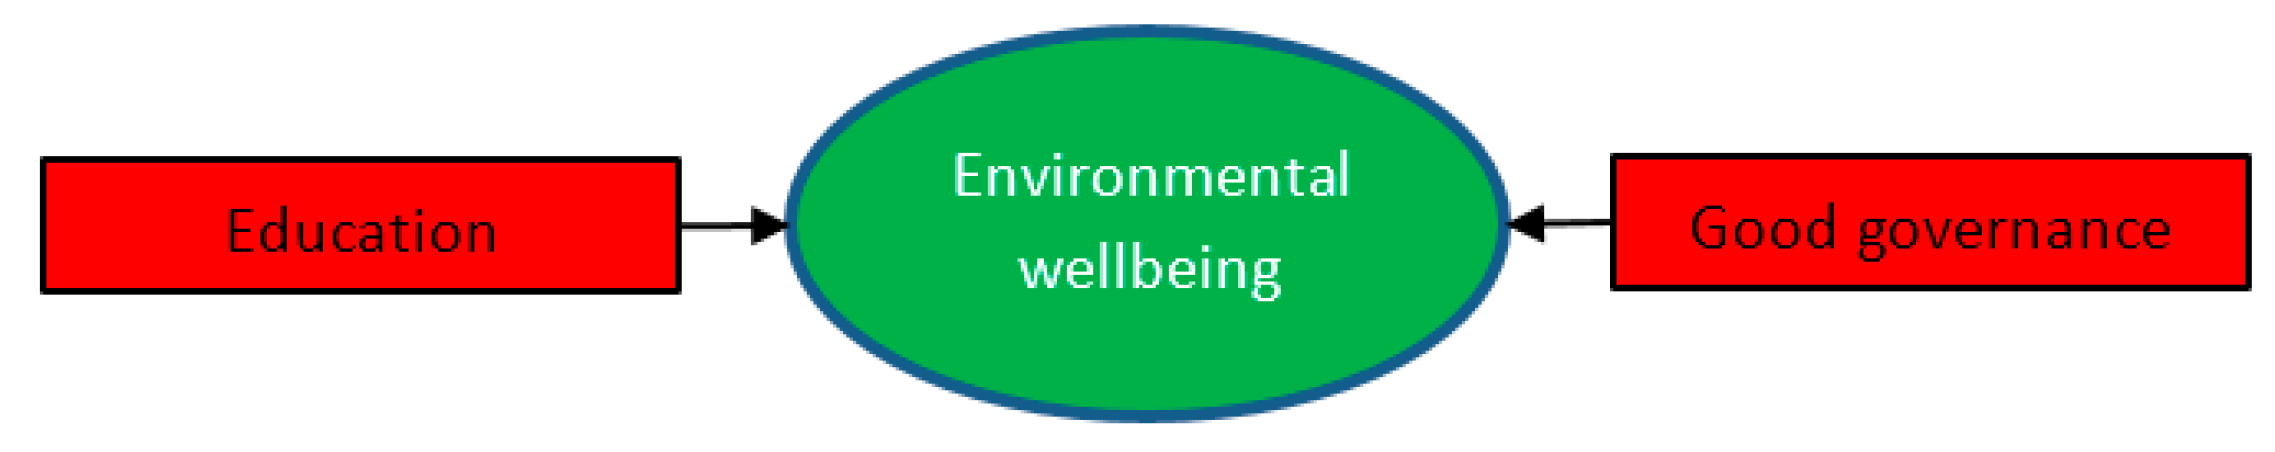
Although PDH does not register a significant influence on EnvW in both stages of development, a more detailed analysis of its components shows that, in stage 1, the HL indicator has a negative effect (Coef = −0.427 and Sig = 0.001) and the GE registers a positive one (Coef = 0.614 and Sig = 0.002), while, in stage 3, besides the positive effect of both mentioned variables on EnvW (Coef = 0.843 and Sig = 0.100 for HL and Coef = 0.990 and Sig = 0.004 for GE), ED also influences it, but in a negative way (Coef = −0.576, Sig = 0.025) (Table 4).
The explanation is based on the fact that ED is measured as ”the combined Gross enrolment ratio” that ”expresses the number of students enrolled in primary, secondary and tertiary levels of education, regardless of age, as a percentage of the population of official school age for the three levels” [99].
In other words, a high percentage of people that are enrolled in education influences in a negative way environmental wellbeing, a possible explanation being that the burden on the environmental resources is higher when people are engaged in educational activities, being especially consumers of resources, not necessarily contributing to the wellbeing of the environment.
However, this issue has to be deeply analyzed to better understand the influence of education on the components of environmental wellbeing.
(3) Effects of the components of a Well-Balanced society on Environmental Wellbeing
We also observed that two of the three components of the WbS indicator influence environmental wellbeing, i.e., PG (negative influence in the first stage of development with Coef = −0.256 and Sig = 0.000 and positive one in the last stage with Coef = 0.406 and Sig = 0.000) and GG (negative influence in the last stage of development with Coef = −0.526 and Sig = 0.007) (Table 5).
As already mentioned, PG registers a different influence on EnvW, if comparing the first and the last stage of development. If, in less developed countries, the relation is the expected one, as a larger number of people puts a higher pressure on natural resources, in innovation-driven economies, the nature of this influence is opposite, with a more numerous population increasing environmental wellbeing.
Consequently, although at first sight, this should be materialized in a harmful effect on the environment, population growth proves to be a beneficial factor in developed societies. What is the argument behind this finding? Is it possible that more people is translated into more innovation and openness towards environmental concern, thus determining better results in terms of environmental wellbeing? The same contradictory finding is the one related to GG, where we expected to find its positive influence on the wellbeing of environment.
On the contrary, in innovation-driven economies, our results indicate a negative value, meaning that a high level of GG determines a decrease of EnvW. To find proper explanations, analysis of the relations among the sub-components of HW and those of EnvW (BIODIV; RE_WATER; CONS; EU; ES; GHG; RE_EN) is also necessary—an aspect to be developed in the following section.
(4) Relation between the indicators of Human Wellbeing and Environmental Wellbeing
The main aim of this section is to concentrate on identifying the sub-components of HW that negatively contribute to EnvW and its dimensions, with aim to observe the weak points to be considered in finding solutions to improve the environmental conditions.
It can be observed that the determining factors are different in terms of stage of development, meaning that the context of national economy (Figure 4, Table 6 and Table 7) should first be considered.

4.4. Influence of Human Wellbeing Indicators on Environmental Wellbeing Indicators

(1) Sufficient food
Related to the basic needs, it can be observed that SF has a significant effect on RE_WATER (Coef = 0.376, Sig < 0.1) and CONS (Coef = −0.507, Sig < 0.01) in the first stage of development, compared to the last stage, where the effect is related to EU (Coef = 4.263, Sig < 0.05). Thus, in factor-driven economies, obtaining a higher level of SF has positive implications on water consumption per year, as a percentage of total available RE_WATER, and also a negative effect on the level of CONS, defined as the difference between ecological footprint—“how much nature we have and how much of it we use”—and carbon footprint—“amount of carbon being emitted” [3]. Consequently, offering a proper level of food within a society based on factors and not on innovation determines a high quantity of consumption of water resources and also a low difference between the ecological footprint and the carbon one, the production of food not paying sufficient attention to the environmental issues, being concentrated instead on attaining its major objective without taking into consideration its consequences on other dimensions.
(2) Safe sanitation
The number of people, as percentage of the total population with sustainable access to improved sanitation, influences negatively the level of RE_WATER (Coef = −0.348, Sig < 0.01) and of RE_EN (Coef = −0.381, Sig < 0.05) in the first stage of development. Contrary to this, in the last stage, the SS indicator influences positively the BIODIV (Coef = 3.216, Sig < 0.1) and the RE_EN (Coef = 4.074, Sig < 0.01). This means that, even if safe sanitation should improve or insignificantly influence environmental wellbeing, a high level of this indicator, as it was registered, affects negatively the environment in the first stage of development of countries.
(3) Education
It can be observed that education plays a more significant role in terms of environmental components in the last stage of development, formed by economies whose progress is based on innovation and business sophistication than in the case of the first stage, where other pillars have to be improved after shifting the focus on this innovation pillar, i.e., institutions, infrastructure, macroeconomic environment, health and, especially, primary education. In this regard, it can be observed that, in factor-driven countries, ED has a negative influence on EU (Coef = −0.126, Sig < 0.05) while, in the innovation-driven ones, it has a negative influence on three indicators of EnvW, i.e., CONS (Coef = −0.945, Sig < 0.05), EU (Coef = −0.801, Sig < 0.1) and RE_EN (Coef = −0.603, Sig < 0.1), relations that support our general finding regarding the effects of education on environmental wellbeing. Consequently, going deeper and trying to understand the nature of these relations, our findings are:
(i)
enrollment of individuals within the education system has a negative effect on the level of CONS, defined as the difference between ecological footprint and carbon footprint;
(ii)
enrollment of individuals within the education system has a negative influence on the level of EU, defined as the sum of production and imports excluding exports, while also taking into consideration the stock changes;
(iii)
equally, the share of energy produced by renewable sources, as percentage of the total energy, is influenced by the level of people involved in educational activities, whose high level determines a low level of RE_EN.
All these findings contribute to a more complete perspective regarding the nature of influence between education and environment wellbeing, emphasizing the environmental components determined by the level of enrollment of individuals within the education system, at national level, in developed countries, namely in innovation-driven economies, whose progress is based on knowledge. In this regard, the nature of educational influence upon the environment appears as significant only in the developed countries, implying an impact on resources and energy consumption. This explains the negative influence, a finding not translated as a negative effect of education on environmental wellbeing, but as a negative one among the number of people involved within education and environment.
(4) Healthy Life
According to the minute analysis performed by taking into consideration the environmental components, the HL indicator maintains the same relation with the environment in each stage of development at the general level. Going deeper, in the first stage, the number of years that a newborn is expected to live minus the number of years spent in poor health influences in a negative way the energy use reduction plan of each factor-driven economy (Coef = −0.902, Sig < 0.01). In the last stage of development, this indicator of life expectancy, which also takes into account the health component, influences in a positive way the energy use (Coef = 1.869, Sig < 0.1), meaning that a high level of the HL indicator translates into lower levels of EU. This means that the innovation-driven economies started to gain the fight with these types of resources, proving to be more efficient, so that a higher number of years a new born is expected to live in a healthy context does not anymore constitute a burden on the environmental dimension.
(5) Gender equality
In both stages of development, GE proves to be a beneficial factor for the environmental components, with the exception of the ES component, upon which its effect is negative. This means that females tend to be less careful about energy use, having, as a consequence, a negative effect on its saving. It is shown that, with less gender equality and fewer women in the common decision-making process, the consumption of energy proves to be lower and, within a period of 4 years, savings are higher. Otherwise, the highly promoted gender equality issues prove to play a positive role in the relation with environmental components, such as: (1) RE_EN (Coef = 0.985, Sig < 0.1) and (2) RE_WATER (Coef = 1.977, Sig < 0.01), in factor-driven economies, and, in the second analyzed case, i.e., that of innovation-driven economies, (1) RE_EN (Coef = 3.068, Sig < 0.01), (2) BIODIV (Coef = 1.092, Sig < 0.05), (3) GHG (Coef = 1.994, Sig < 0.01). This may be explained by the more rational way of thinking of males comparatively to women, which generally tends to put in the center of their decisions the individual wellbeing component [77] (p. 18) at the expense, as also shown in our study, of consumption. Therefore, although women appear to be more wasteful of energy consumption (in the first stage of development), their equality with males is beneficial for other important components, which, as shown by the results of our previous analysis, neutralizes the negative effect and generally positively influences environmental wellbeing.
(6) Income distribution
The ID seems to be related with the water resources, having a negative effect of the level of inequality on the total water withdrawn from the municipal, industrial and agricultural sectors, but only in the first stage of development (Coef = −0.186, Sig < 0.1). This means that, in factor-driven economies, a higher level of inequality is materialized into lower levels of water consumption per year as percentage of total available renewable water resources.
(7) Population Growth
In the first stage of development, PG has a negative influence on BIODIV (Coef = −0.400, Sig < 0.05), ES (Coef = −0.403, Sig < 0.01), GHG (Coef = −0.052, Sig < 0.1) and RE_EN (Coef = −0.403, Sig < 0.01) while, in the last stage of development, it has a positive effect on RE_WATER (Coef = 0.694, Sig < 0.01), CONS (Coef = 0.318, Sig < 0.1) and EU (Coef = 0.625, Sig < 0.01). This may be explained by the fact that, starting with a specific threshold of population density, a growing number of people tends to be harmful for nature, putting pressure on both its resources and quality. This is why especially biodiversity and renewable energy are affected in the first stage of development, while, contrary to our expectations, even within developed societies, population growth positively influences the levels of water resources, consumption and energy use. In the center of this discussion, we think that innovation is the key response, more people being translated into higher possibilities of innovating the green actions and processes.
(8) Good governance
As our results reveal, governance still does not sufficiently concentrate on the environmental components, since the relations between it and environmental wellbeing are negative. This is more obvious as further analysis evidences the negative relations between the GG and some components of the environmental dimension, i.e., CONS (Coef = −0.815, Sig < 0.01), EU (Coef = −0.878, Sig < 0.05) and GHG (Coef = −0.926, Sig < 0.05). These findings help us conclude that the way of governing within innovation-driven economies is still predominantly traditional, much more oriented towards economic results than towards environmental protection [106]. Once this situation appears even in developed countries, the developmental policies related to consumption, energy use and greenhouse gases should be more carefully oriented towards their protection. In this context, a higher level of environmental concern is required even within or, especially, in the case of public servants that have the moral obligation of avoiding the non-optimal waste of national natural resources.

5. Discussion and Conclusions

The rationale of this paper was the belief that the current environmental problems are especially behavioral and social ones. In this way, anthropological environment degradation was studied by confronting (1) HW with its categories (BN, PDH, WbS) and its indicators (i.e., the components of these categories: BN—SF, SD, SS; PDH—ED, HL, GE; WbS—ID, PG and GG), and (2) EnvW, with its categories (NR, and CE) and its indicators (NR – BIODIV, RE_WATER, CONS, and CE—EU, ES, GHG and RE_EN). The central issue of the discussion is the environment, namely, that the relationship between the two parts was from human to environment, with the main aim of observing the effects of the former upon the latter and, based on the observed results, of formulating possible targeted directions of action for a more attentive care of the environment and its main components. Our analysis also discussed the stage of country development, an important issue that can make the difference in a relevant effort of finding out solutions for environmental protection from the perspective of human actions, and their attempt at offering a higher level of individual wellbeing. In this respect, in the case of the least developed countries, stress in the development process has to be firstly laid on issues that have been successfully acquired by the most developed countries. We considered this a pertinent reason for orienting our discussion in two directions, i.e., analysis of the relation between human and environmental wellbeing in the first stage of development, composed by factor-driven economies, and in the last stage, of the innovation-driven economies, with different empirical results and, thus, different recommendations in terms of channels of environmental improvement.
In this way, our results permit drawing of some conclusions that are able to outline the main weak points of the Human wellbeing dimension analyzed in relation to Environmental wellbeing, on which the first exerts pressure.
In the least developed countries, the sanitation conditions, life expectancy at birth, health of the people and population growth factors should be especially considered in sustainable development policies as possible major determinants of environmental wellbeing that negatively affecting its level. Other social components that should not be neglected in factor-driven economies for environmental protection, according to our results, seem to be: the way of obtaining a satisfactory quantity of food for people, the number of individuals enrolled in the education system and the inequality present in the society (Figure 5).
While, in the first case, the components of all three pillars of Human wellbeing (i.e., Basic needs, Personal development and health, Well-balanced society) were found to have a negative relationship with environmental quality and natural resources, in the innovation-driven economies, the major issues to be considered for protecting the environment seem to be education and good governance. It was observed that a high number of people enrolled in the education system and also a high level of good governance still seem to affect in a negative way the environmental dimension. On the basis of the obtained results, we may assert that the solutions to be found should assure reducing the pressure of the individuals within the education system upon the environment, while also determining a high concern regarding the environmental problems among public servants, who have to be more available in offering support to environmental protection actions (Figure 6).
Consequently, lot of work must be done in order to determine a change in this relation of influence, so that the environment should not anymore be negatively influenced by a common tendency of increasing the standard of living within societies. A first possible general conclusion that can be also seen as a possible future and more detailed research can be expressed as follows: as the societies develop, they tend to better protect the environment with its main components, the securement of a high level of human wellbeing in terms of BN (SF, SD, SS), PDH (ED, HL, GE) and a WbS (ID, PG, GG) seeming to be made with less sacrifice in terms of environmental wellbeing. In this way, a future research endeavor may be the one that takes into analysis all the stages of national development, not only the first and the last ones. Moreover, as a second overall conclusion, once the societies develop, the pressure on the environment tends to be shifted from the necessity of offering the basic human needs to that regarding the higher needs of the society, such as education and good governance. Therefore, while the least developed nations have to pay specific attention to issues like population growth, safe sanitation and health as primary channels for better protection of the environment, in the most developed countries the main directions of environmental improvement may be represented by education and good governance, necessarily coordinated with strong, well-defined and clear pro-environmental principles. As a consequence, undoubtedly, a high environmental concern, capable of making substantial difference in this regard, is recommended to be cultivated in the development process, whichever its stage, the difference laying in the attention that has to be directed on diverse and distinct issues of primary interest, as shown within this study.

Author Contributions

Conceptualization, S.-R.U.; methodology, C.C.; formal analysis, S.-R.U., C.M., C.C.; supervision, S.-R.U.; validation, S.-R.U., C.M., C.C.; writing—original draft preparation, S.-R.U., C.M., C.C.; writing—review and editing, S.-R.U., C.M., C.C. All authors have read and agreed to the published version of the manuscript.

Funding

This work was supported by a grant of the “Alexandru Ioan Cuza” University of Iasi, within the Research Grants program, Grant UAIC, code GI-UAIC-2020-06.

Conflicts of Interest

The authors declare no conflict of interest.

References

  1. Costanza, R.; Cumberland, J.H.; Daly, H.; Goodland, R.; Norgaard, R.B.; Kubiszewski, I.; Franco, C. An Introduction to Ecological Economics; CRC Press, Taylor & Francis Group: London, UK, 2015. [Google Scholar]
  2. Wackernagel, M.; Rees, E.W. Our Ecological Footprint. Reducing Human Impact on the Earth; New Society Publishers: Gabriola Island, CA, USA, 1995. [Google Scholar]
  3. Van de Kerk, G.; Manuel, A. Sustainable Society Index—Your Compass to Sustainability; Sustainable Society Foundation: Hague, The Netherlands, 2017; Available online: http://www.ssfindex.com/ (accessed on 23 May 2019).
  4. Ayres, R.; Van den Berrgh, J.; Gowdy, J. Strong versus weak sustainability: Economics, natural sciences, and consilience. Environ. Ethics 2001, 23, 155–168. [Google Scholar] [CrossRef]
  5. Dietz, S.; Neumayer, E. Weak and strong sustainability in the SEEA: Concepts and measurement. Ecol. Econ. 2007, 61, 617–626. [Google Scholar] [CrossRef] [Green Version]
  6. Hediger, W. Weak and strong sustainability, environmental conservation and economic growth. Nat. Res. Modeling 2006, 19, 359–394. [Google Scholar] [CrossRef]
  7. Harvey, M.T.; Bell, P.A. The Moderating Effect of Threat on the Relationship Between Population Concern and Environmental Concern. Pop. Environ. A J. Interdiscip. Stud. 1995, 17, 123–133. [Google Scholar] [CrossRef]
  8. Strange, T.; Bayley, A. Sustainable Development: Linking Economy, Society, Environment; OECD: Paris, France, 2008. [Google Scholar]
  9. Banerjee, S.B. Who sustains whose development? Sustainable development and the reinvention of nature. Organ. Stud. 2003, 24, 143–180. [Google Scholar] [CrossRef]
  10. Robinson, J. Squaring the circle? Some thoughts on the idea of sustainable development. Ecol. Econ. 2004, 48, 369–384. [Google Scholar] [CrossRef]
  11. Sneddon, C.; Howarth, R.B.; Norgaard, R.B. Sustainable development in a post-Brundtland world. Ecol. Econ. 2006, 57, 253–268. [Google Scholar] [CrossRef]
  12. Casper, J.K. Greenhouse Gases: Worldwide Impacts; Infobase Publishing: New York, NY, USA, 2010. [Google Scholar]
  13. Gaston, K.J. Global patterns in biodiversity. Nature 2000, 405, 220–227. [Google Scholar] [CrossRef]
  14. Gardner, G.T.; Stern, P.C. Environmental Problems and Human Behavior; Allyn and Bacon: Boston, MA, USA, 1996. [Google Scholar]
  15. Pohoață, I. Economic Philosophy and the Policies of Sustainable Development; Economic Print: Bucharest, Romania, 2003. [Google Scholar]
  16. Friedman, T.L. Hot, Flat, and Crowded. Why the World Needs a Green Revolution—And How We Can Renew Our Global Future; Farrar, Straus and Giroux: New York, NY, USA, 2010. [Google Scholar]
  17. Schwab, A.K. The Global Competitiveness Report 2016–2017; World Economic Forum: Colony, Switzerland, 2016. [Google Scholar]
  18. Eviner, V.T.; Naylor, R.L.; Vitousek, P.M.; Reynolds, H.L.; Hooper, D.U.; Lavorel, S.; Sala, O.E.; Hobbie, S.E.; Chapin, F.S., III; Zavaleta, E.S. Consequences of changing biodiversity. Nature 2000, 405, 234–242. [Google Scholar] [CrossRef]
  19. Dasgupta, S.; Laplante, B.; Wang, H.; Wheeler, D. Confronting the environmental Kuznets curve. J. Econ. Perspect. 2002, 16, 147–168. [Google Scholar] [CrossRef] [Green Version]
  20. Ekins, P. The Kuznets curve for the environment and economic growth: Examining the evidence. Environ. Plan. 1997, 29, 805–830. [Google Scholar] [CrossRef] [Green Version]
  21. Dinda, S. Environmental Kuznets curve hypothesis: A survey. Ecol. Econ. 2004, 49, 431–455. [Google Scholar] [CrossRef] [Green Version]
  22. Dogan, E.; Inglesi-Lotz, R. The impact of economic structure to the environmental Kuznets curve (EKC) hypothesis: Evidence from European countries. Environ. Sci. Pollut. Res. 2020, 27, 12717–12724. [Google Scholar] [CrossRef]
  23. Stern, D.I.; Common, M.S.; Barbier, E.B. Economic growth and environmental degradation: The environmental Kuznets curve and sustainable development. World Dev. 1996, 24, 1151–1160. [Google Scholar] [CrossRef]
  24. Stern, D.I. Progress on the environmental Kuznets curve? Environ. Dev. Econ. 1998, 3, 173–196. [Google Scholar] [CrossRef]
  25. Yandle, B.; Bhattarai, M.; Vijayaraghavan, M. Environmental Kuznets Curves: A Review of Findings, Methods, and Policy Implications. PERC Res. Study 2004, 02-1, 1–38. [Google Scholar]
  26. Stern, D.I. The rise and fall of the environmental Kuznets curve. World Dev. 2004, 32, 1419–1439. [Google Scholar] [CrossRef]
  27. Özokcu, S.; Özdemir, O. Economic growth, energy, and environmental Kuznets curve. Renew. Sustain. Energy Rev. 2017, 72, 639–647. [Google Scholar] [CrossRef]
  28. Chen, X.; Huang, B.; Lin, C.T. Environmental awareness and environmental Kuznets curve. Econ. Model. 2019, 77, 2–11. [Google Scholar] [CrossRef]
  29. Shahbaz, M.; Sinha, A. Environmental Kuznets curve for CO2 emissions: A literature survey. Mpra Pap. 2019, 86281, 1–82. [Google Scholar] [CrossRef] [Green Version]
  30. Sarkodie, S.A.; Strezov, V. A review on environmental Kuznets curve hypothesis using bibliometric and meta-analysis. Sci. Total Environ. 2019, 649, 128–145. [Google Scholar] [CrossRef] [PubMed]
  31. Sarkodie, S.A.; Ozturk, I. Investigating the environmental Kuznets curve hypothesis in Kenya: A multivariate analysis. Renew. Sustain. Energy Rev. 2020, 117, 109481. [Google Scholar] [CrossRef]
  32. Chen, Q.; Taylor, D. Economic development and pollution emissions in Singapore: Evidence in support of the Environmental Kuznets Curve hypothesis and its implications for regional sustainability. J. Clean. Prod. 2020, 243, 118637. [Google Scholar] [CrossRef]
  33. Costanza, R.; Daly, L.; Fioramonti, L.; Giovannini, E.; Kubiszewski, I.; Mortensen, L.F.; Wilkinson, R. Modelling and measuring sustainable wellbeing in connection with the UN Sustainable Development Goals. Ecol. Econ. 2016, 130, 350–355. [Google Scholar] [CrossRef]
  34. Burke, T.A.; Cascio, W.E.; Costa, D.L.; Deener, K.; Fontaine, T.D.; Fulk, F.A.; Jackson, L.E.; Munns, W.R., Jr.; Orme-Zavaleta, J.; Slimak, M.W.; et al. Rethinking environmental protection: Meeting the challenges of a changing world. Environ. Health Persp. 2017, 125, A43–A49. [Google Scholar] [CrossRef] [Green Version]
  35. Dunlap, R.E.; Scarce, R. Poll trends: Environmental problems and protection. Public Opin. Q. 1991, 55, 651–672. [Google Scholar] [CrossRef]
  36. Barrett, C.B.; Bevis, L.E.M. The self-reinforcing feedback between low soil fertility and chronic poverty. Nat. Geosci. 2015, 8, 907–912. [Google Scholar] [CrossRef]
  37. Steffen, W.; Richardson, K.; Rockstrom, J.; Cornell, S.E.; Fetzer, I.; Bennett, E.M.; Biggs, R.; Carpenter, S.R.; de Vries, W.; de Wit, C.A.; et al. Planetary boundaries: Guiding human development on a changing planet. Science 2015, 347, 1259855. [Google Scholar] [CrossRef] [Green Version]
  38. Boonstra, W.J.; Björkvik, E.; Haider, L.J.; Masterson, V. Human responses to social-ecological traps. Sustain. Sci. 2016, 11, 877–889. [Google Scholar] [CrossRef] [Green Version]
  39. Allin, P.; Hand, D.J. The Wellbeing of Nations Meaning, Motive, and Measurement; John Wiley & Sons Ltd.: West Sussex, UK, 2014. [Google Scholar]
  40. Pearce, D.W.; Dominic, M. The Economic Value of Biodiversity; Earthscan: London, UK, 1994. [Google Scholar]
  41. Pereira, H.M.; Ferrier, S.; Walters, M.; Geller, G.N.; Jongman, R.H.G.; Scholes, R.J.; Bruford, M.W.; Brummitt, N.; Butchart, S.H.M.; Cardoso, A.C.; et al. Essential biodiversity variables. Science 2013, 339, 277–278. [Google Scholar] [CrossRef] [Green Version]
  42. Kundzewim, Z.W. Some for all, forever—Sustainable development and management of water resources. Intern. J. Sust. Dev. World Ecol. 2001, 8, 290–298. [Google Scholar] [CrossRef]
  43. Loucks, D.P. Sustainable water resources management. Water Int. 2000, 25, 3–10. [Google Scholar] [CrossRef]
  44. Mariolakos, I. Water resources management in the framework of sustainable development. Desalination 2007, 213, 147–151. [Google Scholar] [CrossRef]
  45. Golubev, G.N. Sustainable management of water resources: A basin wide approach. Int. J. Water Res. Dev. 1988, 4, 219–223. [Google Scholar] [CrossRef]
  46. Costanza, R. The dynamics of the ecological footprint concept. Ecol. Econ. 2000, 32, 341–345. [Google Scholar] [CrossRef]
  47. Wackernagel, M.; Silverstein, J. Big things first: Focusing on the scale imperative with the ecological footprint. Ecol. Econ. 2000, 32, 391–394. [Google Scholar] [CrossRef]
  48. Moan, J.L.; Smith, Z.A. Energy Use Worldwide: A Reference Handbook; ABC-CLIO: Santa Barbara, CA, USA, 2007. [Google Scholar]
  49. Hinrichs, R.A.; Kleinbach, M.H. Energy: Its Use and the Environment; Brooks/Cole Cengage Learning: Boston, MA, USA, 2012. [Google Scholar]
  50. Hill, R.; O’Keefe, P.; Snape, C. The Future of Energy Use; Earthscan: London, UK, 1995. [Google Scholar]
  51. International Energy Agency. Energy Use in the New Millennium: Trends in IEA Countries; OECD Publishing: Paris, France, 2007. [Google Scholar]
  52. Samuelson, C.D. Energy conservation. A social dilemma approach. Soc. Behav. 1990, 5, 207–230. [Google Scholar]
  53. Poortinga, W.; Steg, L.; Vlek, C.; Wiersma, G. Household preferences for energy-saving measures: A conjoint analysis. J. Econ. Psychol. 2003, 24, 49–64. [Google Scholar] [CrossRef]
  54. Hernández-Santoyo, J.; Sánchez-Cifuentes, A. Trigeneration: An alternative for energy savings. Appl. Energy 2003, 76, 219–227. [Google Scholar] [CrossRef]
  55. Olson, M.E. Consumer attitudes towards energy conservation. J. Soc. Issues 1981, 37, 108–131. [Google Scholar] [CrossRef]
  56. Stern, P.C. What psychology knows about energy conservation. Am. Psychol. 1992, 47, 1224–1232. [Google Scholar] [CrossRef]
  57. Georg, S. The social shaping of household consumption. Ecol. Econ. 1999, 28, 455–466. [Google Scholar] [CrossRef]
  58. Abrahamse, W.; Steg, L. How do socio-demographic and psychological factors relate to households’ direct and indirect energy use and savings? J. Econ. Psychol. 2009, 30, 711–720. [Google Scholar] [CrossRef]
  59. Matthews, W.A.; Wood, S.; Connor, B. Sustainability and greenhouse gases: What are the issues for New Zealand? Environ. Model. Softw. 2007, 22, 288–296. [Google Scholar] [CrossRef]
  60. Twidell, J.; Weir, T. Renewable Energy Resources; Routledge: London, UK, 2015. [Google Scholar]
  61. Girardet, H.; Mendonça, M. A Renewable World: Energy, Ecology and Equality. A Report for the World Future Council; Green Books & Resurgence Books: London, UK, 2009. [Google Scholar]
  62. Mallon, K. Renewable Energy Policy and Politics: A Handbook for Decision-Making; Earthscan: London, UK, 2006. [Google Scholar]
  63. Fornasiero, P.; Graziani, M. Renewable Resources and Renewable Energy: A Global Challenge; CRC Press: New York, NY, USA, 2011. [Google Scholar]
  64. FAO; IFAD; UNICEF; WFP; WHO. The State of Food Security and Nutrition in the World 2018. Building Climate Resilience for Food Security and Nutrition; FAO: Rome, Italy, 2018. [Google Scholar]
  65. Sen, A.K. Development as Freedom; Oxford University Press: New York, NY, USA, 1999. [Google Scholar]
  66. Hurni, H.; Giger, M.; Liniger, H.; Studer, R.M.; Messerli, P.; Portner, B.; Schwilch, G.; Wolfgramm, B.; Breu, T. Soils, agriculture and food security: The interplay between ecosystem functioning and human well-being. Curr. Opin. Environ. Sustain. 2015, 15, 25–34. [Google Scholar] [CrossRef]
  67. Cheng, X.; Shuai, C.; Liu, J.; Wang, J.; Liu, Y.; Li, W.; Shuai, J. Topic modelling of ecology, environment, and poverty nexus: An integrated framework. Agric. Ecosyst. Environ. 2018, 267, 1–14. [Google Scholar] [CrossRef]
  68. Feitelson, E.; Chenoweth, J. Water poverty: Towards a meaningful indicator. Water Policy 2002, 4, 263–281. [Google Scholar] [CrossRef]
  69. Duncan, M.; Lane, J.; Scott, B.; Trouba, D. Sanitation and health. PLoS Med. 2010, 7, e1000363. [Google Scholar] [CrossRef] [Green Version]
  70. Paraschiv, E. Problema sărăciei în comunităţile urbane şi rurale din România [engl. The problem of poverty in urban and rural communities from Romania]. Rom. J. Sociol. 2008, XIX, 423–451. [Google Scholar]
  71. Jāhāna, S. Human Development Report 2016: Human Development for Everyone; United Nations Development Programme: New York, NY, USA, 2016. [Google Scholar]
  72. Kanbur, R.; Squire, L. The evolution of thinking about poverty: Exploring the interactions. Front. Dev. Econ. Future Perspect. 2011, 183–226. [Google Scholar] [CrossRef]
  73. Kemmelmeier, M.; Krol, G.; Kim, Y.H. Values, economics, and pro-environmental attitudes in 22 societies. Cross-Cult. Res. 2002, 36, 256–285. [Google Scholar] [CrossRef]
  74. Poortinga, W.; Steg, L.; Vlek, C. Values, environmental concern, and environmental behavior: A study into household energy use. Environ. Behav. 2004, 36, 70–93. [Google Scholar] [CrossRef]
  75. Turaga, R.M.R. Does Economy Matter for Public Support for Environmental Protection? Evidence from India; Indian Institute of Management Ahmedabad: Ahmedabad, India, 2015. [Google Scholar]
  76. Căutişanu, C.; Asandului, L.; Borza, M.; Turturean, C.I. Quantitative approach to circular economy in the OECD countries. Amfiteatru Econ. J. 2018, 20, 262–277. [Google Scholar] [CrossRef]
  77. Ulman, S.R. Study on general awareness regarding the problem of environmental degradation. CES Work. Pap. 2018, 10, 1–26. [Google Scholar]
  78. Ulman, S.R.; Dobay, K.M. Environmental Protection in Romania: Perceptions Versus Active Participation. Environ. Eng. Manag. J. 2020, 19, 183–194. [Google Scholar]
  79. World Bank. The Worldwide Governance Indicators (WGI). Available online: https://info.worldbank.org/governance/wgi/ (accessed on 19 August 2019).
  80. Jourova, V. Report on Equality between Women and Men; European Commission, Justice and Consumers: Luxembourg, 2015. [Google Scholar]
  81. Bock, B.B.; Shortall, S. Rural Gender Relations: Issues and Case Studies; CABI Publishing: Wallingford, UK, 2006. [Google Scholar]
  82. Fraser, N. Feminist Politics in the Age of Recognition: A Two-Dimensional Approach to Gender Justice. Stud. Soc. Justice 2007, 1, 23–35. [Google Scholar] [CrossRef]
  83. Kabeer, N. Gender equality and women’s empowerment: A critical analysis of the third millennium development goal 1. Gend. Dev. 2005, 13, 13–24. [Google Scholar] [CrossRef]
  84. Agarwal, B. Conceptualizing environmental collective action: Why gender matters. Camb. J. Econ. 2000, 24, 283–310. [Google Scholar] [CrossRef] [Green Version]
  85. Dlamini, S.; Tesfamichael, S.G.; Shiferaw, Y.; Mokhele, T. Determinants of Environmental Perceptions and Attitudes in a Socio-Demographically Diverse Urban Setup: The Case of Gauteng Province, South Africa. Sustainability 2020, 12, 3613. [Google Scholar] [CrossRef]
  86. Sen, A.K. Inequality Reexamined; Oxford University Press: New York, NY, USA, 2006. [Google Scholar]
  87. Galbraith, J.K. Despre Inegalitate. Teoria Inegalității Economice pe înțelesul Tuturor [engl. Inequality: What Everyone Needs to Know]; Publica: Bucharest, Romania, 2016. [Google Scholar]
  88. Minsky, H.P. John Maynard Keynes; McGraw Hill: New York, NY, USA, 2008. [Google Scholar]
  89. Boyce, J.K. Inequality as a cause of environmental degradation. Ecol. Econ. 1994, 11, 169–178. [Google Scholar] [CrossRef] [Green Version]
  90. Marsiliani, L.; Renström, T.I. Inequality, environmental protection and growth. Feem Work. Pap. 2000, 36. [Google Scholar] [CrossRef] [Green Version]
  91. Ravallion, M.; Heil, M.; Jalan, J. Carbon emissions and income inequality. Oxf. Econ. Pap. 2000, 52, 651–669. [Google Scholar] [CrossRef]
  92. Scruggs, L.A. Political and economic inequality and the environment. Ecol. Econ. 1998, 26, 259–275. [Google Scholar] [CrossRef]
  93. Borghesi, S. Income inequality and the environmental Kuznets curve. Environment, inequality and collective action. Fond. Eni Enrico Mattei 2006, 83, 1–33. [Google Scholar]
  94. Mazzucato, V.; Niemeijer, D. Population growth and the environment in Africa: Local informal institutions, the missing link. Econ. Geogr. 2002, 78, 171–193. [Google Scholar] [CrossRef]
  95. Weiss, T.G. Governance, Good Governance, and Global Governance: Conceptual and Actual Challenges. Third World Q. 2000, 21, 795–814. [Google Scholar] [CrossRef]
  96. Grindle, M.S. Good enough governance revisited. Dev. Policy Rev. 2007, 25, 533–574. [Google Scholar] [CrossRef]
  97. Mavragani, A.; Nikolaou, I.E.; Tsagarakis, K.P. Open Economy, Institutional Quality, and Environmental Performance: A Macroeconomic Approach. Sustainability 2016, 8, 601. [Google Scholar] [CrossRef] [Green Version]
  98. Daly, H.E.; Cobb, J.B. For the Common Good: Redirecting the Economy toward Community, the Environment, and a Sustainable Future; Beacon Press: Boston, MA, USA, 1989. [Google Scholar]
  99. Van de Kerk, G.; Manuel, A.R. Sustainable Society Index-SSI 2012; Sustainable Society Foundation: The Haag, The Netherlands, 2012. [Google Scholar]
  100. Esty, D.; Levy, M.; Srebotnjak, T.; De Sherbinin, A.; Kim, C.; Anderson, B. Pilot 2006 Environmental Performance Index; Yale Center for Environmental Law & Policy: New Haven, CT, USA, 2006. [Google Scholar]
  101. Ewing, B.; Moore, D.; Goldfinger, S.; Oursler, A.; Reed, A.; Wackernagel, M. The Ecological Footprint Atlas 2010; Global Footprint Network: Oakland, CA, USA, 2010. [Google Scholar]
  102. UNDP. Human Development Report 2014—Sustaining Human Progress: Reducing Vulnerabilities and Building Resilience; United Nations Development Program: New York, NY, USA, 2014. [Google Scholar]
  103. Gallego-Álvarez, I.; Galindo-Villardón, M.P.; Rodríguez-Rosa, M. Analysis of the Sustainable Society Index Worldwide: A Study from the Biplot Perspective. Soc. Indic. Res. 2015, 120, 29–65. [Google Scholar] [CrossRef]
  104. Shumacker, R.E.; Lomax, R.G. A Beginner’s Guide to Structural Equation Modeling; Routledge: New York, NY, USA, 2016. [Google Scholar]
  105. Wolfle, L.M. An introduction to path analysis. Mult. Linear Regres. Viewp. 1977, 8, 36–61. [Google Scholar]
  106. Stratan, A.; Căutișanu, C.; Hatmanu, M.; Mihai, C. Environmental protection in the context of sustainable development. Comparative analysis across EU countries. USV Ann. Econ. Public Adm. 2018, 18, 45–57. [Google Scholar]
Figure 1. The Sustainable Society Index (SSI) framework [99].
Sustainability 12 08106 g001
Figure 2. The effects of Human Wellbeing on Environmental Wellbeing. Legend: green lines—significant and positive effects, red lines—significant and negative effects, gray lines—insignificant effects. Source: SSI database, computed in StataMP 13.0 and UCINET 6.
Sustainability 12 08106 g002
Figure 3. The effects of Human Wellbeing categories on Environmental Wellbeing. Legend: green lines—significant and positive effects, red lines—significant and negative effects, gray lines—insignificant effects. Source: SSI database, computed in StataMP 13.0 and UCINET 6.
Sustainability 12 08106 g003
Figure 4. Effects of Human Wellbeing indicators on Environmental Wellbeing and on its indicators in the first and third stage of development. Legend: green lines—significant and positive effects, red lines—significant negative effects, gray lines—insignificant effects. Source: SSI database, computed in StataMP 13.0 and UCINET6.
Sustainability 12 08106 g004
Figure 5. Channels of improving Environmental wellbeing in factor-driven economies.
Sustainability 12 08106 g005
Figure 6. Channels of improving Environmental wellbeing in innovation-driven economies.
Sustainability 12 08106 g006
Table 1. Countries included in stages 1 and 3 according to Global Competitiveness Report 2016–2017.
STAGE 1: Factor-Driven CountriesSTAGE 3: Innovation-Driven Countries
BangladeshMaliAustraliaMalta
Burkina FasoMauritaniaAustriaNetherlands
BurundiMozambiqueBelgiumNew Zealand
CambodiaMyanmarCanadaNorway
CameroonNepalCyprusPortugal
ChadNicaraguaCzech RepublicQatar
Cote d’IvoireNigeriaDenmarkSingapore
EthiopiaPakistanEstoniaSlovak Republic
GambiaRwandaFinlandSlovenia
GhanaSenegalFranceSpain
GuineaSierra LeoneGermanySweden
HaitiTajikistanGreeceTaiwan
IndiaTanzaniaIcelandTrinidad and Tobago
KenyaUgandaIrelandUnited Kingdom
Kyrgyz RepublicVietnamIsraelUnited States
LaosYemenItaly
LesothoZambiaJapan
MadagascarZimbabweKorea, South
Malawi Luxembourg
Table 2. Differences between stages of development regarding the effects of Human Wellbeing categories on Environmental Wellbeing.
Dependent VariableIndependent VariableEffects
STAGE 1STAGE 3
EnvWHWNegativePositive
BNNegativeInsignificant
PDHInsignificantInsignificant
WbSNegativePositive
Table 3. Differences between stages of development regarding the effects of Basic Needs components on Environmental Wellbeing.
Dependent VariableIndependent VariableEffects
STAGE 1STAGE 3
EnvWBNNegativeInsignificant
SFInsignificantInsignificant
SDPositiveInsignificant
SSNegativeInsignificant
Table 4. Differences between stages of development regarding the effects of Personal Development and Health components on Environmental Wellbeing.
Dependent VariableIndependent VariableEffects
STAGE 1STAGE 3
EnvWPDHInsignificantInsignificant
EDInsignificantNegative
HLNegativePositive
GEPositivePositive
Table 5. Differences between stages of development regarding the effects of Well-balanced Society components on Environmental Wellbeing.
Dependent VariableIndependent VariableEffects
STAGE 1STAGE 3
EnvWWbSNegativePositive
IDInsignificantInsignificant
PGNegativePositive
GGInsignificantNegative
Table 6. Estimated Models in Stage 1 of development.
STAGE 1NRCE
BIODIVRE_WATERCONSEUESGHGRE_EN
(Constant)−4.206 a−3.4205.543 **9.537 ***19.272 ***10.421 ***7.281 *
(3.858) b(3.282)(2.200)(0.602)(3.072)(0.699)(3.870)
[0.276] c[0.297][0.012][0.000][0.000][0.000][0.060]
BN
SF−0.2400.376 *−0.507 ***0.005−0.0610.010−0.015
(0.259)(0.220)(0.148)(0.040)(0.206)(0.047)(0.260)
[0.354][0.089][0.001][0.900][0.766][0.821][0.953]
SD0.304−0.1270.353 **−0.029−0.003−0.063−0.080
(0.287)(0.244)(0.163)(0.044)(0.228)(0.520)(0.287)
[0.289][0.601][0.031][0.506][0.986][0.226][0.779]
−0.132−0.348 ***0.0260.0360.088−0.028−0.381 **
(0.157)(0.133)(0.089)(0.024)(0.125)(0.028)(0.158)
[0.401][0.009][0.764][0.136][0.479][0.324][0.016]
PDH
ED0.345−0.1310.165−0.126 **−0.392−0.0550.192
(0.343)(0.291)(0.195)(0.053)(0.273)(0.062)(0.344)
[0.314][0.653][0.398][0.018][0.150][0.374][0.575]
HL0.292−0.1110.031−0.064−0.902 ***−0.090−0.521
(0.351)(0.299)(0.200)(0.054)(0.279)(0.063)(0.352)
[0.405][0.710][0.874][0.238][0.001][0.158][0.139]
GE0.7651.977 ***0.3180.032−1.132 ***0.1050.985 *
(0.541)(0.460)(0.308)(0.084)(0.431)(0.098)(0.543)
[0.157][0.000][0.302][0.698][0.009][0.283][0.070]
WbS
ID0.121−0.186 *0.0980.022−0.006−0.014−0.152
(0.117)(0.099)(0.066)(0.018)(0.093)(0.021)(0.117)
[0.300][0.062][0.140][0.227][0.947][0.483][0.196]
PG−0.400 **0.108−0.0480.004−0.403 ***−0.052 *−0.297 *
(0.176)(0.149)(0.100)(0.027)(0.140)(0.031)(0.176)
[0.023][0.467][0.627][0.859][0.004][0.102][0.092]
GG0.6230.132−0.2780.125 *0.3980.010−0.344
(0.467)(0.397)(0.266)(0.072)(0.371)(0.084)(0.468)
[0.183][0.739][0.295][0.084][0.284][0.899][0.462]
Notes: a denotes the coefficients from the estimated models; b denotes the standard error specific to each coefficient from the estimated models; c denotes the p-value associated to each coefficient from the estimated models. ***, **, * denote statistical significance at 1%, 5% and 10% level. Source: SSI database, computed in StataMP 13.0.
Table 7. Estimated Models in Stage 3 of development.
STAGE 3NRCE
BIODIVRE_WATERCONSEUESGHGRE_EN
(Constant)–27.645 a18.55216.440–79.91***–34.523–78.32 ***–26.242
(27.357) b(28.446)(23.966)(28.292)(42.521)(28.516)(21.000)
[0.312] c[0.514][0.493][0.005][0.417][0.006][0.211]
BN
SF–2.706–0.7822.2934.263 **2.3932.156–0.768
(1.849)(1.922)(1.619)(1.912)(2.874)(1.927)(1.419)
[0.143][0.684][0.157][0.026][0.405][0.263][0.588]
SD2.574–1.414–3.0945.4661.5932.938–2.722
(4.054)(4.216)(3.552)(4.193)(6.302)(4.226)(3.112)
[0.525][0.737][0.384][0.192][0.800][0.487][0.382]
SS3.216 *0.3520.350–2.094–1.2831.7044.074 ***
(1.810)(1.882)(1.585)(1.872)(2.813)(1.887)(1.389)
[0.076][0.851][0.825][0.263][0.648][0.366][0.003]
PDH
ED–0.303–0.258–0.945 **–0.801 *–0.600–0.653–0.603 *
(0.475)(0.494)(0.416)(0.491)(0.738)(0.495)(0.364)
[0.523][0.601][0.023][0.103][0.416][0.187][0.098]
HL–0.057–1.2000.8461.869 *1.6781.0970.910
(0.957)(0.995)(0.838)(0.989)(1.487)(0.997)(0.734)
[0.952][0.228][0.313][0.059][0.259][0.271][0.215]
GE1.092 *0.958–0.4490.1040.6261.994 ***3.068 ***
(0.638)(0.664)(0.559)(0.660)(0.992)(0.665)(0.490)
[0.087][0.149][0.422][0.874][0.528][0.003][0.000]
WbS
ID0.0790.0830.030–0.1120.270–0.0330.024
(0.132)(0.137)(0.116)(0.137)(0.206)(0.138)(0.101)
[0.551][0.544][0.792][0.414][0.189][0.807][0.808]
PG0.3230.694 ***0.318 *0.625 ***0.3340.361 *–0.001
(0.215)(0.223)(0.188)(0.222)(0.334)(0.224)(0.165)
[0.133][0.002][0.091][0.00][0.317][0.107][0.998]
GG–0.4231.142 ***–0.815 ***–0.878 **–0.408–0.926 **–0.327
(0.361)(0.375)(0.316)(0.373)(0.561)(0.376)(0.277)
[0.241][0.002][0.010][0.019][0.467][0.014][0.238]
Notes: a denotes the coefficients from the estimated models; b denotes the standard error specific to each coefficient from the estimated models; c denotes the p-value associated to each coefficient from the estimated models. ***, **, * denote the statistical significance at 1%, 5% and 10% level. Source: SSI database, computed in StataMP 13.0.

