Abstract
With the increasing pressure of energy exhaustion and environmental degradation, environmental regulation is considered as a strategy to achieve sustainable development. This paper specifically analyzes the mechanism of multi-dimensional environmental regulations on energy- and environment-biased technological progress, and empirically detects the differentiated impacts using China’s panel data from the period 2000–2016, employing the generalized method of moments (GMM) and a dynamic threshold model. The results reveal that: (1) command-and-control regulation (CCR) promotes energy-saving and pollution abatement technological progress. Market-based regulation (MBR) stimulates energy-saving technological progress, while informal regulation (IR) only accelerates environment conservation technological progress. (2) There are threshold effects on the relationship of environmental regulations and biased technological progress. With economic developments, CCR and MBR have positive effects on energy- and environment-related technological progress, whilst IR fails to promote backstop and pollution abatement technological progress. The clear diversity in the impacts of different environment regulations on biased technological progress provides new insights for the optimal future policy design.
1. Introduction
Energy exhaustion and environmental degradation are now global issues attracting increasing attention. For high-quality development and further sustainability, China has achieved an average annual real GDP growth of 9.5% since the reform and opening up in 1978, but at the same time, it has also paid significant environmental and social costs. According to the latest Environmental Performance Index Report (2018) released by Yale University and Columbia University, China’s environmental performance index ranks 120th out of 180 countries (EPI, 2018). According to “SDG Index and Dashboards Report 2018”, China ranked 54th, with a score of 70.1, among all 193 UN member states. Ecological and environmental protection is a shortcoming in China’s sustainable development (China’s sustainable development goals (SDGs) 3, 13, and 14 are red; SDGs 7, 11, 12, and 15 are orange; and SDG 6 is yellow in the SDG Dashboard for OECD countries). In the 2015 Paris Climate Summit, China said it would cut its carbon emissions per unit of gross domestic product by 60–65% from 2005 levels by 2030. However, China is still in the stage of rapid industrialization and urbanization. The coal-based energy consumption structure has led to a high level of total energy consumption and carbon dioxide emissions in China. China is facing tremendous pressure for sustainable development.
The goals of the global climate deal in the Paris Climate Summit are achievable by fostering green growth. This, in turn, will require limiting carbon dioxide emissions and declining fossil energy consumption [1]. Energy- and environment-biased technological progress, as the generally accepted answer to the energy environment problem during economic growth, is the technical breakthrough of realizing the harmony among energy, environment, and economy—the 3E system [2,3]. Environmental regulation is one of the most direct and well received means of improving energy and environmental efficiency [4,5,6,7,8,9]. Energy–environment-oriented technological innovation directly addresses the energy and environmental issues of a sustainable economic development to achieve the SDGs proposed by the United Nations’ Sustainable Development Agenda in 2016, (mainly for SDGs 3, 6, 7, 11, 12, 13, 14, and 15), so that an ecological civilization can be constructed [10,11]. Both developed countries (e.g., American, Japan, UK, Korea, Switzerland) and developing countries (e.g., China) have historically taken environmental regulation as an answer to achieve a green economy [9,12,13,14,15,16,17]. Thus, it is vitally important to clarify the comprehensive and diversified influence of environmental regulation on energy- and environment-biased technology progress.
A series of studies has mostly been centered on the specific effect of environmental regulations on technological progress, especially on energy- and environment-biased technological progress [16,18,19]. However, more attention has been paid to the impact of environmental regulation on certain biased technologies [20,21,22] or total productivity efficiency [23,24] in existing studies. Only a few of these studies detected relationships between the diversity of environmental regulation and energy- and environment-biased technologies simultaneously. Environmental problems are a worldwide as well as a human problem, involving multiple stakeholders [25]. It is, thus, more targeted and practical to detect the effect of multiple environmental regulations on different types of technological progress from different perspectives [13]. In particular, under “Chinese style decentralization,” selecting appropriate environmental regulations with a subsequently induced technological progress is in line with the regional economy target [26].
Recently, scholars have started to discuss the varying influence of diverse environmental regulations on technical progress [9,20,27,28]; however, previous empirical studies were relatively vague about internal mechanisms. Moreover, few studies explore the nexus of different environmental regulations and differently biased technological progress. Thus, herein clarifies the mechanisms of how different environmental regulations act on energy- and environment-directed technological progress from the view of enterprises. Moreover, econometric models with China’s provincial data from the period 2000–2016 were constructed, and an empirical test on China’s environmental regulations was performed.
The contributions of the findings to the existing literatures are as follows. Firstly, to the best of our knowledge, this is the first study to explore the nexus of diverse environmental regulations and direct technological progress. Given the bias and differentiation of energy- and environment-related technologies, analyzing and understanding the implementation and effect of environmental regulations is of considerable importance. Secondly, the difference of technological progress bias brought about by different environmental regulations and the influence of different environmental policies on the direction of clean technology progress are analyzed, and a variety of environmental regulation combinations and technological progress options for the sustainable development of countries around the world are provided.
2. Literature Review
2.1. Directed Technical Progress
For biased/directed technical progress following from Hicks’s “Induced Innovation” [29] and Sato’s “factor-augmenting technical progress” [30], to date, studies have paid more attention to the evaluation of labor- and capital-biased technical progress [31,32,33,34], or alternatively focused on higher or lower skill (ability)-biased innovation [35,36,37]. In Acemoglu [38,39,40], the definition of “biased technological progress” is clearly provided. If technological progress increases the marginal output of factor Z as compared to that of other factors, technological progress is directed into factor Z, i.e., a Z-biased technological progress. Acemoglu et al. [41] expanded the directed technological progress into the field of energy and environment, and a few other researchers switch into studying energy- and/or environment-biased technological progress [29,42,43].
With an increasing pressure due to energy exhaustion and environmental degradation, the number of papers focusing on energy- and environment-related technological progress has strongly increased in recent decades. These studies evaluate or measure a certain type of energy or environmental efficiency from different perspectives and analyze the influencing factors (presented in Table 1). However, a shortcoming of such studies is the focus on both energy- and environment-biased technological progress simultaneously. According to Table 1, the measurement of technological progress can be divided into three categories: input, output, and relative efficiency. Input perspective methods focus on the corresponding investment or expenditures for technological innovation. Output-focused methods focus on the application and adoption of patents about energy-saving and environmental protection. Relative efficiency methods measure technological progress from the output perspective, considering corresponding environmental factors. It is easier to distinguish the direction of technological progress via the latter method.

Table 1.
The measurement of energy- and environment-biased technological progress.
Considering the fact that a technological advancement, caused by the symbiosis of pollution emission and fossil energy consumption [56] and the substitutability between new energy and fossil fuels often improves both energy and environmental efficiency, comparing and discussing the technological progress of various energy environments is more consistent with the actual technological progress and can focus on the structural problems of technological progress. Hence, herein we identified three kinds of energy- and environmental-biased technological advances, namely energy-saving technical progress, pollution-abatement technical progress, and backstop technical progress (new energy technical progress).
The driving forces or influencing factors of energy- and environment-biased technological progress, innovation policy, foreign direct investment (FDI), trade, employment structure, relevant investment, environmental regulation, etc., have been frequently investigated in recent decades [51,57,58,59,60,61]. Meanwhile, with the internalization of environmental externalities, environmental regulation has become a significant factor that affects technology choice [62] as well as an institutional factor that results in the emergence of energy- and environment-directed technological progress. Therefore, a discussion about the influence from environmental regulations on energy- and environment-directed technological progress through a comparative analysis of different modes of energy- and environment-directed technological advances is presented.
2.2. Diversity of Environmental Regulations
Environmental regulations are meant to mitigate pollution emission and energy consumption. In a large sense, this should be a comprehensive system, which is comprised of laws, regulations, industry norms, suggestions, supervision, punishment, rewards, environmental protection publicity, education, and other means adopted by multiple subjects to provide feedback on various aspects of environmental problems. With the complexity of environmental policy systems and the diversity of tools, it is more targeted and practical to measure the implementation effectiveness of different types of environmental regulations systematically.
To date, environmental regulations have been classified into different types from different perspectives (Table 2). For example, according to the type of environmental regulation, relevant policy instruments are conventionally classified into the two broad categories of formal regulation and informal regulation [63]; alternatively, explicit regulation and implicit regulation. Among these classifications, formal environmental regulation (FR) generally deals with the direct intervention of the government on the utilization of environmental resources mainly by administrative orders, which include clearly stipulated emission and production standards, environmental taxes and fees, resource taxes, pollution permits, and subsidy policies [20]. Informal environmental regulation (IR) not only contains the behavior of social groups—who basically consider their own interests, seeking to improve environmental quality when the original formal regulation fails [64]—but also includes external manifestations of the residents’ environmental awareness, such as public petitions and complaints about environmental damage, exposure to pollution, green products of choice, and voluntary environmental programs [12,65]. Considering the coerciveness of tools, some researches divided environmental regulation into command-and-control regulation (CCR), market-based regulation (MBR), and voluntary environmental regulation [20,27,66]. Alternatively, environmental regulation can be divided into expense type and investment type environmental regulation, or quantity-based and price-based environmental regulation [67], and trust-based environmental regulation [68] due to the heterogeneity of environmental capital utilization.
Table 2.
Diversity of environmental regulations and the impacts on the energy- and/or environment-related technological progress.
Specifically, CCR refers to an environmental intervention, which does not rely on financial incentives but on regulations, including permission, prohibition, standard setting, and enforcement. The main characteristic of CCR is coerciveness, which depends on administrative measures [27]. Based on market mechanisms, environmental protection tools, such as environmental taxes, subsidies, and carbon emission rights, are classified as MBR. Non-profit environmental regulations, such as environmental supervision, environmental protection publicity, and education—provided by residents, social organizations, and so on—are generally considered to be voluntary environmental regulation (VR) [24], so-called IR. It is the public environmental awareness rather than the government regulation that is effective.
Based on Table 2, the nexus between environmental regulation and energy conservation and emission reduction can be concluded as follows. (1) The crow-out effect: the compliance cost caused by environmental regulation decreases the profit of enterprises and crowds-out technological innovation investments, thus weakening the corresponding enterprises’ competitiveness [69,70,71,72]. (2) The “Porter Hypothesis” claims that confronted with environmental regulations and shrinking profits, some enterprises may try to accelerate innovation to solve the current dilemma, so as to achieve an efficiency improvement and even technological renovation (viz. the corresponding weak and strong Porter hypothesis); finally, the benefit of innovation compensates the compliance costs of environmental regulations and realizes the innovation compensation effect [15,73,74,75]. (3) The non-linear relationship: in the beginning, low environmental regulations fail to stimulate innovation. As the strength of regulations increases, enterprises need to improve technological progress to seek a subsequent innovation compensation. Once the environmental regulation is so high that the innovation compensation fails, the enterprises may transfer or find other ways to deal with environmental pressures, thus no longer significantly promoting technological innovation. These results may be presented as subsequent U-shaped [76], inverted U-shaped [77], or other more complex threshold relationships [78]. (4) Non-relationship: enterprises can also choose other ways to deal with environmental regulations, such as rent seeking/corruption [79], seeking political connections [80], or enterprise transfer [81,82]. Correspondingly, there is no significant relationship, as shown by empirical results, between environmental regulation and technological progress [83,84,85,86]. To summarize, there is a lack of accordant statements about the nexus of environmental regulations and technological progress in the present literature due to the different perspectives, measurements, samples, etc.
Table 2 lists the different categories and corresponding indicators of environmental regulations and the impact on the energy- and environment-related technology innovation. Combined with the above theoretical analysis, both theory and empirical evidence demonstrate that different environmental regulations have different comparative advantages, but numerous factors, jointly, decide which strategy to choose. Clarifying the mechanism behind these relationships from the view of enterprises and testing the specific impact of diversified environmental regulations within economic transition are important for guiding technological progress in China. In addition, different categories or measures of innovation/technological progress can also influence the effect of environmental regulation [83,87,88]. Therefore, it is more practical and comprehensive to analyze how effectively different environmental regulations impact biased technological progress. Considering that energy- and environment-biased technological progress is an adoptive answer to resolve urgent energy and environmental issues, and eventually, realize China’s green growth, there is a necessity to detect the consequences of environmental policies on energy- and environment-directed technological progress.
3. Theoretical Mechanisms
The environmental regulation process can be broken down into three stages: policy making and implications, impact on enterprises, and strategy adjustment and reaction, as depicted in Figure 1. In the following paragraphs, a detailed explanation of the mechanisms behind the effect of environmental regulations on biased technological progress is provided.
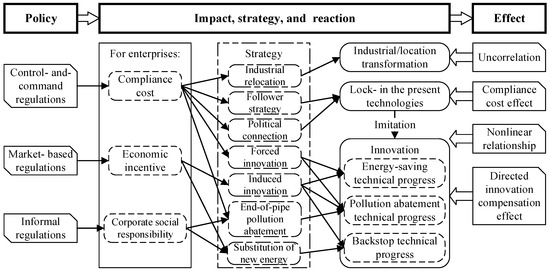
Figure 1.
The theoretical routes and effects of environmental policy on innovation in China from the perspective of enterprises.
To begin with, energy saving and emission reduction is a matter which needs joint efforts of multiple stakeholders, including a leading role from the government, the participation of market entities, and the supervision of the public. With the work of multiple stakeholders, the development of tools for environmental regulation has been accelerated. The influence of environmental regulation systems, including CCR, MBR, and TR, on economic subjects includes three aspects: pressure, incentive, and voluntariness. As the holder of technological improvement and innovation, enterprises play a core and leading role in the advancement of energy-saving and emission reduction technology. CCR, MBR, and IR cause three kinds of pressures (or powers) on enterprises through increasing the cost of energy conservation and emission reduction, forming economic incentives, and increasing social responsibility pressure. Among them, mainly proposed by the government, CCR is typically associated with coercive pressure [76] and changes the total factor production cost by internalizing environment and energy costs. Using marketization tools, MBR creates comparative advantages for low-emission enterprises and forms economic incentives for high-efficiency enterprises through the market transmission mechanism. Formed by social organizations and residents, IR represents people’s expectations for a better living environment, affects the social reputation of the enterprises, and exerts social responsibility pressure on the enterprises.
Thus, confronted with the changed environment and passion/motivation, enterprises have to take corresponding strategies. First, regarding the increasing cost caused by CCR, enterprises may employ strategies such as industrial relocation, industrial transfer, follower strategy, political connection, forced innovation, or end-of-pipe pollution abatement. Generally, leading enterprises have fairly comprehensive abilities and long-term development planning. Their pessimistic anticipation of stricter environmental regulations in the future leads to a higher endeavor to improve the existing production technology and develop new energy technology. When the emissions from regulated firms (e.g., large automobile companies, oil companies, or electric power generators) account for a giant rate of the gross emissions, such strategic revolution can occur. With internationalization, foreign-funded and small enterprises are more inclined to adopt industrial relocation (environmental regulations affect the location of enterprises) or industrial transfer strategies to avoid the rising energy-saving and emission reduction costs. As market followers, small enterprises may also “wait-and-see” due to the strong uncertainty of environmental regulations. In the short term, they will be locked in existing technologies and even crowding out innovation investments, thus presenting a negative correlation, the so-called “compliance cost effect.” In the long-term, however, such enterprises will employ mature and optimal technology for a higher productivity by imitation or introduction. For state-owned enterprises with strong market power, it is highly tempting to gain larger emission space by seeking political connections [80], especially in the context of Chinese-style decentralization. It is a remarkable fact that stringent environmental standards, which bring inefficiency to the firms, can push the firms to look for measures in pollution abatement, including the renewal of end-of-pipe technologies, enhancing resource utilization, and substitution by new energies. In case such standards are satisfied, enterprises, however, will have no further incentives to aim for research and innovation, specifically relating to policies on technical standards [27].
Second, the economic incentives caused by government subsidies preferential policies (e.g., Green credit) and taxes, on the one hand, stimulate enterprises to develop energy conservation and emissions reduction technology, i.e., induced innovation, and on the other hand, promote enterprises to adopt backstop technology, i.e., new energy substitutions. Confronted with larger incentives and the urgency for long-term development, leading enterprises have a greater incentive to develop energy conservation and emission reduction technologies. High-tech enterprises also struggle to develop new energy technology due to seizing development opportunities. With the deepening of market-based policies, the comparative advantages of new energies have become more and more prominent, which provides a proper market for the development and application of renewable energy technology. Backstop technology becomes one of the alternative strategies for enterprises to realize the substitution of new energy.
Third, IR, such as social regulation, exerts pressure on the enterprises’ social responsibility. Facing social pressure, enterprises take an end-of-pipe pollution abatement strategy to deal with environmental issues, promoting the company’s social image. Especially under the circumstances of information asymmetry and imperfect social supervision systems, enterprises tend to adopt mature end-of-pipe pollution abatement technology to deal with such social pressure, and once the pressure is relieved, they may not increase such innovation investment, ultimately leading to the failure of the “strong Porter hypothesis” in environment-biased technological progress. Leading enterprises, which pay more attention to social responsibility, prefer to take new energy as the substitution of traditional energy for long-term development. Thus, new energy technology plays a vital role in driving the future sustainable development of enterprises.
For several reasons, to address various types of environmental problems, different types of environmental regulations are adopted that put different pressures on enterprises. Thereafter, considering the internal and external environment and conditions, enterprises may adopt differentiated strategies and promote diversified energy- and environment-biased technological progress for complex stress, brought by diversified environmental regulations. Finally, there are the heterogeneous effects of diverse environmental regulations on biased technological progress. Additionally, from a dynamic perspective, environmental regulations vary in time and are uncertain, thus leading to more complex effects on biased technological progress. The above theoretical conclusions generally favor the three following hypotheses:
Hypotheses 1 (H1).
Environmental regulation exerts influences on technological progress, but the specific effects are uncertain.
Hypotheses 2 (H2).
Different kinds of environmental regulations have different impacts on biased technological progress.
Hypotheses 3 (H3).
The influence of a certain environmental regulation on different biased technological progress are heterogeneous.
4. Model and Data
4.1. Model
Based on the aforementioned analysis, a basic model was established to detect the nexus between different environmental regulations and directed technical progress [89,90]:
where indicates biased technological progress, namely, energy-saving technological progress (ES), backstop technological progress (BT), and pollution abatement technological progress (PA). indicates environmental regulation, specifically referring to CCR, MBR, and IR. represents control variables. and are the year and region fixed effects, and is a random error term.
Allowing for the path dependence of technological development, the so-called “inertial technology” [91], a dynamic model was constructed based on (1):
Additionally, due to the regional heterogeneity in the Chinese economy, a model with an economic threshold was established [92,93,94]. In line with model (2), a dynamic panel threshold model was established as follows:
contains the lag term estimates the development of a region’s economy and is set as the threshold variable. Thus, the incidental parameter is removed through the generalized method of moments (GMM). The presence of the threshold is tested by a fast bootstrap algorithm. The null hypothesis and the alternative hypothesis are displayed as (4) and (5), respectively:
Herein, is the parameter space of .
4.2. Data
4.2.1. Dependent Variables
Based on the aforementioned studies (Table 1), the method of relative efficiency is more applicable in evaluating diversely directed technological progress. Herein, energy- and environment-directed technological progress was measured by a super-efficiency model. Following Zhou and Feng [95], the “energy–environment efficiency” super-efficiency model is given as follows:
Here, denote the non-energy, non-fossil energy (or renewable energy) and fossil energy inputs, and desirable and undesired outputs, respectively. is the number of periods, and is the number of decision units. represent non-fossil energy (or renewable energy) efficiency, fossil energy efficiency, and environmental efficiency, respectively, measuring the backstop technological progress (BT), energy-saving technological progress (ES), and pollution abatement technological progress (PA). The input includes fossil energy, renewable energy, capital stock, and labor. The desired output indicator is the regional GDP, and the undesired output is carbon dioxide (CO2) emissions.
4.2.2. Independent Variables
There are many metrics for environmental regulation, which were analyzed in Section 2.2. Herein, the indicator for environmental regulations were selected based on the following considerations: (1) the coverage of the tools, considering that the Chinese government often pilots some regulation tools in several provinces [20]; (2) the representativeness of indicators, assuring that synthetic indicators are more representative; and (3) the uniformity, completeness, and availability of data, given that some indicators feature inconformity or vanish in the statistics in the long term. Figure 2 shows the commonly used indicators of environmental regulation in many studies. Among them, CCR1 was constructed by calculating the proportion of basic keywords including “environment”, “pollution”, “ecology”, “control”, “energy saving”, and “emission reduction” to total government work reports [96]; CCR2 is the acceptance of environmental administrative punishment cases; CCR3 is the implementation rate of the environmental assessment institution; CCR4 is the industrial solid wastes’ comprehensive utilization rate; and CCR5 is a newly implemented environmental law and regulation. MBR1 is the gross pollutant discharge fee; and MBR2 is the complete investment amount for industrial pollution control. IR2, IR3, and IR4 are the total number of letters, visitors, and visiting batches, respectively, of the environmental petition letter of each province in the current year. IR1 is a comprehensive indicator calculated by the entropy method based on IR2, IR3, and IR4. Allowing for the context of China’s environment protection, CCR1, MBR1, and IR1 were chosen as the indexes for CCR, MBR, and IR, respectively. According to Figure 2, these three indicators showed a general upward trend during the sample year, which was in line with China’s real-time emphasis on environmental protection and the strengthening of regulatory efforts in recent years.
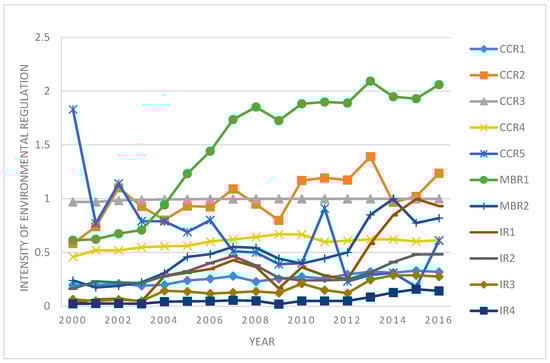
Figure 2.
Indicators of environmental regulation and its trend in China from 2000 to 2016. Note: CCR1–5 indicate the corresponding control and command regulations, MBR1 and 2 indicate the market-based regulations, and IR1 to 4 indicate the informal regulations. Details about the indicators are provided in the paragraphs above. Data were sourced from calculations by the authors based on China’s Statistical Yearbooks from 2001 to 2017, the China Statistical Yearbook on Environment from 2001 to 2017, and the Statistical Communiqué of the People’s Republic of China from 2001 to 2017. Allowing for the comparability of indexes, the units of the indicators were dealt with.
4.2.3. Control Variables
Bias in technological progress results from various sources [61]. Control variables in this paper included human capital (edu), R&D expenditure (rd), FDI, openness (open), public budget (gov), information level (post), and the structure of energy consumption (ecs) [16,91,97,98]. In detail, as the supporter of innovation, human capital (edu) is measured by the weighted average assignment of classified different levels of education. R&D activities measured by the proportion of R&D expenditure to the GDP play the core role and a strong guiding role in technological innovation. Calculated by the ratio of FDI to the GDP, FDI’s spillover effect on technological progress under environmental regulations may show the effect of the “pollution halo” or “pollution heaven”. Calculated by the proportion of total import and export volume to the GDP, the openness of the economy (open) determines the introduction and exchange of international advanced technology and directly impacts technological progress. The public budget (gov) was calculated via the proportion of government fiscal expenditure to the GDP, reflecting the government’s dominance of an economy and positively affecting technological innovation, especially for technologies with positive externalities. The level of informatization (email), measured by the total amount of postal and telecommunication services, evaluates the level of development of information technology and can promote technology spillovers by reducing the transaction cost of information. Energy consumption structure (ECS), calculated via the proportion of coal use to the gross energy consumption, directly affects energy efficiency due to the fact that different energies have different caloricity and emissions.
The 2000–2016 panel data of 30 provinces (cities) in mainland China were selected, and the data sources included the China Statistical Yearbook, China City Statistical Yearbook, and the Statistical Communiqué of the People’s Republic of China. Table 3 displays the corresponding summary statistics for all variables. In contrast to BT and FDI, the mean value of the other variables was greater than the standard deviation, indicating that the data do not include extreme values and the overall dispersion of the data is not high; therefore, further model analysis could be performed with the data.
Table 3.
Descriptive statistics of the main variables.
5. Results and Analysis
5.1. Basic Analysis of the Nexus between Environmental Regulations and Technical Progress
Due to endogeneity problems, the GMM method was adopted for regression. According to Table 4, the Autocorrelation (AR) test, Sargen test, and Hansen test showed that the GMM was suitable and robust for the regression.
Table 4.
Regression results of environmental regulation affecting technological progress.
Firstly, CCR has promoted progress in energy-saving and pollution abatement technologies but had a negative effect on backstop technological progress. CCR was the core of China’s environmental regulation system for a long time, until the market economy development brought about an increased application of MBR and IR [102]. Meanwhile, fossil energy and environmental protection technologies are relatively mature and have always been used for sustainable development in China. The existing administrative regulation and information system is capable of sufficiently implementing CCR. Thus, the implementation and promotion of CCR can stimulate the fossil energy-saving and pollution abatement technological progress. However, to date, the utilization of new energies is insufficient in China. New energies have an indistinct scope, and new energy technology is relatively lagged and appears immature. Therefore, there is a higher possibility of “government failure” on CCR for accelerating backstop technological progress. That is, improper governance environmental regulation may increase intervention costs, hinder innovation and resource utilization, and entail undesired results [23].
Secondly, MBR has a positive effect on the progress of pollution abatement technology, but a negative impact on that of fossil and non-fossil energy technologies. The main reason may be that frequent environmental disasters and a changing climate make it urgent to internalize environmental costs. Moreover, market-based environmental regulations result in the environment becoming the more expensive factor for sustainable economic development. Aiming to save more costs, enterprises would prefer to develop environmental conservation technology. Additionally, the current tools of MBR in China mainly include emission fees, emission permits, and environmental taxes [20]. Both emission fees and emission permits focus on the environment and directly stimulate enterprises to adapt cleaner technology, reduce pollution emissions, and subsequently promote environmental efficiency. Environmental taxes, which focus on both pollution emissions and energy consumption, aim at influencing environmental inputs and outputs. Unfortunately, China’s MBR system is not perfect. The fact that China officially levied environmental protection taxes from 1 January 2018, has led to MBR that positively impacts progress in pollution abatement technologies, but fails to promote energy-related technological progress.
Finally, IR, the so-called voluntary environmental regulation, promotes the progress of fossil energy and non-fossil energy technologies but fails to promote pollution abatement technological progress. IR depends on the residents’ environmental awareness and is devoted to overcoming the information asymmetry between government regulations and corporate pollution emissions. First, information-based regulations (namely IR) mainly positively stimulate progress in energy technology from the view of household consumption choice. China has established a comprehensive product energy labeling system since 2004. With an increasing environmental awareness, residents are more inclined to consume low-energy and new energy products. The residents’ consumption choices promote a new energy utilization and energy efficiency [24]. In contrast, such regulations fail to effectively identify the consumer market for pollution abatement technological progress. Furthermore, China’s lack of non-governmental environmental organizations and social groups makes it almost impossible to express the environmental demands of residents. Under Chinese-style decentralization, the information asymmetry between central and local governments on environmental issues led to a lack in feedback related to the residents’ environmental complaints [103,104]. As per the aforementioned analysis, enterprises can develop end-of-pipe pollution abatement to cope with informal environmental regulations. Once the residents’ environmental complaints are met, enterprises will lose the motivation to make further environmental protection efforts [27].
With respect to the control variables, their influence on the three technological advancements is consistent and robust, except for the fact that the degree of openness (open) has a negative influence on the three types of technological progress, while other factors have contributed to the development of energy- and environment-biased technological progress. The main reason is that most of China’s industries still belong to the mid- and downstream of the global value chain, and export products are still dominated by labor-intensive products. For a long time, the problem of “capture” has not been removed in developed countries. Therefore, openness failed to effectively promote technological progress. Education (edu) and R&D investments (rdgdp) are the main drivers of technological progress. The higher the government fiscal expenditures (govgdp), the higher the support of innovation. The postal and telecommunications business volume (post) indicates the contribution of infrastructure levels to innovation. FDI brings advanced technologies, and the resulting knowledge spillovers and industrial driving effects have contributed to technological advances.
5.2. Nolinear Relationship of Environmental Regulation and Directed Technologial Progress
The aforementioned discussion indicated that different environmental regulations have different impacts on China’s energy and environment-related technological progress. There are regional heterogeneities both in the type of environmental regulations and the direction of technological progress. These heterogeneities result from various sources, for example, resource endowment, technology input, industrial structure, and economic development. During China’s economic transition, economic development is the basic factor to promote an increase in the technology input and upgrades to industrial structures, and to make the gap in regional resource endowments. In essence, there are considerable gaps across regional economies in China. Moreover, the regional economic heterogeneity may be the main factor that led to the differentiation in the impact of environmental regulations on directed technological progress. That is, with economic development, the nexus between environmental regulations and technological progress may not be a simple linear but a nonlinear relationship [60]. Hence, detecting the threshold effect of environmental regulations on technological progress is highly relevant. Previous studies describe this nonlinear relationship primarily through the environmental Kuznets curve and set watersheds, which divided pollution generation and treatment, by the inflection point on the curve [105,106]. This led people to mistakenly believe that environmental governance and technological progress will automatically improve with economic growth [107,108] and ignore the relevance of environmental regulations. Herein, the threshold model was adopted to detect the nonlinear nexus between the corresponding environmental regulations and directed technological progress.
In line with the above results of the GMM, the threshold model with the per capita GDP as the threshold was established [93,94]. According to the results shown in Table 5, there was a threshold effect between environmental regulations and biased technological progress.
Table 5.
Dynamic threshold regression results.
The threshold effects of the three environmental regulations on energy-saving technological progress are consistent. When a region’s per capita GDP was below the threshold value, all environment regulations showed a negative impact on fossil energy efficiency. Once the per capita GDP was over the threshold value, local environmental regulations significantly promoted fossil energy efficiency. Considering the traditional high-input and high-energy economic growth, energy input is a driving force behind local economic developments in China, especially in under-developed and/or resource-rich regions. Additionally, Chinese resource endowments led to coal being the main energy source. Generally, with Chinese style decentralization, under-developed regions often had less and incompletely implemented environmental regulations because of their aim to catch up economically. Therefore, facing the environmental costs compelled by corresponding regulations, enterprises in these regions preferred to relocate or transfer in response to stronger environmental regulations [95]. Thus, environmental regulations have a negative influence on fossil energy-saving technological progress. Along with a rapid economic development, technology-intensive industry booms and becomes the core force to economic growth. Meanwhile, stronger environmental regulations have been set and implemented to further a green economy. Because of the accumulation of capital and technology, enterprises pay lower costs to switch to alternative energies and prefer technological innovations to deal with more stringent environmental regulations in the future. Therefore, environmental regulations successfully induce technological progress on energy savings.
Within the regression on backstop technology, below the threshold, CCR and MBR had a significant positive and negative coefficient, respectively; once above the threshold value, they had opposite coefficients. This indicates that, with economic development, environmental regulations should switch from CCR to MBR to accelerate non-fossil energy technological progress. This is in agreement with the results of Xie et al. [27]. In less developed regions, a lagged marketization and government competition with “Chinese style decentralization” lead to market segmentation, so that the market cannot optimize the allocation of non-fossil energy [108]. Moreover, because of a backward economic development, non-fossil energy consumption is relatively small, and residents have a low acceptance and recognition of non-fossil energy [86]. There is a need that the government drives backstop technological progress by CCR. With economic development, the residents’ demands for the non-fossil energy and consumption of new energy have increased. Furthermore, the role of marketization in resource allocation has been strengthened. Therefore, MBR promotes new energy efficiency. Meanwhile, CCR increases the environmental costs of enterprises, which extrudes backstop technological innovation, and ultimately fails to promote the efficiency of new energies.
For pollution abatement technological progress, below the threshold, CCR and MBR had a negative impact on pollution abatement technological progress; once above the threshold, they significantly promoted environmental efficiency. By contrast, IR had the exact opposite effect. In the initial stages of an economy, the production technology of enterprises was generally backward, and it is difficult for such industries to invest in clean technology innovation. Both government and market regulations force enterprises to accept increased emission reduction costs and crowding out investments in environmental technology innovation. Stringent environmental regulations may cause enterprises to migrate, but as the local economy develops, enterprises would have a tendency to stay local due to the home market effect [66]. With economic growth, the industrial transfer brought about by environmental regulations is reduced, and the resulting economic losses are reduced correspondingly. With the development of clean technology and a clean economy, enterprises have accumulated sufficient capital and technology, and the marginal costs of environmental protection are reduced. Thus, CCR and MBR can force the advancement of pollution abatement technology [109,110]. In China, social supervision does not constitute a direct constraint on enterprises, and the current public supervision fails to solve the environmental pollution problem. The main reason is that the companies’ emissions are determined by the government, and the public’s demands for the environment are difficult to reflect. IR, which is maintained by public supervision, has not become the incentive of the enterprises’ environmental technological progress.
6. Conclusions
Based on China’s 2000–2016 data, the impact of environmental regulations on biased technological progress from theoretical and empirical aspects was analyzed. Environmental regulations were divided into command-and-control regulations (CCR), market-based regulations (MBR), and informal regulations (IR), and the different effects of environmental regulations on environmental- and energy-biased technological progress were analyzed. Based on this, the heterogeneous influence of environmental regulations on biased technological progress at different stages of economic development was discussed. Clean technology progress is the effect of technology development efficiency and environmental policy accumulation. Policy intervention will change the direction of technological progress by affecting compliance costs and changing economic incentives and social responsibility pressure. Different environmental regulation policies have different focuses and biases. CCR has a promoting effect on the progress of fossil energy and environmental technologies. Because of the lack of information and the high costs of decision-making in CCR, government intervention has increased the costs of progress in non-fossil energy technology. Due to the current restrictions on China’s energy consumption structure and market regulation system based on emission fees and emission permits, MBR can effectively promote environmental technology progress, but there is a crowding out effect on energy technology progress. The improvement of IR is conducive to the progress of environmental technology, but not conducive to the progress of energy technology. Research also shows that the impact of environmental regulations on technological progress depends on the level of regional economic development. In regions with a low level of economic development, the degree of marketization is low, and CCR plays an important role in the progress of energy and environmental technology. With the development of the economy, shortcomings of CCR have emerged. At this time, CCR and MBR are required to complement each other. In economic developed areas, MBR is the main environmental regulatory force. However, the role of IR in China’s biased technological progress is not prominent.
At this stage, China is facing the dual pressure of a slowed economic growth and a deteriorating environmental quality. Completely relying on market forces may lead to insufficient clean technology innovation, and economic growth will be locked on an unsustainable path, leading to unsustainable development. Policy interventions can change the direction of environmental technological progress and achieve a compatible development of economic growth and environmental quality. To achieve a sustainable development and promote progress in clean technology, China needs to make environmental regulation an important regulatory means. Adopting targeted environmental regulation means is an effective way to promote progress in clean technology and solve environmental pollution. In the long run, the fundamental driving force for economic development is technological progress. Clean technology is the main driving force for a green economic growth, which considers the sustainable development of the economy and environmental protection. Different types of environmental regulations have different effects on technological progress with various biases; furthermore, to change the direction of technological progress and reduce the costs of environmental degradation, the most controllable environmental regulations have to be determined. By driving clean technologies, effective environmental regulations will and be a win–win situation for China to deal with environmental pollution and improve energy efficiency, and make the commitments that its carbon emissions would peak no later than 2030 a possibility. At the same time, system and management innovations of environmental regulation policy designs should be strengthened, and full play should be given to the incentive effect of MBR and IR on progress in green technology. The formulation of environmental regulatory policies must be tailored to local conditions and fully consider the actual local conditions. Different types of regulatory tools should be used rationally to give full play to their respective advantages. In addition, to prevent the transfer of polluting industries brought about by regional regulatory policies of different economic development levels, the joint governance capabilities between regions should be improved, the regional ecological environment should be promoted to form a virtuous cycle system, and a regional joint governance should be implemented.
Because of the technical and data limitations, there are still many problems that need to be further studied. Firstly, the analysis of the comparative advantages of biased technologies among regions. Due to the differences in resource endowments between regions, the appropriate economic development paths differ. In the future, in the process of the coordinated economic development between regions, the use of advantages of each region to achieve complementary advantages in favored technological progress, thereby reducing the costs of technological progress and realizing a sustainable development, is one of the important directions of technological progress research. Secondly, herein we preliminarily analyzed the threshold of regional environmental regulation policies based on the heterogeneity of economic development levels. However, there are differences in resource endowments, historical conditions, and institutional arrangements among regions. Therefore, in the process of implementing environmental regulations, it is necessary to comprehensively utilize the policy combination of CCR, MBR, and IR, and implement environmental governance according to local conditions to avoid the “one size fits all” environmental governance crowding out of technological innovations.
Author Contributions
All authors contributed to the scientific content and authorship of this manuscript. Introduction, conceptualization, literature review, writing—original draft preparation: X.Z. Conceptualization, methodology, writing of analysis, writing—original draft preparation, conclusion: J.D. Data curation: M.X., T.Z. All authors have read and agreed to the published version of the manuscript.
Funding
This work was supported by the National Natural Science Foundation of China (Grant No. 71804001, 71934001, 71703073, 71873001), and the Planning Project of Philosophy and Social Science Research in Anhui Province (Grant No. AHSKQ2017D03).
Conflicts of Interest
The authors declare no conflict of interest.
References
- Wang, R.; Mirza, N.; Vasbieva, D.G.; Abbas, Q.; Xiong, D. The nexus of carbon emissions, financial development, renewable energy consumption, and technological innovation: What should be the priorities in light of COP 21 Agreements? J. Environ. Manag. 2020, 271, 111027. [Google Scholar] [CrossRef] [PubMed]
- Zhou, X.; Pan, Z.; Shahbaz, M.; Song, M. Directed technological progress driven by diversified industrial structural change. Struct. Chang. Econ. Dyn. 2020, 54, 112–129. [Google Scholar] [CrossRef]
- Omri, A. Technological innovation and sustainable development: Does the stage of development matter? Environ. Impact Assess. Rev. 2020, 83, 106398. [Google Scholar] [CrossRef]
- Löschel, A. Technological change in economic models of environmental policy: A survey. Ecol. Econ. 2002, 43, 105–126. [Google Scholar] [CrossRef]
- Nordhaus, W.D. A review of the Stern review on the economics of climate change. J. Econ. Lit. 2007, 45, 686–702. [Google Scholar] [CrossRef]
- Jagannathan, R.; Ravikumar, A.; Sammon, M. Environmental, Social, and Governance Criteria: Why Investors Are Paying Attention; 0898-2937; National Bureau of Economic Research: Cambridge, MA, USA, 2017. [Google Scholar]
- Liao, Z.; Xu, C.-K.; Cheng, H.; Dong, J. What drives environmental innovation? A content analysis of listed companies in China. J. Clean. Prod. 2018, 198, 1567–1573. [Google Scholar]
- Hazarika, N.; Zhang, X. Factors that drive and sustain eco-innovation in the construction industry: The case of Hong Kong. J. Clean. Prod. 2019, 238. [Google Scholar] [CrossRef]
- Wang, H.; Wei, W. Coordinating technological progress and environmental regulation in CO2 mitigation: The optimal levels for OECD countries & emerging economies. Energy Econ. 2020, 87, 104510. [Google Scholar]
- Song, M.; Wang, S. Measuring environment-biased technological progress considering energy saving and emission reduction. Process Saf. Environ. Prot. 2018, 116, 745–753. [Google Scholar] [CrossRef]
- Sinha, A.; Sengupta, T.; Alvarado, R. Interplay between technological innovation and environmental quality: Formulating the SDG policies for next 11 economies. J. Clean. Prod. 2020, 242, 118549. [Google Scholar] [CrossRef]
- Blackman, A. Alternative Pollution Control Policies in Developing Countries; Oxford University Press: Oxford, UK, 2010. [Google Scholar]
- Jones, C. Exploring new ways of assessing the effect of regulation on environmental management. J. Clean. Prod. 2010, 18, 1229–1250. [Google Scholar] [CrossRef]
- Bokusheva, R.; Kumbhakar, S.C.; Lehmann, B. The effect of environmental regulations on Swiss farm productivity. Int. J. Product. Econ. 2012, 136, 93–101. [Google Scholar] [CrossRef]
- Chakraborty, P.; Chatterjee, C. Does environmental regulation indirectly induce upstream innovation? New evidence from India. Res. Pol. 2017, 46, 939–955. [Google Scholar] [CrossRef]
- Wang, S.; Li, C.; Zhou, H. Impact of China’s economic growth and energy consumption structure on atmospheric pollutants: Based on a panel threshold model. J. Clean. Prod. 2019, 236, 117694. [Google Scholar] [CrossRef]
- Yuan, B.; Zhang, Y. Flexible environmental policy, technological innovation and sustainable development of China’s industry: The moderating effect of environment regulatory enforcement. J. Clean. Prod. 2020, 243, 118543. [Google Scholar] [CrossRef]
- Liu, Y.; Zhu, J.; Li, E.Y.; Meng, Z.; Song, Y. Environmental regulation, green technological innovation, and eco-efficiency: The case of Yangtze river economic belt in China. Technol. Forecast. Soc. Chang. 2020, 155, 119993. [Google Scholar] [CrossRef]
- Ouyang, X.; Li, Q.; Du, K. How does environmental regulation promote technological innovations in the industrial sector? Evidence from Chinese provincial panel data. Energy Policy 2020, 139, 111310. [Google Scholar] [CrossRef]
- Ren, S.; Li, X.; Yuan, B.; Li, D.; Chen, X. The effects of three types of environmental regulation on eco-efficiency: A cross-region analysis in China. J. Clean. Prod. 2018, 173, 245–255. [Google Scholar] [CrossRef]
- Zhang, Y.; Wang, J.; Xue, Y.; Yang, J. Impact of environmental regulations on green technological innovative behavior: An empirical study in China. J. Clean. Prod. 2018, 188, 763–773. [Google Scholar] [CrossRef]
- Song, M.; Xie, Q.; Wang, S.; Zhou, L. Intensity of environmental regulation and environmentally biased technology in the employment market. Omega 2020. [Google Scholar] [CrossRef]
- Tang, H.; Liu, J.; Wu, J. The impact of command-and-control environmental regulation on enterprise total factor productivity: A quasi-natural experiment based on China’s “Two Control Zone” policy. J. Clean. Prod. 2020, 254, 120011. [Google Scholar] [CrossRef]
- Bu, M.; Qiao, Z.; Liu, B. Voluntary environmental regulation and firm innovation in China. Econ. Model. 2019, 89, 10–18. [Google Scholar] [CrossRef]
- Da Silva Rocha, A.B.; Salomão, G.M. Environmental policy regulation and corporate compliance in evolutionary game models with well-mixed and structured populations. Eur. J. Oper. Res. 2019, 279, 486–501. [Google Scholar] [CrossRef]
- Jiang, K.; You, D.; Merrill, R.; Li, Z. Implementation of a multi-agent environmental regulation strategy under Chinese fiscal decentralization: An evolutionary game theoretical approach. J. Clean. Prod. 2019, 214, 902–915. [Google Scholar] [CrossRef]
- Xie, R.-h.; Yuan, Y.-j.; Huang, J.-j. Different Types of Environmental Regulations and Heterogeneous Influence on “Green” Productivity: Evidence from China. Ecol. Econ. 2017, 132, 104–112. [Google Scholar] [CrossRef]
- Li, R.; Ramanathan, R. Exploring the relationships between different types of environmental regulations and environmental performance: Evidence from China. J. Clean. Prod. 2018, 196, 1329–1340. [Google Scholar] [CrossRef]
- Popp, D.; Newell, R.G.; Jaffe, A.B. Energy, the environment, and technological change. In Handbook of the Economics of Innovation; Elsevier: Amsterdam, The Netherlands, 2010; Volume 2, pp. 873–937. [Google Scholar]
- Sato, R. The estimation of biased technical progress and the production function. Int. Econ. Rev. 1970, 11, 179–208. [Google Scholar] [CrossRef]
- Klump, R.; McAdam, P.; Willman, A. Unwrapping some euro area growth puzzles: Factor substitution, productivity and unemployment. J. Macroecon. 2008, 30, 645–666. [Google Scholar] [CrossRef]
- Chen, X. Biased technical change, scale, and factor substitution in US manufacturing industries. Macroecon. Dyn. 2017, 21, 488–514. [Google Scholar] [CrossRef]
- Lambert, D.K. Workforce education and technical change bias in US agriculture and related industries. Am. J. Agric. Econ. 2018, 100, 338–353. [Google Scholar] [CrossRef]
- Koch, M.; Smolka, M. Foreign ownership and skill-biased technological change. J. Int. Econ. 2019, 118, 84–104. [Google Scholar] [CrossRef]
- Galor, O.; Moav, O. Ability-biased technological transition, wage inequality, and economic growth. Q. J. Econ. 2000, 115, 469–497. [Google Scholar] [CrossRef]
- Jones, J.B.; Yang, F. Skill-biased technical change and the cost of higher education. J. Lab. Econ. 2016, 34, 621–662. [Google Scholar] [CrossRef]
- Shen, C.; Zheng, J. Does global value chains participation really promote skill-biased technological change? Theory and evidence from China. Econ. Model. 2019, 86, 10–18. [Google Scholar] [CrossRef]
- Acemoglu, D. Directed technical change. RvES 2002, 69, 781–809. [Google Scholar] [CrossRef]
- Acemoglu, D. Labor and capital augmenting technical change. J. Eur. Econ. Assoc. 2003, 1, 1–37. [Google Scholar] [CrossRef]
- Acemoglu, D. Equilibrium bias of technology. Econometrica 2007, 75, 1371–1409. [Google Scholar] [CrossRef]
- Acemoglu, D.; Aghion, P.; Bursztyn, L.; Hemous, D. The environment and directed technical change. Am. Econ. Rev. 2012, 102, 131–166. [Google Scholar] [CrossRef]
- Zhang, B.; Wang, Z.; Yin, J.; Su, L. CO2 emission reduction within Chinese iron & steel industry: Practices, determinants and performance. J. Clean. Prod. 2012, 33, 167–178. [Google Scholar]
- Aghion, P.; Dechezleprêtre, A.; Hemous, D.; Martin, R.; Van Reenen, J. Carbon taxes, path dependency, and directed technical change: Evidence from the auto industry. J. Political Econ. 2016, 124, 1–51. [Google Scholar] [CrossRef]
- Borsatto, J.M.L.S.; Amui, L.B.L. Green innovation: Unfolding the relation with environmental regulations and competitiveness. Resour. Conserv. Recycl. 2019, 149, 445–454. [Google Scholar] [CrossRef]
- You, D.; Zhang, Y.; Yuan, B. Environmental regulation and firm eco-innovation: Evidence of moderating effects of fiscal decentralization and political competition from listed Chinese industrial companies. J. Clean. Prod. 2019, 207, 1072–1083. [Google Scholar] [CrossRef]
- Li, G.; Wang, X.; Su, S.; Su, Y. How green technological innovation ability influences enterprise competitiveness. Technol. Soc. 2019, 59. [Google Scholar] [CrossRef]
- Girod, B.; Stucki, T.; Woerter, M. How do policies for efficient energy use in the household sector induce energy-efficiency innovation? An evaluation of European countries. Energy Policy 2017, 103, 223–237. [Google Scholar] [CrossRef]
- Costantini, V.; Crespi, F.; Palma, A. Characterizing the policy mix and its impact on eco-innovation: A patent analysis of energy-efficient technologies. Res. Pol. 2017, 46, 799–819. [Google Scholar] [CrossRef]
- Zhang, D.; Rong, Z.; Ji, Q. Green innovation and firm performance: Evidence from listed companies in China. Resour. Conserv. Recycl. 2019, 144, 48–55. [Google Scholar] [CrossRef]
- Lin, B.; Zhu, J. The role of renewable energy technological innovation on climate change: Empirical evidence from China. Sci. Total Environ. 2019, 659, 1505–1512. [Google Scholar] [CrossRef]
- Yang, Z.; Shao, S.; Yang, L.; Liu, J. Differentiated effects of diversified technological sources on energy-saving technological progress: Empirical evidence from China’s industrial sectors. Renew. Sustain. Energy Rev. 2017, 72, 1379–1388. [Google Scholar] [CrossRef]
- Shao, S.; Luan, R.; Yang, Z.; Li, C. Does directed technological change get greener: Empirical evidence from Shanghai’s industrial green development transformation. Ecol. Indic. 2016, 69, 758–770. [Google Scholar] [CrossRef]
- Zha, D.; Kavuri, A.S.; Si, S. Energy-biased technical change in the Chinese industrial sector with CES production functions. Energy 2018, 148, 896–903. [Google Scholar] [CrossRef]
- Jin, W.; Zhang, H.; Liu, S.; Zhang, H. Technological innovation, environmental regulation, and green total factor efficiency of industrial water resources. J. Clean. Prod. 2019, 211, 61–69. [Google Scholar] [CrossRef]
- Luo, Q.; Miao, C.; Sun, L.; Meng, X.; Duan, M. Efficiency evaluation of green technology innovation of China’s strategic emerging industries: An empirical analysis based on Malmquist-data envelopment analysis index. J. Clean. Prod. 2019, 238, 117782. [Google Scholar] [CrossRef]
- Färe, R.; Grosskopf, S.; Noh, D.-W.; Weber, W. Characteristics of a polluting technology: Theory and practice. J. Econom. 2005, 126, 469–492. [Google Scholar] [CrossRef]
- Costantini, V.; Crespi, F.; Martini, C.; Pennacchio, L. Demand-pull and technology-push public support for eco-innovation: The case of the biofuels sector. Res. Pol. 2015, 44, 577–595. [Google Scholar] [CrossRef]
- Song, M.; Wang, S. Can employment structure promote environment-biased technical progress? Technol. Forecast. Soc. Chang. 2016, 112, 285–292. [Google Scholar] [CrossRef]
- Dong, Y.; Shao, S.; Zhang, Y. Does FDI have energy-saving spillover effect in China? A perspective of energy-biased technical change. J. Clean. Prod. 2019, 234, 436–450. [Google Scholar] [CrossRef]
- Peng, J.; Xiao, J.; Wen, L.; Zhang, L. Energy industry investment influences total factor productivity of energy exploitation: A biased technical change analysis. J. Clean. Prod. 2019, 237. [Google Scholar] [CrossRef]
- Wei, Z.; Han, B.; Han, L.; Shi, Y. Factor substitution, diversified sources on biased technological progress and decomposition of energy intensity in China’s high-tech industry. J. Clean. Prod. 2019, 231, 87–97. [Google Scholar] [CrossRef]
- Gray, W.B.; Shadbegian, R.J. Environmental regulation, investment timing, and technology choice. Ind. Econ. 1998, 46, 235–256. [Google Scholar] [CrossRef]
- Wang, X.; Shao, Q. Non-linear effects of heterogeneous environmental regulations on green growth in G20 countries: Evidence from panel threshold regression. Sci. Total Environ. 2019, 660, 1346–1354. [Google Scholar] [CrossRef]
- Wheeler, D.; Pargal, S. Informal Regulation of Industrial Pollution in Developing Countries: Evidence from Indonesia; The World Bank: Washington, DC, USA, 1999. [Google Scholar]
- Langpap, C.; Shimshack, J.P. Private citizen suits and public enforcement: Substitutes or complements? J. Environ. Econ. Manag. 2010, 59, 235–249. [Google Scholar] [CrossRef]
- Zheng, D.; Shi, M. Multiple environmental policies and pollution haven hypothesis: Evidence from China’s polluting industries. J. Clean. Prod. 2017, 141, 295–304. [Google Scholar] [CrossRef]
- Stranlund, J.K.; Ben-Haim, Y. Price-based vs. quantity-based environmental regulation under Knightian uncertainty: An info-gap robust satisficing perspective. J. Environ. Manag. 2008, 87, 443–449. [Google Scholar] [CrossRef] [PubMed][Green Version]
- Lange, B.; Gouldson, A. Trust-based environmental regulation. Sci. Total Environ. 2010, 408, 5235–5243. [Google Scholar] [CrossRef] [PubMed]
- Christainsen, G.B.; Haveman, R.H. The contribution of environmental regulations to the slowdown in productivity growth. J. Environ. Econ. Manag. 1981, 8, 381–390. [Google Scholar] [CrossRef]
- Kneller, R.; Manderson, E. Environmental regulations and innovation activity in UK manufacturing industries. Resour. Energy Econ. 2012, 34, 211–235. [Google Scholar] [CrossRef]
- Greenstone, M.; List, J.A.; Syverson, C. The effects of environmental regulation on the competitiveness of US manufacturing. SSRN Electron. J. 2012, 93, 431–435. [Google Scholar]
- Shi, B.; Feng, C.; Qiu, M.; Ekeland, A. Innovation suppression and migration effect: The unintentional consequences of environmental regulation. China Econ. Rev. 2018, 49, 1–23. [Google Scholar] [CrossRef]
- Porter, M.E.; Van der Linde, C. Toward a new conception of the environment-competitiveness relationship. J. Econ. Perspect. 1995, 9, 97–118. [Google Scholar] [CrossRef]
- Innes, R.; Carrión-Flores, C.E. Environmental innovation and environmental policy: An empirical test of bi-directional effects. In Proceedings of American Agricultural Economics Association (AAEA) Annual Meeting, Providence, RI, USA, 24–27 July 2005; University of Arizona Working Paper: Phoenix, AZ, USA, 2006. [Google Scholar]
- Albrizio, S.; Kozluk, T.; Zipperer, V. Environmental policies and productivity growth: Evidence across industries and firms. J. Environ. Econ. Manag. 2017, 81, 209–226. [Google Scholar] [CrossRef]
- Cai, W.; Li, G. The drivers of eco-innovation and its impact on performance: Evidence from China. J. Clean. Prod. 2018, 176, 110–118. [Google Scholar] [CrossRef]
- Johnstone, N.; Managi, S.; Rodríguez, M.C.; Haščič, I.; Fujii, H.; Souchier, M. Environmental policy design, innovation and efficiency gains in electricity generation. Energy Econ. 2017, 63, 106–115. [Google Scholar] [CrossRef]
- Wang, Y.; Shen, N. Environmental regulation and environmental productivity: The case of China. Renew. Sustain. Energy Rev. 2016, 62, 758–766. [Google Scholar] [CrossRef]
- Huang, Y.; Liu, L. Fighting corruption: A long-standing challenge for environmental regulation in China. Environ. Dev. 2014, 12, 47–49. [Google Scholar] [CrossRef]
- Lee, M. Environmental regulations and market power: The case of the Korean manufacturing industries. Ecol. Econ. 2008, 68, 205–209. [Google Scholar] [CrossRef]
- Zhu, S.; He, C.; Liu, Y. Going green or going away: Environmental regulation, economic geography and firms’ strategies in China’s pollution-intensive industries. Geoforum 2014, 55, 53–65. [Google Scholar] [CrossRef]
- Zhou, Y.; Zhu, S.; He, C. How do environmental regulations affect industrial dynamics? Evidence from China’s pollution-intensive industries. Habitat Int. 2017, 60, 10–18. [Google Scholar] [CrossRef]
- Jaffe, A.B.; Palmer, K. Environmental regulation and innovation: A panel data study. Rev. Econ. Statist. 1997, 79, 610–619. [Google Scholar] [CrossRef]
- Cesaroni, F.; Arduini, R. Environmental Technologies in the European Chemical Industry; LEM Working Paper Series; Sant’Anna School of Advanced Studies: Milan, Italy, 2001. [Google Scholar]
- Becker, R.A. Local environmental regulation and plant-level productivity. Ecol. Econ. 2011, 70, 2516–2522. [Google Scholar] [CrossRef]
- Yuan, X.; Zuo, J.; Ma, R.; Wang, Y. How would social acceptance affect nuclear power development? A study from China. J. Clean. Prod. 2017, 163, 179–186. [Google Scholar] [CrossRef]
- Telle, K.; Larsson, J. Do environmental regulations hamper productivity growth? How accounting for improvements of plants’ environmental performance can change the conclusion. Ecol. Econ. 2007, 61, 438–445. [Google Scholar] [CrossRef]
- Horbach, J.; Rammer, C.; Rennings, K. Determinants of eco-innovations by type of environmental impact—The role of regulatory push/pull, technology push and market pull. Ecol. Econ. 2012, 78, 112–122. [Google Scholar] [CrossRef]
- Bhargava, A.; Franzini, L.; Narendranathan, W. Serial correlation and the fixed effects model. RvES 1982, 49, 533–549. [Google Scholar] [CrossRef]
- Kezdi, G. Robust standard error estimation in fixed-effects panel models. SSRN 2003. [Google Scholar] [CrossRef]
- Phuc Canh, N.; Schinckus, C.; Thanh, S.D. Do economic openness and institutional quality influence patents? Evidence from GMM systems estimates. Int. Econ. 2019, 157, 134–169. [Google Scholar] [CrossRef]
- Hansen, B.E. Threshold effects in non-dynamic panels: Estimation, testing, and inference. J. Econom. 1999, 93, 345–368. [Google Scholar] [CrossRef]
- Seo, M.H.; Shin, Y. Dynamic panels with threshold effect and endogeneity. J. Econom. 2016, 195, 169–186. [Google Scholar] [CrossRef]
- Seo, M.H.; Kim, S.; Kim, Y.-J. Estimation of dynamic panel threshold model using Stata. Stata J. 2019, 19, 685–697. [Google Scholar] [CrossRef]
- Zhou, X.; Feng, C. The impact of environmental regulation on fossil energy consumption in China: Direct and indirect effects. J. Clean. Prod. 2017, 142, 3174–3183. [Google Scholar] [CrossRef]
- Chen, Z.; Kahn, M.E.; Liu, Y.; Wang, Z. The consequences of spatially differentiated water pollution regulation in China. J. Environ. Econ. Manag. 2018, 88, 468–485. [Google Scholar] [CrossRef]
- Huang, J.; Cai, X.; Huang, S.; Tian, S.; Lei, H. Technological factors and total factor productivity in China: Evidence based on a panel threshold model. China Econ. Rev. 2019, 54, 271–285. [Google Scholar] [CrossRef]
- Wang, Y.; Sun, X.; Guo, X. Environmental regulation and green productivity growth: Empirical evidence on the Porter Hypothesis from OECD industrial sectors. Energy Policy 2019, 132, 611–619. [Google Scholar] [CrossRef]
- National Bureau of Statistic of China. China Statistical Yearbook; China Statistics Press: Beijing, China, 2017; ISBN 9787503782534.
- National Bureau of Statistic of China. China City Statistical Yearbook; China Statistics Press: Beijing, China, 2017; ISBN 9787503767548.
- National Bureau of Statistic of China. Statistical Communiqué of the People’s Republic of China on the 2000~2017; National Economic and Social Development: Beijing, China, 2017.
- Zhao, X.; Zhao, Y.; Zeng, S.; Zhang, S. Corporate behavior and competitiveness: Impact of environmental regulation on Chinese firms. J. Clean. Prod. 2015, 86, 311–322. [Google Scholar] [CrossRef]
- Blackman, A.; Li, Z.; Liu, A.A. Efficacy of command-and-control and market-based environmental regulation in developing countries. Annu. Rev. Resour. Econ. 2018, 10, 381–404. [Google Scholar] [CrossRef]
- Song, M.; Du, J.; Tan, K.H. Impact of fiscal decentralization on green total factor productivity. Int. J. Product. Econ. 2018, 205, 359–367. [Google Scholar] [CrossRef]
- Dasgupta, S.; Hamilton, K.; Pandey, K.D.; Wheeler, D. Environment during growth: Accounting for governance and vulnerability. World Dev. 2006, 34, 1597–1611. [Google Scholar] [CrossRef]
- Hao, Y.; Wu, Y.; Wang, L.; Huang, J. Re-examine environmental Kuznets curve in China: Spatial estimations using environmental quality index. Sustain. Cities Soc. 2018, 42, 498–511. [Google Scholar] [CrossRef]
- Stern, D.I.; Common, M.S.; Barbier, E.B. Economic growth and environmental degradation: The environmental Kuznets curve and sustainable development. World Dev. 1996, 24, 1151–1160. [Google Scholar] [CrossRef]
- Pang, R.; Zheng, D.; Shi, M.; Zhang, X. Pollute first, control later? Exploring the economic threshold of effective environmental regulation in China’s context. J. Environ. Manag. 2019, 248, 109275. [Google Scholar] [CrossRef]
- Antle, J.M.; Heidebrink, G. Environment and development: Theory and international evidence. Econ. Dev. Cult. Chang. 1995, 43, 603–625. [Google Scholar] [CrossRef]
- Xepapadeas, A. Economic development and environmental pollution: Traps and growth. Struct. Chang. Econ. Dyn. 1997, 8, 327–350. [Google Scholar] [CrossRef]
© 2020 by the authors. Licensee MDPI, Basel, Switzerland. This article is an open access article distributed under the terms and conditions of the Creative Commons Attribution (CC BY) license (http://creativecommons.org/licenses/by/4.0/).