Article

Characterization and Use of Absorbent Materials as Slow-Release Fertilizers for Growing Strawberry: Preliminary Results

1
Department of Chemistry, University of Turin, Via Pietro Giuria, 5, 10125 Torino, Italy
2
Department of Field, Forest and Food, University of Turin, Largo Braccini, 2, 10095 Grugliasco (TO), Italy
*
Author to whom correspondence should be addressed.
Both authors contributed equally to this work as first authors.
Sustainability 2020, 12(17), 6854; https://doi.org/10.3390/su12176854
Submission received: 12 June 2020 / Revised: 30 July 2020 / Accepted: 18 August 2020 / Published: 24 August 2020
(This article belongs to the Section Sustainable Agriculture)

Abstract

:
Anaerobic digestion is one of the most important and advantageous processes in livestock manure treatment. Digestate, one of its byproducts, contains particularly high nitrogen levels that determine storage and disposal costs. Excess nitrogen can be managed through sequestration processes. This study assesses the potential of natural zeolite to adsorb ammonium ions from a simulated ammonium-rich digestate, and to verify its absorbency and efficiency to release fertilizer slowly to strawberry plants. The assessment considered the effects on the plant, fruit quality, prokaryotic abundances and relative abundance of bacterial and archaeal functional genes related to nitrification. Our results confirm that ammonium-enriched zeolites possess positive implications for strawberry plants and favorably influence bacterial nitrification. Natural zeolites demonstrated high sorption properties and were shown to be an efficient carrier of N to plants.

1. Introduction

Anaerobic digestion is one of the most important and advantageous processes in livestock manure waste management [1]. A byproduct of the process is digestate, which contains high concentrations of N, P, and K, that make its storage and disposal costly, especially under the current EU directive strictly limiting the amount of nitrogen spread on fields [2,3]. The traditional separation treatment used for digestate is inconsistent in its ability to reduce ammoniacal nitrogen and the digestate volume [4]. On the other hand, the clarified fraction of digestate contains high levels of ammonium and ammoniacal nitrogen that could serve as agricultural resources if reused as fertilizers. One means by which to reuse these problematic products is to exploit the high affinity and high exchange capacity of zeolites to adsorb ammonium nitrogen from liquid fraction digestate [5].
The advantage of using zeolites in adsorption processes lies in their lower cost compared to other purification methods (about 300 €/ton). Furthermore, the removal of ammoniacal nitrogen makes clarified fraction digestate comply with required limits, and consequently, downloadable into water bodies and/or fields [6].
Natural zeolites are a very abundant component of generally volcanic rocks (tuffs), and are low-cost resources that have the capacity to exchange ions in their own structure with those in the aqueous phase [7].This process is possible because of compensating cations, such as Na, Mg, Ca, K, Sr, Ba, and others, that are linked to a negatively charged framework of the zeolite minerals by relatively weak ionic bonds. Further weakening by the dielectric field exerted on them by the molecules in strong polar water causes them to be replaced by other cations with an equal number of positive charges [8]. Zeolites show a “selectivity” toward specific cations depending on their structural features. Generally, the selectivity is related to cations of low solvation energy (K, Cs, NH4+, Pb, Ba, Sr) that are able to easily get rid of the hydration sphere, so that the ions can enter into zeolite extra-framework sites [9].
The peculiar properties of zeolites make them suitable as adsorbents in liquid digestate separation and purification, and for reuse as plant fertilizers. In fact, they may enhance agroecosystem sustainability by creating a “virtuous” circle between anaerobic digestion and agriculture. The use of natural and enriched zeolites as amendments in agriculture has been studied for its soil characteristic modifications [10], i.e., reduced N leaching, increased N use efficiency, increased water use efficiency, and improved crop yield [11,12,13]. However, findings on their ability to release N slowly are well known from literature [14]. Indeed, Leggo [15] observed an increase in nitrate levels after using natural clinoptilolite enriched by composting with poultry manure.
Ammonia or ammonium added to soil is first oxidized into nitrite and then to nitrate by Ammonia Oxidizing Bacteria (AOB) and Ammonia Oxidizing Archaea (AOA). The production of nitrate can promote plant growth, but too much can cause excess nitrification, the release of nitrate into the groundwater, and eventual pollution and eutrophication. Therefore, any evaluation of the potential to use ammonium-enriched zeolite from anaerobic digestate as a slow release fertilizer must include an assessment of AOA and AOB. Moreover, the effects of zeolite amendments on the soil microbial biomass (MB) have been mostly unexplored [16].
To test the effectiveness and sustainability of charging zeolite with ammonium from digestate liquid to act as a slow release fertilizer, we enriched natural zeolite (clinoptilolite) with an ammonium-rich solution that simulated field conditions, and assessed its adsorbent properties. To evaluate its potential for use as a fertilizer, ammonium-rich zeolite was applied to a cultivation of strawberries. Plant growth and production parameters during the entire plant cycle, as well as parameters relating to fruit quality, were measured. Strawberry was chosen because it has a short production cycle, and it can be compared to other research on the use of zeolite as substrates in strawberry [17,18,19]. Zeolite was chosen as the substrate for NH4+ uptake; this choice was made to avoid bringing other nutrients into the system, to stress the model and to verify the benefits of ammonium fully charged zeolite.
The application of the enriched zeolites on strawberries was performed in pots. Three different amounts of ammonium-enriched zeolites were administered to vary the N content supplied, and to detect possible nitrogen release differences. Finally, in order to evaluate the effect on microbial communities and their potential release of nitrate into water, total bacteria (AOB) and archaea (AOA), as well as nitrogen forms, were measured in the plant substrates.

2. Materials and Methods

The study was performed in the summer of 2019 in the experimental farm of DISAFA in Chieri, North West Italy.

2.1. Zeolite Preparation: Enrichment Method and Desorption Evaluation

Natural zeolite (clinoptilolite) from Bulgaria enriched with an ammonium-rich solution was added to a commercial cultural substrate for strawberry growing. To carry out several ammoniacal nitrogen removal tests on standard solution and on the digestate, a zeolite composed almost entirely of clinoptilolite with only small percentages of cristobalite and tridymite was used. The composition and physical features of the zeolite are shown in Table 1 and Table 2. Technical data is given in the Supplementary Materials.
In addition to the physical–chemical features provided by the zeolite supplier, removal efficiency tests on standard solutions and real samples were performed.
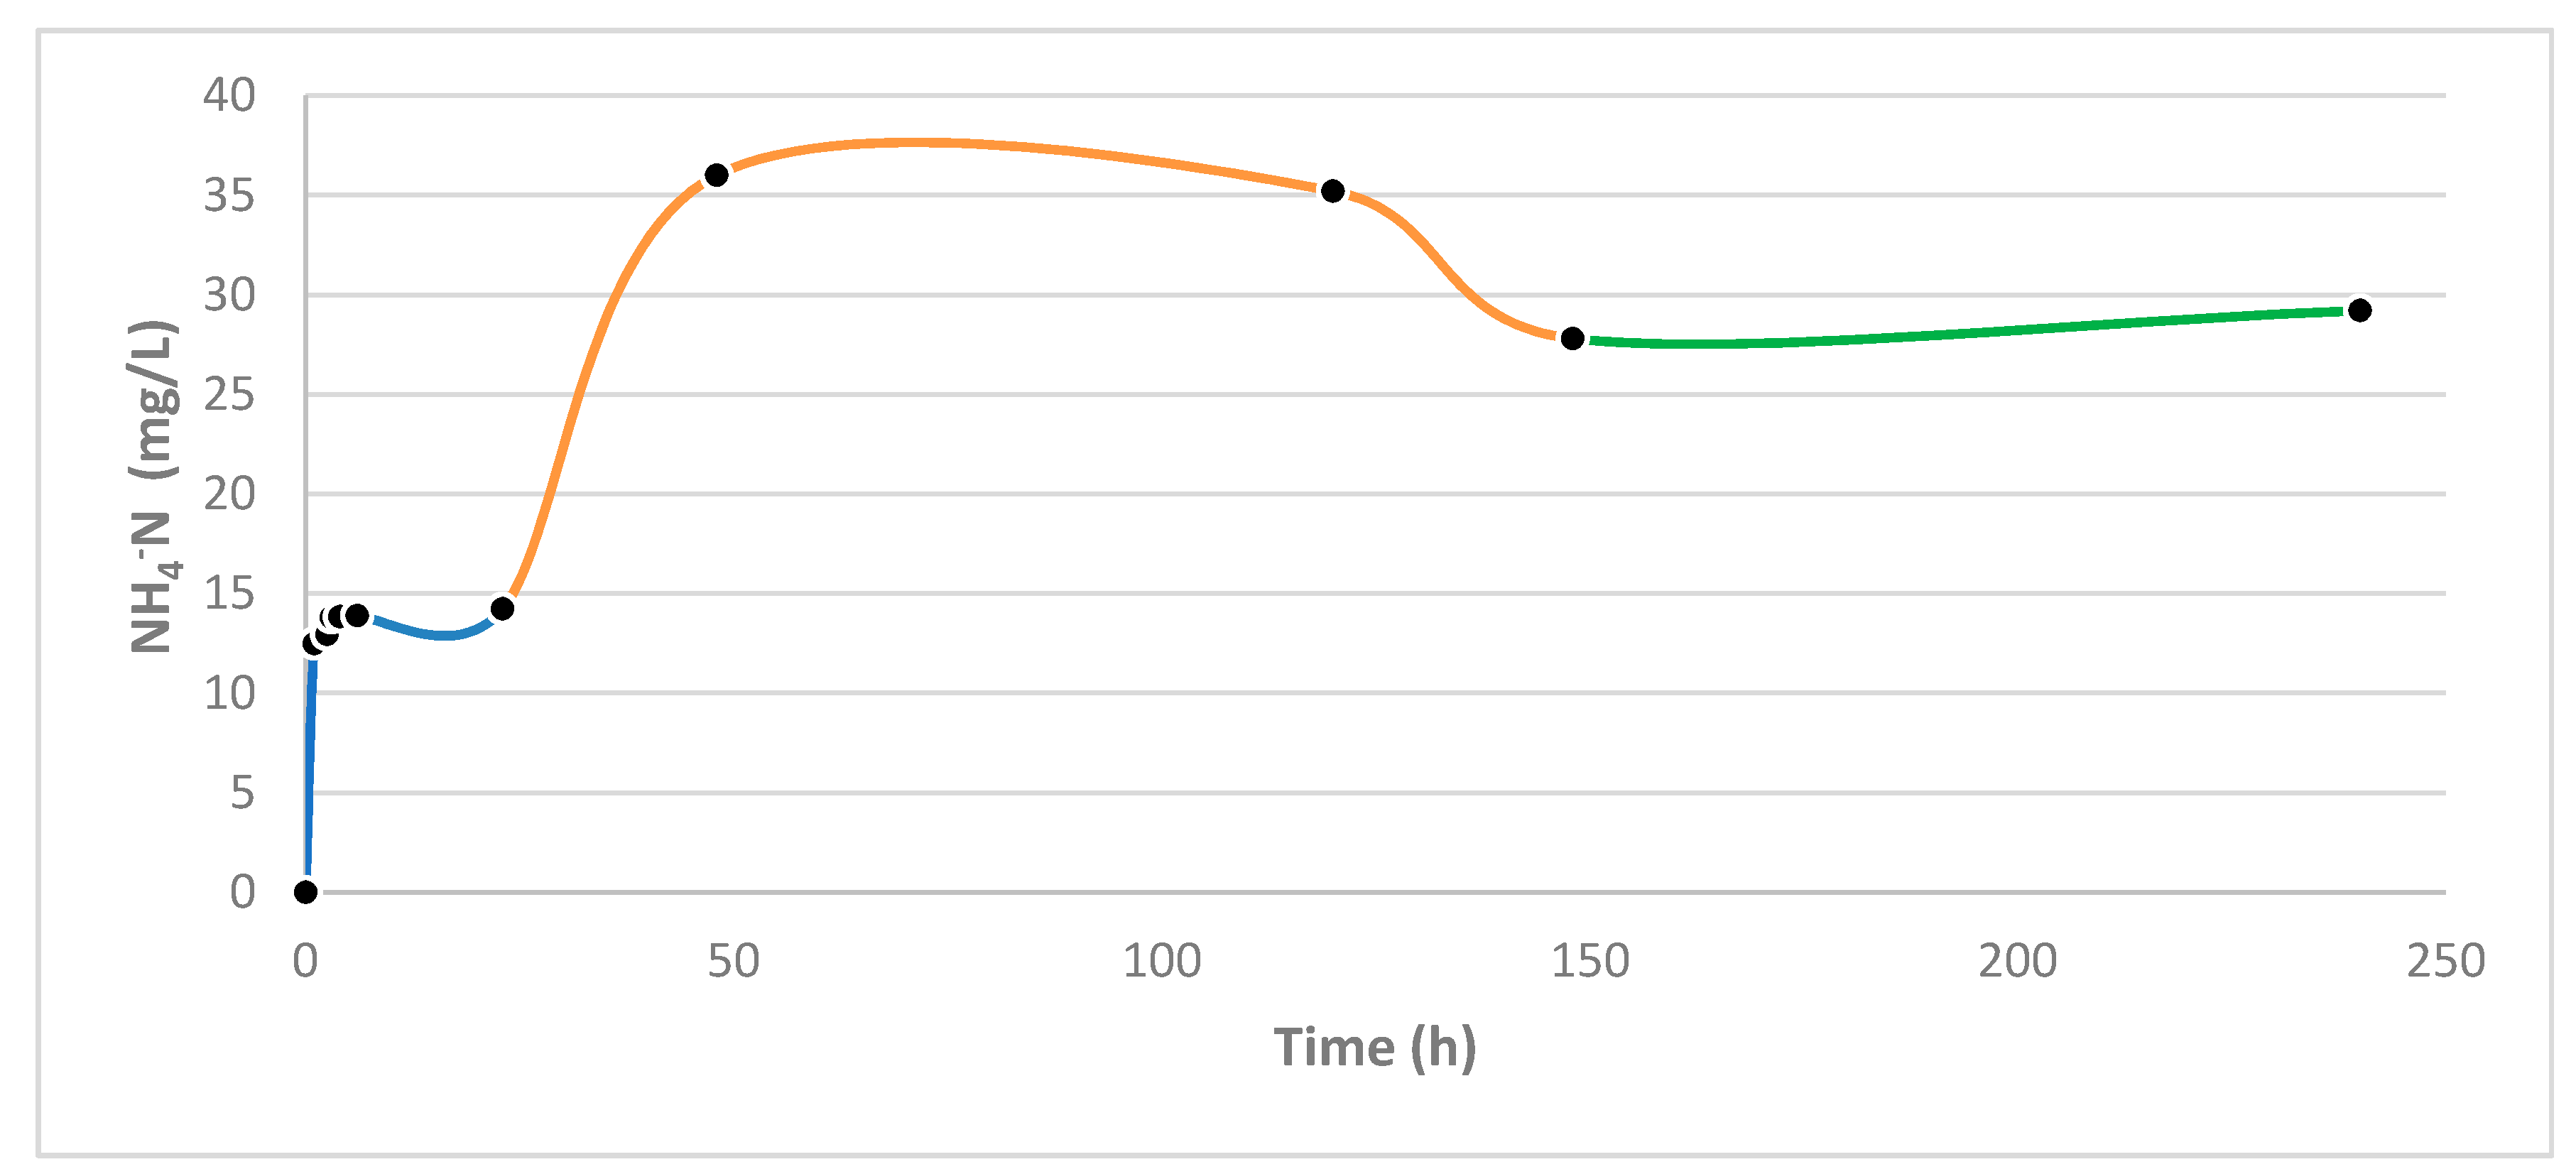
To this end, 20 g of zeolite was put in contact with 200 mL of a standard solution of ammonium chloride at 1000 mg/L, pH 6. The nitrogen sorption kinetics was studied; several aliquots of standard solution in the percolation system were taken manually every 30 min until 400 min. The experiments lasted 24 h. The maximum ammonium sorption was reached in about three hours (about 67%).
After these tests, a sample of digestate from a local farm was characterized at the University of Torino Chemistry lab (3700 mg/L of ammonium, pH = 8.5), and zeolite ammonium sorption was tested to prove the removal efficiency in a real case study. However, to limit the focus of the trial to ammonium exchange and to minimize the introduction of nonrelevant variables associated with a real digestate (for example, microbiological interference with future plant growth), a simulated digestate was prepared from a solution of ammonium carbonate (5000 mg/L, pH level about 8). Ammonium carbonate was chosen instead ammonium chloride, due to its more basic features. With the use of ammonium carbonate solutions, it was possible to reach a pH level similar to that of the digestate. First, 200 mL of ammonium carbonate solution was placed in a waterproof container with a hole at the bottom. Inside the system, a filter of zeolite (40 g) was put in contact with the surface of the solution. Digestate has a higher ammonium concentration than standard solutions. The best trade-off of zeolite:solution ratio tested was 1:5, using 40 g of zeolite in 200 mL of solution. With a pump and pipes system, the solution was circulated (10 mL/min) for 24 h on the zeolite filter and pumped out at the bottom. In this way, a percolation system was created. To saturate the zeolites, identical solutions of simulated digestate were prepared, placed in contact with the zeolites and percolated for 24 h. After three percolations, the zeolites were deemed to be fully charged with ammonium. Several replicate samples were performed, yielding fully-charged zeolites each time. Zeolite NH4+ content was measured before and after the percolation process using the Kjeldahl distillation technique. The zeolite was considered to be completely charged when the ammonium content of the solution was unchanged (5000 mg/L). The ammonium content adsorbed in zeolite itself was also tested. The fully charged zeolite reached a 4% w/w NH4+ content. The ammonium desorption process was also evaluated. A sample of the ammonium-charged zeolite (40 g) was placed in water to evaluate NH4+ release using the same percolation system. The experiments lasted 200 min due to the natural water evaporation that changed the total volume of the solution, and due to the microbial activities that occurred.

2.2. Culture Substrate

The chosen culture substrate was a commercial horticultural compost mix (Domotorf).
The substrate was a mix of fine blond, brown peat and bark humus, enriched with fulvic acids and organic substances that improve the soil structure. The chemical–physical features are as follows: Total organic carbon: 30% peat = 50% w/w, Humic + fulvic acids: 7% w/w, total N: 13% w/w, Cu (ppm) = 150, Zn (ppm) = 500; pH (in H2O) = 6.5–7.5, Electric conductivity (dS/m) = 0.4, apparent dry density (Kg/m3) = 180, total porosity = (% v/v) = 87.

2.3. Strawberry Planting and Treatments

The study was conducted on a commercial variety of frigo strawberry plants (cv Clery).
Each plant was transplanted into a 10 L volume plastic pot containing the different cultural substrate. A total of four treatments (9 pots each) were evaluated:
(1)
zeolite: cultural substrate (600 g) + 280 g of enriched zeolite
(2)
zeolite + 30%: cultural substrate (600 g) + 360 g of enriched zeolite
(3)
zeolite − 30%: cultural substrate (600 g) + 200 g of enriched zeolite
(4)
control: cultural substrate (600 g), not fertilized (no zeolites were added).
The nitric and ammonium nitrogen content of the compost was measured at the start of the trial. Charged zeolites, enriched with 4% ammonium, were introduced into the pots and mixed with the cultural substrate. The zeolite amounts were chosen based on previous work and set to optimal N concentration in the growth medium for strawberry [20]. After the transplant, water was supplied with a drop by drop automatic system (0.5 L/day) until the plants were well-developed. Thereafter, water was supplied by drip irrigation (one dripper per pot) at a frequency adapted to the climatic demand (approximately 0.5 L four times a week). All the pots were placed in an open field under shade cloth. The cultivation cycle was of 8 weeks. No fertilizers or pesticides were added.

2.4. Measurements and Analyses

2.4.1. Analyses of Strawberry Plants

Several parameters related to plant growth were measured and recorded as follows: (i) plant weight, at the beginning and end of the production cycle (g), (ii) flower count per plant, (iii) leaf length (cm) (iv) leaf count per plant (v) stolon count per plant, (vi) fruit count per plant, (vii) fruit weight (g), (viii) leaf chlorophyll content (SPAD content), and (ix) upper side leaf color (L*, C*).
At the end of the production cycle, the strawberry plants were removed with a shovel to prevent damage to the root system. Any substrate stuck to the roots was carefully removed. The plants were transferred to the laboratory, where they were washed and dried. Leaf chlorophyll content (SPAD index) was measured nondestructively with a portable SPAD-500 chlorophyll meter (Konica Minolta Sensing Inc., Osaka, Japan). Relative values displayed by the instrument were positively correlated with chlorophyll concentration [21]. The SPAD-values were recorded from five leaves on each plant. Leaf color was measured with a colorimeter (Model CR-400, Minolta, Osaka, Japan) and expressed according to the CIELAB scale (L* a* b*). The L*, a*, and b* values indicate lightness (dark to light), index of redness (green (−) to red (+)) and index of yellowness (blue (−) to yellow (+)), respectively. The dimensions of color Chroma (C = (a*2 + b*2)½) were calculated from the numerical values of a* and b* [22]. Chroma shows the radial component of the cylindrical coordinate of the L*a*b* color system, and represents color intensity.
All the parameters, except plant weight, were evaluated weekly for the first three weeks, and then again at the end of the cycle (after 60 days).

2.4.2. Analyses of Fruit

All of the strawberries from each treatment plot were picked when about 90% of their surface was red. All the strawberries were hand-picked during the cycle. The first red strawberries were picked after 2 weeks, the last after 8 weeks. A daily log of the number of strawberries picked was made. Freshly picked, strawberries were weighed, put in a closing envelope, immediately frozen and then transported to the lab. At a later time, analyses were performed in the lab after defrosting the strawberries.
Three chemical parameters were measured: total soluble solids content (TSS), titratable acidity (TA), and total polyphenols. TSS (° Brix) was measured with a digital refractometer (ATAGO Co., Ltd., Tokyo Japan). TA was determined by titrating 0.1 NaOH to a pH 8.1 with an automatic titrator (Compact 44–00; Crison Instruments, Barcelona, Spain); the results were expressed as milliequivalents of 0.1 mol NaOH per liter [23,24,25]. Finally, the total concentration of phenols was estimated by a slighty modified Folin-Ciocalteu method [26,27]. In a vessel, five g of the pulp was extracted with MeOH after 30 min in an ultrasonic bath and filtered. Then, 0.05 mL of the extract and 0.45 mL distilled water were mixed with 2.5 mL of Folin–Ciocalteu’s phenol reagent (1:10 diluted), followed by 2 mL of 7.5% (w/v) sodium carbonate. After 5 min at 50 °C, absorbance was measured at 760 nm using a U-5100 Spectrophotometer (Hitachi, Tokyo, Japan). The total phenolic content was estimated from a standard curve of gallic acid, and the results were expressed as mg gallic acid equivalents (GAE)/100 g fresh weight. The measurements were taken in triplicate and mean values were calculated.

2.4.3. Microbial Analysis

DNA was extracted from the cultivation substrate using the FastDNA® Spin kit for soil (MP Biomedicals, Solon, OH, USA), according to the manufacturer’s instructions. Three replicate samples of DNA extraction were performed. The quantity and purity of the DNA was measured spectrophotometrically with a NanoDrop ND-1000 (NanoDrop Technologies, Wilmington, DE, USA). Total bacteria and archaea (16S rRNA genes), aerobic ammonia-oxidizing bacteria (bacterial amoA gene—AOB) and archaea (archaeal amoA gene—AOA) standards and samples were analyzed using specific primers described in Mania et al. [28]. The qPCRs were conducted with a 2 μL 1:10 DNA dilution. The 20 μL reaction mix contained 10 μL SsoAdvanced Universal SYBR Green Supermix (Bio Rad Laboratories, Munich, Germany) and 0.3 μM of forward and reverse primers. The optimal dilution of the DNA extracts was previously tested to compensate for any reaction inhibition (data not shown). The qPCR reactions were done on a Chromo 4TM Continuous Fluorescence Detector, associated with a PTC-200 thermocycler (MJ Waltham, MA, USA), using appropriate target gene-specific amplification cycles. Data acquisition and analysis were conducted with OpticonMonitor 3.1.32 software (Bio-Rad Laboratories). To eliminate artefacts and specific amplification, melting curves were verified and amplicon size checked by electrophoresis.

2.4.4. Chemical Analyses of Zeolite at the Beginning of the Experiment

The sorption kinetics of NH4+ by zeolite was evaluated. All the withdrawals taken during kinetics were analyzed following the ammonium official distillation method using a Kjeldahl apparatus [29].
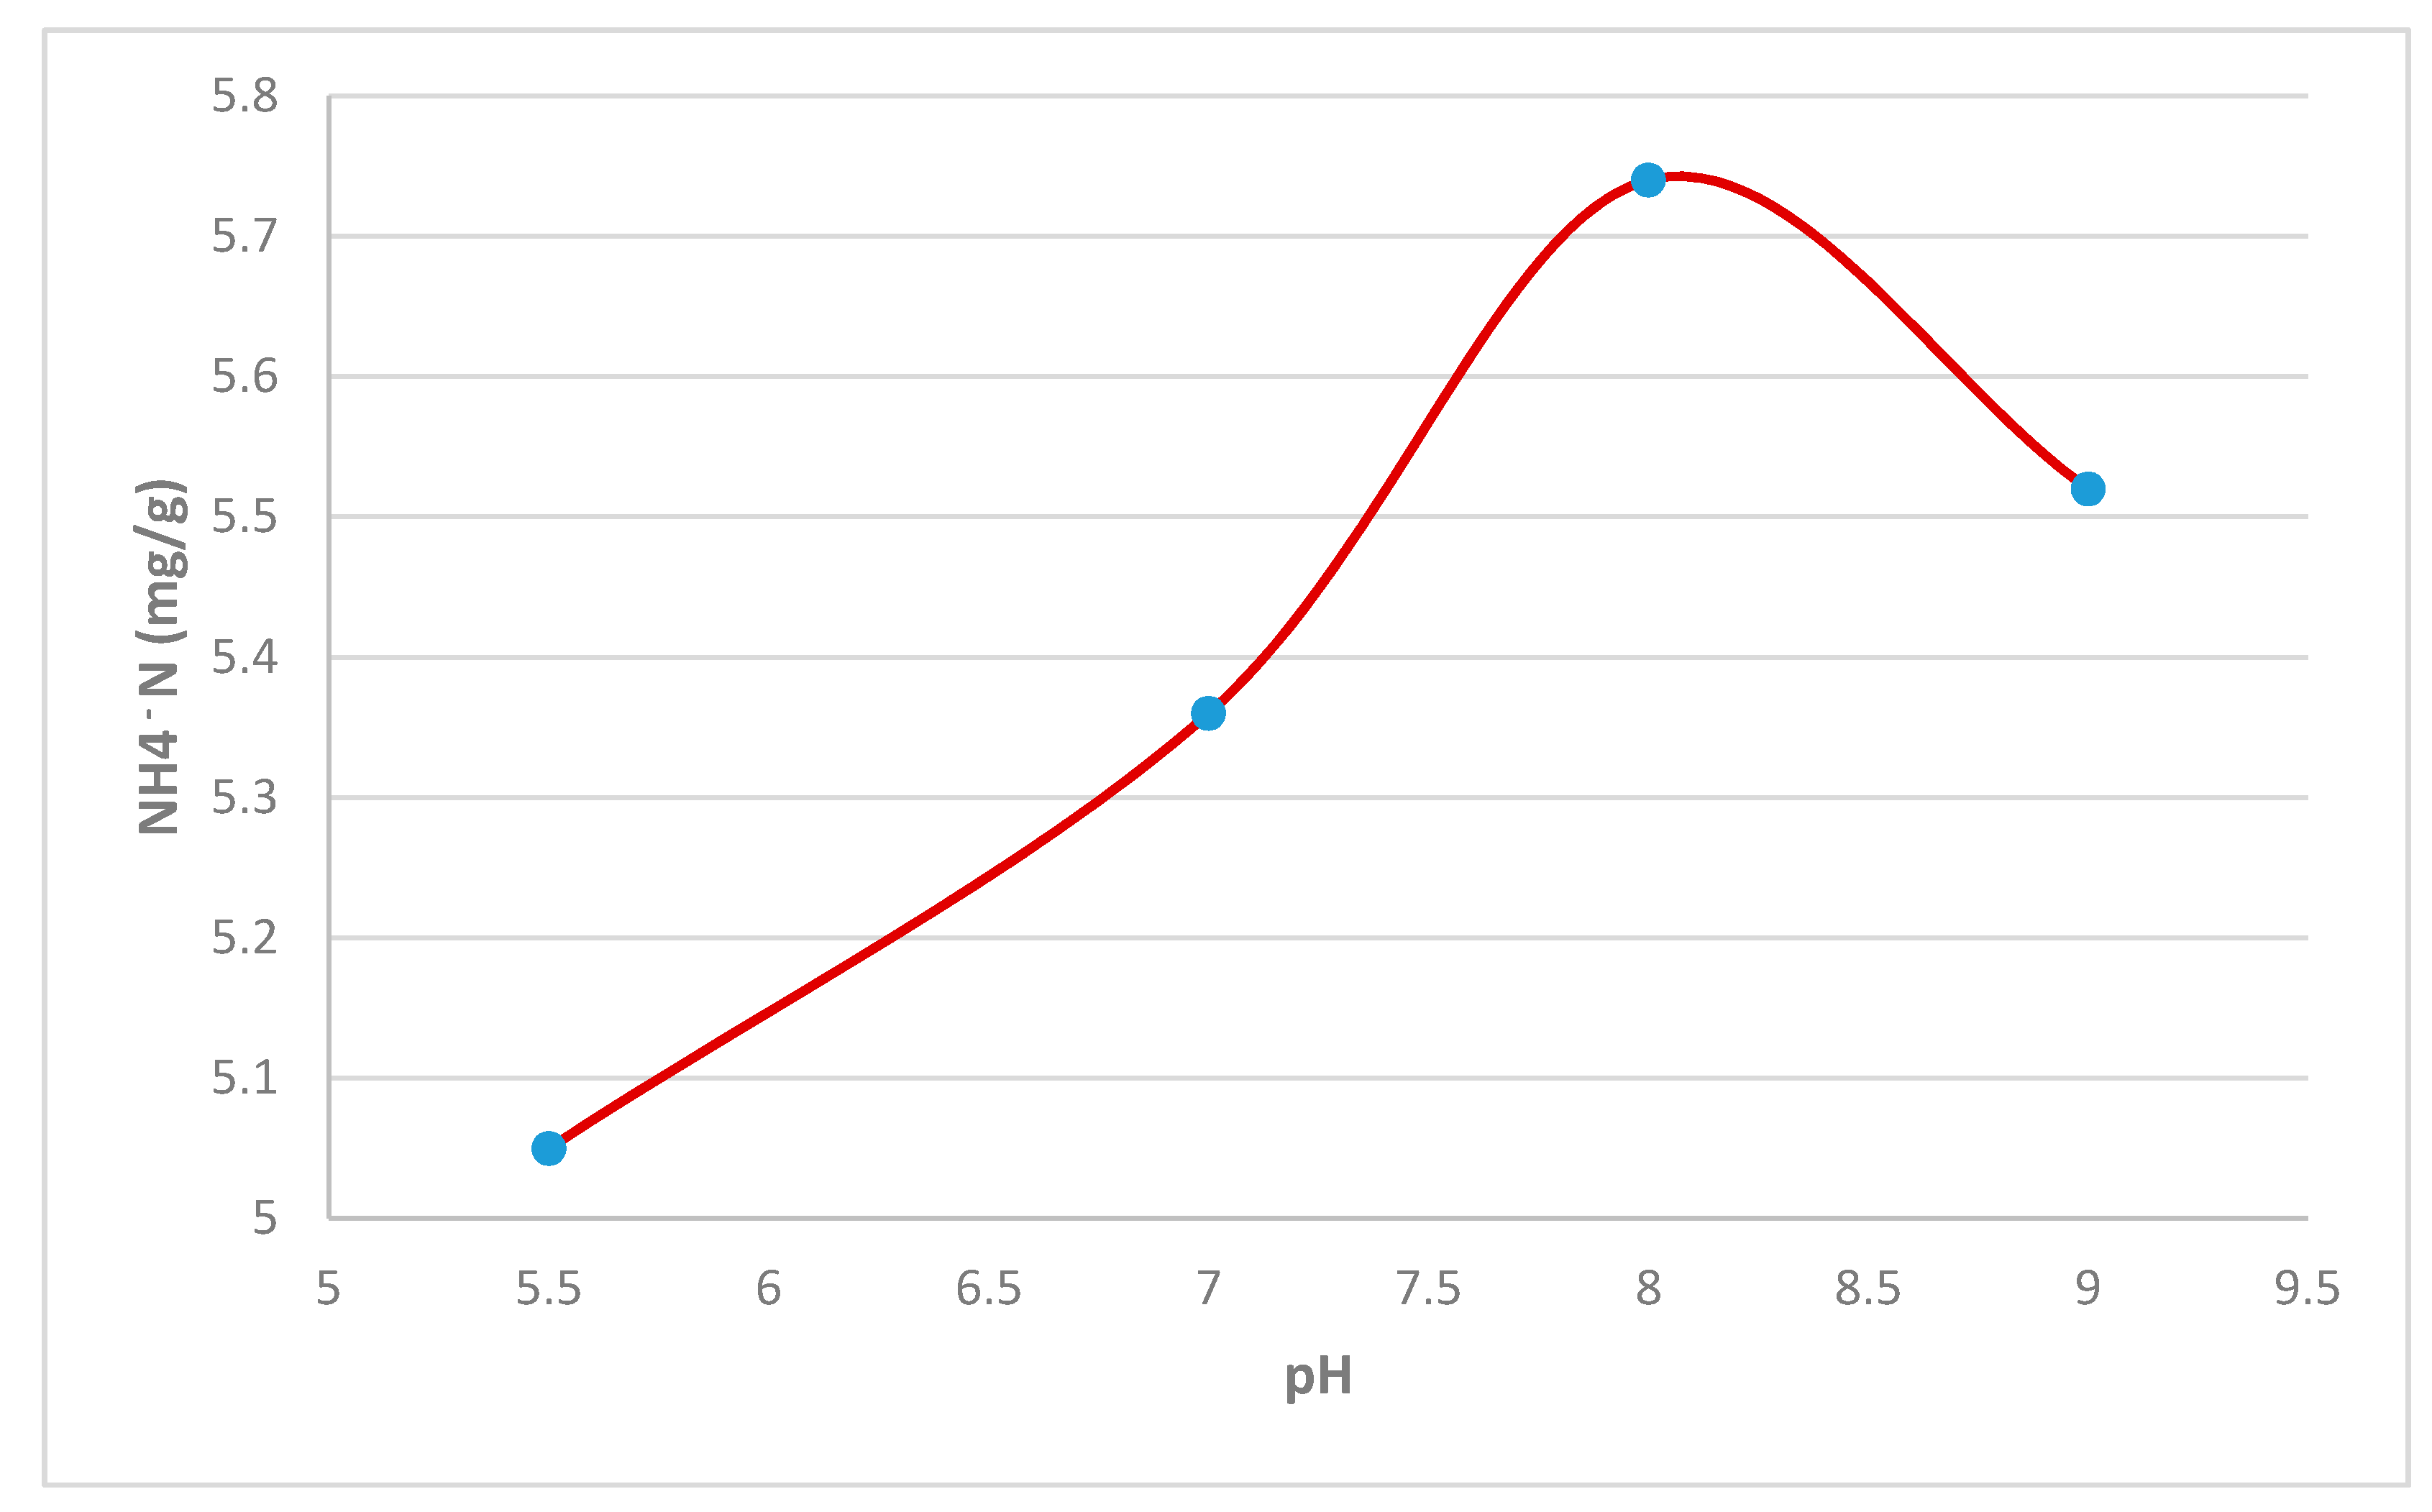
The zeolite removal efficiency was due to the pH of the solution, which affects the zeolite ion exchange mechanism [30].
For this reason, we chose to evaluate the influence of pH on removal efficiency. Under the same conditions, 20 g of zeolite was put into the percolation system with 200 mL of NH4+ buffered solution at pHs between 5 and 9. All buffer solutions had the same concentration (about 1000 mg/L). Thereafter, a test with a sample of real digestate was conducted in the percolation system, this time using 40 g of zeolite and 200 mL of digestate at about 3700 mg/L and pH 8.5. Characterization by the Kjeldahl method detected the ammonia nitrogen content after the real digestate was in contact with the zeolite.
To evaluate the amount of N absorbed into zeolite frameworks, 20 g of fully charged zeolite was put in contact with 200 mL KCl 2 M and stirred for 1 h at 20 °C. After that step, it was centrifuged for 10 min at 3000 RPM and filtered using Whatman n°4 paper. The filtered solution was analyzed following the official distillation method using a Kjeldahl apparatus [29].

2.4.5. Chemical Analyses of the Substrate at the End of the Strawberry Growing Cycle

At the end of the growing cycle, the substrates were analyzed to determine the amount of N in them and what was still available to the plant. To evaluate the amount of N sorped into zeolite frameworks at the end of each growing cycle, 20 g of fully charged zeolite was put in contact with 200 mL KCl 2 M and stirred for 1 h at 20 °C. After that step, it was centrifuged for 10 min at 3000 RPM and filtered using Whatman n°4 paper. The filtered solution was analyzed following the official distillation method using a Kjeldahl apparatus [29].
At room temperature, potassium removes the ammonium ions bound to the soil exchangers, while the nitrogen fraction (comprised of nitrates and nitrites) is brought into solution by the dipolar effect of water. To analyze the zeolite-treated solutions, the distillation method to determine ammonium was followed [31].
Nitrogen run-off was not evaluated; it was assumed that all the nutrients were sequestered by the plant. In addition, it was supposed that the drip irrigation system had eliminated of any feasible leaching during the strawberry growing cycle.

2.5. Statistical Analyses

One-way analysis of variance (ANOVA) was performed followed by a Duncan’s post hoc test to compare mean values. Differences were considered significant when p-values were lower than 0.05. Statistical software (Statistica 7.0, Statsoft, Tulsa, OK, USA) was used.

3. Results and Discussion

3.1. Chemical Analyses: Ammonium Removal Kinetics and pH Influence

The graph in Figure 1 shows the curve of the removal kinetics of zeolite over time. It is remarkable that the ammonium concentration decreased over time, reaching a plateau after 300 min. This is evidence of the equilibrium established between ammonium and zeolite. The measurements were taken in triplicate. Mean values and standard errors are shown in Figure 1.
The kinetics graph demonstrates linearity and efficiency (Figure 1). A graph of NH4+ removal efficiency as a function of time makes evident that a plateau was reached three hours after exposure.
Ammonium removal efficiency (RE%) by zeolite is highly dependent on the pH of the percolating solution (Figure 2). There is a relationship between pH and ammonium removal that reaches its maximum when the pH is about 8, which is the typical pH of the liquid fraction of digestate (Table 3).
At this point, a test with a sample of real digestate was performed with the percolation system, using 40 g of zeolite and 200 mL of digestate at about 3700 mg/L, pH 8.5. The values at the end of the percolation process are shown in Table 4).
After six-hours, it was determined by the Kjeldahl method that between 80% and 99% of the NH4+ had been abated. Subsequently, the ammonium-charged zeolite was placed in water to evaluate releases (Figure 3).
Changes in ammonium concentration released into water over time can be graphed; the resulting curve can be used to describe three different phases: (1) phase one (blue one) lasts almost 24 h and a rapid ammonium desorption occurs due to NH4+ linked to the most external sites of the zeolite; (2) phase two (orange one) lasts until 150 h (almost 6 days). This phase occurs when desorption attains a plateau and continues at a constant rate; and (3) phase three (green one) lasts until 250 h. In this last step occurs when the NH4+ concentration drops sharply, as a part of it gets converted to nitrate by microorganisms, starting 6 days after the beginning of the experiment. In the first two phases, there is no relevant conversion from ammonium to nitrate or occurrence of other nitrogen species, but in the third phase, we see that the NH4+-N content is 22.5 mg/L and NO3-N is 6.5 mg/L. This desorption analysis shows the behavior of nitrogen released over time. Moreover, the transformation of NH4+ into NO3 is useful, as it is a form that is more assimilable by plants.
Prior to the beginning and after the end of plant growth, the substrates from the various treatments were analyzed. The different amounts of nitrogen supplied to the different theses are shown in Table 5. The measurements were taken in triplicate. Mean values and standard errors are shown in Table 5.
As Table 5 shows, the NH4+-N and NO3-N contents in the substrate were quite low. At the beginning of the growing cycle, N contribution to the plant was almost entirely dependent upon enriched zeolites. As indicated by the N % absorbed by the plant, the adsorption of nitrogen increased linearly with increased enriched zeolite intake [32].

3.2. Plants and Fruits

3.2.1. Plant Growth and Flowering

Three weeks after the plants were transplanted to the treatment pots, the flower counts for each treatment (higher to lower) were as follows: zeolite > zeolite + 30% and zeolite − 30% > control, but only Zeolite and Control showed statistical difference (Table 6). The same result was observed for the total count of flowers per plant. These results confirm that, in general, N fertilization effectively promotes strawberry flower production, which was also observed by Durner [33].
Fertilizer treatments with N released by zeolite also improved strawberry plant growth. In fact, the treated plants showed a statistically higher leaf length, as summarized in Table 7.
Different levels of zeolite added to strawberry plants resulted in increased leaf length during the growing season (Table 8). The treatment also significantly increased the number of leaves per plant compared to the control, particularly by the end of the trial. The plants treated with the highest amount of ammonium-enriched zeolite (zeolite + 30%) had the highest number of leaves per plant (15.1), while the control had the fewest (11.6). These results were consistent with the findings of Gul et al. [34] and Baninasab [35] in horticultural crops, and Abdi et al. [18] in strawberry.
The data summarized in Table 8 exhibit a linear increase in the number of leaves per plant throughout the season for all zeolite treatments compared to the control. The control plants increased in the number of leaves per plant by only a small amount (3.6%), as opposed to the increases observed for zeolite − 30% (49.4%), zeolite (51.8%) and zeolite + 30% (52.5%). These results are evidence that the number of leaves per plant increased as the ammonium-enriched zeolite content in the substrate increased. By the end of the growing cycle, significant differences among the treatments and the control were revealed. These findings align with those of Abdi et al. [18], and are likely due to the availability to the plants of different elements and water from the zeolite.

3.2.2. Plant Weights

The ammonium-charged zeolite treatment significantly affected the accumulation of water and nutrients, as demonstrated by the changes in plant weight measured in the experiment. At the end of the trial, the weight of the control plants was unchanged from their beginning weights. In contrast, the zeolite-treated plants weighed significantly more (Table 9). Turhan and Atilla [36] also reported that a higher proportion of zeolite in a fertilizer substrate improved the vegetative growth (as evidenced by plant weight) of strawberry plants. In addition, in this case, the different amounts of zeolite added to cultural substrate correspond to different amounts of N.

3.2.3. Leaf Color and Chlorophyll Content

The mean values of the L* color parameter are displayed in Table 10. The upper side leaf L* parameter measures differed significantly among the treatments at the 14-, 21-, and 60-day intervals of the production cycle. Briefly, the L* values measured on the leaves decreased during the vegetative period and increased on the last day of the trial period. After 14 and 60 days, the treatments Zeolite − 30% and Control showed the highest values of L*, yielding a more brilliant color. This was probably related to the N content of the leaves; a high N content generally causes a darker color.
The opposite trend was observed in leaf color (C) values (Table 11). During vegetative growth, the C values increased in all treatments, with higher values being recorded in the control treatment leaves which then decreased on the last day of analyses. This finding suggests that plants treated with high quantities of ammonium-enriched zeolite had less-brilliant (duller), lower saturated and darker green leaves compared to the control plant leaves. Changes in chlorophyll content determine changes in leaf color. The chlorophyll content was significantly affected by the amount of N released by enriched zeolite at all times of analysis (Table 12). The chlorophyll content was negatively affected in the control treatment and in the zeolite − 30%, i.e., the samples lost 20.3% and 11.3% of chlorophyll content, respectively. The zeolite and zeolite + 30% treatment leaves were significantly higher in chlorophyll content throughout vegetative growth, with no significant losses during the evaluated periods. More intense green leaf color resulting from higher chlorophyll contents was observed in treatments with higher ammonium-enriched zeolite concentrations.

3.2.4. Production

The addition of ammonium carried by zeolite resulted in a significant increase in the count of harvested fruits per plant, although the count increase was not proportional to the quantity of ammonium-enriched zeolite in the substrate (Table 13).
Generally, fruit size is inversely related to the number of fruits, but in this case, no significant differences were found in average fruit weight among the different treatments, even if the harvested fruits per plant were statistically different.
The treatment with N released by zeolite also increased the count of stolons/plant. Stolon is the vegetative propagation organ naturally produced by strawberries, and it is produced by the plant when nutrient availability is adequate [37]. No stolons were produced in the control treatment, which, according to Durner [33], is an indication that the plant is receiving a low amount of N.

3.2.5. Fruits

High sugar and relatively high acid contents are required for good flavor in strawberry fruit [38]. As shown in Table 14, the values for TSS and TA indicate significant differences among the treatments. The highest TSS (7.90° Brix) and TA (134.04 meq/L) values were found in zeolite-treated samples, while the lowest were recorded in the control strawberries (6.87° Brix and 103.7 meq/L), respectively. Ali et al. [39] similarly observed that different rates of N fertilizer significantly changed acidity in blackberry, and reported that the use of N released by zeolites produced the highest acidity in strawberry. The observed data suggest that zeolites are efficient carriers of N to plants.
With respect to phenolic content, significant differences were found among treatments, with the highest phenolic contents having been observed in zeolite + 30%. Previous work on tomato [40] and grapes [41] also found that increased N fertilization positively affected the total phenolic content. The data obtained here suggest that adding ammonium-enriched zeolite to the cultural substrate is useful to raise the nutritional value of a product due to the known role of phenols as powerful antioxidants.

3.3. Microbial Abundances

The total bacteria, archaea, ammonia-oxidizing bacteria (AOB) and ammonia-oxidizing Archaea (AOA) in the substrates were all measured at the end of the period of plant growth (Table 15). The measurements were taken in triplicate and mean values and standard errors were calculated. Total bacteria and total archaea (data not shown) did not differ significantly in the presence of zeolite compared to the control. Overall, AOB were more abundant in zeolite-treated samples, in which AOA were less abundant than AOB, but not significantly different from zeolite-treated samples, relative to the control. This might arise from the fact that AOB and AOA normally prefer to grow in different soil N conditions; specifically, AOB prefers high ammonia substrates while AOA prefers low ammonia substrates [42]. Jia and Conrad [43] have showed that AOB are functionally more important than AOA in NH3 oxidation in some agricultural soils. The increased abundance of AOB in the presence of ammonium-enriched zeolite suggests that it may favor a stable and active presence of AOB [44] that can release nitrate to the plant. On the other hand, and at the same time, the fact that AOB did not differ in the presence of different zeolite concentrations seems to confirm its slow-release capacity, as microbial communities are affected by nutrients in the substrate solution. However, in this experiment, it was impossible to clearly determine the extent of the effect of zeolite on AOB and other microbial communities with respect to the effect on N. This aspect needs to be evaluated in dedicated experiments in the future.

4. Conclusions

This study of the effect of zeolite ion exchange in strawberry highlighted their ability to retain amounts of nitrogen that would normally be released into the environment. In particular, the trials demonstrated that the zeolite ammonium removal efficiency is best at a pH of about 8, which corresponds to the normal pH of the liquid fraction of digestate. The solution tested in our hypothesis, i.e., reused, ammonium-enriched zeolites as agricultural soil enhancers or fertilizers, produced positive results. The desorption tests, together with the measures of microbial abundance and nitrogen forms in the plant substrates, showed how absorbed N is slowly released over time and gradually transformed into nitrate. The test compared four treatments that differed in terms of the intake of nitrogen in the cultural substrate. In the control treatment, the nitrogen present characterized the used substrate, without further additions, while in the other treatments, different doses of nitrogen-enriched zeolites in ammonia form were added. Obviously, it was expected that strawberries grown in the presence of increasing doses of nitrogen would be more developed than those from control plants, but the aim was to verify the slow release of nitrogen by the zeolites, and to determine whether different doses of ammonium-enriched zeolites could cause differences in the production cycle of strawberries, i.e., similar to what is detectable with normal nitrogen fertilizations. It is known, however, that there is no linear proportionality in terms of increase in production as more nitrogen is added; therefore, we wanted to study whether different nitrogen inputs added using zeolites as carriers gave rise to different behavior in the study plants. Strawberries grown in the enriched substrates resulted in an improved aerial apparatus, including more leaves. Even at the end of the growth cycle, the plants grown with N released from zeolites were greener and had more leaves, with a higher SPAD index indicating greater photosynthetic activity. Noteworthy as well was an increase in the number of stolons emitted per plant, which allows the plant to multiply in the following season. Fruit growth was also slightly increased during the production cycle in zeolite-treated plants. The relatively poor fruit yield that was obtained in the trial was due to the design of the experiment that limited supply of nutrients to nitrogen. Fruit growth depends on the presence of other nutritive elements in addition to N, such as P and K. On the other hand, the N supplied in the trial led to enhanced fruit acidity and sugar, parameters that improve taste.
In conclusion, strawberry plants treated with ammonium-enriched zeolite showed positive effects in growth and photosynthetic activity measures; however, it wasn’t possible to identify a unique trend with respect to the doses of enriched zeolites added to the substrate. All the data point to environmental benefits for more widespread use of zeolite in livestock waste treatment. In future, we plan to continue the study using a real sample of digestate, and to test the efficiency of ammonium-charged zeolite on a fruit orchard. Another aim will be to investigate the economic impact of this choice.

Supplementary Materials

The following are available online at https://www.mdpi.com/2071-1050/12/17/6854/s1.

Author Contributions

Conceptualization, G.G., and M.G.; methodology, V.C., G.C. and R.G.; formal analysis, V.C., E.F. and I.M.; data curation, G.G., R.G., G.C. and M.G.; writing—original draft preparation, G.C., V.C., and R.G.; writing—review and editing, V.C. and G.G.; supervision, G.G. All authors have read and agreed to the published version of the manuscript.

Funding

This research received no external funding.

Conflicts of Interest

The authors declare no conflict of interest.

References

  1. Nasir, I.M.; Mohd Ghazi, T.I.; Omar, R. Anaerobic digestion technology in livestock manure treatment for biogas production: A review. Eng. Life Sci. 2012, 12, 258–269. [Google Scholar] [CrossRef]
  2. Tigini, V.; Franchino, M.; Bona, F.; Varese, G.C. Is digestate safe? A study on its ecotoxicity and environmental risk on a pig manure. Sci. Total Environ. 2016, 551, 127–132. [Google Scholar] [CrossRef] [PubMed]
  3. Arias, D.M.; Uggetti, E.; García-Galán, M.J.; García, J. Cultivation and selection of cyanobacteria in a closed photobioreactor used for secondary effluent and digestate treatment. Sci. Total Environ. 2017, 587, 157–167. [Google Scholar] [CrossRef]
  4. Burton, C.H. The potential contribution of separation technologies to the management of livestock manure. Livest. Sci. 2007, 112, 208–216. [Google Scholar] [CrossRef]
  5. Jha, V.K.; Hayashi, S. Modification on natural clinoptilolite zeolite for its NH4+ retention capacity. J. Hazard. Mater. 2009, 169, 29–35. [Google Scholar] [CrossRef] [PubMed]
  6. Tapia-Venegas, E.; Ramirez-Morales, J.E.; Silva-Illanes, F. Biohydrogen production by dark fermentation: Scaling-up and technologies integration for a sustainable system. Rev. Environ. Sci. Biotechnol. 2015, 14, 761–785. [Google Scholar] [CrossRef]
  7. Ferretti, G.; Galamini, G.; Medoro, V.; Coltorti, M.; Giuseppe, D.; Faccini, B. Impact of sequential treatments with natural and na-exchanged chabazite zeolite-rich tuff on pig-slurry chemical composition. Water 2020, 12, 310. [Google Scholar] [CrossRef] [Green Version]
  8. Doula, M.K.; Elaiopoulos, K.; Kavvadias, V.A.; Mavraganis, V. Use of clinoptilolite to improve and protect soil quality from the disposal of olive oil mills wastes. J. Hazard. Mater. 2012, 207, 103–110. [Google Scholar] [CrossRef]
  9. Mihaly-Cozmuta, L.; Mihaly-Cozmuta, A.; Peter, A.; Nicula, C.; Tutu, H.; Silipas, D.; Indrea, E. Adsorption of heavy metal cations by Na-clinoptilolite: Equilibrium and selectivity studies. J. Environ. Manag. 2014, 137, 69–80. [Google Scholar] [CrossRef]
  10. Colombani, N.; Mastrocicco, M.; Di Giuseppe, D.; Faccini, B.; Coltorti, M. Batch and column experiments on nutrient leaching in soils amended with Italian natural zeolitites. Catena 2015, 127, 64–71. [Google Scholar] [CrossRef]
  11. Rehakova, M.; Čuvanová, S.; Dzivak, M.; Rimár, J.; Gaval’Ova, Z. Agricultural and agrochemical uses of natural zeolite of the clinoptilolite type. Curr. Opin. Solid State Mater. Sci. 2004, 8, 397–404. [Google Scholar] [CrossRef]
  12. Sepaskhah, A.R.; Barzegar, M. Yield, water and nitrogen-use response of rice to zeolite and nitrogen fertilization in a semi-arid environment. Agric. Water Manag. 2010, 98, 38–44. [Google Scholar] [CrossRef]
  13. De Campos Bernardi, A.C.; Oliviera, P.P.A.; De Melo Monte, M.B.; Souza-Barros, F. Brazilian sedimentary zeolite use in agriculture. Microporous Mesoporous Mater. 2013, 167, 16–21. [Google Scholar] [CrossRef] [Green Version]
  14. Faccini, B.; Di Giuseppe, D.; Ferretti, G.; Coltorti, M.; Colombani, N.; Mastrocicco, M. Natural and NH4+-enriched zeolitite amendment effects on nitrate leaching from a reclaimed agricultural soil (Ferrara Province, Italy). Nutr. Cycl. Agroecosystems 2018, 110, 327–341. [Google Scholar] [CrossRef]
  15. Leggo, P.J. An investigation of plant growth in an organo-zeolitic substrate and its ecological significance. Plant Soil 2000, 219, 135–146. [Google Scholar] [CrossRef]
  16. Ferretti, G.; Keiblinger, K.M.; Di Giuseppe, D.; Faccini, B.; Colombani, N.; Zechmeister-Boltenstern, S.; Coltorti, M.; Mastrocicco, M. Short-Term Response of Soil Microbial Biomass to Different Chabazite Zeolite Amendments. Pedosphere 2018, 28, 277–287. [Google Scholar] [CrossRef]
  17. Polat, E.; Karaca, M.; Demir, H.; Onus, A.N. Use of natural zeolite (clinoptilolite). Agric. J. Fruit Ornam. Plant Res. 2004, 12, 183–189. [Google Scholar]
  18. Abdi, G.R.; Khosh-Khui, M.; Eshghi, S. Effect of natural zeolite on growth and flowering of strawberry (Fragaria × ananassa Duch.). Int. J. Agric. Res. 2006, 1, 384–389. [Google Scholar]
  19. Fotouhi Ghazvini, R.; Payvast, G.; Azarian, H. Effect of clinoptilolitic-zeolite and perlite mixtures on the yield and quality of strawberry in soil-less culture. Int. J. Agric. Biol. 2007, 9, 885–888. [Google Scholar]
  20. Cárdenas-Navarro, R.; López-Pérez, L.; Lobit, P.; Escalante-Linares, O.; Castellanos-Morales, V.; Ruíz-Corro, R. Diagnosis of N status in strawberry (Fragaria × ananassa Duch). Acta Hort. 2004, 654, 257–262. [Google Scholar] [CrossRef]
  21. Schepers, J.S.; Blackmer, T.M.; Wilhelm, W.W. Resende M Transmittance and reflectance measurements of corn leaves from plants with different nitrogen and water supply. J. Plant Physiol. 1996, 148, 523–529. [Google Scholar] [CrossRef] [Green Version]
  22. McGuire, R.G. Reporting of objective color measurements. Hort. Sci. 1992, 27, 1254–1255. [Google Scholar] [CrossRef] [Green Version]
  23. Giacalone, G.; Chiabrando, V. Effect of different treatments with calcium salts on sensory quality of fresh-cut apple. J. Food Nutr. Res. 2013, 52, 78–86. [Google Scholar]
  24. Chiabrando, V.; Giacalone, G. Effect of chitosan and sodium alginate edible coatings on the postharvest quality of fresh-cut nectarines during storage. Fruits 2016, 71, 79–85. [Google Scholar] [CrossRef]
  25. Chiabrando, V.; Giacalone, G. Effect of essential oils incorporated into an alginate-based edible coating on fresh-cut apple quality during storage. Qual. Assur. Saf. Crop. Foods 2015, 7, 251–259. [Google Scholar] [CrossRef] [Green Version]
  26. Šavikin, K.; Zdunić, G.; Janković, T.; Tasić, S.; Menković, N.; Stević, T.; Đorđević, B. Phenolic Content and Radical Scavenging Capacity of Berries and Related Jams from Certificated Area in Serbia Plant Foods. Hum. Nutr. 2009, 64, 212. [Google Scholar]
  27. Singleton, V.L.; Rossi, J.A. Colorimetry of total phenolics with phosphomolybdic–phosphotungstic acid reagents. Am. J. Enol. Vitic. 1965, 16, 144–158. [Google Scholar]
  28. Mania, I.; D’Amico, M.; Freppaz, M.; Gorra, R. Driving factors of soil microbial ecology in alpine, mid-latitude patterned grounds (NW Italian Alps). Biol. Fertil. Soils 2016, 52, 1135–1148. [Google Scholar] [CrossRef]
  29. Gottardi, G.; Galli, E. Natural Zeolites; Springer: Berlin/Heidelberg, Germany, 1985. [Google Scholar]
  30. Kithome, M.; Paul, J.W.; Lavkulich, L.M.; Bomke, A.A. Effect of pH on ammonium adsorption by natural Zeolite clinoptilolite. Commun. Soil Sci. Plant Anal. 1999, 30, 1417–1430. [Google Scholar] [CrossRef]
  31. Malekian, R.; Abedi-Koupai, J.; Saeid Eslamian, S. Influences of clinoptilolite and surfactant-modified clinoptilolite zeolite on nitrate leaching and plant growth. J. Hazard. Mater. 2011, 185, 970–976. [Google Scholar] [CrossRef]
  32. Ferretti, G.; Di Giuseppe, D.; Natali, C.; Faccini, B.; Bianchini, G.; Coltorti, M. C-N elemental and isotopic investigation in agricultural soils: Insights on the effects of zeolitite amendments. Chem. Erde 2017, 77, 45–52. [Google Scholar] [CrossRef]
  33. Durner, E.F. Plant architecture of ‘Albion’ strawberry (Fragaria × ananassa Duch.) is not influenced by light source during conditioning. AIMS Agric. Food 2018, 3, 246–265. [Google Scholar] [CrossRef]
  34. Gul, A.; Erogul, D.; Ongun, A.R. Comparison of the use of zeolite and perlite as substrate for crisp-head lettuce. Sci. Hort. 2005, 106, 464–471. [Google Scholar] [CrossRef]
  35. Baninasab, B. Effects of the application of natural zeolite on the growth and nutrient status of radish (Raphanus sativus L.). J. Hort. Sci. Biotechnol. 2009, 84, 13–16. [Google Scholar] [CrossRef]
  36. Turhan, E.; Atilla, E. Effect of chloride application and different growth media on Ionic composition in strawberry plant. J. Plant Nutr. 2004, 27, 1653–1665. [Google Scholar] [CrossRef]
  37. Caruana, J.C.; Sittmann, J.W.; Wang, W.; Liu, Z. Suppressor of Runnerless Encodes a DELLA Protein that Controls Runner Formation for Asexual Reproduction in Strawberry. Mol. Plant 2018, 11, 230–233. [Google Scholar] [CrossRef] [Green Version]
  38. Kader, A.A. Quality and its maintenance to the postharvest physiology of strawberry. In The Strawberry into the 21st Century; Dale, A., Luby, J.J., Eds.; Timber Press: Portland, OR, USA, 1990; pp. 145–152. [Google Scholar]
  39. Ali, L.; Alsanius, B.W.; Rosberg, A.K.; Svensson, B.; Nielsen, T.; Olsson, M.E. Effects of nutrition strategy on the levels of nutrients and bioactive compounds in blackberries. Eur. Food Res. Technol. 2012, 234, 33–44. [Google Scholar] [CrossRef]
  40. Prasad, F.M.; Lal, A.M.; Jilani, A.A.; Singh, J.P.; Arnold, R.; Prasad, V.M.; Singh, R.R. Effect of different levels of bioneema and nitrogenous fertilizer on bio chemical constituents in tomato (Lycopersicon esculentum Mill.) cv. Money Maker. World J. Chem. 2006, 1, 28–29. [Google Scholar]
  41. Delgado, R.; Gonzalez, M.; Martin, P. Interaction effects of nitrogen and potassium fertilization on anthocyanin composition and chromatic features of Tempranillo grapes. OENO ONE 2006, 40, 141–150. [Google Scholar] [CrossRef] [Green Version]
  42. Di, H.J.; Cameron, K.C.; Shen, J.P.; Winefield, C.S.; O’Callaghan, M.; Bowatte, S.; He, J.Z. Ammonia-oxidizing bacteria and archaea grow under contrasting soil nitrogen conditions. FEMS Microbiol. Ecol. 2010, 72, 386–394. [Google Scholar] [CrossRef] [Green Version]
  43. Jia, Z.J.; Conrad, R. Bacteria rather than Archaea dominate microbial ammonia oxidation in an agricultural soil. Environ. Microbiol. 2009, 11, 1658–1671. [Google Scholar] [CrossRef] [PubMed]
  44. Gorra, R.; Coci, M.; Ambrosoli, R.; Laanbroek, H.J. Effects of substratum on the diversity and stability of ammonia-oxidizing communities in a constructed wetland used for wastewater treatment. J. Appl. Microbiol. 2007, 103, 1442–1452. [Google Scholar] [CrossRef] [PubMed]
Figure 1. Ammonium sorption kinetics by zeolite over time.
Sustainability 12 06854 g001
Figure 2. Zeolite ammonium removal efficiency (mg/g) vs. pH.
Sustainability 12 06854 g002
Figure 3. Desorption kinetics of zeolite in a water environment.
Sustainability 12 06854 g003
Table 1. Chemical Composition and physical features of the zeolite.
ClinoptiloliteCristobaliteTridimiteChemical FormulaCAS Number
90–95%0–5%0–5%(Ca2, K2, Na2, Mg)4Al8Si40O96*24 H2O12173-10-3
Chemical Composition %Physical Features
SiO265–72%Oil Absorption Capacity57%Microporous Area11 m2/g
Al2O310–12%Water Absorption Capacity42–50%Mesoporous Area29 m2/g
CaO2.4–3.7%Pore Effective Diameter87Softening point1150 °C
K2O2.5–3.8%Molecular size adsorption4 ÅFusion point1300 °C
Fe2O30.7–1.9%AbrasionNoneApparent density0.6–0.8 g/cm3
MgO0.9–1.2%PlasticityMinorReal density2.2–2.4 g/cm3
Na2O0.1–0.5%PlasticityMinorReal density2.2–2.4 g/cm3
MnO0–0.008%
Cr2O30–0.01%
P2O50.02–0.03%
SiO2/Al2O35.4–7.2%
Table 2. Exchange features of zeolite used in the trial.
Total Cationic Exchange Capacity (CEC)1.5–2.1 meq/g
Most Exchangeable CationsRb,Li,K,Cs,NH4,Na,Ca,Ag,Cd,Pb,Zn,Ba,Sr,Cu,Hg,Mg,Fe,CO,Al,Cr
SelectivityCs+ > NH4+ > Pb2+ > K+ > Na+ > Ca2+ > Mg2+ > Ba2+ > Cu2+ > Zn2+
Adsorption of Criogenic GasesCO,CO2,SO2,H2S,NH3,HCHO,Ar,O2,N2,H2O,He,H2,Kr,Xe,CH2OH
Table 3. Ammonium (NH4+) removal efficiency of zeolite as a function of pH (±SD).
pHNH4+ (mg/L)RE %Zeolite (g)Adsorbed NH4−N (mg/g)
5.5 ± 0.11000.0 ± 1.565.0 ± 1.09100.0 ± 0.25.05 ± 0.14
7.0 ± 0.11000.0 ± 1.569.6 ± 1.30100.0 ± 0.25.36 ± 0.15
8.0 ± 0.11000.0 ± 1.574.4 ± 1.20100.0 ± 0.25.74 ± 0.48
9.0 ± 0.11000.0 ± 1.548.7 ± 0.30100.0 ± 0.25.52 ± 0.20
Table 4. Ammonium removal with a sample of real digestate.
Test N°[NH4+] at the BeginningZeolite (g)pHAbatement (%)Adsorbed NH4+ N (mg/g)
13710408.58259.15
23715508.59959.57
Table 5. Nitrogen in its various forms measured at the start and at the end of the strawberry growing cycle and absorbed by the plants (±SD).
TreatmentNH4+ as N in the Substrate (g)NO3 as N in the Substrate (g)NH4+ as N (g) Intake ZeolitesN Tot at Start (g)NH4+ as N at End (g)NO3 as N at End (g)N Tot at End (g)Plant Absorbed N (%)
Control0.189 ± 0.050.455 ± 0.03-0.64 ± 0.06 d0.15 ± 0.02 c0.24 ± 0.01 c0.39 ± 0.02 c40.22 ± 0.1 b
Zeolite − 30%0.189 ± 0.050.455 ± 0.036.22 ± 0.116.87 ± 0,08 c1.69 ± 0.06 b0.59 ± 0.05 a2.28 ± 0.07 b66.76 ± 0.2 a
Zeolite0.189 ± 0.050.455 ± 0.038.71 ± 0.139.36 ± 0.10 b2.08 ± 0.07 b0.48 ± 0.04 b2.56 ± 0.07 a,b72.69± 0.3 a
Zeolite + 30%0.189 ± 0.050.455 ± 0.0311.2 ± 0.0911.84 ± 0.15 a2.46 ± 0.05 a0.31 ± 0.02 c2.77 ± 0.03 a76.60 ± 0.3 a
Mean values followed by the same letter (a–d) are not significantly different at a p ≤ 0.05 level.
Table 6. Effect of ammonium-enriched zeolite application on vegetative growth: flower count per plant.
Days after Transplant
Treatment71421Total
Control0.1 a1.6 a0.6 b2.3 b
Zeolite − 30%0.2 a2.1 a1.5 a,b3.8 a,b
Zeolite0.3 a1.8 a2.5 a4.6 a
Zeolite + 30%0.3 a2.1 a1.5 a,b3.9 a,b
Mean values followed by the same letter (a,b) are not significantly different at a p ≤ 0.05 level.
Table 7. Effect of ammonium-enriched zeolite application on vegetative growth: average leaf length (cm).
Days after Transplant
Treatment71421
Control3.1 c3.3 c3.7 c
Zeolite − 30%4.1 a4.4 a4.7 a
Zeolite3.4 b,c3.8 b4.4 b
Zeolite + 30%3.7 a,b4.1 a,b4.6 a,b
Mean values followed by the same letter (a–c) are not significantly different at a p ≤ 0.05 level.
Table 8. Effect of ammonium-enriched zeolite application on vegetative growth: number of leaves per plant.
Days after Transplant
Treatment7142160
Control11.2 a11.9 a12.9 a11.6 b
Zeolite − 30%8.7 a10.0 a11.4 a13.0 a,b
Zeolite8.3 a9.9 a10.6 a12.6 a,b
Zeolite + 30%9.9 a11.1 a12.5 a15.1 a
Mean values followed by the same letter (a,b) are not significantly different at a p ≤ 0.05 level.
Table 9. Effect of ammonium-enriched zeolite application on vegetative growth: plant fresh weight (g).
TreatmentDay 0Day 60
Control24.0 a,A24.0 c,A
Zeolite − 30%21.7 a,B40.9 a,A
Zeolite19.4 a,B35.7 b,A
Zeolite + 30%29.6 a,B41.4 a,A
Mean values followed by the same letter (a–c, A,B) are not significantly different at a p ≤ 0.05 level. Lowercase letters in the same column are used to compare treatments. Uppercase letters in the same row are used to compare storage times.
Table 10. Effect of ammonium-enriched zeolite application on leaf color: lightness parameter (L*).
Days after Transplant
L*7142160
Control42.4 a,B41.8 a,C40.8 a,C44.9 a,A
Zeolite − 30%42.4 a,B41.3 a,B37.5 b,C47.9 a,A
Zeolite42.4 a,B38.2 b,C34.8 c,D44.2 b,A
Zeolite + 30%42.4 a,A39.4 b,B36.9 b,C43.5 b,A
Mean values followed by the same letter (a–c, A–D) are not significantly different at a p ≤ 0.05 level. Lowercase letters in the same column are used to compare treatments. Uppercase letters in the same row are used to compare storage times.
Table 11. Effect of ammonium-enriched zeolite application on leaf color: Chroma parameter (C*).
Days after Transplant
C*7142160
Control15.9 a,B24.1 a,A24.9 a,B9.8 b,C
Zeolite − 30%15.9 a,B 18.7 a,A17.6 a,A,B16.8 a,A,B
Zeolite15.9 a,C19.2 a,B23.9 a,A9.3 b,D
Zeolite + 30%15.9 a,B21.1 a,A17.4 b,A8.9 b,C
Mean values followed by the same letter (a,b, A–D) are not significantly different at a p ≤ 0.05 level. Lowercase letters in the same column are used to compare treatments. Uppercase letters in the same row are used to compare storage times.
Table 12. Effect of application of ammonium-enriched zeolite on chlorophyll content: SPAD index.
Days after Transplant
SPAD7142160
Control45.6 a,A37.2 b,B35.3 b,B36.3 b,B
Zeolite − 30%45.6 a,A41.5 a,b,A,B41.2 a,b,A,B40.5 a,B
Zeolite45.6 a,A45.4 a,A43.7 a,A41.9 a,A
Zeolite + 30%45.6 a,A42.6 a,b44.1 a,A41.5 a,A
Mean values followed by the same letter(s) (a,b, A,B) are not significantly different at a p ≤ 0.05 level. Lowercase letters in the same column are used to compare treatments. Uppercase letters in the same row are used to compare storage times.
Table 13. Effect of ammonium-enriched zeolite application on vegetative growth: harvested fruits/plant, total fruit weight, count of stolons/plant.
TreatmentHarvested Fruits Per PlantAvg Fruit Weight (g)Number of Stolons/Plant *
Control4.2 b6.1 a0
Zeolite − 30%6.7 a,b5.6 a7
Zeolite4.6 b5.3 a8
Zeolite + 30%8.0 a5.3 a10
Means values followed by the same letter a, b, ab are not significantly different at a p ≤ 0.05 level. * Raw data.
Table 14. Titratable Acidity (TA) (meq/L), Total Soluble Solid (TSS) (° Brix) and Total Phenolic Content (TPC) (mg Gallic Acid/100 g FW).
TA
(meq/L)
TSS
(° Brix)
TPC
(mg Gallic Acid/100 g FW)
Control103.7 c6.9 c73.0 b
Zeolite − 30%121.4 b7.2 b69.5 c
Zeolite134.1 a7.9 a73.3 b
Zeolite + 30%121.8 b 7.4 b78.4 a
Mean values followed by the same letter(s) (a–c) are not significantly different at a p ≤ 0.05 level.
Table 15. Abundance of microbial markers in the growth substrate at the end of the experiment (±SD).
TreatmentBacteria
(Log Copies/g Dry Substrate)
AOB
(Log Copie/g Dry Substrate)
AOA
(Log Copies/g Dry Substrate)
Control9.11 ± 0.3 a4.49 ± 0.5 b4.55 ± 0.4 a
Zeolite − 30%9.33 ± 0.4 a6.46 ± 0.4 a4.57 ± 0.6 a
Zeolite9.49 ± 0.1 a6.73 ± 0.2 a5.14 ± 0.5 a
Zeolite + 30%9.42 ± 0.2 a7.60 ± 0.3 a4.74 ± 0.1 a
Means values followed by the same letter(s) (a,b) are not significantly different at a p ≤ 0.05 level.

