Abstract
The costs of unintended side effects of agriculture such as water pollution cannot be directly observed in markets. However, the values society places on healthy agricultural environments are increasingly reflected in payments to farmers for measures to avoid or reduce environmental damage. This paper presents a framework for estimating external costs of agriculture from payment rates of agri-environment measures addressing specific externality issues. The framework is applied to the broad range of agri-environment measures implemented in Swiss agricultural policy. Estimates of external costs are derived for emissions of greenhouse gases, ammonia, nitrate and pesticides, soil erosion, habitat deficits, and animal suffering. The total external costs of Swiss agriculture are estimated at CHF 3.651 billion (CHF 3494 per hectare) when the calculations are based on the agri-environment measures’ average avoidance costs and of CHF 5.560 billion (CHF 5321 per hectare) when the calculations are based on highest observed avoidance costs. Potential applications include internalization policies, evaluations of agri-environment support, and integrated environmental and economic accounting.
1. Introduction
Modern agricultural production has a variety of side effects on human health and natural environments [1,2]. To counter these effects, governments in many developed countries allocate significant funds to agri-environment schemes that compensate farmers for using more environmentally friendly farming practices [3,4]. Nevertheless, substantial impacts on the environment and human health remain unaddressed, causing significant direct and indirect costs to society, for instance through water and air pollution [5,6] or losses of biodiversity [7]. Both the financial costs of the agri-environment schemes and the remaining impacts are external to the market economy. They do not show up in the market prices paid by consumers of agricultural products. In economic terminology, these side effects of production and consumption are known as external costs or externalities (e.g., [8]).
From the perspective of society as a whole, the externalities of agriculture are a serious issue from both efficiency and fairness perspectives. In the presence of negative externalities, the market prices do not reflect the full costs of production and thus signal to consumers that the costs of food are lower than they actually are. Accordingly, consumers buy and consume too many harmful products relative to a situation in which they pay the full costs of their consumption. In addition, those who consume less environmentally damaging products are equally affected by the damage, and those who produce in environmentally friendly ways may be outcompeted by inexpensive but environmentally harmful forms of production. The classical solution of these efficiency and fairness issues is to ‘internalize’ the externalities through environmental taxes on the activities that cause the externalities. To justify such taxes and to calculate appropriate tax rates, the external costs of agriculture need to be understood [9].
Previous studies assessing external costs of agriculture at the national level have focused mainly on a comprehensive assessment of direct financial costs of environmental damage such as expenditures for treatment of polluted water, medical treatment of respiratory diseases, restoration of habitats, or monitoring programs (e.g., [10]; see following section). The financial costs, however, do not represent the total external costs, since they do not account for any damage that goes untreated.
The present study takes a different approach. For each examined externality, it considers two cost components: The direct financial costs of agri-environment measures to avoid or reduce the externality and the additional costs to society arising from the current (remaining) externality. The valuation of the latter is based on what society is paying to reduce the externality by one unit. This amount is derived from the payment rates and effectiveness of the respective agri-environment measures. The value per unit of externality—a so-called shadow price, as it is not paid in a regular market—is then multiplied with the quantity of the externality to obtain the external costs of the current quantity of externality. This empirical approach benefits from a tendency in agricultural policies to increasingly address environmental issues through voluntary agri-environment schemes.
The approach is implemented with data for Switzerland. Important externalities of Swiss agriculture include emissions of greenhouse gases, ammonia, nitrate, and pesticides, soil erosion, habitat loss, and animal suffering. For each of these externalities, Swiss agricultural policy offers financial incentives for voluntary mitigation.
The paper contributes to the literature in three ways: (1) By structuring the approaches used in previous studies; (2) by proposing a framework for the valuation of agricultural externalities based on payments for agri-environment measures; and (3) by presenting a relatively comprehensive assessment of the external costs of Swiss agriculture.
2. Literature Review
The existing literature on agricultural externalities comprises only five well-documented and comprehensive assessments at national or higher level. Table 1 provides an overview of these studies, the valuation approaches they followed, and the reported externality estimates per hectare of agricultural land. The first of these studies, by Pretty et al. [10], largely defined the methodology that was pursued in the following papers, with the exception of FAO [9].

Table 1.
Valuation approaches used in studies assessing externalities of agriculture at national or higher level.
Pretty et al. [10,11] start from a list of physical damage categories such as “pesticides in sources of drinking water”. They then compile mainly financial costs arising from (water) treatment, medical treatment, restoration efforts, etc., for each category of damage. The implicit valuation is a social valuation as the action in most cases follows from political or administrative decisions. As an important consequence of the focus on financial costs, important portions of the damage remain unassessed. For instance, if polluted drinking water is not treated or remains polluted even after treatment, the remaining externalities do not give rise to any financial costs.
Only for selected categories of damage do the authors also assess additional damage to the environment or human health that does not give rise to any direct financial costs. The valuation of these externalities is based on an assessment of the quantity of emissions or damage, which is then multiplied with values (or shadow prices) obtained, with one exception, from survey studies of individual willingness to pay for reductions of environmental damage or negative health outcomes [10] (p. 124). The mentioned exception concerns the valuation of losses of hedgerows and of drystone walls. For this category of externality, Pretty et al. [10] derive external costs from actual expenditures for restoration. Based on agri-environment payments of £2–4 per meter for restoration of hedgerows and an annual loss of 24,260 km of hedgerows, they estimate annual external costs of £48.5–97.0 million [10] (p. 126). The calculations for drystone walls are analogous. Hence, these external costs not only include direct financial expenditures, but extend to the entire losses, which are valued at the rate paid for restoration. A further paper by Pretty et al. [12] updates the data reported for the UK as a basis for other calculations.
Tegtmeier and Duffy [13] similarly compile detailed financial costs for partial prevention (including monitoring), restoration, and treatment costs. However, unlike Pretty et al. [10] they dismiss the survey-based valuations of damage due to greenhouse gases and ammonia emissions. Ammonia emissions are not assessed at all and CO2 emissions are multiplied with a price of less than $1 per ton obtained from a voluntary emissions trading scheme. Like Pretty et al. [10] (p. 118), however, the authors note that the numbers may substantially underestimate the total external costs [13] (p. 16). A similar approach is also applied in a working paper by Jongeneel et al. [14]. The authors follow Pretty et al. [10] in drawing on selected survey-based valuations—for ammonia and nitrate emissions. For greenhouse gases, they follow Tegtmeier and Duffy [13] by relying on prices from a market for emission permits.
An entirely different approach is followed in a report by the Food and Agriculture Organisation of the United Nations [9]. Unlike their predecessors, the authors do not even try to compile the myriad of financial costs arising from nitrate removal from drinking water, replacement of polluted bee colonies, or restocking of fish populations. Instead, they assess total emissions, use impacts models to assess losses of quality-adjusted life years and other categories of damage, and multiply these quantities with shadow prices from survey-based valuation. An important additional ingredient is this multi-country assessment is the transfer of estimates across countries.
The differences in methodology are reflected in reported estimates per hectare of agricultural land (see Table 1, last column). The numbers vary substantially. One particularly important methodological aspect concerns the extent to which other than direct financial costs were assessed. Another important factor is the approach used for the valuation of greenhouse gases (see Table 1, second to last column).
The present study (see Table 1, last column) is methodically similar to the FAO study by establishing shadow prices for each major externality, which are then multiplied with the respective quantity of emissions. It differs, however, in that the shadow prices are based on politically determined actual payments rather than survey-based valuations of hypothetical avoidance or abatement measures. The valuation essentially follows the approach that Pretty et al. [10] pioneered for the valuation of hedgerows and drystone walls (see above). A minor difference is that the approach used here relies on avoidance instead of restoration measures. Furthermore, the approach is applied to a broad range of agricultural externalities rather than only a few selected ones.
3. Conceptual Framework
3.1. External Costs and Benefits
External costs, or negative (technological) externalities are costs of unintended side effects of economic activities that do not show up in the prices paid by producers and consumers (e.g., [8,15]). Instead, these costs are incurred by third parties who are suffering from environmental and health impacts of emissions, for instance. In the presence of negative externalities, the market mechanism allocates resources in ways that are wasteful from the perspective of society at large. Too many goods with negative side effects are produced and consumed relative to socially optimal patterns of production and consumption. ‘Market failure’ due to externalities can be corrected by environmental policy instruments such as environmental taxes levied on the activities that cause the negative externalities.
External benefits, or positive externalities, are defined analogously. Contrary to environmental pollution, however, the benefits of many positive side effects of agriculture have recently been ‘internalized’ through public payments that compensate farmers for agri-environmental services. For instance, management of hedgerows is financially compensated in many European countries [16]. Accordingly, the social benefits from hedgerows are no longer external. Rather, the management of hedgerows is now a privately provided, publicly financed service. As pointed out early on in the literature on externalities, however, not all positive externalities give rise to efficiency issues [17]. For instance, farming keeps the landscape clear from forest, and open landscapes are perceived as a desirable side effect of agriculture in many countries. However, as long as farming is a profitable activity, open landscapes will not be under-provided from the perspective of society. The externality is therefore irrelevant from the point of view of an efficient allocation of resources.
3.2. Avoidance Cost Approach
While the polluter-pays principle suggests placing external costs on the polluters who cause them, agri-environment payments follow the opposite principle, which is sometimes called the ‘beneficiary-pays principle’. In many countries, agri-environment payments explicitly compensate farmers for reducing emissions or avoiding other negative externalities. The politically determined expenditures—or the payment rates per unit of avoided externality—are what society is paying to avoid or reduce negative externalities. Moreover, agri-environmental avoidance expenditures may reflect what society is willing to pay for avoiding negative externalities. Where this is the case, they afford a valuable opportunity to derive estimates of the external costs of agriculture.
The interpretation of avoidance expenditures in terms of societal willingness to pay is valid if the agri-environment measures are well established and supported by the public. Whether this applies is an empirical question that needs to be examined in empirical applications. At a general level, survey research suggests that agri-environmental measures are currently well accepted in Europe. The Special Eurobarometer 410 on “Europeans, Agriculture and the Common Agricultural Policy” [18], for instance, asked whether “Linking financial aid to farmers to compliance with farming practices which benefit the environment” is “[…] a very good thing, a fairly good thing, a fairly bad thing or a very bad thing”. The overall responses at the level of the EU were 52% “very good”, 39% “fairly good”, 4% “fairly bad”, 2% “very bad”, and 2% “don’t know” (cf. [19]). In Switzerland, too, agri-environmental schemes seem to be generally well established and accepted (see Discussion).
The valuation of externalities based on avoidance costs of agri-environment payments involves two components (Figure 1): The direct financial costs of the agri-environment measures and the additional costs arising from the remaining externalities, which are not prevented by the measures. The first component, the direct financial costs, are illustrated in Figure 1 with three measures offering payments c1, c2, and c3 per unit of avoided emissions. Collectively, these measures reduce emissions from Q0 to Q3. The total of the direct financial cost of this emissions reduction is given by the area B. These direct financial costs are readily looked up from public budgets.
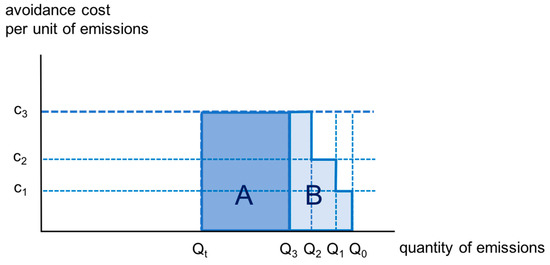
Figure 1.
Illustration of assessed external costs. Lightly shaded area B: Financial costs of avoidance (three measures with avoidance costs per unit of emissions c1, c2 and c3). Dark shaded area A: Costs of unavoidable emissions to the environment and human health. Q0: Quantity of emissions before avoidance measures; Qt: Socially determined emissions reduction target.
The second component of the external costs is illustrated by the rectangular area A, which is given by the avoidance cost for additional emissions reductions (c3) and the current amount of harmful emissions (exceeding a target level Qt), given by Q3–Qt. The fact that society is paying farmers c3 for additional units of emissions reduction suggests a social willingness to pay per unit of emissions reduction—or shadow price—of c3.
The empirical application of this framework involves the following steps:
- (1)
- Identifying the agri-environmental measures that compensate farmers for avoiding or reducing greenhouse gas emissions and other relevant externalities;
- (2)
- Assessing the effectiveness of these measures;
- (3)
- Computing the costs per unit of avoided externality (c in Figure 1);
- (4)
- Identifying the quantities of harmful externalities;
- (5)
- (6)
- Computing the estimate of total external costs of agriculture by summing across all examined externalities.
The Methods section addresses each of these steps in turn.
3.3. Concept of Value
Underlying concepts of value matter for the appropriate interpretation of valuation estimates. The presented valuation framework is based on the economic concept of exchange value. Exchange values are the values at which goods and services are exchanged between buyers and sellers (e.g., [20,21]). If the transaction takes place in a market context, the exchange value is simply the market price. However, the concept of exchange values extends to prices paid in transactions involving other than market institutions.
Figure 2 illustrates the concept in a standard economic diagram and compares it with the concept of welfare value, which is another frequently used concept of value. The exchange value of a quantity Q includes the production costs (area A) and the producer surplus (area B). The welfare value of the same quantity includes the entire area under the demand curve up to quantity Q. The additional component is the consumer surplus (area C). As can be seen from the figure, the exchange value of an emissions reduction is lower than the welfare value.
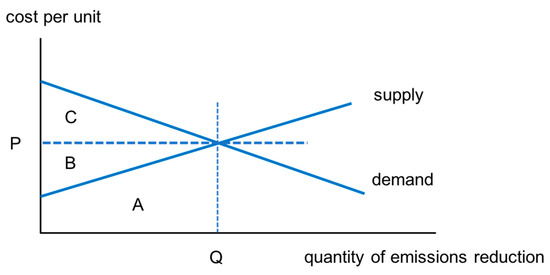
Figure 2.
Microeconomic diagram illustrating the economic concepts of exchange value and welfare value. The exchange value of quantity Q is given by the sum of areas A and B. The welfare value (or benefit) is given by the sum of areas A, B, and C.
Exchange value is the theoretical concept of choice in national accounting frameworks where goods and services are valued based on the prices paid in transactions (e.g., [21,22]). Since the value per unit of the good is constant (price P in Figure 2), the monetary accounting can proceed by simple multiplication of quantity and price.
Welfare value, in contrast, is the theoretically preferred concept of value in cost–benefit analysis where the consumer surplus plays an important role. In empirical studies, however, the difference of two concepts is not as clear-cut as the theoretical distinction suggests. There are two main reasons for this. First, empirical work is often concerned with relatively small changes in the quantity of public services or externalities. In these cases, the change in the quantity of the good, multiplied with exchange value, is a good approximation of the welfare value. Second, measuring welfare values of externalities has proven to be difficult (e.g., [23]). In cost–benefit analysis, too, the monetary valuation of public goods and externalities therefore often rely on exchange values. Following this practice, the estimates derived from the avoidance cost approach may not only be used in the context of environmental accounting, but also for cost–benefit analysis in the public sector.
4. Methods
4.1. Identification of Avoidance Measures
In a first step, the direct payments for agriculture in Switzerland (see Supplementary Materials) were classified into three categories: (1) Payments for services, (2) subsidies for damage avoidance, and (3) other subsidies. Payments for services is used for measures that (a) support public goods or positive externalities of agriculture at levels that (a) go beyond statutory requirements and (b) would not be provided without the financial support. Subsidies for damage avoidance is used for measures to avoid negative externalities following the beneficiary-pays principle. They include payments to achieve legal environmental targets or at least prevent further deterioration of environmental quality. Other subsidies include all other direct payments, which are essentially pure income support. Some of the official targets and labels of the direct payment categories are somewhat misleading with regard to the actual effects of the payments. The classification is therefore not only based on official scheme objectives, but also on evaluations such as the those by Mack et al. [24] and Möhring et al. [25] and, where no such studies were available, expert assessments [26].
Based on these definitions and classification, 22.1 percent of the direct payments for agriculture in Switzerland in 2018 were subsidies for measures to avoid production-related environmental and other damage, including animal suffering (Table 2). The sizes of the major expenditure categories have remained largely unchanged since a minor reform of the direct payment system in 2014 [27]. The total direct payment support has closely followed the budget due to a category of payments (called transitional payments; see Supplementary Materials), which distributes any unused funds among the farms.
Table 2.
Composition of direct-payments expenditures.
Table 3 presents a list of the identified avoidance measures together with total expenditures, payment rates, and targeted externalities. For measures targeting multiple externalities, the last column allocates the payments to single targets (cf. Section 4.3). The list comprises 15 voluntary measures for reducing negative externalities of agriculture, 13 of them related to the environment and the remaining two related to animal welfare externalities. Furthermore, it includes the national CO2 levy on fuels; this is not an agri-environment measure but an environmental tax that is not specific to agriculture.
Table 3.
Agri-environmental measures: Total expenditures, payment rates, targeted externalities, and allocation of payment rates to targeted externalities.
4.2. Effectiveness of the Avoidance Measures
While the costs of the measures were readily available (see Table 3), their effectiveness had to be derived from available scheme evaluations. For each of the measures identified above, the following paragraphs describe the quantified effects on emissions as reported in the examined studies and any additional assumptions required for the calculation of expenditures per unit of avoided damage. In a few cases, the authors of the reported studies were contacted for appropriate interpretations.
4.2.1. Direct Seeding
Local field studies were found for the effects of direct seeding on nitrate emissions, greenhouse gas emissions, and soil erosion.
Nitrate emissions—The available evidence includes the results of two field experiments in Switzerland. In one experiment with four cropping systems, direct seeding reduced aquatic eutrophication on average by about 10%, from 36 kg N ha−1yr−1 for conventional tillage [28] (p. 45). An earlier field experiment found that no-tillage reduced aquatic eutrophication by 3 kg N ha−1yr−1, from 46 to 43 kg N ha−1yr−1 [29]. Based on these effects, we assume that the loss of nitrate was reduced by 3 kg nitrate-N ha−1yr−1.
Greenhouse-gas emissions—In four examined cropping systems, direct seeding reduced global warming potential by about 10% on average, based on a mean value of 2376 kg CO2eq. ha−1yr−1 for conventional tillage [28] (p. 44). Schaller et al. [29] report a reduction from an average of 2141 kg to 2017 kg CO2eq. ha−1yr−1 for conventional tillage. Based on these estimates, we assume an effect of 150 kg CO2eq. ha−1yr−1. The field studies did not examine effects of carbon sequestration, as these effects remain uncertain. The difference was therefore driven entirely by the energy demand of tillage operations [28] (p. 44).
Soil erosion—Schaller et al. [29] report that soil erosion under conventional tillage increased from zero for a slope of 5% to 0.87 mm per year for a slope of 18% but remained low under direct seeding management. We therefore assume that direct seeding prevents soil erosion from exceeding the legal target levels.
Ammonia emissions (terrestrial eutrophication) were unaffected by the direct seeding measure [28] (p. 45). For the similar ‘mulch seeding’ and ‘strip seeding’ measures (see Supplementary Materials), there are no experimental results available to estimate effects on emissions or soil erosion (personal communication R. Wittwer, 27 August 2019).
Based on the reported effects and the objectives described in official documents [30], the objectives of the measure were weighted as follows: Reduction of nitrate emissions and soil erosion each with 33.3 percent and greenhouse gas emissions reduction with 16.7 percent. The remaining 16.7 percent were not allocated to any of the three above externalities to account for further unquantified positive effects such as decreased soil compaction (cf. [30]). The payments for the measure were thus allocated to the targeted externalities in these proportions.
4.2.2. Nitrogen-Reduced Feeding of Pigs
Bracher and Spring [31] report a reduction of ammonia emissions by 6 to 8 percent for this measure. Based on this result, we assumed a reduction of both ammonia and NO2 greenhouse-gas emissions by 7 percent.
Ammonia emissions—Based on estimates by Kupper et al. [32] (p. 5), pigs were (in 2015) responsible for 15 percent of the total ammonia emissions of 41,600 t N. Based on a stock of about 180,000 LSU [27], the 7-percent emissions reduction amounted to 2.34 kg N LSU−1.
N2O emissions—About 50 percent of the agricultural emissions of nitrous oxide in Switzerland are caused by the management of manure [33]. Total emissions from manure management of 1.1 × 10⁶ t CO2eq.yr−1 [27] and a share of 15 percent from pigs translates to total emissions of 165,000 t CO2eq.yr−1 or 0.92 t CO2eq.LSU−1yr−1. The 7-percent emissions reduction therefore translates into an emissions reduction of the measure of 0.064 t CO2eq.LSU−1yr−1.
Since only the objective of ammonia reduction is explicitly mentioned in official documentations of the measure [34], this objective was weighted with 75 percent and the objective of N2O emissions with 25 percent. The payment for the measure was therefore allocated to the two objectives in this proportion.
4.2.3. Reduced-Emissions Application of Manure (3 Measures)
Ammonia emissions—The baseline ammonia loss (without reduction measures) reported for average conditions in Switzerland is 15 kg per hectare and application [35,36]. Agridea [37] referring to UNECE [38] reports interval estimates for the percentage reduction of ammonia losses for the three measures, trailing hose, trailing shoe, and injection. The effectiveness of the measures was based on the midpoints of these intervals—32.5, 45, and 70 percent reduction—which corresponds, respectively, to reductions of 4.875, 6.75, and 10.5 kg N per hectare and application.
4.2.4. Extensive Livestock on Grassland
Ammonia emissions—Based on a recent evaluation, the long-term effect of the measure is a reduction of the nitrogen surplus by 2 kg N ha−1yr−1 [24] (p. 64). Additional effects on N2O (greenhouse gas) emissions are not considered, since extensive livestock results in lower production levels and, assuming constant consumption, increased production levels elsewhere (with similar greenhouse gas implications but possibly less impact in terms of ammonia concentrations or N-deposition).
4.2.5. No application of Synthetic Herbicides (Measures for Different Crops)
Quantitative information on externalities from herbicides applied in the different cultures was not available. The effects were therefore quantified simply in terms of the area (in hectares) in which pesticide emissions were avoided due to the measures.
4.2.6. No application of Synthetic Fungicides or Insecticides (Measures for Different Crops)
Quantitative information on externalities from fungicides and insecticides applied in the different cultures were not available. The effects were therefore quantified in terms of area (in hectares) in which pesticide emissions are avoided due to the measures.
4.2.7. Biodiversity Measures Securing Minimal Habitat Requirements
Some low-level ‘biodiversity areas’ (measures 15 to 18 in Table 3) did not involve any specific biodiversity criteria (e.g., [39]). Their objective was essentially to avoid general habitat deficits in the agricultural landscape, as opposed to the higher-level biodiversity measures, which are more appropriately classified as payments for services (cf. Section 4.1). The effects were identified in terms of area (in hectares) under these measures.
4.2.8. Animal Welfare—Outdoor Space and Housing Conditions
The identified effect of the measure is the number of LSU under the measures. Payments per LSU varied by livestock categories.
4.2.9. CO2 Tax on Fuels
The national-level CO2 tax on fuels directly implies avoidance costs of CHF 96 per ton of CO2 (borne by the polluters).
4.3. Calculation of Costs per Unit of Avoided Externality
Two of the voluntary measures, ‘direct seeding’ and ‘nitrogen-reduced feeding of pigs’ addressed multiple externalities (see Section 4.2.1 and Section 4.2.2). The payments were allocated to these objectives based on the available empirical evidence about the measures’ effects on the respective emissions and the importance of the objectives in official documents introducing the measures. A measure i‘s cost per unit of avoided externality j, cij, was then computed from the payment per unit of the measure allocated to the respective externality, pij, and the quantity of externality j avoided by one unit of the measure i, eij:
where externalities were quantified simply in terms of hectares or livestock units under a specific management, the payments per unit of the measure equal payments per unit of externality.
Costs per unit of avoided damage could be derived for nine externalities j, including greenhouse gas emissions, ammonia emissions, nitrate emissions, soil erosion, two types of pesticide impacts, habitat deficits, and two aspects of animal-welfare deficits (Table 4). As can be seen in the table, there are several cases in which costs per unit of avoided externality j could be derived from more than one measure. For some of the externalities, the computed numbers suggest a substantial variation of cost-effectiveness among different measures. For instance, ‘low-intensity livestock on grassland’ (measure 7 in Table 4) was a particularly expensive measure for reducing ammonia emissions, about 20 times more expensive than the measure ‘reduced-emissions application of manure’.
Table 4.
Targeted externalities: Calculation of payment per unit.
Where cj could be computed from two or more measures i, we recorded both the weighted average expenditure (weighted by the total expenditures for the respective measures) and the highest expenditure (based on the least cost-effective measure) for avoiding one unit of the externality. The highest avoidance costs (implied by the least cost-effective measure) may be interpreted as the marginal avoidance costs, i.e., the costs of avoiding one additional unit of externality, given the avoidance measures currently in place.
4.4. Quantity of Harmful Emissions
Not every unit of agricultural emissions causes damage. For instance, nitrogen deposition in ecosystems is harmful for biodiversity only above certain thresholds (critical loads). For the environmental externalities, the harmful quantity was identified based on legal environmental targets [40,41]. For animal welfare externalities, we assumed that the livestock systems that ‘only’ conform to regal requirements are perceived by society as causing animal suffering, which is avoided by the measures for additional outdoor space and animal-friendly housing. Specific relevant physical quantities of the externalities were identified as follows.
For greenhouse gases, the relevant amount of emissions is the total, since every unit of emissions causes negative external effects. For ammonia and nitrate emissions, the amounts exceeding the national-level legal target were identified as the relevant quantities [40,41]. The total surface with relevant soil erosion is based on a long-term study from an agricultural region that is representative of arable land use in Switzerland (described in [42], p. 34). In the study area of 265 hectares, the legal target for soil erosion was exceeded on 7 percent of the parcels. Based on a total arable land surface of 400,000 hectares, this translates to an affected area of 28,000 hectares. For pesticide applications, we consider the total surface on which synthetic pesticides are applied as the relevant quantity. This is based on findings that the legal targets for surface water quality are currently exceeded on most sprayed agricultural land in Switzerland—field crops, intensive fruit production, and vineyards [43]. Moreover, legal targets for groundwater are missed in many regions with intensive crops [44]. The current areas with synthetic herbicide and fungicide or/and insecticide applications were calculated from total areas of each crop [27], percentage of the area (parcels) treated with pesticides including non-synthetic ones [45], and areas under organic or other no-pesticide measures [27]. Quantifiable negative externalities due to habitat deficits could not be found in the literature. In quantitative terms, the current measures appear to be sufficient in to secure basic habitat functions like pollination. Finally, for quantity of animal suffering, the number (in each livestock category) of LSU not managed under the voluntary animal welfare measures was identified as the relevant quantity.
4.5. Calculation External Costs for Each Externality
The external costs Cj of each externality j were calculated as
where Pj represents the financial cost of avoidance measures for externality j, Qj is the current harmful quantity of externality j, and cj is the cost of avoiding one unit of externality j. The total costs of the externality Cj were computed both based on the average avoidance costs and based on the highest avoidance costs (cf. Section 4.3).
4.6. Calculation of Total External Costs
Finally, the total external costs of agriculture were calculated by summing over all examined externalities:
4.7. Data
We used the most recent available data (for 2018) for payment rates per unit of the measures [46] and budgetary expenditures [27]. For the sources of the empirical parameters used to calculate avoidance costs see Section 4.2.
5. Results
5.1. Avoidance Costs per Unit of Externality
Columns 4 and 5 in Table 5 show the avoidance costs per unit of externality for each of the nine impact categories. The average avoidance costs (second-to-last column) indicate the price that society is currently paying per unit of the externality. The highest expenditures (last column) may be interpreted as the marginal avoidance costs, which is the cost to society of avoiding one additional unit of externality, given the avoidance measures that are already in place. For several externalities, however, the average and marginal costs are identical, since there was only one agri-environmental measure from which per-unit avoidance costs could be calculated.
Table 5.
Avoidance costs per unit of externality (or shadow prices).
5.2. Total External Costs
Table 6 presents, first, the direct financial costs of the avoidance measures (second column). These costs, which are borne by the taxpayers, amount to CHF 636 million. Of these, CHF 553 million could be attributed to specific externalities, while the remaining CHF 83 million were payments for organic farming and other measures that address multiple externalities which cannot be reasonably disentangled.
Table 6.
Total external costs.
Columns 3 and 4 in Table 6 show the costs of the current level of harmful externalities for each of the nine impact categories. These are the costs shouldered by society at large. The categories with the largest external costs are the ammonia emissions and the greenhouse gas emissions. The valuation of the latter depends heavily on whether one applies average or marginal costs. In most categories, the external costs of current emissions are much higher than the direct financial costs of the avoidance measures. An exception is the payments for measures to avoid animal suffering.
In the final two columns in Table 6, the direct financial costs for the avoidance measures (column 2) and the external costs of the current externalities (columns 3 and 4) are added together to obtain the total external costs. The resulting figures are CHF 3.651 billion when computed based on average avoidance cost and to CHF 5.560 billion when computed based on highest or marginal avoidance costs. The corresponding values per hectare of utilized agricultural area (excluding alpine summer pastures) are CHF 3494 and CHF 5321 per year.
6. Discussion
The present results for the agricultural externalities in Switzerland add to earlier findings that agriculture in Switzerland enjoys generous support from the public while placing a substantial burden on taxpayers and society at large [47,48,49]. The computed external costs of CHF 3.5 to 5.5 billion compare with a total national-level budgetary support for agriculture of CHF 3.6 billion and an OECD total support estimate (including border protection measures) of CHF 6.8 billion [27,49]. Adding the external costs to the total support estimate of the OECD results in a total burden in 2018 of CHF about 11 billion, which exceeds the gross market output of agriculture of CHF 10.7 billion [50]. The external costs per hectare of agricultural land are about three to five times higher than recent estimates for other countries (see Table 1). To put this in perspective, note that financial expenditures for agriculture are about five to ten times higher in Switzerland than in other highly developed countries [47,49].
As in all assessment of externalities derived from expenditures for actual policy measures, the estimated values in this study are based on costs and not on preferences. Any interpretation in terms of societal preferences requires the assumption that the policy decisions are supported by the population, or more specifically, the taxpayers (cf. Section 3.2). In the case of the Swiss agri-environment measures, this assumption seems to be reasonably well met. While categories of largely unconditional support for agriculture are currently under pressure from environmental NGOs and voter initiatives [51,52,53], the agri-environment measures have rarely been questioned. This is remarkable, since these agri-environmental avoidance measures contradict the polluter-pays principle, which plays an important role in other policy areas in Switzerland (e.g., [54]. One possible explanation is that a substantial part of the support for agriculture in Switzerland remains largely unconditional (cf. Table 2 and Supplementary Materials) or based on output. Against this background, even measures with extremely modest cost-effectiveness (see Table 5) may be perceived as “steps in the right direction”.
The estimates obtained in this study should be relevant in at least four areas. First, they provide a basis for policies to internalize the external costs of food [12,55]. The externalities of Swiss agriculture conflict with both the polluter-pays principle of Swiss environmental legislation (Environmental Protection Act, Art. 2) and official policy objectives in the areas of environment and public health (e.g., [41,56]). Based on a gross value (producer price) of food production of about CHF 7.7 billion [50], budgetary support for agriculture of CHF 2.4 billion (excluding payments for services; see Table 2), and externalities of CHF 4.0 billion (excluding the direct financial costs; see Table 6), the consumers contribute a mere 54 percent of the costs of food. Adding various tax exemptions for agriculture and off-site externalities from feed imports, neither of which are accounted for in the present estimates, the consumers pay well below 50 percent of the bill. The present study highlights this large price distortion and provides a basis for determining appropriate tax rates on excessive emissions or on the production systems that cause them (see e.g., [57,58]).
A second application concerns the evaluation of agri-environmental policy measures. The estimated costs per unit of avoided emissions (see Table 5) show that cost-efficiency of the agri-environment measures varies widely. In line with findings at the European level [26], the figures suggest that expenditures could be invested in much to more effective measures to increase the cost-effectiveness of agri-environmental policy (cf. [24,25]).
A third policy implication concerns the existing cross-compliance regulations in Swiss agriculture. The estimated externalities suggest that these regulations are not sufficiently stringent (cf. [47], p. 22). The current total of CHF 2.8 billion in direct payments conditional on cross-compliance seem difficult to justify given the levels and costs of negative externalities found in this study.
Finally, as mentioned in Section 3.3, the concept of value applied in this study is compatible with national accounting frameworks (see [20,59]). The reported numbers can be used for performance measurement in the public sector, for instance in augmented national accounting frameworks. Such frameworks can provide corrected measures of value added or labor productivity that account for public services as well as negative externalities and offer useful guidance for policy.
7. Conclusions
The present study used politically negotiated payment rates and expenditures for agri-environmental measures to derive estimates of the external costs of Swiss agriculture. This valuation approach does not rely on hypothetical avoidance costs or willingness to pay based on surveys but reflects what society is actually paying to reduce agricultural externalities. While earlier studies have used this approach for the valuation of selected externalities, the present study is the first to apply it to an entire range of relevant agricultural externalities at the national level.
The estimates of the external costs of Swiss agriculture are substantially higher than the costs reported in other recent studies from developed countries. Potential uses of the obtained estimates for Swiss agricultural policy include (1) strategies to internalize the external costs of food, (2) the evaluation of agri-environment measures with respect to cost-effectiveness, (3) the evaluation of cross-compliance requirements, and (4) augmented performance measures for agriculture and the public sector.
The results also raise questions regarding immediate actions that are needed to bring Swiss agricultural policy in line with national-level legal targets and official strategies in the domains of climate, biodiversity, and food policy [41,56]: Which existing subsidies support environmentally damaging or unhealthy consumption patterns? Which production systems are causing particularly high external costs? Which internalization strategies and policy instruments should be implemented to effectively target these production systems? Answers to these questions would be an important basis for serious steps towards a sustainable food system and a cost-effective provision or agri-environmental services.
Supplementary Materials
The following are available online at https://www.mdpi.com/2071-1050/12/15/6126/s1, Table S1: Direct payments: measures, payment levels, expenditures and classification (type of support).
Funding
This research received no external funding.
Acknowledgments
Jules Pretty and two anonymous reviewers provided valuable comments. Personal communications regarding the interpretation of evaluations of the effectiveness of agri-environment schemes by R. Wittwer and T. Nemecek are gratefully acknowledged. All remaining errors are, of course, the responsibility of the author.
Conflicts of Interest
The author declares no conflict of interest.
References
- Kim, K.; Kabir, E.; Jahan, S.A. Exposure to pesticides and the associated human health effects. Sci. Total Environ. 2017, 575, 525–535. [Google Scholar] [CrossRef] [PubMed]
- Poore, J.; Nemecek, T. Reducing food’s environmental impacts through producers and consumers. Science 2018, 360, 987–992. [Google Scholar] [CrossRef] [PubMed]
- Cooper, T.; Hart, K.; Baldock, D. The Provision of Public Goods through Agriculture in the European Union; Report Prepared for DG Agriculture and Rural Development, Contract No. 30-CE-0233091/00-28; Institute for European Environmental Policy: London, UK, 2009. [Google Scholar]
- Pretty, J.; Benton, T.G.; Bharucha, Z.P.; Dicks, L.V.; Flora, C.B.; Godfray, C.J.; Goulson, D.; Hartley, S.; Lampkin, N.; Morris, C.; et al. Global assessment of agricultural system redesign for sustainable intensification. Nat. Sustain. 2018, 1, 441–446. [Google Scholar] [CrossRef]
- Sutton, M.; Howard, C.; Erisman, J.W.; Billen, A.; Gerennfelt, P.; Van Grinsven, H.; Grizzetti, B. (Eds.) The European Nitrogen Assessment: Sources, Effects and Policy Perspectives; Cambridge University Press: Cambridge, UK, 2011. [Google Scholar]
- Giannadaki, D.; Giannakis, E.; Pozzer, A.; Lelieveld, J. Estimating health and economic benefits of reductions in air pollution from agriculture. Sci. Total Environ. 2018, 622, 1304–1316. [Google Scholar] [CrossRef]
- Bobbink, R.; Hicks, K.; Galloway, J.; Spranger, T.; Alkemade, R.; Ashmore, M.; Bustamante, M.; Cinderby, S.; Davidson, E.; Dentener, F.; et al. Global Assessment of nitrogen deposition effects on terrestrial plant diversity: A synthesis. Ecol. Appl. 2010, 20, 30–59. [Google Scholar] [CrossRef]
- Hanley, N.J.; Shogren, J.; White, B. Environmental Economics in Theory and Practice; Palgrave: London, UK, 2007. [Google Scholar]
- FAO. Natural Capital Impacts in Agriculture. Supporting Better Business Decision-Making; Food and Agriculture Organization of the United Nations: Rome, Italy, 2015. [Google Scholar]
- Pretty, J.N.; Brett, C.; Gee, D.; Hine, R.E.; Mason, C.F.; Morison, J.I.L.; Raven, H.; Rayment, M.D.; Van der Bijl, G. An assessment of the total external costs of UK agriculture. Agric. Syst. 2000, 65, 113–136. [Google Scholar] [CrossRef]
- Pretty, J.; Brett, C.; Gee, D.; Hine, R.; Mason, C.; Morison, J.; Rayment, M.; Van Der Bijl, G.; Dobbs, T. Policy challenges and priorities for internalizing the externalities of modern agriculture. J. Environ. Plan. Manag. 2001, 44, 263–283. [Google Scholar] [CrossRef]
- Pretty, J.N.; Ball, A.S.; Lang, T.; Morison, J.I.L. Farm costs and food miles: An assessment of the full cost of the UK weekly food basket. Food Policy 2005, 30, 1–19. [Google Scholar] [CrossRef]
- Tegtmeier, E.M.; Duffy, M.D. External costs of agricultural production in the United States. Int. J. Agric. Sustain. 2004, 2, 1–20. [Google Scholar] [CrossRef]
- Jongeneel, R.; Polman, N.; Van Kooten, G.C. How Important are Agricultural Externalities? A Framework for Analysis and Application to Dutch Agriculture; Working Paper 2016-04, Resource Economic; Policy Analysis Research Group, Department of Economic, University of Victoria: Victoria, BC, Canada, 2016. [Google Scholar]
- Stiglitz, J.; Rosengaard, J.K. Economics of the Public Sector; W. W. Norton: New York, NY, USA, 2015. [Google Scholar]
- Batáry, P.; Lynn, V.; Dicks, L.V.; Kleijn, D.; Sutherland, W.J. The role of agri-environment schemes in conservation and environmental management. Conserv. Biol. 2015, 29, 1006–1016. [Google Scholar] [CrossRef]
- Buchanan, J.; Stubblebine, C. Externality. Economica 1962, 29, 371–384. [Google Scholar] [CrossRef]
- European Commission. Eurobarometer 80.2; European Commission: Brussels, Belgium, 2013. [Google Scholar]
- Schläpfer, F.; Baur, I. Does CAP spending reflect taxpayer preferences? An analysis of expenditures for public goods and income redistribution in relation to preference indicators. In Proceedings of the 15th Congress of the European Association of Agricultural Economists, Parma, Italy, 28 August 2017. [Google Scholar]
- Obst, C.; Hein, L.; Edens, B. National accounting and the valuation of ecosystem assets and their services. Environ. Res. Econ. 2015, 64, 1–23. [Google Scholar] [CrossRef]
- Hein, L.; Bagstad, K.; Edens, B.; Obst, C.; de Jong, R.; Lesschen, J.P. Defining ecosystem assets for natural capital accounting. PLoS ONE 2016, 11, e0164460. [Google Scholar] [CrossRef] [PubMed]
- Badura, T.; Ferrini, S.; Agarwala, M.; Turner, K. Valuation for Natural Capital and Ecosystem Accounting. Synthesis Report for the European Commission; Centre for Social and Economic Research on the Global Environment, University of East Anglia: Norwich, UK, 2017. [Google Scholar]
- Kling, L.K.; Phaneuf, D.J.; Zhao, J. From Exxon to BP: Has some number become better than no number? J. Econ. Perspect. 2012, 26, 3–26. [Google Scholar] [CrossRef]
- Mack, G.; Heitkämper, K.; Käufeler, B.; Möbius, S. Evaluation der Beiträge für Graslandbasierte Milch- und Fleischproduktion (GMF). Agroscope Sci. 2017, 54, 1–106. [Google Scholar]
- Möhring, A.; Mack, G.; Zimmermann, A.; Mann, S.; Ferjani, A. Evaluation Versorgungssicherheitsbeiträge. Schlussbericht. Agroscope Science 66; Agroscope: Tänikon, Ettenhausen, Switzerland, 2018. [Google Scholar]
- Baur, I.; Schläpfer, F. Expert estimates of the share of agricultural support that compensates European farmers for providing public goods and services. Ecol. Econ. 2018, 147, 264–275. [Google Scholar] [CrossRef]
- FOA. Agricultural Report 2018; Federal Office of Agriculture: Bern, Switzerland, 2019. [Google Scholar]
- Prechsl, U.E.; Wittwer, R.; Van der Heijden, M.; Lüscher, G.; Jeanneret, P.; Nemecek, T. Assessing the environmental impacts of cropping systems and cover crops: Life cycle assessment of FAST, a long-term arable farming field experiment. Agric. Syst. 2017, 157, 39–50. [Google Scholar] [CrossRef]
- Schaller, B.; Nemecek, T.; Streit, B.; Zihlmann, U.; Chervet, A.; Sturny, G. Vergleichsökobilanz Direktsaat und Pflug. Agrarforschung 2006, 13, 482–487. [Google Scholar]
- Agridea. Ressourceneffizienzbeiträge REB. Beitragsdauer 2014–2021. Schonende Bodenbearbeitung; Agridea: Lindau, Switzerland, 2019. [Google Scholar]
- Bracher, A.; Spring, P. Möglichkeiten zur Reduktion der Ammoniakemissionen durch Fütterungsmassnahmen bei Schweinen; Schweizerische Hochschule für Landwirtschaft (SHL), Zollikofen, and Agroscope: Liebefeld-Posieux, Switzerland, 2010. [Google Scholar]
- Kupper, T.; Bonjour, C.; Menzi, H.; Bretscher, D.; Zaucker, F. Ammoniakemissionen der schweizerischen Landwirtschaft 1990–2015. In Auftrag des Bundesamts für Umwelt. Hochschule für Agrar-, Forst- und Lebensmittelwissenschaften, Bonjour Engineering GmbH und Oetiker+Partner AG; Hochschule für Agrar-, Forst- und Lebensmittelwissenschaften (HAFL): Zollikofen, Switzerland, 2018. [Google Scholar]
- Heldstab, J.; Leippert, F.; Biedermann, R.; Schwank, O. Stickstoffflüsse in der Schweiz 2020. Stoffflussanalyse und Entwicklungen; Bundesamt für Umwelt: Bern, Switzerland, 2013. [Google Scholar]
- Agridea. Ressourceneffizienzbeiträge REB. Beitragsdauer 2018–2021. Stickstoffreduzierte Phasenfütterung bei Schweinen; Agridea: Lindau, Switzerland, 2018. [Google Scholar]
- Frick, R.; Menzi, H.; Katz, P. Ammoniakemissionen Nach der Hofdüngerausbringung; FAT-Berichte Nr. 486. Eidg; Forschungsanstalt für Agrarwirtschaft und Landtechnik (FAT): Tänikon, Switzerland, 1996. [Google Scholar]
- Richner, W.; Oberholzer, H.R.; Freiermuth, R.; Knuchel, R.; Huguenin, O.; Ott, S.; Nemecek, T.; Walther, U. Modell zur Beurteilung der Nitrat-auswaschung in Ökobilanzen—SALCA-NO3. Agroscope Sci. 2014, 5, 1–28. [Google Scholar]
- Agridea. Ressourceneffizienzbeiträge REB. Beitragsdauer 2014–2019. Emissionsmindernde Ausbringverfahren; Agridea: Lindau, Switzerland, 2017. [Google Scholar]
- UNECE. Draft Guidance Document for Preventing and Abating Ammonia Emissions from Agricultural Sources; Paper ECE/EB.AIR/2012/L.9; UNECE: Geneva, Switzerland, 2012. [Google Scholar]
- Econcept; Agridea; L’Azure; Agroscope. Evaluation der Biodiversitätsbeiträge. Schlussbericht. Im Auftrag des Bundesamts für Landwirtschaft; Agroscope: Bern, Switzerland, 2019. [Google Scholar]
- FOEN; FOA. Umweltziele Landwirtschaft; Federal Office for the Environment and Federal Office of Agriculture: Bern, Switzerland, 2008. [Google Scholar]
- FOEN; FOA. Umweltziele Landwirtschaft. Statusbericht; Federal Office for the Environment and Federal Office of Agriculture: Bern, Switzerland, 2016. [Google Scholar]
- FOEN. Boden in der Schweiz. Zustand und Entwicklung; Stand 2017; Federal Office for the Environment: Bern, Switzerland, 2017. [Google Scholar]
- Doppler, T.; Mangold, S.; Wittmer, I.; Spycher, S.; Stamm, C.; Singer, H.; Junghans, M.; Kunz, M. Hohe Pflanzenschutzmittelbelastung in Schweizer Bächen. Aqua Gas 2017, 4, 46–56. [Google Scholar]
- FOEN. Zustand und Entwicklung Grundwasser Schweiz. Ergebnisse der Nationalen Grundwasserbeobachtung NAQUA, Stand 2016; Federal Office for the Environment: Bern, Switzerland, 2019. [Google Scholar]
- De Baan, L.; Spycher, S.; Daniel, O. Einsatz von Pflanzenschutzmitteln in der Schweiz von 2009 bis 2012. Agrarforschung Schweiz 2015, 6, 48–55. [Google Scholar]
- FOA. Überblick: Direktzahlungen an Schweizer Ganzjahresbetriebe; Federal Office of Agriculture: Bern, Switzerland, 2018. [Google Scholar]
- OECD. OECD Review of Agricultural Policies: Switzerland; OECD: Paris, France, 2015. [Google Scholar]
- OECD. Agricultural Policy Monitoring and Evaluation 2019; OECD: Paris, France, 2019. [Google Scholar]
- OECD. Producer Support Estimates (PSE) Database; OECD: Paris, France, 2020. [Google Scholar]
- FOS. Produktionswert von Biologischer und Konventioneller Landwirtschaft; Federal Office of Statistics: Neuchatel, Switzerland, 2019. [Google Scholar]
- Huber, R.; Finger, R. Popular initiatives increasingly stimulate agricultural policy in Switzerland. EuroChoices 2019, 18, 38–39. [Google Scholar] [CrossRef]
- Vonplon, D. Wie die Milliarden für die Landwirtschaft verpuffen. Neue Zürcher Zeitung, 7 March 2019; 15. [Google Scholar]
- Federal Council. Botschaft zur Weiterentwicklung der Agrarpolitik ab 2022 (AP22+). Federal Bulletin 2020; Federal Council: Bern, Switzerland, 2020; pp. 3955–4212. [Google Scholar]
- FOSD. Fair and Efficient. The Distance-Related Heavy Vehicle Fee (HVF) in Switzerland; Federal Office for Spatial Development: Bern, Switzerland, 2015. [Google Scholar]
- Fitzpatrick, I.; Young, R.; Perry, M.; Rose, E. The Hidden Cost of UK Food; Sustainable Food Trust: Bristol, UK, 2017. [Google Scholar]
- FSVO. Eating Well and Staying Healthy. Swiss Nutrition Policy 2017–2024; Federal Food Safety and Veterinary Office: Bern, Switzerland, 2017. [Google Scholar]
- Finger, R.; Möhring, N.; Dalhaus, T.; Böcker, T. Revisiting pesticide taxation schemes. Ecol. Econ. 2017, 134, 263–266. [Google Scholar] [CrossRef]
- Schläpfer, F. An incentive tax on nitrogen loss in Swiss agriculture? Agrarforschung Schweiz 2016, 7, 496–503. [Google Scholar]
- Hein, L.; Bagstad, K.J.; Obst, C.; Edens, B.; Schenau, S.; Castillo, G.; Soulard, F.; Brown, C.; Driver, A.; Bordt, M.; et al. Progress in natural capital accounting for ecosystems. Science 2020, 367, 514–515. [Google Scholar] [CrossRef] [PubMed]
© 2020 by the author. Licensee MDPI, Basel, Switzerland. This article is an open access article distributed under the terms and conditions of the Creative Commons Attribution (CC BY) license (http://creativecommons.org/licenses/by/4.0/).