Categorizing Organic Grain Buyers in the Midwestern United States


Abstract
1. Introduction
2. Review of Literature
2.1. Current Supply of Organic Grains
2.2. Barriers in Domestic Supply
2.3. Building a Classification of Organic Grain Buyers
2.3.1. Organic Producer Classification Framework
2.3.2. A Need for Buyer Classification
2.3.3. Personal Values Theory as A Way to Understand Behavior
3. Data and Methodology
4. Results and Discussion
4.1. Sample Descriptive Statistics
4.2. Committed Organic vs. Pragmatic Organic Buyers
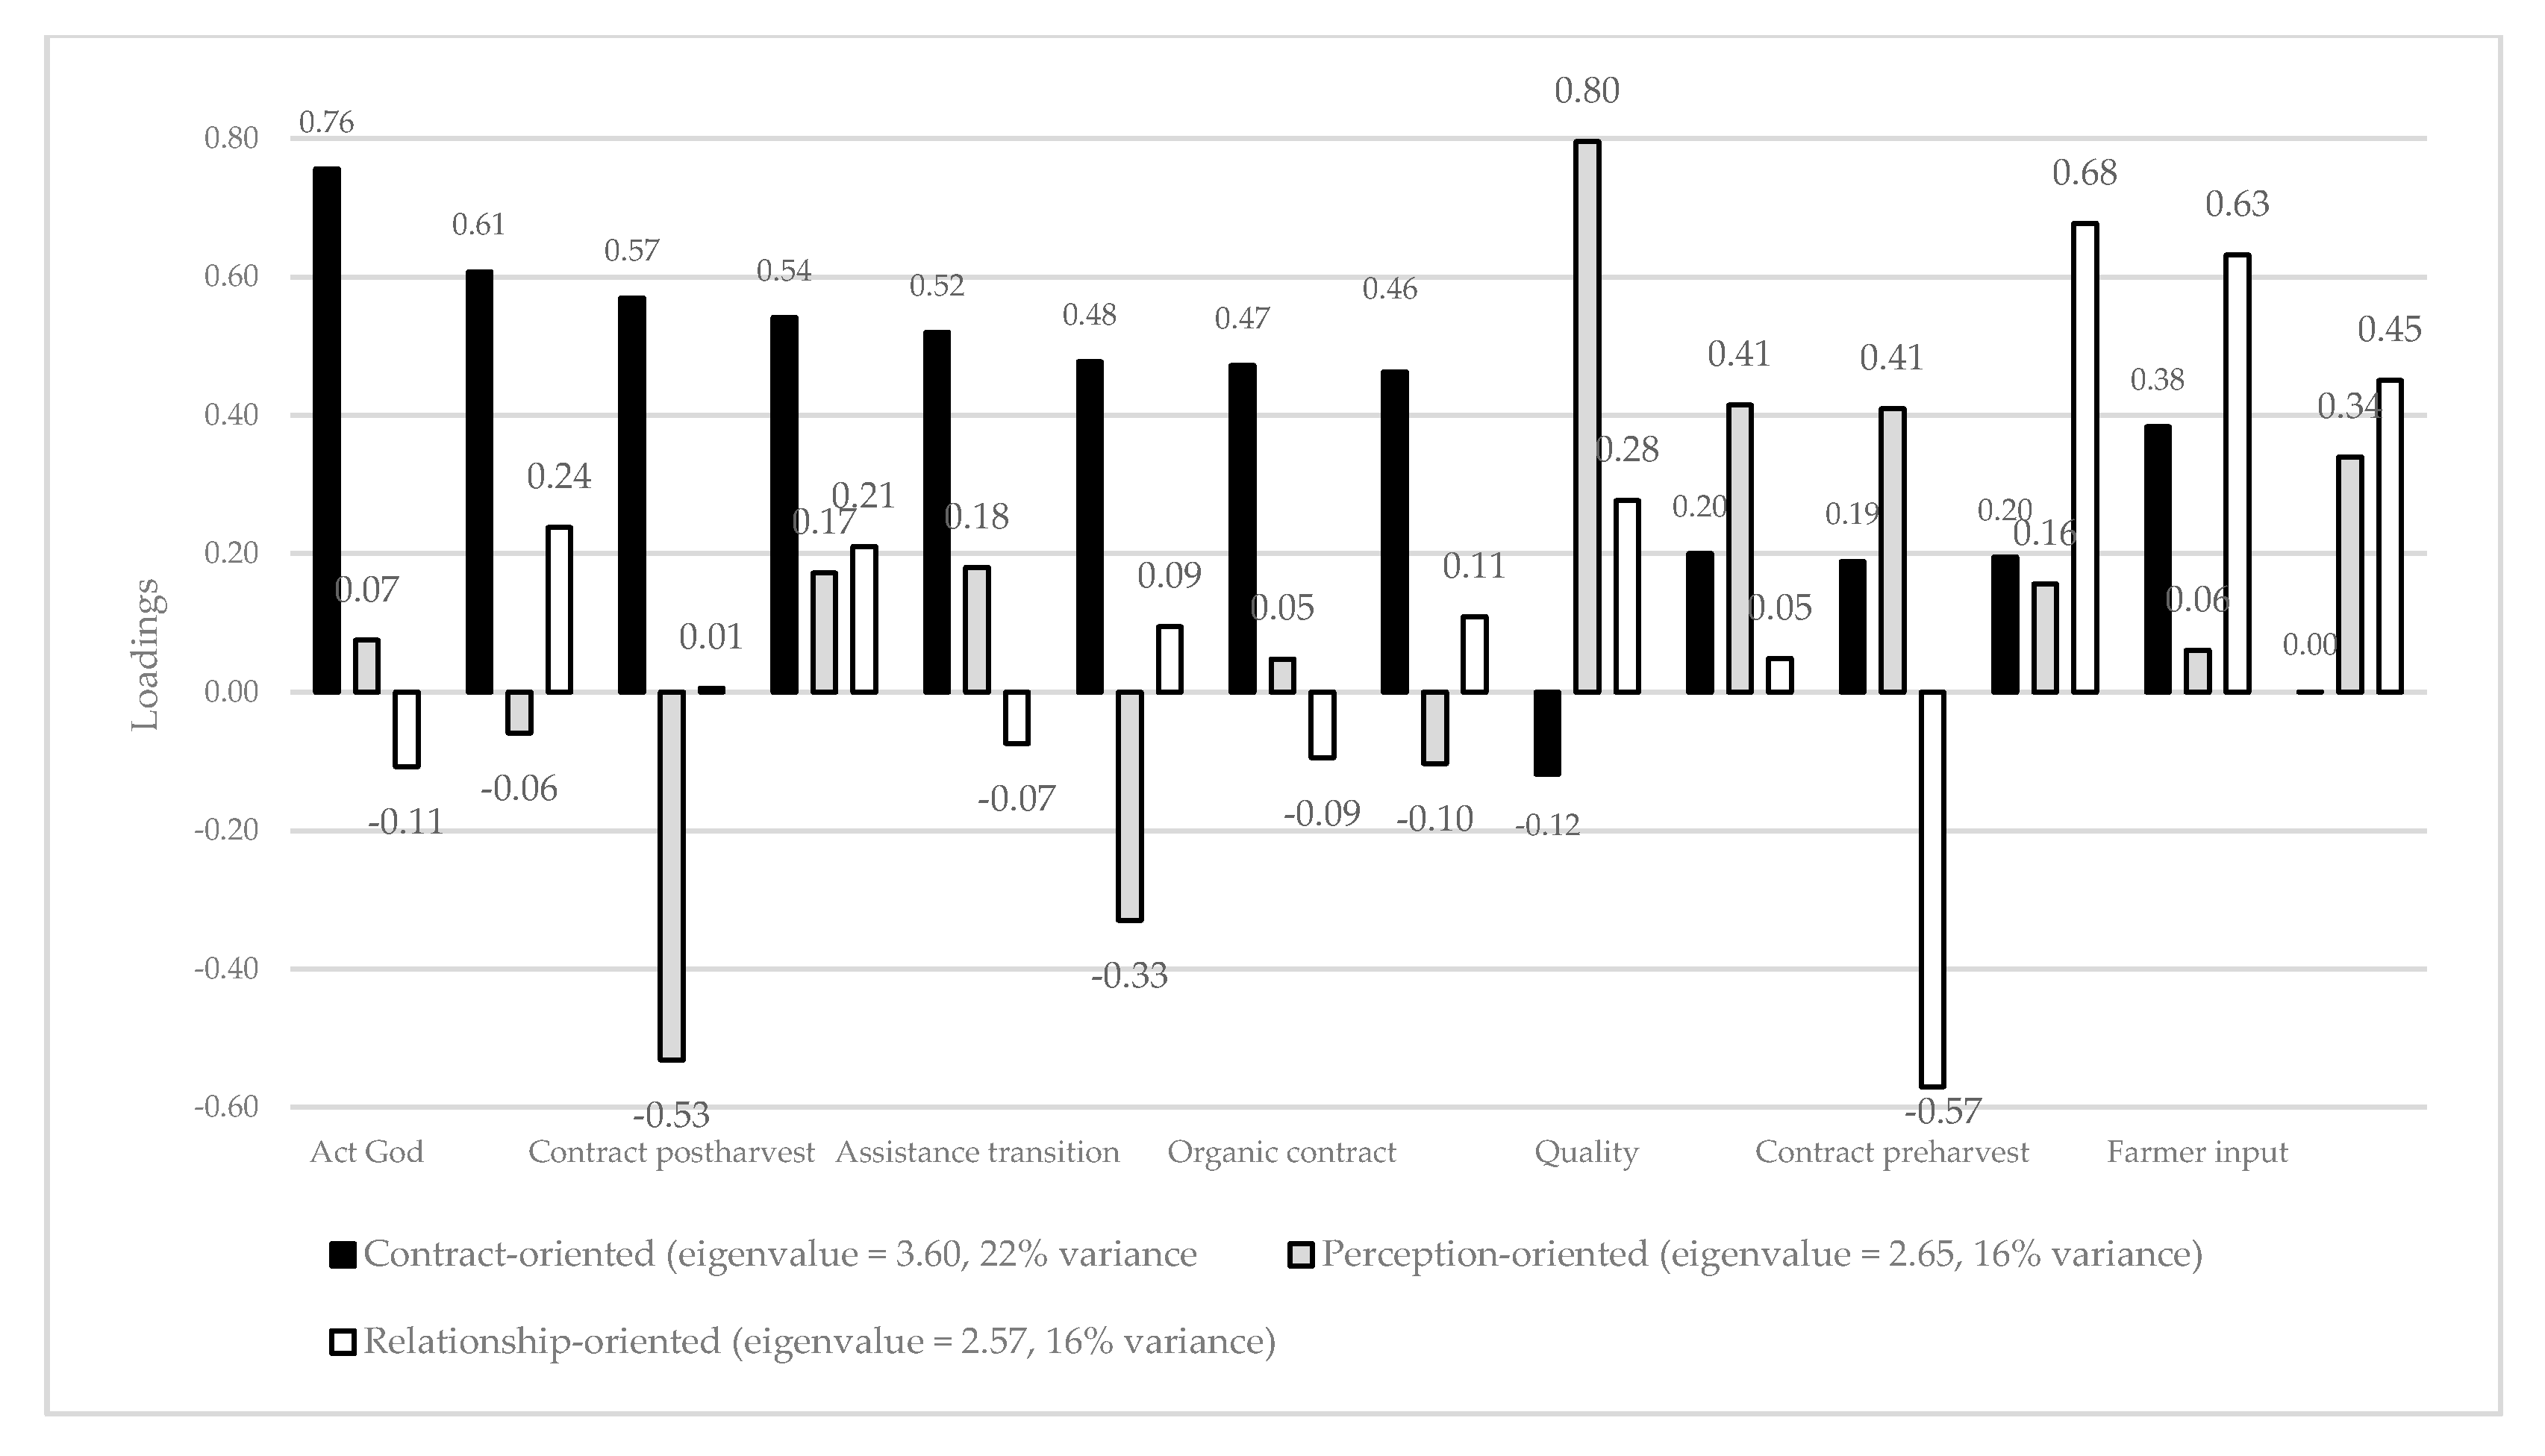
4.3. Principal Component Analysis
5. Conclusions
6. Limitations and Future Research
Author Contributions
Funding
Acknowledgments
Conflicts of Interest
References
- Organic Trade Association. U.S. Organic State of the Industry. Organic Trade Association. 2016. Available online: https://ota.com/resources/market-analysis (accessed on 5 April 2020).
- Oberholtzer, L.; Dimitri, C.; Jaenicke, E.C. International trade of organic food: Evidence of US imports. Renew. Agric. Food Syst. 2013, 28, 255–262. [Google Scholar] [CrossRef]
- Organic Trade Association. US Organic Grain—How to Keep it Growing. Organic Trade Association. 2019. Available online: https://ota.com/resources/market-analysis (accessed on 5 April 2020).
- Organic Trade Association. U.S. Organic Sector Sees Steady Growth of 6.4 Percent in 2017. Organic Trade Association. 2017. Available online: https://ota.com/news/press-releases/20236 (accessed on 5 April 2020).
- L’Hoir, C.; Goddard, E.W.; Ng, D.W.; Lerohl, M.L. Preferences about Marketing Organic Grain in Alberta; 2002; Project report: 02-05; Department of Rural Economy. Faculty of Agriculture & Forestry and Home Economics. University of Alberta: Edmonton, Canada. [Google Scholar]
- Lancaster, N.; Torres, A.; O’Donnell, M.; Benjamin, T.; Bruce, A.; Farmer, J. Is organic right for my grain operation? In Purdue Extension; Organic Grain Production: West Lafayette, IN, USA, 2019. [Google Scholar]
- Mercaris. Reports; Mercaris: Silver Spring, MD, USA, 2019. [Google Scholar]
- Mercaris. 2017/2018 Organic and Non-GMO Soybean Market Guide; Mercaris: Silver Spring, MD, USA, 2018. [Google Scholar]
- Mercaris. 2014/2016 Organic and Non-GMO Soybean Market Guide; Mercaris: Silver Spring, MD, USA, 2017. [Google Scholar]
- Varian, H.R. Intermediate Microeconomics: A Modern Approach: Ninth International Student Edition; WW Norton & Company: New York, NY, USA, 2014. [Google Scholar]
- Cranfield, J.; Henson, S.; Holliday, J. The motives, benefits, and problems of conversion to organic production. Agric. Hum. Values 2010, 27, 291–306. [Google Scholar] [CrossRef]
- Constance, D.H.; Choi, J.Y.; Lyke-Ho-Gland, H. Conventionalization, bifurcation, and quality of life: Certified and non-certified organic farmers in Texas. South. Rural Sociol. 2008, 23, 208. [Google Scholar]
- Peterson, H.H.; Kastens, T.L.; Ross, K.L. Risks perceived by organic grain farmers in the central USA. J. Sustain. Agric. 2007, 31, 5–19. [Google Scholar] [CrossRef]
- USDA-NOP. Organic Production and Handling Standard. 2016. Available online: https://www.ams.usda.gov/sites/default/files/media/Organic%20Production-Handling%20Standards.pdf (accessed on 5 April 2020).
- Buck, D.; Getz, C.; Guthman, J. From farm to table: The organic vegetable commodity chain of Northern California. Sociol. Rural. 1997, 37, 3–20. [Google Scholar] [CrossRef]
- Clunies-Ross, T.; Cox, G. Challenging the Productivist Paradigm: Organic Farming and the Politics of Agricultural Change; Agris FAO: Bath, UK, 1994. [Google Scholar]
- Darnhofer, I.; Schneeberger, W.; Freyer, B. Converting or not converting to organic farming in Austria: Farmer types and their rationale. Agric. Hum. Values 2005, 22, 39–52. [Google Scholar] [CrossRef]
- Guthman, J. Regulating meaning, appropriating nature: The codification of California organic agriculture. Antipode 1998, 30, 135–154. [Google Scholar] [CrossRef]
- Guthman, J. The trouble with ‘organic lite’in California: A rejoinder to the ‘conventionalisation’debate. Sociol. Rural. 2004, 44, 301–316. [Google Scholar] [CrossRef]
- Schwartz, S.H. The refined theory of basic values. In Values and Behavior; Springer: Berlin/Heidelberg, Germany, 2017; pp. 51–72. [Google Scholar]
- Dufour, R. Tipsheet: Crop rotation in organic farming systems. 2015. Available online: https://www.ams.usda.gov/sites/default/files/media/Crop%20Rotation%20in%20Organic%20Farming%20Systems_FINAL.pdf (accessed on 5 April 2020).
- Moncada, K.M.; Sheaffer, C.C. Risk Management Guide for Organic Producers; University of Minnesota: Minneapolis, MN, USA, 2010. [Google Scholar]
- USDA-NASS. Acreage June 2018. 2018. Available online: https://www.nass.usda.gov/Newsroom/Executive_Briefings/2018/06-29-2018.pdf (accessed on 5 April 2020).
- USDA-AMS. Organic Reports. 2018. Available online: https://www.ams.usda.gov/market-news/organic (accessed on 5 April 2020).
- Strochlic, R.; Sierra, L. Conventional, Mixed and Deregistered Organic Farmers: Entry Barriers and Reasons for Exiting Organic Production in California Davis; California Institute for Rural Studies. Davis, CA, USA, 2007. Available online: http://www.cirsinc.org/docs/organic_transitions.pdf (accessed on 5 May 2020).
- Khaledi, M.; Weseen, S.; Sawyer, E.; Ferguson, S.; Gray, R. Factors influencing partial and complete adoption of organic farming practices in Saskatchewan, Canada. Can. J. Agric. Econ. /Rev. Can. D’agroeconomie 2010, 58, 37–56. [Google Scholar] [CrossRef]
- Torres, T.P.; Marshall, M.I. Identifying Drivers of Organic Decertification: An Analysis of Fruit and Vegetable Farmers. HortScience. [CrossRef]
- Born, H.; Sullivan, P. Marketing organic grains. National Sustainable Agricultural Information Service. 2005. Available online: https://attra.ncat.org/product/marketing-organic-grains/ (accessed on 5 May 2020).
- Tovey, H. Food, environmentalism and rural sociology: On the organic farming movement in Ireland. Sociol. Rural. 1997, 37, 21–37. [Google Scholar] [CrossRef]
- Dobbs, T.L.; Shane, R.C.; Feuz, D.M. Lessons learned from the Upper Midwest organic marketing project. Am. J. Altern. Agric. 2000, 15, 119–128. [Google Scholar] [CrossRef]
- Goldberger, J.R. Conventionalization, civic engagement, and the sustainability of organic agriculture. J. Rural Stud. 2011, 27, 288–296. [Google Scholar] [CrossRef]
- Clunies-Ross, T. Organic food: Swimming against the tide? In Political, Social, and Economic Perspectives on the International Food System; Marsden, T., Little, J., Eds.; Avebury: Aldershot, UK, 1990. [Google Scholar]
- Davies, A.; Titterington, A.J.; Cochrane, C. Who buys organic food? Br. Food J. 1995. [Google Scholar] [CrossRef]
- Hanson, J.; Dismukes, R.; Chambers, W.; Greene, C.; Kremen, A. Risk and risk management in organic agriculture: Views of organic farmers. Renew. Agric. Food Syst. 2004, 19, 218–227. [Google Scholar] [CrossRef]
- Tey, Y.S.; Arsil, P.; Brindal, M.; Shamsudin, M.N.; Radam, A.; Hadi, A.H.I.A.; Rajendran, N.; Lim, C.D. A means-end chain approach to explaining the adoption of good agricultural practices certification schemes: The case of Malaysian vegetable farmers. J. Agric. Environ. Ethics 2015, 28, 977–990. [Google Scholar] [CrossRef]
- Zepeda, L.; Deal, D. Organic and local food consumer behaviour: Alphabet theory. Int. J. Consum. Stud. 2009, 33, 697–705. [Google Scholar] [CrossRef]
- Bellows, A.C.; Onyango, B.; Diamond, A.; Hallman, W.K. Understanding consumer interest in organics: Production values vs. purchasing behavior. J. Agric. Food Ind. Organ. 2008, 6, 6. [Google Scholar] [CrossRef]
- The Non-GMO Sourcebook. Suppliers of Non-GMO Products—United States. Available online: https://www.nongmoproject.org/ (accessed on 5 May 2020).
- USDA-AMS. Organic Integrity Database. 2017. Available online: https://organic.ams.usda.gov/integrity/ (accessed on 5 April 2020).
- Dillman, D.A.; Smyth, J.D.; Christian, L.M. Internet, Phone, Mail, and Mixed-Mode Surveys: The Tailored Design Method; John Wiley & Sons: New York, NY, USA, 2014. [Google Scholar]
- Dillman, D.A.; Phelps, G.; Tortora, R.; Swift, K.; Kohrell, J.; Berck, J.; Messer, B.L. Response rate and measurement differences in mixed-mode surveys using mail, telephone, interactive voice response (IVR) and the Internet. Soc. Sci. Res. 2009, 38, 1–18. [Google Scholar] [CrossRef]
- Hooley, T.; Wellens, J.; Marriott, J. What is Online Research?: Using the Internet for Social Science Research; A&C Black: London, UK, 2012. [Google Scholar]
- Chen, J.; Teng, L.; Liao, Y. Counterfeit luxuries: Does moral reasoning strategy influence consumers’ pursuit of counterfeits? J. Bus. Ethics 2018, 151, 249–264. [Google Scholar] [CrossRef]
- Xu, D.; Kane, R.L.; Shippee, T.; Lewis, T.M. Identifying consistent and coherent dimensions of nursing home quality: Exploratory factor analysis of quality indicators. J. Am. Geriatr. Soc. 2016, 64, e259–e264. [Google Scholar] [CrossRef] [PubMed]
- De Winter, J.D.; Dodou, D.; Wieringa, P.A. Exploratory factor analysis with small sample sizes. Multivar. Behav. Res. 2009, 44, 147–181. [Google Scholar] [CrossRef] [PubMed]
- Azevedo, J.P. Factortest: Stata Module to Perform Tests for Appropriateness of Factor Analysis. 2006. Available online: https://econpapers.repec.org/software/bocbocode/s436001.htm (accessed on 5 April 2020).
- Farrell, M.; Mainville, D.Y. Organic Feed Grain Markets: An Analysis of Structure, Organization, and Potential for Virginia Producers. J. Food Distrib. Res. 2007, 38, 56–60. [Google Scholar]
- Dimitri, C.; Greene, C.R. Recent Growth Patterns in the US Organic Foods Market. 2002. Available online: https://www.ers.usda.gov/publications/pub-details/?pubid=42456 (accessed on 5 April 2020).
- Oberholtzer, L.; Dimitri, C.; Greene, C. Price Premiums Hold on as US Organic Produce Market Expands; US Department of Agriculture, Economic Research Service Washington (DC): Washington, DC, USA, 2005. [Google Scholar]
- Constance, D.; Choi, J.Y. Overcoming the barriers to organic adoption in the United States: A look at pragmatic conventional producers in Texas. Sustainability 2010, 2, 163. [Google Scholar] [CrossRef]
- Farmer, J.R.; Epstein, G.; Watkins, S.L.; Mincey, S.K. Organic farming in West Virginia: A behavioral approach. J. Agric. Food Syst. Community Dev. 2014, 4, 155–171. [Google Scholar] [CrossRef]
- Torres, A.P.; Marshall, M.I.; Alexander, C.E.; Delgado, M.S. Are local market relationships undermining organic fruit and vegetable certification? A bivariate probit analysis. Agric. Econ. 2016, 48, 197–205. [Google Scholar] [CrossRef]


| Feed-Grade | Food-Grade | |
|---|---|---|
| Corn | $9.85 | $10.19 |
| Soybeans | $19.48 | $21.87 |
| Wheat | $10.08 | $15.11 |
| Variable | Obs | Mean | S.D. | Description |
|---|---|---|---|---|
| Grain Purchasing | ||||
| Percentage feed | 45 | 25.24 | 28.26 | percentage of all feed-grade grains purchased in 2017 |
| Farmers supply | 45 | 97.78% | 14.91% | 1 = if respondent buys from farmers and producers of grains |
| Premium nonGMO | 45 | 66.67% | 47.67% | 1 = if buyer offers price premiums for non-GMO grains |
| Buy import | 45 | 31.11% | 46.82% | 1 = if buyer purchased imported organic grains in 2017 |
| Characteristics of Purchasing Agreements | ||||
| Organic contract | 45 | 49.20 | 43.23 | Percentage of organic grains purchased through contracts |
| Transition contract | 45 | 17.67 | 35.36 | Percentage of transitioning grains purchased through contracts |
| NonGMO contract | 45 | 47.27 | 44.36 | Percentage of non-GMO grains purchased through contracts |
| Act of God | 45 | 34.41 | 36.97 | Percentage of contracts that have an “act of God” clause for all grains |
| Contract preplant | 45 | 76.44 | 90.52 | Percentage of grains contracted pre-planting |
| Contract postharvest | 45 | 54.44 | 71.03 | Percentage of grains contracted after harvest |
| Farmer input | 45 | 35.91 | 39.28 | Percentage of farmers that provide input in drafting contract terms (excluding price negotiations) |
| Purchasing Requirements | ||||
| Sample before delivery | 45 | 57.78% | 49.95% | 1 = if buyer typically samples grains before delivery |
| Sample at delivery | 45 | 66.67% | 47.67% | 1 = if buyer typically samples grains at delivery |
| Require truck | 44 | 81.82% | 39.02% | 1 = if buyer requires a clean truck affidavit from suppliers |
| Require visit | 43 | 16.28% | 37.35% | 1 = if buyer requires visits to farms |
| Require tags | 43 | 51.16% | 50.58% | 1 = if buyer requires security tags or seals from suppliers |
| Relationships with Suppliers | ||||
| Associations | 45 | 53.33% | 50.45% | 1 = if farmers and trade associations are useful sources of communications to build relationships with new suppliers |
| In-house | 45 | 44.44% | 50.25% | 1 = if in-house programs are useful sources of communications to build relationships with new suppliers |
| Agronomic assistance | 45 | 53.33% | 50.45% | 1 = if buyer provides agronomic support to growers |
| Transition assistance | 45 | 24.44% | 43.46% | 1 = if buyer provides information or contracting support to growers during the transition period |
| Flexibility | 45 | 73.33% | 44.72% | 1 = if buyer believes flexibility in time of delivery or payment is an important factor to build and maintain relationships with suppliers |
| Length relation | 45 | 68.89% | 46.82% | 1 = if buyer believes length of purchasing agreement is an important factor to build and maintain relationships with suppliers |
| Quality | 45 | 82.22% | 38.66% | 1 = if buyer believes quality of grain supplied is an important factor to build and maintain relationships with suppliers |
| Buyers’ Perceptions | ||||
| Low domestic | 45 | 60.00% | 49.54% | 1 = if buyer agrees there is a shortage of domestic organic grain supply |
| Imports cheaper | 45 | 57.78% | 49.95% | 1 = if buyer agrees imported organic grains are cheaper |
| Imports not transparent | 45 | 55.56% | 50.25% | 1 = if buyer agrees there is a lack of transparency in the certification process for imported organic grains |
| Increase price | 45 | 35.56% | 48.41% | 1 = if buyer expects future prices of organic domestic grains will increase |
| Business Demographics | ||||
| User | 45 | 64.00% | 48.00% | Business was primarily a feed mill, livestock producer, processor, or flour mill |
| Labor | 45 | 117.67 | 277.09 | Number of full-time and part-time employees |
| Sales | 42 | 1.95 | 0.88 | 1 = if gross sales were less than $5 million, 2 = if gross sales were between $5 and $20 million, and 3 = if gross sales were more than $20 million in 2017 |
| Committed Organic | Pragmatic Organic | |||||
|---|---|---|---|---|---|---|
| N = 27 | N = 18 | |||||
| Meana | S.D. | Mean | S.D. | |z|, χ2a | p-value | |
| Grain Purchasing | ||||||
| Percentage feed | 15.25 | 19.28 | 40.24 | 33.2 | 2.23 | 0.03 |
| Farmers supply | 96.30% | 19.25% | 100.00% | 0.00% | 0.68 | 0.41 |
| Premium nonGMO | 70.37% | 46.53% | 61.11% | 50.16% | 1.85 | 0.17 |
| Buy import | 29.63% | 46.53% | 33.33% | 48.51% | 0.15 | 0.70 |
| Characteristics of Purchasing Agreements | ||||||
| Organic contract | 52.56 | 43.11 | 44.17 | 44.17 | 0.68 | 0.50 |
| Transition contract | 17.41 | 34.12 | 18.06 | 38.16 | 0.33 | 0.74 |
| NonGMO contract | 43.41 | 43.05 | 53.06 | 46.91 | 0.63 | 0.53 |
| Act of God | 43.11 | 36.78 | 21.35 | 34.17 | 2.09 | 0.04 |
| Contract preplant | 93.93 | 98.30 | 50.22 | 72.22 | 1.47 | 0.14 |
| Contract postharvest | 46.37 | 67.42 | 66.56 | 76.48 | 0.95 | 0.35 |
| Farmer input | 46.04 | 43.66 | 20.72 | 25.91 | 1.99 | 0.05 |
| Purchasing Requirements | ||||||
| Sample before delivery | 66.67% | 48.04% | 44.00% | 51.00% | 2.19 | 0.14 |
| Sample at delivery | 59.26% | 50.07% | 78.00% | 43.00% | 1.67 | 0.20 |
| Require truck | 84.62% | 36.79% | 78.00% | 43.00% | 0.33 | 0.56 |
| Require visit | 24.00% | 43.59% | 6.00% | 24.00% | 2.61 | 0.10 |
| Require tags | 57.69% | 50.38% | 41.00% | 51.00% | 1.12 | 0.29 |
| Relationships with Suppliers | ||||||
| Associations | 62.96% | 49.21% | 39.00% | 50.00% | 2.52 | 0.11 |
| In-house | 40.74% | 50.07% | 50.00% | 51.00% | 0.38 | 0.54 |
| Agronomic assistance | 59.26% | 50.07% | 44.00% | 51.00% | 0.95 | 0.33 |
| Transition assistance | 25.93% | 44.66% | 22.00% | 43.00% | 0.08 | 0.78 |
| Flexibility | 85.19% | 36.20% | 56.00% | 51.00% | 4.85 | 0.03 |
| Length relation | 77.78% | 42.37% | 56.00% | 51.00% | 2.49 | 0.12 |
| Quality | 96.30% | 19.25% | 61.00% | 50.00% | 9.15 | 0.00 |
| Buyers’ Perceptions | ||||||
| Low domestic | 62.96% | 49.21% | 56.00% | 0.51 | 0.25 | 0.62 |
| Imports cheaper | 59.26% | 50.07% | 56.00% | 0.51 | 0.06 | 0.81 |
| Imports not transparent | 66.67% | 48.04% | 39.00% | 0.50 | 3.38 | 0.07 |
| Increase price | 33.33% | 48.04% | 39.00% | 0.50 | 0.15 | 0.70 |
| Business Demographics | ||||||
| User | 70.00% | 47.00% | 56.00% | 51.00% | 1.03 | 0.30 |
| Labor | 55.70 | 117.15 | 210.61 | 403.10 | 1.83 | 0.07 |
| Sales | 1.67 | 0.76 | 2.33 | 0.91 | 9.08 | 0.01 |
© 2020 by the authors. Licensee MDPI, Basel, Switzerland. This article is an open access article distributed under the terms and conditions of the Creative Commons Attribution (CC BY) license (http://creativecommons.org/licenses/by/4.0/).
Share and Cite
Torres, A.P.; Lancaster, N.A.; Vilas Boas, L.H.B. Categorizing Organic Grain Buyers in the Midwestern United States. Sustainability 2020, 12, 5169. https://doi.org/10.3390/su12125169
Torres AP, Lancaster NA, Vilas Boas LHB. Categorizing Organic Grain Buyers in the Midwestern United States. Sustainability. 2020; 12(12):5169. https://doi.org/10.3390/su12125169
Chicago/Turabian StyleTorres, Ariana P., Nicholas A. Lancaster, and Luiz H. B. Vilas Boas. 2020. "Categorizing Organic Grain Buyers in the Midwestern United States" Sustainability 12, no. 12: 5169. https://doi.org/10.3390/su12125169
APA StyleTorres, A. P., Lancaster, N. A., & Vilas Boas, L. H. B. (2020). Categorizing Organic Grain Buyers in the Midwestern United States. Sustainability, 12(12), 5169. https://doi.org/10.3390/su12125169