Abstract
The peri-urban area of Puyo, where agricultural, urban and conservation logics are mixed, is a contested area in the Ecuadorian Amazon. Rapid urban growth and agricultural activities are the main threats to the conservation of its biodiversity. To promote the conservation of natural spaces in urban planning instruments, it is necessary to first demonstrate their environmental and ecological value. In this paper, such value was analyzed by quantifying biodiversity value and carbon storage capacity in situ. The results show that Puyo’s periphery (a 4 km radius) is an opportunity space, where the conservation of its biodiversity is a key factor in strategies to promote sustainable urban development. Firstly, there are natural areas of high environmental value (secondary forest, gramalote pastures with trees and gramalote pastures) that all together fix 1,664,683 Mg CO2 and control hydrological risks (with 80% of the green areas linked to flood areas)—valuable ecosystem services. Secondly, the conservation of biodiversity brings associated economic activities that can promote local sustainable development. Despite this, the results reveal that the conservation of peri-urban natural ecosystems is not a goal in Puyo’s urban planning strategy. Therefore, future research should be focused on urban planning tools that promote environmentally, economically and socially sustainable urban development.
1. Introduction
We live in an increasingly urbanized world. According to the latest data, 55.24% of the world’s population lives in urban environments, a percentage that is expected to rise to 68% by 2050 [1]. The current rate of urbanization is the fastest since records began. In general terms, the expansion processes of cities have generated interstitial spaces, defined as the urban–rural interface, which have been fully studied during the past 10 years [2]. The urban–rural interface is identified as the space where both urban and rural logics are presented together [2,3,4]. These interface spaces have extensively been studied in large metropolises, mainly in Europe and countries such as the US, China or Australia [3]. However, this concept has not been examined in the case of intermediate size cities, and particularly in the Ecuadorian Amazonian context.
The urban transition in high income countries responds directly to a process of industrialization and is characterized by complex displacement and settlement patterns. However, this is not the case in the Ecuadorian Amazon, where the urban and the rural are not as clearly disjointed. Urban transition in Ecuadorian Amazon cities implies a new dynamic and a complex relationship between stakeholders and multiple environments with hybrid social forms. The degree of interconnection between rural and urban means that one cannot be understood outside both the context of the other and the social, economic, political and territorial dynamics that transform and, at the same time, are transformed during the process [5,6]. However, all these dynamics not been studied in depth for the case of the cities of the Ecuadorian Amazon, which are cities with strong demographic pressure and a high rate of urban growth.
On a global scale, rapid urban growth and its associated environmental changes are the two main threats to biodiversity [7]. Urbanization reduces carbon sinks, thus increasing the associated greenhouse gas emissions and exacerbating the impacts of climate change [8]. The greater the environmental value of the territory, the greater the threat [9]. An example of this occurs in the canton of Pastaza (Ecuador), which is the largest of the country (19,774 km2) [10] and 97% occupied by Amazon Rainforests. These are the most diverse in the neotropical region [11] and the world’s leading CO2 sinks, significantly contributing to the regulation of the CO2 concentration in the atmosphere [12]. Due to their quantitative and qualitative importance, any kind of disruption to this ecosystem causes such damage that it affects the carbon cycle [13]. Thus, Amazon Rainforests have been determined to play a strategic role in carbon sequestration and are considered to be a reservoir of great ecological diversity [14,15].
In the canton of Pastaza, 58% of the population is concentrated in the capital, Puyo, which has 36,659 inhabitants [16]. It was founded in 1899 by a Dominican Friar and historically remained as a small isolated missionary town. However, the peri-urban green areas in Puyo have been threatened by very rapid growth over the past few decades. Specifically, the population of the canton of Pastaza doubled in the period 1990–2010, an increase caused by the opening of roads connecting the Sierra Region with the Amazon [16,17,18,19]. This has led to significant socio-environmental challenges [17], as well as in other Amazon cities in Brazil and Ecuador. On the one hand, oil exploration was part of the general framework that we describe here [20,21,22] due to the facilitation of spontaneous colonization by the opening of roads by oil companies, which greatly improved physical accessibility [17]. On the other hand, most of the migrant colonial people from the Sierra were small farmers, ready to work, and changing land use to agriculture to increase productivity [23]. At the same time, the Amazonian indigenous communities claimed their territories and had their own sociocultural systems [23,24], and the peri-urban Amazonian areas faced overwhelming migration, often from within the jungle (Ministerio del Ambiente, 2015). These indigenous populations who arrived and settled on the periphery of a city had to adapt to the new urban environment, establishing new types of social and spatial relationships. Such adaptation often conflicts with their own cultural identity [25], which is one closely linked to nature, based on their worldview. To be concrete, in Puyo, as well as in other Ecuadorian cities as Nueva Loja or Orellana [18], the impacts of population growth in cities are not only an increase in the urban footprint, deforestation, habitat fragmentation, soil degradation and a loss of biodiversity [26,27] but also an associated loss of cultural identity, linked to the degradation of the ecosystem. However, Puyo is still a small-medium size city in which the urban scale allows interventions to promote sustainable development.
In this sense, sustainable urban planning should include the natural spaces present in the context as structuring elements, due to the value of their ecosystem services [28]. Previous studies confirm the need to deepen the study of application of planning approaches aimed at valuing both environmental and social resources of peri-urban areas [3]. In the same way, regulations at higher administrative levels about norms to protect land that is considered valuable and strategies for achieving sustainable development are remaining challenges in most peri-urban case studies that were previously published [3]. In the case of Puyo, there are no bibliographic references that describe the plant cover of the peri-urban area of the town. In addition, spatial, social or cultural configuration of its urban–rural interface is not studied and, moreover, the environmental natural value of these spaces is not defined. Only two big conservation areas have been identified on a large scale [29]. Nevertheless, the delimitation of green areas of the urban periphery and their spatial analysis are very important for understanding the potential for the provision of ecosystem services [28]. This can define the environmental potential of the urban peripheries to be incorporated into urban planning instruments. An in-depth study of plant coverage provides detailed information regarding the ecosystem service potential that a green area can bring to a city because plants mitigate the consequences of climate change, bringing value through carbon sequestration [30].
According to the 2030 Agenda [31], green infrastructure should be integrated in urban planning in order to improve the resilience of the settlement. The green infrastructure is a strategically planned network of natural areas designed and managed to deliver a wide range of ecosystem services, such as water purification, air quality, space for recreation and climate mitigation and adaptation. This network of green (land) and blue (water) spaces can create job opportunities and enhance biodiversity [32]. In this context, this work aimed to identify the potential green infrastructure in the Amazonian city of Puyo to promote the control and conservation of natural spaces in urban planning instruments. As a first step, it is necessary to spatially identify the areas of greatest environmental value to demonstrate their environmental and ecological value [33]. This can be done by quantifying their biodiversity parameters and, above all, their carbon storage capacity as one of the ecosystem services provided.
2. Materials and Methods
2.1. Study Area
Puyo (1.4837° S 78.0026° O) lies on the west side of Pastaza Province, the eastern region of Ecuador [34]. It is one of the most important settlements in the Ecuadorian Amazon Region and the main Amazonian center because of its strategic localization, linking the Amazonian and Andean regions. Puyo is situated in the microbasin of the Puyo River (north) and Pindo River (south) (Figure 1), meaning that several creaks and flooding areas cross the city. In fact, the most important latent risk in the urban area is flooding (Vallejo-Tamayo, 2019).
Figure 1.
A map of Puyo city in which structural vials, rivers and creeks are marked.
Puyo has a consolidated urban center (city of Puyo) surrounded by an unconsolidated settlement (Tarqui Parish, Fatima Parish, 10 Agosto Parish), the main urban expansion area, which is where 70% of Pastaza canton’s population live. Puyo and its unconsolidated surrounding settlement have experienced dramatic sprawl growth in the last 30 years at a constant rate of 4.70% per annum. That is the highest in the country [35] and is due to the opening of the aforementioned road and the migration of the Sierra population to the east following the passing of the Agrarian Reform Law [16,34,35]. It is not an insolated case; urban population growth during the 1990s occurred in most Amazonian cities within Brazil and Ecuador [17].
In the case of Puyo, the growth of settlements is exceeding the administrative political limits of the city of Puyo. This is the case with Tarqui (in the south) that belongs to another parish of the same canton and Shell (in the west) that belongs to another canton [35]. Thus, the aforementioned growth rate refers only to the consolidated area of Puyo; if Puyo and its unconsolidated surrounding settlement were considered together, the growth rate would be even higher. Therefore, there is much demographic pressure. In this paper, Puyo and its surrounding unconsolidated settlement are considered as one human settlement system. From now on, we designate this human settlement system as Puyo. Land uses of Puyo’s influence areas are displayed in Figure 2 according with the Territorial Urban Planning of Pastaza Caton [34,36].
Figure 2.
Urban Planning scheme of Puyo and its unconsolidated surrounding settlements based on [36].
The Puyo Tourist Walk is located in the peri-urban areas of Puyo (Figure 3a) and was selected for this work as a case study of the ecosystem services of the city’s urban periphery. It is very close to an area of city with high demographic pressure, and it is also on the edge of a protected area beside the town [29]. The studied plots are 6.4 Ha, delimited by Rio Puyo and 20th century railway tracks (Figure 3b), located in Zone 18S, with a latitude of −1.48 a longitude of 78.00 and an altitude of 930–950 mas. According to the municipality data, the average annual temperature is 21.35 °C and the average rainfall is 1000–4000 mm, evenly distributed throughout the year. Relative humidity is high, at around 87.83% [10].
Figure 3.
The Tourist Walk of the city of Puyo, with the study area marked in red (a) and details of the landscape units (b).
2.2. Landscape Units and Sample Collection
Satellite imagens are low cost or even free tools, with a great potential for quantitative assessment of land use changes and soil consumption [37]. Our study used SPOT 2004 images (10 m resolution) to produce digital land-use and green spaces maps. The images were rectified and georeferenced using a topographic map (1:10,000) and aerial photographs (1:10,000) produced in 2000 and 2013. The categorization of landscape units was created by manual interpretation using Geographic Information Systems (ArcGis 10.1 software), combined with the flight of an unmanned aerial vehicle drone (DJI Phantom 4 Pro V2.0, China). Prior to the flights, certain aspects such as the clarity of the sky were considered (mid-day was suggested for the best illumination). The flights were carried out in the absence of wind, followed commands as decided by the specialist (to try to capture all of the variability of the area) and took place at an obstacle-free height. Images were taken with 80% overlap between them (20 megapixel images) and were processed to get an overview of the city. In addition, urban planning analysis was developed based on the current Urban Plan for Puyo (Figure 2) [10,34,36]. Aerial photographs and the city map were georeferenced using the ArcGis 10.1 software.
Peri-urban green areas were defined based on the study area, the Puyo Touristic Walk. Therefore, three landscape units were defined based on previous references [38]:
- G, Gramalote pasture. Non-indigenous herbaceous vegetation and forage formed by herbaceous species of the genus Axonopus (Poaceae) and similar areas. Although they initially needed to be cultivated, they are now maintained autonomously, with the ability to reproduce in the territory without the help of a farmer.
- GT, Gramalote pasture with trees. The same forage grassland as in the previous case, but which is accompanied by some tree species belonging to the secondary forest, which we describe in the next section.
- SF, Secondary Forest. Vegetation dominated by native trees, in the process of recovery. It is formed as a result of the prolonged abandonment of agro-productive activities or selective logging. The recovery of these forests has occurred through the natural processes of plant successions and is characterized by their high tree densities.
Urban landscape units within urban land were defined based on built-up density [39], using the city map and the aerial photographs. The three urban landscape units were:
- Consolidated Urban Area. A fully built urban area. According to the Puyo Urban Plan, most of these areas have basic urban services such as water supply, sanitation and drainage systems, as well as an energy supply network.
- Unconsolidated Urban Areas. Partially built urban areas in which it can be seen from the aerial photos that some plots are consolidating and that there are land reserves destined for road development.
- Growing Area. Areas planned within the urban plan as being buildable but in which building has not yet commenced.
All landscape units were georeferenced using the ArcGis 10.1 software. Furthermore, their perimeters were delimited, and their surfaces calculated using the same software.
The method of sample collection to measure carbon sequestration and biodiversity indices was developed just in the study area. In each land unit (G, GT and SF), systematic soil sampling was carried out to establish a transect that covered the entire selected study area (Figure 3a). In each transect, five soil sampling points were established in an equidistant manner, where a subplot of 10 × 10 m was located (Figure 4, black square). The sampling points are numbered successively, from 1 to 5 in SF, from 6 to 10 in GT and from 11 to 15 in G). The georeferencing of the 15 points can be found in Appendix A (Table A1).
Figure 4.
A schema of the sample collection procedure.
From each sampling point, the following sub-samples were taken:
- A soil sub-sample was collected at each of three soil depths (0–10 cm, 10–20 cm and 20–30 cm). Non-altered soil samples were taken with cylinders 5 cm long and 5 cm in diameter, which were collected with an Uhland-type sampler to determine bulk density (BD) by the cylinder method. They are marked as red circles in Figure 4.
- Five soil sub-samples were collected at two soil depths of 500 g (0–10 cm and 10–30 cm) and were subsequently homogenized in order to obtain representative soil samples. They were used to calculate the Total Organic Carbon (TOC). They were removed with metal shovels and basic fieldwork instruments in edaphology [40]. They are marked as white circles in Figure 4.
- All of the material corresponding to dead plant remains (litter plant) located in a quadrant of 0.25 m2 was collected in order to calculate the Litter Biomass (LB). The quadrant was placed in the center of the subplot. It is marked as a green square in Figure 4.
In points 1, 3 and 5 corresponding to the SF and in points 6, 8 and 10 corresponding to GT, registration plots of 20 × 20 m were established (Figure 4, pink circle) according to previous methodologies for forest inventories [41,42]. The following data were taken in each: trees with DBH (diameter at breast height, measured at 1.3 m from the height above the ground) ≥10 cm, and corresponding commercial heights. Taxonomic visu identifications were made by the expert botanist (Professor Gabriel Grefa), which were later corroborated in the laboratory and entered into an Excel spreadsheet.
2.3. Carbon Storage (CS) Per Hectare Calculation
It is generally agreed that there are three main forms in which carbon is sequestrated in an area: the Soil Organic Carbon (SOC), the aboveground biomass (AGB) and the litter biomass (LB) [30]. Therefore, quantify carbon storage (CS) in the different landscape units was calculated using the equation proposed by [30]:
where in Mg CO2 ha−1, CS is the carbon storage, SOC is the soil organic carbon storage, AGB is the aboveground biomass storage and LB is the litter biomass storage.
CS (Mg CO2 ha−1) = SOC + AGB + LB
Soil organic carbon (SOC) was calculated using the following equation [30,43].
where BD is the bulk density in Mg/m3, TOC is the total organic carbon by percentage and D is the depth in m.
SOC (Mg CO2 ha−1) = BD ∗ (TOC/100) ∗ D ∗ 10000
The bulk density (BD) of samples were determined by the cylinder method [44], with cylinders 5 cm high and 5 cm in diameter collected with an Uhland-type sampler. In the laboratory, the samples were weighed and dried in a stove at 105 °C for 24 h to obtain the dry weight [45]. TOC was determined by the Walkley-Black wet digestion method [46], by oxidation with potassium dichromate (K2Cr2O7) 1 N, with the addition of concentrated sulfuric acid (H2SO4), and subsequently, the amount of OC oxidized by chromium was measured by titration using a 0.5 N Morh salt solution (H2SO4 + FeSO4 +7H2O).
The aboveground biomass (AGB) on the ground, in Mg/ha, was estimated according to Equation (4). It was calculated once the area corresponding to the SF and GT landscape units of the tourist route was delimited. Firstly, the floristic inventory was carried out using the minimum area method as the sampling method, which allows a rapid elucidation of the plant diversity and floristic composition of the place under consideration [42]. Three temporary plots of 20 × 20 m were established, where all individuals were recorded ≥10 cm of DBH. Subsequently, an allometric equation, applied to tree measurements and generated for Tropical Rainforest conditions, was used to estimate the C storage of the aerial biomass [14,47,48].
where ρ is the wood density in g/cm3 and DBH is the diameter at breast height in cm. Mg C ha−1 multiplied by 0.5 is the CF (carbon fraction), proposed as a measure by the Intergovernmental Panel of Climate Change (IPCC). The Mg CO2 ha−1 can be calculated by multiplying the Mg C ha−1 by 3.67, based on the molecular weight of CO2.
AGB = (ρ ∗ exp (−1.499 + (2.148 ∗ ln(DBH)) + (0.207 ∗ ln(DBH)2) − (0.0281 ∗ ln(DBH)3) ∗ 0.001,
Finally, the litter biomass (LB) was calculated within the subplots of 10 × 10 m with the help of a 0.25 m2 quadrant; all of the material corresponding to dead plant remains located within was collected. The collected material was weighed and placed in bags for drying at 105 °C for 24 h, until a constant weight was obtained. Dry matter in terms of kilograms of dry matter (DM) per hectare was calculated (Kg DM ha−1), and then the amount of carbon per hectare (Kg C ha−1) was calculated, using the following equation:
where LB is amount of C in the litter biomass in Kg C ha−1, DM is the weight of the dry matter in Kg, and CF is the fraction of C determined by the IPCC value of 0.5.
LB = DM × CF
For ease of study, Mg C ha−1 was initially calculated, and then Mg CO2 ha−1 was calculated from that value.
2.4. Ecological Parameters Characterization and Diversity Indices of the Secondary Forest
Initially, temporary plots with the previously georeferenced points (1, 2 and 5) were established. Where the forest inventory was lifted, the plots corresponded to SF (Figure 3). The inventory consisted of identifying plant species in the field and recording the DBH (≥10 cm), along with their commercial heights. Upon completion of the fieldwork, taxa were confirmed in the laboratory and organized in Excel spreadsheets (Table A2. Appendix A).
Table 1 was created following the ecological parameter methodology proposed by [38,47,49]. In the case of Diversity Indices, we used the methodology described in [47]. Using the DBH values (Table 1), a Diametric Class Analysis was performed (Table A3. Appendix A).
Table 1.
The ecological parameters and diversity indices used to characterize secondary forest (SF) based on [38].
2.5. Statistical Analysis
In the statistical analysis of the data obtained from both the soil and vegetation samples, the different landscape units and depths considered were used as comparison factors. The descriptive statistics of the mean, standard deviation and minimum and maximum values were obtained. The analysis of variance (ANOVA) and Tukey multiple comparison tests were then performed to determine significant differences at a probability level of p ≤ 0.05. All statistical analyses were performed using the IBM SPSS Statistics program, version 21, USA.
3. Results
3.1. General Classification of Green Areas in the Urban Periphery
Figure 5 displays the consolidated urban area (marked as black) and the unconsolidated urban area (marked as dark grey), as well as the new expansion areas (marked as light grey), according to the last Urban Plan [34]. As can be seen, the total urban expansion area of Puyo represents 62% of the total area, due to the developing low-density growth pattern (Detail 2 in Figure 5). The unconsolidated area represents 38%, while the new urban expansion area is 24%. In the case of the consolidated area, 30% is green area and 80% is linked to flood areas (rivers or canals) (Figure 6).
Figure 5.
The classification of urban areas in Puyo. Detail 1 is consolidated urban area and Detail 2 is unconsolidated urban area.
Figure 6.
Green areas in the consolidated urban area of Puyo.
Figure 7 displays the green areas classification in the peri-urban area of Puyo using the classification defined in Section 2.1. Considering a radius of 4 km from the geographical center of Puyo, the peri-urban surface is composed of 31% SF, 34% GT and 25% G. The other surfaces are built-in areas or compounds deforested for future buildings.
Figure 7.
Green areas classification in the periphery of Puyo.
3.2. Carbon Dioxide CO2 Storage
Table 2 shows the results for carbon total storage with 143.58 ± 27.93 Mg C ha−1 in SF, 78.66 ± 12.81 Mg C ha−1 in GT and 52.16 ± 7.60 Mg C ha−1 in G. These differences were statistically significant (p ≤ 0.05). On the other hand, the results for total CO2 storage were of 526.95 ± 102.51 Mg CO2 ha−1 in SF, 288.68 ± 47.03 Mg CO2 ha−1 in GT and 191.43 ± 27.88 Mg CO2 ha−1 in G, which show statistically significant differences (p ≤ 0.05)
Table 2.
The retention of CO2 in studio landscape units.
3.3. Secondary Forest Ecological Characterization
In the sampling of the 6.4 ha of secondary forest, 129 individuals were identified (Table A1. Appendix A); 51 species were recorded within 28 families, with a Shannon’s diversity H’ of 3.53 and a Simpson’s dominance D of 0.97. The botanical families with the greatest ecological weights (Table 3) were Fabaceae (FIVI 12%), Melastomataceae (FIVI 10%), Urticaceae (FIVI 9%) and Lauraceae (FIVI 9%). The species with higher values for the Importance Value Index were Miconia bubalina (Melastomataceae), Cecropia membranacea (Urticaceae), Piptocoma discolor (Asteraceae) and Turpinia occidentalis (Staphyleaceae). The most dominant species were Nectandra membranacea (Lauraceae), Inga stipitata (Fabaceae) and Piptocoma discolor (Asteraceae). All other results are summarized in Table 3.
Table 3.
The ecological characterization of the studied SF. DeR: Relative density; DomR: Relative dominance; DivR: Relative diversity; IVI: Importance value index; FIVI: Family importance value index.
According to the diametric classification, 76% of the 129 inventoried individuals correspond to the diametric class with 10–20 cm of DBH (Table A3. Appendix A), which represents 8 m3 of usable wood, while the class with >30 cm of DBH, made up of 8% of the trees in the inventory, represents 15 m3 of wood.
4. Discussion
In settlements with population pressures, such as Puyo, it is necessary to implement urban planning to promote sustainable urban development that addresses current challenges and does not jeopardize the future development of the settlement, as stated in the 2030 Agenda for Sustainable Development and its Sustainable Development Goals (SDG) [31]. In Amazonian cities, such as Puyo, sustainable urban planning should aim to protect the green areas of its urban periphery, since these areas are important sites for terrestrial and freshwater biodiversity. According to SDG 15, protection of these areas will be ensured long-term, and lead to sustainable use of terrestrial and freshwater natural resources. Thus, new areas of planned urban expansion should be the areas with the lowest environmental value.
Our contribution offers objective arguments in favor of the conservation of specific areas in the urban periphery of Puyo, the SF and GT landscape units, due to their environmental value. The results show that the SF studied has similar patterns of heterogeneity to those previously published in other tropical rainforests [14,50] (see Table S1 in Supplementary Material). The families of greater ecological weight (Fabaceae, Melastomataceae, Urticaceae, and Lauraceae) are the same as in [51,52]. Specifically, the 10 families that are the most important within the sampled floristic community account for 51.4% of the total, while 48.59% of the IVI is represented by the other species identified in the inventory. As Table 3 shows, these are all families that have previously been observed in the models of most Amazon rainforests [53,54], and the diversity indices match those previously published by other authors [52,55]. These values demonstrate a medium-to-high dominance, typical of Amazonian ecosystems. The Shannon’s value is 3.53, which is considered high [56,57] and is a value comparable to that of coral reefs, one of the most diverse ecosystems in existence [57]. The value of the Simpson index is 0.97, indicating the great dominance of some species over others. In particular, the dominance of Miconia bubalina (Melastomataceae) and Cecropia membranacea (Urticaceae) was evident in this case.
On the other hand, when analyzing the distribution of the individuals in the diametric classes, it was observed that there was no uniform representation, which is characteristic of young tropical forests in the process of recovery [54]. In particular, it was observed that 75.97% of the individuals identified correspond to the lower diametric class (10–20 cm), contributing to 28% of the total volume, while 8.53% of individuals in the upper diametric class (>30.1 cm) contribute to 53% of the total volume. That is, most individuals are in the lower diametric class, and the number of individuals increases as the diametric range increases, as observed by other authors [11,58], in the Peruvian Amazon. The sampling carried out includes three individuals of the highest diametric class belonging respectively to the species Nectandra membranacea (DBH = 72.26 cm), Inga stipitata (DBH = 59.21 cm), and Pouteria torta (DBH = 57.30 cm). However, most of the elements identified in the sampling were diametric class (10–20 cm) trees belonging to the families Asteraceae, Moraceae and Melastomataceae. The majority presence of these species within this diametric class has been considered to be closely related to the wood characteristics of these species [59], which justifies the presence of many small trees in places close to human populations.
Biodiversity conservation strategies mostly aim at preserving native ecosystems by curbing urban growth and resulting habitat losses, preserving the transformed relicts of natural habitats within cities or restoring native species in urban habitats. These approaches are highly important and necessary, as specific urban ecosystems are not expected to substitute the whole functioning of (semi-) natural systems for biodiversity conservation [60]. The function of urban areas for biodiversity conservation is likely to be minor in cities that are embedded in more natural settings [60] such as Puyo. However, biodiversity conservation plays a key role in the provision of urban and peri-urban ecosystem services [43] which helps to solve or mitigate urban environmental problems, such as air pollution and flooding [22]. The results reveal the importance of maintaining green areas in urban areas and their potential for C storage and minimizing CO2 emissions, which contributes to climate change mitigation [28,61]. In this sense, the potential for carbon storage in different compartments, such as aboveground biomass, litter biomass and soil varies depending on the type of landscape unit and the composition of the species in each one, demonstrating that higher potentials are presented by SF, associated with its higher aerial biomass. According to the results obtained for the present case study, the total carbon storage is estimated at 526.95 ± 102.51 Mg CO2 ha−1 (SF), 288.68 ± 47.03 Mg CO2 ha−1 (GT), and 191.43 ± 27.88 Mg CO2 ha−1 (G). Therefore, the peri-urban green areas of Puyo within a radius of 4 km are generally capable of fixing 1,664,683 Mg CO2. If the areas of greatest environmental value (SF and GT) were reserved in the new urban planning models, this ability would be 153.645 Mg CO2, without counting the green areas inside the urban area.
The differences found between SF, GT and G are statistically significant, due to the decrease in the total number of GT tree plant species compared to SF and the absence of tree species in the G unit. Of the three sources that contribute to carbon storage—SOC, AGB and LB—the greatest contribution comes from AGB, followed by SOC and then LB, which is consistent with the findings of previous authors [52] (see Table S1 Supplementary Material). SF maintains a plant cover composed of different tree strata; this use and management of the ecosystem favors the storage of C and therefore a greater retention of CO2 [62]. On the other hand, the conversion of forests to intensive systems influences the storage of C [62,63].
Current urban planning (Figure 2) prevents the conservation of native biodiversity and reduces the potential ability of Puyo’s urban periphery to provide ecosystem services to its population. In 2008, the local government expanded the area of urban growth in the city [35], but the approved urban planning does not consider the natural context. Therefore, new urban areas do not allow the conservation of green areas of high environmental value, as shown in Figure 8, where areas that are in conflict due to their ecological and urban values are marked in red. The most highly conflicting areas in this approach are outlined below.
Figure 8.
High environmental value green areas in the planned expansion areas of Puyo.
The main area of urban expansion is located in the south of the city, linking the present city of Puyo with Tarqui (Zone 1 in Figure 8). These areas are the priority reserve land areas for urban growth according to the urban planning of Puyo (Figure 2) [34,36]. In this area divided by plots, large green areas are not considered in urban planning instruments. Importantly, 68% of the total expansion area is currently SF or GT that should not be considered as urban land (marked as red area in Figure 8). Thus, the forthcoming consolidation of these areas of urban expansion would mean a loss of these green areas. The main conflicts between urban and conservation land arise in the green areas located on the edge of the Pindo River (Figure 9).
Figure 9.
Unconsolidated urban land linked with the Pindo River.
Secondly, other areas of conflict include that northwest of the city (Zone 2 in Figure 8) because it is an area of protection due to its high environmental value [29] (marked in Figure 2 as “Eco total”, “Eco 1 parcial”, “Eco 1 Especial”), with strong demographic pressure due to its proximity to the city. However, in this case, it is non-urban land according to the Development Urban Plan due to its high gradient, which is between 9% and 34% [34]. Despite this prohibition, buildings can be seen on the slopes of the mountains and it is expected that the number of buildings will increase over time. Such constructions have the risk of being buried due to the constant landslides that occur in this context, due to precipitation and the deforestation caused by anthropic activities.
On the other hand, on the road to Tena (Zone 3 in Figure 8), new urban expansion areas with high environmental value are identified. This is the case of the areas near the Puyo Tourist Walk, the case study of this work (Figure 10a). In this area, 83% of the new urban area is currently occupied by SF and GT lands. Finally, Zone 4 corresponds to the new urban expansion area linked to the road towards Macas, where 23% of the new urban area is in conflict by having both urban and conservation value (Figure 10b). Therefore, it is necessary to analyze the environmental value of the urban periphery of Puyo in order to define the impact of urban expansion as currently planned.
Figure 10.
Expansion urban area details linked with the Tena road (a) and Macas road (b).
The urban expansion study highlights that more than half of the current urban footprint comes from areas in the process of consolidation (Figure 5). This is due to a low-density urban growth pattern, which is associated with the agricultural activities carried out by the population for economic sustenance [16,34,35]. One-third of Puyo’s urban sprawl area has high environmental value green areas (SF), while one-quarter corresponds to heavily degraded areas (G) that are composed of grasslands that were once Amazon rainforest. In contrast to Brazilian Amazon soils, in Ecuador they vary in fertility due to some being of volcanic origin and having high fertility. Therefore, the population pressures on the land in the Ecuadorian Amazon region is resulting in land subdivision and intensification [17,19]. Urban sprawl occurs regardless of the context, as has been seen in European countries [64]. It has serious effects on land uses. In European countries, it causes loss of crop land and ecosystem services with devastating hydrogeological effects, as well as impacts on settled human communities [64]. In the Amazonian context, however, this means that the agricultural frontier has expanded further and further, leading to deforestation and a loss of biodiversity. Previous studies stated that urbanization will play an important role in the spatial reconfiguration of the Ecuadorian Amazon due to high population growth rates and the expectation of further expansion of the oil industry [17,22]. In fact, under further expansion of the oil industry scenario, urban growth is better interpreted as a symptom rather than a driver of forest loss and environmental change [19,65]. Further research should be developed in order to study the urban sprawl in Ecuadorian Amazon cities based on previous developed low-cost or free tools [37,64].
About 80% of the peri-urban areas with the greatest environmental value (SF and GT) are linked to flood areas, where building should be not allowed [35,66]. For this reason, the green areas that we propose to conserve reduce the hydrological risk of the settlement as another ecosystem service. However, according to the data obtained in the investigation, this limitation is not always met. Thus, we can see areas of the city that are flooding areas in which there are buildings (Figure 11); this is the case of the La Isla neighborhood (Figure 11a), which, as the river flow increases, causes problems of habitability for the population [67]. These areas should be restored, keeping them as green spaces that are also public spaces [68]. To protect and restore water-related ecosystems, such as those in Puyo, as wetlands or rivers, is one of the targets in the SDG 6: “Ensure availability and sustainable management of water and sanitation for all” [31]. In the case of the consolidated area, 30% is currently occupied by green areas linked to these flood zones (Figure 6). These have undervalued potential in urban planning, being considered in most cases as wastelands rather than as structuring axes of the city. Previous studies confirm that the development of these green spaces as structuring axes of the city improves the quality of the urban environment by promoting the conservation of biodiversity [69]. Urban planning of Puyo should maintain the connectivity of these green areas and their heterogeneity as structural axes in order to prevent habitat fragmentation [70].
Figure 11.
Urban flooding areas: La Isla neighborhood (a) and flooding areas linked with creeks (b).
Therefore, in Amazonian cities such as Puyo, it is essential to develop biodiversity conservation urban strategies in order to create sustainable settlement [28]. To successfully address this challenge, it is necessary not to be limited solely to a simplistic approach to the analysis of environmental values through indices, but to also undertake an in-depth study of natural or anthropogenic disturbances in peri-urban areas [61]. Previous authors confirmed that there is a direct link between biodiversity and the aesthetic, spiritual, recreational and educational benefits of urban nature [28]. Therefore, it was confirmed that in ecosystem services in urban regions, the degree of psychological benefit was positively correlated with the species richness of the plants [28,60,71]. In fact, previous research stated that some species could be used as experiential key species for nature-disconnected generations, especially for children to reduce the nature deficit disorder [72]. In the case of indigenous communities, it is also linked to essential features of their cultural identity. Indigenous communities who inhabit this region have their cosmovision. Their ultimate aspiration in life is to “live in harmony” (“good living”, or sumak kawsay) that is concrete in the desire for a land without evil, which is achieved if a forest has a high biodiversity (kawsak sacha), clean waters (kawsak yaku), and rich substrates (kawsak alpa) [73]. The sumak kawsay concept has been a fundamental idea of sustainable development in Ecuador since the 2008 Constitution [16]. Therefore, these green areas offer ecosystem services linked with indigenous identity and spiritual life due to the strong perception of indigenous communities that their supay (spirits) are present inside the plants and the animals [73]. In this research, it has been stated that Puyo’s peri-urban area has a wide variety of plant species that shape it as a space of high biodiversity. The species identified (Table 3) are used by different ethnic groups of the Ecuadorian Amazon (Cofán, Secoya, Wao, Siona, Shuar, Achuar, and Amazonian Kichwas and mestizos) for different daily uses according to previous studies [74] (see Table A4 and Table A5 in Appendix A). Fundamentally, the identified species are used for daily activities related to construction or crafts, thus linking them to economic activities (Figure 12). According to the results, an ecosystem service linked with feeding is clearly provided by green spaces of the peri-urban area of Puyo because 51% of identified species have fruit which are used to feed humans (Figure 12). In the precarious context of some peri-urban areas of Puyo, low-income populations could suffer from food insecurity [24]. The ecosystem services provided by green areas linked with human feeding reduce this risk. In addition, approximately half of the identified species are used for medicinal uses (Figure 12). Because of this, these areas contribute to the promotion of health as another ecosystem service. In summary, these areas contribute to the promotion of economic, health, social and cultural benefits for both present and future people living in these settlements. Therefore, these green areas are an asset and should be considered in the environmental, economic and social urban planning instruments for Puyo, in order to improve the management and planning of these neglected spaces towards sustainable urban development.
Figure 12.
Main uses of identified species in the peri-urban green areas of Puyo by indigenous communities according to the Encyclopedia of useful plants of Ecuador [74].
In an Amazonian context, such as that of Puyo’s surroundings, the conservation of the biodiversity of peri-urban areas should be one of the factors taken into account in economic development for sustainable enterprises, such as sustainable and communitarian tourism [75,76] or bioenterprises. These types of activities have a direct relationship with the conservation of the natural environment and its biodiversity, and promotes the integration of different social groups, cultures, and nationalities that coexist in the urban periphery of Puyo. As previously mentioned, it is evident that biodiversity indices need to be incorporated into urban planning instruments, in addition to anthropological factors [77]. To support positive economic, social, and environmental links between urban, peri-urban and rural areas by strengthening national and regional development planning is one of the targets included in the SDG 11 to make human settlements inclusive, safe, resilient and sustainable [31]. In summary, the peri-urban area of Puyo, where agricultural, urban and conservation logics are mixed, provides a space of opportunity to develop a model of urban planning that integrates all of this diversity and allows a dignified and healthy life for its inhabitants. In addition, Puyo’s urban planning has a global impact because Amazon rainforest management is of global interest [12]. In this context, it is necessary to incorporate the theories and tools of landscape ecology into Puyo’s urban planning [28].
Taking the above into account, Figure 13 displays the potential green infrastructure of Puyo as a strategically planned network of natural and semi-natural areas designed and managed to deliver a wide range of ecosystem services [32], where both urban green areas and SF and GT periphery green areas are conserved. It could foster sustainable urban development, promote the conservation of biodiversity, and define a more environmentally friendly pattern of urban growth [69]. The results of this work should be transformed into planning guidelines through the following proposed key actions. First, clearly delimit the flood areas in Puyo in which it will not be possible to build due to inherent risk. Second, clearly define the boundaries of areas of high environmental value. In these areas it will also not be possible to build, and these can be managed by incentives for forest conservation. In Ecuador, the Socio Bosque Program provides incentives for forest conservation which are attractive to local citizens. Previous studies confirm that such strategies promote forest conservation [78,79]. Third, define urban planning according to areas of high environmental value. This involves connecting urban and peri-urban green areas, limiting urban growth in green areas where species are intolerant of human intrusions, or providing “control areas” to buffer the impacts of human activities, among other strategies to prevent habitat fragmentation noted in previous studies [70].
Figure 13.
Green axes as structural elements in proposed urban planning: potential green infrastructure, both urban and periphery, in Puyo linked with the flooding areas.
In summary, Puyo’s peri-urban area is an intermediate space between the urban and the rural areas with excellent potential for the development of sustainable urban planning in which the conservation of the biodiversity of the Amazon rainforest is promoted. In this sense, urban periphery planning should incorporate both areas of greatest environmental value (SF and GT) as identified in this work (Figure 12), and urban green areas, most linked to the flood areas of the territory, as possible green infrastructure. There are currently no studies on urban planning strategies that allow the sustainable development of the periphery of Ecuadorian Amazon cities. However, it is a particularly important issue with a high potential for incidence. The Ecuadorian Amazon cities are three times smaller in size than Brazilian cities [17]. Therefore, if the intense urbanization process of these small cities is not controlled by sustainable urban planning guidelines, the environmental impact could be irreversible.
5. Conclusions
We are experiencing an unprecedented process of global urbanization that threatens the conservation of biodiversity. The threat is greatest in those ecosystems of which their management and conservation are of global interest. This is the case of Puyo, a city in the process of urban expansion in the Ecuadorian Amazon. The urban planning for the new areas of expansion of the city does not promote the conservation of green spaces, thus attacking biodiversity. With the aim of promoting sustainable urban development, this research proposed to demonstrate the potential environmental and ecosystem value of peri-urban green areas in Puyo, a contested city in Amazon region. This was achieved by quantifying its biodiversity and carbon sequestration capacity. To do this, the Puyo River Tourist Walk was taken as a case study because it is a place that is representative of the whole urban periphery. In addition, a spatial analysis of green areas was developed in order to understand the potential for the provision of ecosystem services. According to the results, it is concluded that:
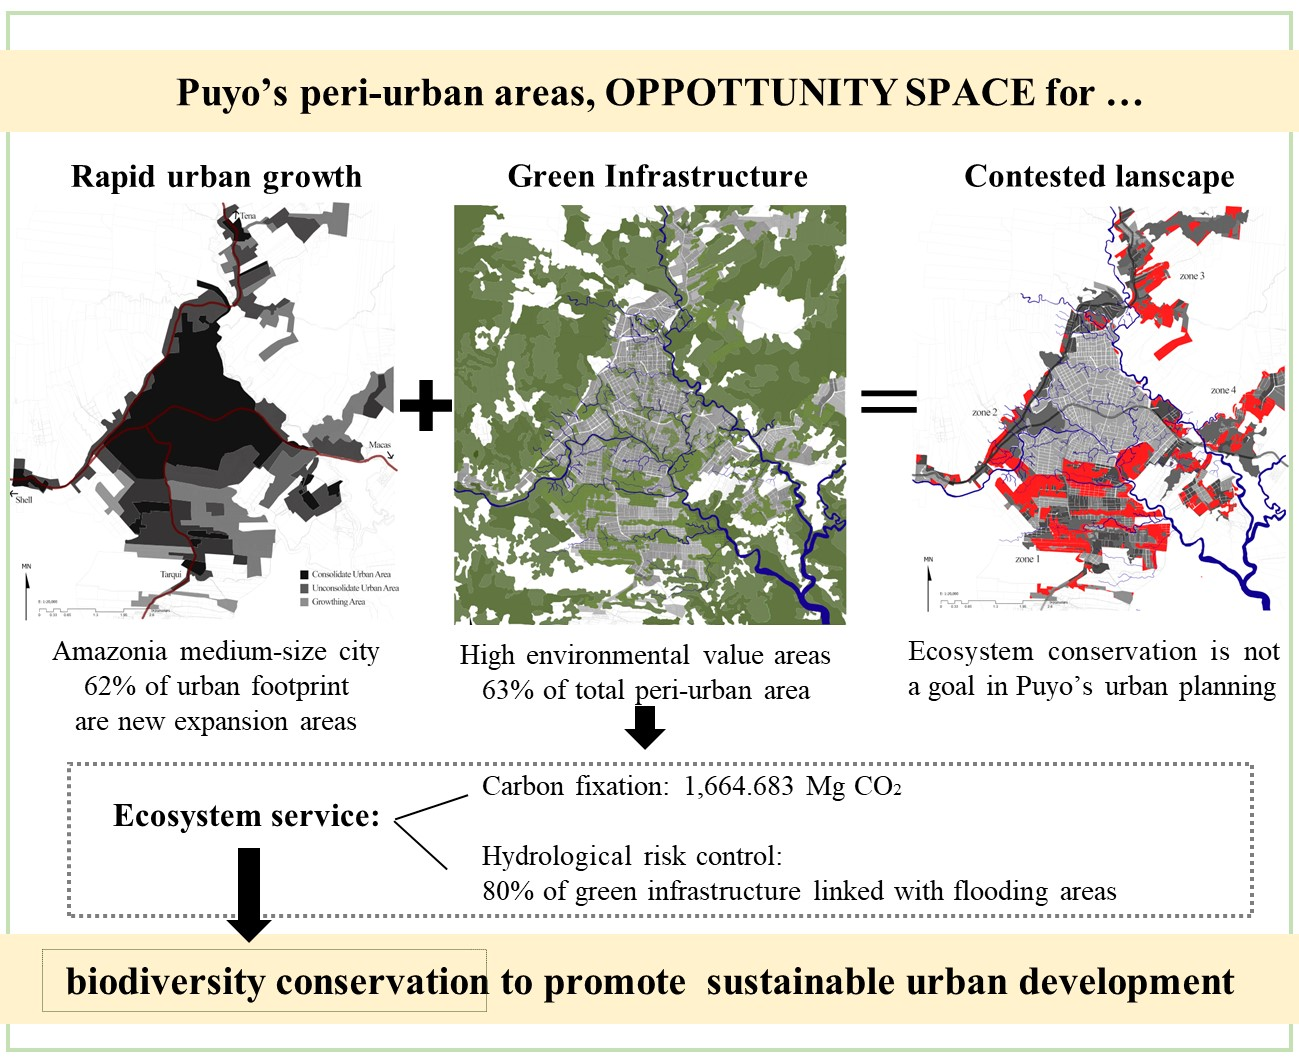
- Puyo’s peri-urban area has green areas with rich biodiversity and high environmental value that should be protected.
- The conservation of these natural ecosystems located in the urban and peri-urban areas of Puyo is not a goal in the urban planning of the city. Thus, there are new planned urban areas that should be preserved as possible green infrastructure. The most congested area is Tarqui (south expansion area), where 64% of new urban area should be kept as green space.
- Both the urban and peri-urban potential green infrastructure of Puyo offers ecosystem services that are not being considered in urban planning, such as air pollution mitigation, flood risk reduction as well as health, food supply, social and cultural benefits.
- The peri-urban green areas of Puyo can fix 1,664,683 Mg CO2. The areas with the most capacity for total carbon storage are the Secondary Forest plots (SF), with 526.95 ± 102.51 Mg CO2 ha−1, and the silvopasture plots (GT), with 288.68 ± 47.03 Mg CO2 ha−1.
- The areas with the highest conservation value are SF and GT, which correspond to 31% and 34%, respectively, of the surface of the urban periphery of Puyo. In these areas, the most dominant species are Nectandra membranacea (Lauraceae), Inga stipitata (Fabaceae) and Piptocoma discolor (Asteraceae).
- Of the areas with the highest environmental value, 80% are linked to flood areas. Therefore, they should not be considered as non-urban spaces in urban planning due to their hydrological risk.
In summary, this paper demonstrates that Puyo’s peri-urban area has a potential natural value to promote sustainable urban planning, where the SF and GT areas are reserved as green areas. These areas improve the conservation of the biodiversity of the Amazon rainforest, which is a globally significant ecosystem. Field works that allow you to measure the parameters defined in this document in SF and GT areas are interesting. At the same time, it is considered that it is necessary to study the anthropological dynamics of the urban periphery of Puyo and its impact on changes in land uses. Our example can serve as an example to be replicated as first step in other Amazon cities. In this context, it is necessary to investigate possible urban planning tools for Amazon cities that promote environmentally, economically and socially sustainable urban development. In the same way, it is recommended to deepen the quantification the ecosystem services of the green areas on the periphery of Puyo linked to health, social and cultural benefits.
Supplementary Materials
The following are available online at https://www.mdpi.com/2071-1050/12/11/4768/s1, Table S1. Carbon Storage calculated at different locations of the world expressed in MgCO2ha−1. The original data from each bibliographic reference was transformed when necessary to this unit by the corresponding calculations, as it is detailed in Material and Methods.
Author Contributions
Conceptualization, A.S.-R. and C.B.-M.; methodology, T.H.-L., A.S.-R., D.C.; formal analysis, T.H.-L., D.C. and C.B.-M.; investigation, T.H.-L., D.C. and A.S.-R.; resources, A.S.-R., T.H.-L., and C.B.-M.; data curation, T.H.-L.; writing—original draft preparation, T.H.-L., & A.S.-R.; writing—review and editing, T.H.-L., A.S.-R.; visualization, T.H.-L. and A.S.-R.; supervision, C.B.-M.; project funding acquisition, C.B.-M., and A.S.-R. All authors have read and agreed to the published version of the manuscript.
Funding
This research was partially funded by the Government of Extremadura (Spain) and the European Union through the programs “Apoyos a los Planes de Actuación de los Grupos de Investigación Catalogados de la Junta de Extremadura: FEDER GR18169 and “Programa de Movilidad Internacional Master Alianza 2019-2020 Uex-Junta de Extremadura”; and by “XX Convocatoria UPM para Contribuir a los ODS” given to “Plataforma LAC UPM”.
Acknowledgments
We are grateful to G. Grefa, J. Alba, D. Paguay, L. Huera, L. Mosquera, D. Alvarez and R. Barroso (Universidad Estatal Amazónica) for their collaboration to the fieldwork, M. Deker (Universidad Estatal Amazónica) for helping us to achieve Puyo’s cartography, as well as F. Olivares and T. Ruiz (Universidad de Extremadura) for helping to improve the original draft of the manuscript. Finally, the authors appreciate the reviewer’s comments to improve the quality of the paper.
Conflicts of Interest
The authors of this manuscript declare no conflicts of interest.
Appendix A
Table A1.
Sampling points in the study area.
Table A1.
Sampling points in the study area.
| Area (ha) | Landscape Units | Points | X | Y |
|---|---|---|---|---|
| 6, 4 | Secondary Forest (SF) | 1 | 166,740.77 | 9,837,311.94 |
| 2 | 166,735.47 | 9,837,237.13 | ||
| 3 | 166,730.18 | 9,837,162.31 | ||
| 4 | 166,724.88 | 9,837,087.50 | ||
| 5 | 166,719.59 | 9,837,012.69 | ||
| 5, 7 | Gramalote pasture with trees (GT) | 6 | 166,627.78 | 9,837,276.69 |
| 7 | 166,605.85 | 9,837,204.96 | ||
| 8 | 166,583.91 | 9,837,133.24 | ||
| 9 | 166,561.98 | 9,837,061.52 | ||
| 10 | 166,540.05 | 9,836,989.80 | ||
| 2, 6 | Gramalote pasture (G) | 11 | 166,480.53 | 9,837,137.68 |
| 12 | 166,450.70 | 9,837,097.9956 | ||
| 13 | 166,420.86 | 9,837,057.43 | ||
| 14 | 166,391.02 | 9,837,017.31 | ||
| 15 | 166,361.19 | 9,836,977.19 |
Table A2.
List of families and species identified in landscape units.
Table A2.
List of families and species identified in landscape units.
| Landscape Unit | Scientific Name | Family Name | Nº Individuals |
|---|---|---|---|
| SF | Anacardiaceae | Tapirira guianensis | 2 |
| SF | Annonaceae | Annona Sp | 1 |
| SF | Annonaceae | Duguetia spixiana | 2 |
| SF | Annonaceae | Trigynea Sp | 6 |
| SF | Arecaceae | Iriartea deltoidea | 1 |
| SF | Arecaceae | Socratea rostrata | 5 |
| SF | Asteraceae | Piptocoma discolor | 9 |
| SF | Burseraceae | Protium aracouchini | 1 |
| SF | Cecropiaceae | Pourouma tomentosa | 1 |
| SF | Chloranthaceae | Hedyosmum Sp | 3 |
| SF | Clusiaceae | Tovomita wedeliana | 2 |
| SF | Clusiaceae | Clusia Sp | 1 |
| SF | Euphorbiaceae | Sapiam glandulosa | 1 |
| SF | Euphorbiaceae | Tetrorchidium macrophyllum | 1 |
| SF | Fabaceae | Calliandra trinervia | 1 |
| SF | Fabaceae | Inga copitata | 2 |
| SF | Fabaceae | Inga edulis | 2 |
| SF | Fabaceae | Inga multinervia | 2 |
| SF | Fabaceae | Inga Sp | 3 |
| SF | Fabaceae | Inga stipitata | 2 |
| SF | Lauraceae | Nectandra lineata | 1 |
| SF | Lauraceae | Nectandra membranacea | 2 |
| SF | Lauraceae | Nectandra Sp | 1 |
| SF | Lauraceae | Nectandra viburnoides | 1 |
| SF | Lauraceae | Pleurothyrium Sp | 1 |
| SF | Malpighiaceae | Bunchosia argentea | 1 |
| SF | Melastomataceae | Miconia bubalina | 13 |
| SF | Melastomataceae | Miconia elata | 1 |
| SF | Melastomataceae | Miconia Sp | 4 |
| SF | Meliaceae | Cabralea cangerana | 1 |
| SF | Meliaceae | Guarea kunthiana | 1 |
| SF | Mirtaceae | Eugenia Sp | 1 |
| SF | Moraceae | Cecropia marginata | 2 |
| SF | Moraceae | Ficus gomelleira | 1 |
| SF | Moraceae | Sorocea muriculata | 1 |
| SF | Myristicaceae | Otoba glycycarpa | 1 |
| SF | Nyctaginaceae | Neea Sp | 1 |
| SF | Rubiaceae | Hippotis Sp | 2 |
| SF | Rubiaceae | Pentagonia amazonica | 4 |
| SF | Rubiaceae | Psychotria Sp | 3 |
| SF | Rutaceae | Zanthoxylum rhoifolium | 1 |
| SF | Sapindaceae | Allophylus edulis | 1 |
| SF | Sapotaceae | Pouteria torta | 1 |
| SF | Silicaceae | Casearia arborea | 4 |
| SF | Solanaceae | Solanaceae | 1 |
| SF | Staphyleaceae | Turpinia occidentalis | 10 |
| SF | Tapisciaceae | Huertea glandulosa | 2 |
| SF | Urticaceae | Cecropia membranacea | 11 |
| SF | Urticaceae | Paurouma bicolor | 1 |
| SF | Urticaceae | Pourouma guianensis | 1 |
| SF | Vochysiaceae | Vochysia brasilinia | 5 |
| GT | Asteraceae | Pictocoma discolor | 7 |
| GT | Fabaceae | Prosopis pallida | 1 |
| GT | Melastomataceae | Meriania Sp | 1 |
| GT | Melastomataceae | Miconia Sp | 1 |
| Total | 28 | 53 | 139 |
Table A3.
Diametric classes identified in the study area.
Table A3.
Diametric classes identified in the study area.
| Diametric Classes | # Individuals | % Individuals | Basal Area (m2) | Volume (m3) |
|---|---|---|---|---|
| 10–20.0 | 98 | 75.97 | 1.72 | 8.38 |
| 20.1–30.0 | 20 | 15.50 | 0.85 | 5.20 |
| >30.1 | 11 | 8.53 | 1.94 | 15.41 |
| Total | 129 | 100.00 | 4.51 | 28.99 |
Table A4.
Main uses that indigenous nationalities give to the plant species registered in the study. Based on Encyclopedia of useful plants of Ecuador [74].
Table A4.
Main uses that indigenous nationalities give to the plant species registered in the study. Based on Encyclopedia of useful plants of Ecuador [74].
| Family Name | Scientific Name | Uses | Ethnic Groups | |||||||
|---|---|---|---|---|---|---|---|---|---|---|
| A | B | C | D | E | F | G | H | |||
| Anacardiaceae | Tapirira guianensis | X | X | X | X | Cofán, Secoya, Wao | ||||
| Annonaceae | Annona duckei | X | X | Cofán | ||||||
| Annonaceae | Duguetia spixiana | X | X | X | X | Cofán, Secoya, Wao, Amazonic Kichwa | ||||
| Annonaceae | Trigynea duckei | X | X | Secoya, Amazonic Kichwa | ||||||
| Arecaceae | Iriartea deltoidea | X | X | X | X | X | X | Cofán, Secoya, Siona, Amazonic Kichwa, Wao, Shuar, Achuar | ||
| Arecaceae | Socratea rostrata | X | X | Cofán, Amazonic Kichwa | ||||||
| Asteraceae | Piptocoma discolor | X | X | X | X | Cofán, Amazonic Kichwa, Shuar | ||||
| Burseraceae | Protium aracouchini | X | X | X | Cofán, Amazonic Kichwa, Wao | |||||
| Cecropiaceae | Pourouma tomentosa | X | X | X | Secoya, Wao, Shuar, Amazonic Kichwa | |||||
| Chloranthaceae | Hedyosmum sprucei | X | X | Amazonic Kichwa, Shuar | ||||||
| Clusiaceae | Tovomita weddelliana | X | X | X | X | X | Cofán, Shuar | |||
| Clusiaceae | Clusia hammeliana | X | X | Cofán, Secoya, Wao | ||||||
| Euphorbiaceae | Sapium glandulosum | X | X | X | Cofán, Secoya, Wao, Amazonic Kichwa | |||||
| Euphorbiaceae | Tetrorchidium macrophyllum | X | X | X | X | Cofán, Secoya, Wao, Amazonic Kichwa | ||||
| Fabaceae | Calliandra trinervia | X | X | X | X | Cofán, Shuar | ||||
| Fabaceae | Inga capitata | X | X | X | Cofán, Secoya, Wao, Shuar, Amazonic Kichwa | |||||
| Fabaceae | Inga edulis | X | X | X | X | X | X | X | Cofán, Secoya, Wao, Shuar, Amazonic Kichwa | |
| Fabaceae | Inga multinervia | X | X | Secoya, Wao | ||||||
| Fabaceae | Inga punctata | X | X | X | X | Cofán, Secoya, Wao Amazonic Kichwa, Shuar | ||||
| Fabaceae | Inga stipitata | X | X | X | Shuar, Achuar, Amazonic Kichwa | |||||
| Fabaceae | Prosopis pallida | X | X | X | X | X | unspecified ethnic | |||
| Lauraceae | Nectandra lineata | X | Shuar | |||||||
| Lauraceae | Nectandra membranacea | X | X | Amazonic Kichwa, Wao | ||||||
| Lauraceae | Nectandra maynensis | X | X | Secoya, Wao | ||||||
| Lauraceae | Nectandra viburnoides | X | Cofán, Amazonic Kichwa, Wao | |||||||
| Lauraceae | Pleurothyrium glabrifolium | X | X | Secoya, Wao, Amazonic Kichwa | ||||||
Uses: Human Feed (A), Vertebrate Animal Feed (B), Construction or Craft (C), Medical (D), Environmental (living fence) (E), Social or Spiritual (F), Invertebrate Animal Feed (G), and Fuel (H).
Table A5.
Continued.
Table A5.
Continued.
| Family Name | Scientific Name | Uses | Ethnic Groups | |||||||
|---|---|---|---|---|---|---|---|---|---|---|
| A | B | C | D | E | F | G | H | |||
| Malpighiaceae | Bunchosia argentea | X | X | X | Amazonic Kichwa, Cofán | |||||
| Melastomataceae | Miconia bubalina | X | X | X | X | Cofán, Secoya, Amazonic Kichwa, Wao, Shuar | ||||
| Melastomataceae | Meriania hexamera | X | Shuar, Amazonic Kichwa | |||||||
| Melastomataceae | Miconia elata | X | X | Cofán, Wao | ||||||
| Melastomataceae | Miconia serrulata | X | X | X | X | Shuar, Wao, Amazonic Kichwa | ||||
| Meliaceae | Cabralea cangerana | X | X | Amazonic Kichwa, Wao, Shuar | ||||||
| Meliaceae | Guarea kunthiana | X | X | X | X | X | Cofán, Secoya, Amazonic Kichwa, Wao, Shuar | |||
| Myrtaceae | Eugenia egensis | X | X | Amazonic Kichwa | ||||||
| Moraceae | Cecropia marginata | X | X | X | Amazonic Kichwa, Secoya | |||||
| Moraceae | Ficus gomelleira | X | X | Shuar | ||||||
| Moraceae | Sorocea muriculata | X | X | Wao | ||||||
| Myristicaceae | Otoba glycycarpa | X | X | X | X | Cofán, Shuar, Wao, Amazonic Kichwa | ||||
| Nyctaginaceae | Neea parviflora | X | X | Cofán, Amazonic Kichwa | ||||||
| Rubiaceae | Hippotis scarlatina | X | X | X | Wao | |||||
| Rubiaceae | Pentagonia amazonica | X | X | Cofán, Wao | ||||||
| Rubiaceae | Psychotria anemothyrsa | X | X | Amazonic Kichwa | ||||||
| Rutaceae | Zanthoxylum riedelianum | X | X | X | Cofán, Secoya, Amazonic Kichwa | |||||
| Sapindaceae | Allophylus edulis | X | X | X | Amazonic Kichwa, Wao | |||||
| Sapotaceae | Pouteria torta | X | X | X | X | Amazonic Kichwa, Wao, Secoya | ||||
| Salicaceae | Casearia arborea | X | X | X | X | Amazonic Kichwa, Secoya, Shuar | ||||
| Solanaceae | Solanum altissimum | X | X | X | Amazonic Kichwa, Wao, Secoya | |||||
| Staphyleaceae | Turpinia occidentalis | X | X | Wao | ||||||
| Tapisciaceae | Huertea glandulosa | X | X | X | Amazonic Kichwa, Wao, Secoya | |||||
| Urticaceae | Cecropia membranacea | X | X | X | X | X | Amazonic Kichwa, Wao, Secoya | |||
| Urticaceae | Pourouma bicolor | X | X | X | Cofán | |||||
| Urticaceae | Pourouma guianensis | X | X | X | Amazonic Kichwa, Wao, Shuar | |||||
| Vochysiaceae | Vochysia braceliniae | X | X | Amazonic Kichwa, Cofán | ||||||
Uses: Human Feed (A), Vertebrate Animal Feed (B), Construction or Craft (C), Medical (D), Environmental (living fence) (E), Social or Spiritual (F), Invertebrate Animal Feed (G), and Fuel (H).
References
- World Bank. World Bank Data: Percentage of World Urban Population. Available online: https://datos.bancomundial.org/indicador/SP.URB.TOTL.IN.ZS (accessed on 26 February 2020).
- López-goyburu, P.; García-montero, L.G. The urban-rural interface as an area with characteristics of its own in urban planning: A review. Sustain. Cities Soc. 2018, 43, 157–165. [Google Scholar] [CrossRef]
- Geneletti, D.; La Rosa, D.; Spyra, M.; Cortinovis, C. A review of approaches and challenges for sustainable planning in urban peripheries. Landsc. Urban Plan. 2017, 165, 231–243. [Google Scholar] [CrossRef]
- Dadashpoor, H.; Ahani, S. Land Use Policy Land tenure-related conflicts in peri-urban areas: A review. Land Use Policy 2019, 85, 218–229. [Google Scholar] [CrossRef]
- Alexiades, M.; Peluso, D. Indigenous urbanization in Amazonia: A new context for social and territorial articulation. Gaz. Antropol. 2016, 32. [Google Scholar]
- Ryder, R.; Brown, L.A. Urban-System Evolution on the Frontier of the Ecuadorian Amazon. Geogr. Rev. 2015, 90, 511–535. [Google Scholar]
- Boatzat, A.; Fischera, L.K.; Kowarik, I. Unexploited opportunities in understanding liveable and biodiverse cities. A review on urban biodiversity perception and valuation. Glob. Environ. Chang. 2016, 39, 220–233. [Google Scholar] [CrossRef]
- Pan, H.; Page, J.; Zhang, L.; Cong, C.; Ferreira, C.; Jonsson, E.; Näsström, H.; Destouni, G.; Deal, B.; Kalantari, Z. Understanding interactions between urban development policies and GHG emissions: A case study in Stockholm Region. Ambio 2019. [Google Scholar] [CrossRef]
- Palacios, W.A.; Jaramillo, N. Riqueza florística y forestal de los bosques tropicales húmedos. Rev. For. Centroam. 2001, 36, 5. [Google Scholar]
- GADPPz. Plan de Ordenamiento Territorial de la Provincia de Pastaza, 2025; Decentralized Autonomous Government of Pastaza (GADPPz): Pastaza, Ecuador, 2015.
- Quizhpe, C.W.; Aguirre Mendoza, Z.; Aguirre Mendoza, N. Red de parcelas permanentes en el sur del Ecuador, herramienta para el monitoreo de la dinámica de flora y vegetación. Bosques Latid. Cero 2016, 6, 142–159. [Google Scholar]
- Lewis, S.L.; Lopez-Gonzalez, G.; Sonké, B.; Affum-Baffoe, K.; Baker, T.R.; Ojo, L.O.; Phillips, O.L.; Reitsma, J.M.; White, L.; Comiskey, J.A.; et al. Increasing carbon storage in intact African tropical forests. Nature 2009, 457, 1003–1006. [Google Scholar] [CrossRef]
- Wang, X.; Piao, S.; Ciais, P.; Friedlingstein, P.; Myneni, R.B.; Cox, P.; Heimann, M.; Miller, J.; Peng, S.; Wang, T.; et al. A two-fold increase of carbon cycle sensitivity to tropical temperature variations. Nature 2014, 506, 212–215. [Google Scholar] [CrossRef] [PubMed]
- Torres, B.; Vasseur, L.; López, R.; Lozano, P.; García, Y.; Arteaga, Y.; Bravo, C.; Barba, C.; García, A. Structure and above ground biomass along an elevation small-scale gradient: Case study in an Evergreen Andean Amazon forest, Ecuador. Agrofor. Syst. 2019, 1–11. [Google Scholar] [CrossRef]
- Bravo, C.; Torres, B.; Alemán, R.; Marín, H.; Durazno, G.; Navarrete, H.; Gutiérrez, E.T.; Tapia, A. Indicadores morfológicos y estructurales de calidad y potencial de erosión del suelo bajo diferentes usos de la tierra en la Amazonía ecuatoriana. In Anales de Geografia de La Universidad Complutense; Universidad Complutense de Madrid: Madrid, Spain, 2017; Volume 37, pp. 247–264. [Google Scholar] [CrossRef]
- Cuesta Molestina, R. El uso de modelos geográficos en el análisis del suelo y determinación de zonas de conflicto. Su aplicación en el Cantón Pastaza-Amazonía Ecuatoriana, Universidad Nacional del Sur. Ph.D. Thesis, Universidad Nacional del Sur, Bahía Blanca, Argentina, 2019. Available online: http://repositoriodigital.uns.edu.ar/handle/123456789/4684 (accessed on 26 February 2020).
- Barbieri, A.F.; Monte-mór, R.L.M. Towns in the Jungle: Exploring Linkages between Rural-Urban Mobility, Urbanization and Development in the Amazon. Urban Population-Environment Dynamics in the Developing World: Case Studies and Lessons Learned; Committee for International Cooperation in National Research in Demography (CICRED): Paris, France, 2007; 316p, Available online: http://www.populationenvironmentresearch.org/workshops.jsp#W2007 (accessed on 26 February 2020).
- Eastwood, D.A.; Pollard, H.J. Amazonian Colonization in Eastern Ecuador: Land Use Conflicts in a Planning Vacuum. Singap. J. Trop. Geogr. 1993, 13, 103–117. [Google Scholar] [CrossRef]
- Bilsborrow, R.E.; Barbieri, A.F.; Pan, W. Changes in population and land use over time in the Ecuadorian Amazon. Acta Amaz. 2004, 34, 635–647. [Google Scholar] [CrossRef]
- Fontaine, G. El Precio del Petróleo: Conflictos Socio-ambientales y Gobernabilidad en la Región Amazónica; FLACSO, Sede Académica de Ecuador: Quito, Ecuador, 2003; ISBN 9978670769. [Google Scholar]
- Sirén, A.H. Changing Interactions between Humans and Nature in Sarayaku, Ecuadorian Amazon. Ph.D. Thesis, Swedish University of Agricultural Sciences, Uppsala, Sweden, 2004. [Google Scholar]
- Bayón, M.; Durán, G.; Bonilla, A.; Zárate, D.; González, J.; Araujo, M. Lago Agrio: Barrios petroleros en el casco urbano que claman por sus derechos Manuel. In Violencia y Constestaciones en la Producción del Espacio Urbano Periférico del Ecuador; Ecuador, F., Ed.; FLACSO Ecuador: Quito, Ecuador, 2020; p. 35. ISBN 9789942381880. [Google Scholar]
- Ortiz-T, P. Espacio, Territorio e Interculturalidad: Una Aproximación a sus Conflictos y Resignificaciones Desde la Amazonía de Pastaza en la Segunda Mitad del Siglo XX. Ph.D. Thesis, Universidad Andina Simón Bolívar, sede Ecuador, Quito, Ecuador, 2012. [Google Scholar]
- Cabrero, F. Soberanía Indigena. Claroscuros en la costrucción del Estado plurinacional e intercultutal en el Ecuador; Universidad Estatal Amazónica and ICONES: Cooperación Cultural per a la Transformació Social, Ed.; Universidad Estatal Amazónica and ICONES: Cooperación Cultural per a la Transformació Social: Paztaza, Ecuador, 2019; ISBN 978-9942-932-30-3. [Google Scholar]
- Peluso, D.M. Circulating between Rural and Urban Communities: Multisited Dwellings in Amazonian Frontiers. J. Lat. Am. Caribb. Anthropol. 2015, 20, 57–79. [Google Scholar] [CrossRef]
- Ortiz-T, P. El Laberinto De La Autonomía Indígena En El Ecuador: Las Circunscripciones Territoriales Indígenas En La Amazonía Central, 2010–2012. Lat. Am. Caribb. Ethn. Stud. 2015, 10, 60–86. [Google Scholar] [CrossRef]
- Balvanera, P.; Cotler, H. Acercamientos al estudio de los servicios ecosistémicos. Gac. Ecológica 2007, 84–85, 8–15. [Google Scholar]
- Fernandez, I.C.; De La Barrera, F. Biodiversidad urbana, servicios ecosistémicos y planificación ecológica: Un enfoque desde la ecología del paisaje. In Biodiversidad Urbana en Chile: Estado del arte y los Desafíos Futuros; Universidad Central de Chile: Metropolitana, Chile, 2018; pp. 115–146. [Google Scholar]
- GADPPz. Regulaciones de uso del suelo y plano manzanero del Municipio de Pastaza. In Plan de Ordenamiento Territorial de la Provincia de Pastaza; Decentralized Autonomous Government of Pastaza Province(GADPPz): Pastaza, Ecuador, 2015. [Google Scholar]
- López-Santiago, J.G.; Casanova-Lugo, F.; Villanueva-López, G.; Díaz-Echeverría, V.F.; Solorio-Sánchez, F.J.; Martínez-Zurimendi, P.; Aryal, D.R.; Chay-Canul, A.J. Carbon storage in a silvopastoral system compared to that in a deciduous dry forest in Michoacán, Mexico. Agrofor. Syst. 2019, 93, 199–211. [Google Scholar] [CrossRef]
- United Nations. Transforming Our World: The 2030 Agenda for Sustainable Development; A/RES/70/1; United Nations: New York, NY, USA, 2015. [Google Scholar]
- Hislop, M.; Scott, A.J.; Corbett, A.; Hislop, M.; Scott, A.J.; Corbett, A.; Does, W. What Does Good Green Infrastructure Planning Policy Look Like ? Developing and Testing a Policy Assessment Tool Within Central Scotland UK. Plan. Theory Pract. 2019, 20, 633–655. [Google Scholar] [CrossRef]
- Ministerio del Ambiente. Ministerio del Ambiente Manual de Protocolos para la Gestion de la Vida Silvestre en el Ecuador Continental; Ministerio del Ambiente: Quito, Ecuador, 2015.
- GADMCP. Plan de desarrollo y ordenamiento territorial del Cantón Pastaza. 2015–2020; Decentralized Autonomous Government of Pastaza canton (GADMCP): Puyo, Pastaza, Ecuador, 2015.
- Rosero Minda, B. Planificación Territorial para la definición de una estructura funcional para la ciudad del Puyo y zonas de expansión; Universidad Católica del Ecuador: Quito, Ecuador, 2012. [Google Scholar]
- GADPPz. Mapa de Regulación de Usos del Suelo en Áreas de Influencia Urbana Inmediata. In Plan de Ordenamiento Territorial de la Provincia de Pastaza; Decentralized Autonomous Government of Pastaza province (GADPPz): Pastaza, Ecuador, 2015. [Google Scholar]
- Nolè, G.; Murgante, B.; Calamita, G.; Lanorte, A.; Lasaponara, R. Evaluation of urban sprawl from space using open source technologies. Ecol. Inform. 2015, 26, 151–161. [Google Scholar] [CrossRef]
- Lozano, P.; Torres, B.; Rodríguez, X. Investigación de Ecología Vegetal en Ecuador. Muestreo y Herramientas Geográficas; Universidad Estatal Amazónica: Puyo, Pastaza, Ecuador, 2013; ISBN 9789942932044. [Google Scholar]
- Ji, W.; Ma, J.; WahabTwibell, R.; Underhill, K. Characterizing urban sprawl using multi-stage remote sensing images and landscape metrics. Comput. Environ. Urban Syst. 2016, 60, 61–879. [Google Scholar] [CrossRef]
- Huera-Lucero, T. Valoración de los Servicios Ecosistémicos en Diferentes Usos de Suelo del Paseo turístico río Puyo, Provincia de Pastaza; Universidad Estatal Amazónica: Puyo-Pastaza, Ecuador, 2019. [Google Scholar]
- Torres, B. Libro de Memorias de las Primeras Jornadas Científicas UEA. Proyectos de Investigación aprobados en 2012; Universidad Estatal Amazónica: Puyo-Pastaza, Ecuador, 2013. [Google Scholar]
- Dahua Machoa, A.N. Evaluación de la Composición Florística y Estructura del Remanente de Bosque en las áreas Ganaderas del Centro de Investigación, Posgrado y Conservación Amazónica “CIPCA” Cantón Santa Clara, Provincia de Pastaza, Ecuador; Universidad Estatal Amazónica: Puyo-Pastaza, Ecuador, 2015. [Google Scholar]
- Pradhan, B.M.; Awasthi, K.D.; Bajracharya, R.M. Soil organic carbon stocks under different forest types in pokhare khola sub-watershed: A case study from Dhading district of Nepal. WIT Trans. Ecol. Environ. 2012, 157, 535–546. [Google Scholar] [CrossRef]
- Blake, G.R.; Hartge, K.H. Bulk Density. In Methods of Soil Analysis: Part 1—Physical and Mineralogical Methods; Klute, A., Ed.; SSSA B. Series 5.1. SSSA, ASA: Madison, WI, USA, 1986; pp. 363–375. [Google Scholar] [CrossRef]
- Pla, I. Medición y evaluación de propiedades fisicas de los suelos: Dificultades y errores más frecuentes. I-Propiedades mecánicas. Suelos Ecuat. 2011, 40, 75–93. [Google Scholar]
- Nelson, D.W.; Sommers, L.E. Total carbon, Organic carbon, and Organic matter 1. In Methods of Soil Analysis. Part 2. Chemical and Microbiological Properties-Agronomy Monograph No. 9; Segoe Rd.: Madison, WI, USA; West Lafayette, Indiana, 1982; pp. 539–579. [Google Scholar]
- Aryal, D.R.; Gómez-González, R.R.; Hernández-Nuriasmú, R.; Morales-Ruiz, D.E. Carbon stocks and tree diversity in scattered tree silvopastoral systems in Chiapas, Mexico. Agrofor. Syst. 2019, 93, 213–227. [Google Scholar] [CrossRef]
- Chave, J.; Andalo, C.; Brown, S.; Cairns, M.A.; Chambers, J.Q.; Eamus, D.; Fölster, H.; Fromard, F.; Higuchi, N.; Kira, T.; et al. Tree allometry and improved estimation of carbon stocks and balance in tropical forests. Oecologia 2005, 145, 87–99. [Google Scholar] [CrossRef]
- Mori, S.A.; Boom, B.M.; de Carvalino, A.M.; dos Santos, T.S. Ecological Importance of Myrtaceae in an Eastern Brazilian Wet Forest. Biotropica 1983, 15, 68. [Google Scholar] [CrossRef]
- Samaniego, E.; García, Y.; Neill, D.; Arteaga, Y.; Vargas, J.C.; Rojas, L. Diversidad florística de tres sitios de un bosque siempreverde piemontano de la región oriental amazónica del Ecuador Floristic Diversity of three Locations of a Piemontano Evergreen Forest in the Ecuadorian Eastern Amazon Region. Rev. Amaz. Cienc. Tecnol. Vol. 2015, 4, 32–47. [Google Scholar]
- Garófalo Vega, B.J. Biomasa Aérea de Familias Botánicas del Bosque Siempreverde Piemontano de la Microcuenca río Puyo como Contribución a los Servicios Ecosistémicos; Universidad Estatal Amazónica: Puyo, Ecuador, 2018. [Google Scholar]
- Moreno Samaniego, G.F. Biodiversidad y Potencial de Captura de Carbono en Distintos Tipos de Bosque de la Cuenca alta del río Napo; Universidad Estatal Amazónica: Puyo, Ecuador, 2018. [Google Scholar]
- Ter Steege, H.; Pitman, N.C.; Sabatier, D.; Baraloto, C.; Salomão, R.P.; Guevara, J.E.; Phillips, O.L.; Castilho, C.V.; Magnusson, W.E.; Molino, J.-F.; et al. Hyperdominance in the Amazonian Tree Flora. Science 2013, 342, 1243092. [Google Scholar] [CrossRef]
- Aguirre Mendoza, Z. Composición florística, estructura y endemismo del componente leñoso de un bosque montano en el sur del Ecuador. Arnaldoa 2017, 24, 543–556. [Google Scholar] [CrossRef]
- Patiño, J.; Tipán, C.; Navarrete, H.; López, R.; Asanza, M.; Bolier, T. Composicion floristica y estructura de un bosque siempre verde piemontano-Ecuador. Rev. Amaz. Cienc. Tecnol. Vol. 2015, 4, 166–192. [Google Scholar]
- Campo, A.M.; Duval, V.S. Diversidad y valor de importancia para la conservación de la vegetación natural. Parque Nacional Lihué Calel (Argentina). An. Geogr. Univ. Complut. 2014, 34, 25–42. [Google Scholar] [CrossRef]
- Pla, L. Biodiversidad: Inferencia basada en el índice de shanon y la riqueza. Interciencia 2006, 31, 583–590. [Google Scholar]
- Nebel, G.; Kvist, L.P.; Vanclay, J.K.; Christensen, H.; Freitas, L.; Ruíz, J. Structure and floristic composition of flood plain forests in the Peruvian Amazon I. Overstorey. For. Ecol. Manage. 2001, 150, 27–57. [Google Scholar] [CrossRef]
- Lamprecht, H. Silvicultura en los Trópicos: Los Ecosistemas Forestales en los Bosques Tropicales y sus Especies Arbóreas, Posibilidades y Métodos Para un Aprovechamiento Sostenido; Cooperación Técnica-Alemana: Eschborn, Germany; GTZ: Bonn, Germany, 1990; ISBN 3880854408. [Google Scholar]
- Kowarik, I. Novel urban ecosystems, biodiversity, and conservation. Environ. Pollut. 2011, 159, 1974–1983. [Google Scholar] [CrossRef] [PubMed]
- Rubiano Calderón, K.D. Distribución de la infraestructura verde y su capacidad de regulación térmica en Bogotá, Colombia. Colomb. For. 2019, 22, 83–100. [Google Scholar] [CrossRef]
- Martínez, H.E.; Fuentes, E.J.P.; Acevedo, H.E. Carbono orgánico y propiedades del suelo. Rev. Cienc. Suelo Nutr. Veg. 2008, 8, 68–96. [Google Scholar] [CrossRef]
- Bravo Medina, C.A.; Torres, B.; Alemán, R.; Changoluisa, D.; Marín, H.; Reyes, H.; Navarrete, H. Soil structure and carbon sequestration as ecosystem services under different land uses in the ecuadorian amazon region. In Proceedings of the MOL2NET 2017, International Conference on Multidisciplinary Sciences, 3rd ed.; MDPI, Basel, Switzerland, 2017; p. 4859. [Google Scholar]
- Romano, B.; Zullo, F. Models of urban land use in Europe: Assessment tools and criticalities. Int. J. Agric. Environ. Inf. Syst. 2013, 4, 80–97. [Google Scholar] [CrossRef]
- Bayón, M.; Durán, G.; Bonilla, A.; Ávila, M. El Pangui: Urbanización en la Amazonía Sur—entre el desplazamiento y las regalías mineras. In Violencia y Constestaciones en la Producción del Espacio Urbano Periférico del Ecuador; Ecuador, F., Ed.; FLACSO Ecuador: Quito, Ecuador, 2020; p. 41. ISBN 978-9942-38-190-3. [Google Scholar]
- Salas, J.; Franchini, T.; Mancebo, J.A.; Gesto, B.; Perea, L.; Bergalache, E.; Gómez, G. Evaluando la Habitabilidad Básica: Una Propuesta para Proyecto de Cooperación; Catarata: Madrid, Spain, 2012. [Google Scholar]
- Vallejo-Tamayo, C.S. La Vulnerabilidad física Frente a Inundaciones del río Puyo en el Sector La Isla. Cantón Pastaza. Provincia de Pastaza; Universidad Central del Ecuador: Quito, Ecuador, 2019. [Google Scholar]
- Soz, S.A.; Fryspin-Watson, J.; Stanton-Geddes, Z. The Role of Green Infraestructure Solutions in Urban Flood Riskmanagement; Working Paper; World Bank Group: Washington, DC, USA, 2016. [Google Scholar]
- Kong, F.; Yin, H.; Nakagoshi, N.; Zong, Y. Urban green space network development for biodiversity conservation: Identification based on graph theory and gravity modeling. Landsc. Urban Plan. 2010, 95, 16–27. [Google Scholar] [CrossRef]
- Lindenmayer, D.B.; Franklin, J.F.; Fischer, J. General management principles and a checklist of strategies to guide forest biodiversity conservation. Biol. Conserv. 2006, 131, 433–445. [Google Scholar] [CrossRef]
- García, L.R.; Curetti, G.; Garegnani, G.; Grilli, G.; Pastorella, F.; Paletto, A. La valoración de los servicios ecosistémicos en los ecosistemas forestales: Un caso de estudio en Los Alpes Italianos. Bosque 2016, 37, 41–52. [Google Scholar] [CrossRef]
- Battisti, C. Experiential key species for the nature-disconnected generation. Anim. Conserv. 2016, 19, 485–487. [Google Scholar] [CrossRef]
- Luzuriaga-Quichimbo, C.X. Estudio etnobotánico en comunidades kichwas amazónicas de Pastaza, Ecuador; Universidad de Extremadura: Badajoz, Spain, 2017. [Google Scholar]
- Torre, L.; Navarrete, H.; Muriel, M.P.; Macía, M.J.; Balslev, H. Enciclopedia de las Plantas útiles del Ecuador; de la Torre, L., Navarrete, H., Muriel, M.P., Macía, M.J., Balslev, H., Eds.; Herbario QCA of Escuela de Ciencias Biológicas at Pontificia Universidad Católica del Ecuador: Quito, Ecuador; Herbario AAU of Departamento de Ciencias Biológicas of Universidad de Aarhus: Aarhus, Denmark, 2008. [Google Scholar]
- Código-Ingenios Código Orgánico de Economía Social del Conocimiento e Innovació. Available online: http://coesc.educacionsuperior.gob.ec/index.php/Código_Orgánico_de_Economía_Social_del_Conocimiento_e_Innovación (accessed on 10 June 2020).
- Reyes Vargas, M.V.; Ortega Ocaña, A.F.; Machado Chaviano, E.L. Modelo para la gestión integrada del turismo comunitario en ecuador, caso de estudio pastaza. REVESCO Rev. Estud. Coop. 2017, 250–275. [Google Scholar]
- Battisti, C.; Contoli, L. Diversity indices as “Magic” tools in landscape planning: A cautionary note on their uncritical use. Landsc. Res. 2011, 36, 111–117. [Google Scholar] [CrossRef]
- Mohebalian, P.M.; Aguilar, F.X. Beneath the Canopy: Tropical Forests Enrolled in Conservation Payments Reveal Evidence of Less Degradation. Ecol. Econ. 2018, 143, 64–73. [Google Scholar] [CrossRef]
- Jones, K.W.; Holland, M.B.; Naughton-Treves, L.; Morales, M.; Suarez, L.; Keenan, K. Forest conservation incentives and deforestation in the Ecuadorian Amazon. Environ. Conserv. 2017, 44, 56–65. [Google Scholar] [CrossRef]
© 2020 by the authors. Licensee MDPI, Basel, Switzerland. This article is an open access article distributed under the terms and conditions of the Creative Commons Attribution (CC BY) license (http://creativecommons.org/licenses/by/4.0/).