Abstract
Local government relates to the public administration of towns, cities, counties, and districts. One of the key responsibilities of local government is the administrative purpose of supplying goods and services. Local governments should also represent and involve citizens in determining specific local public needs and how these local needs can be met. As the structure of gross domestic product (GDP) in many countries across the world changes, so do the expectations towards the role of local governments as far as supporting local economic growth is concerned. The administrative purpose involves creating conducive conditions for economic development. Statistical figures show that the share of the creative economy in the GDP of the most developed countries is steadily increasing. New economic sectors such as “creative industries” pose a challenge to local governments. In this paper, we present a conceptual model for measuring the efforts of local governments in developing and supporting the creative industries. The model proposed by the authors allows for the comparison of smaller administrative units such as counties regarding their advancement and commitment to supporting creative industries.
1. Introduction
The issue of economic development has been at the centre of economics since its very beginnings [1]. The question about the factors that lead to the wealth of nations, which occupied the attention of Adam Smith, is still valid. Smith concluded that low taxes, peace, and a workable system of justice would lead to economic growth [1]. Over the course of history, mankind has gone through several stages of economic development, which are usually referred to as ‘revolutions’. The most rapid changes in economic development took place in the last 250 years and are called industrial revolutions. The industrial model of economic development requires a constant supply of natural resources, such as coal and iron ores, as well as oil and gas. The last 40 years of economic development have proved that rapid economic progress can be achieved through service industries and knowledge economies. Depending on their perspective, different scholars highlight different distinguishing features of those changes, for example, knowledge-based economy, weightless economy [2], The Digital Era, or Industry 4.0. Today the economies and societies of the most industrialised countries of the world are changing at a rapid pace. Intangible assets play a crucial role; among them, special attention is devoted to knowledge as a driver of economic growth. Knowledge may appear both as an input (competence) and output (innovation) in the production process [3]. In a similar vein, knowledge is both an input (creative thinking, creative insights, creative persons, creative press) (see also the work of [4]) and an output of economic processes (innovation). Knowledge, like many other intangible assets, is immaterial. We believe that the scarcity of intangible resources in the 21st century will be just as important as the scarcity of natural resources—a common theme in the literature on sustainability.
The concept of the ‘creative economy’ [5,6,7,8,9] is another perspective describing the directions of current economic development and is a broader term to describe “creative industries” [10]. Here, the main focus is on the role of creativity of people in economic outputs. According to Howkins, a creative economy is “economic systems where value is based on imaginative qualities rather than the traditional resources of land, labour and capital”. Compared with creative industries, which are limited to specific sectors, the term “creative economy” is used to describe creativity throughout a whole economy [11,12,13]. Originally, the focus of policymakers regarding the creative economy was on its economic value, but now it has shifted towards its social and cultural value [12,14,15]. According to the United Nations [16,17], creative economy sectors include arts and crafts, books, films, paintings, festivals, songs, designs, digital animation, and video games. They generate income through trade (exports) and intellectual property rights, as well as create new jobs in knowledge-intensive positions in all types of enterprises. In the United Kingdom, a country considered to be one of the world leaders in the creative industries development, the creative industries contribute considerably more to the economy than financial services (employing 2 million people, compared with the financial sector’s 1 million—which contributes just 1 percent more than the creative sector to the U.K. gross domestic product (GDP)) [12]. Thus, the (potential) role of local government in supporting their growth is relatively greater than in the case of other industries, which may be more prone to national level interventions. Creative industries are one of the most unevenly spread sectors, behind only agriculture, finance, and insurance [18]. Creative economies are predominantly concentrated in towns, cities, and metropolitan areas (which correspond with the county NTS-4 (Nomenclature of Territorial Units for Statistics) level in regional development analysis), and consequently their development heavily depends on the scale of support from the local governments. Possession of state-of-the-art knowledge has to be supplemented with the ability to create knowledge. Creation is considered the highest level of the cognitive domain [19], above understanding and applying knowledge. If we apply this statement to the domain of economics, we can conclude that creative industries should in fact produce more economic added-value than “knowledge-intensive (or knowledge-rich) industries”. Consequently, they should garner even more attention from the policy-makers than knowledge-intensive industries. The subtle difference lies in the fact that creativity is positioned higher than knowledge in the hierarchy of cognitive skills. The Industrial Revolution of late 18th-century Britain exploited significant amounts of new scientific and engineering knowledge in steam engines, textiles manufacture, new methods of mining, and other production processes. The emergence of creative industries (within the knowledge-intensive sectors) is marked by success stories such as CD PROJEKT, a player on the global digital entertainment market. The company is active on the global market. Its main products are The Witcher, The Witcher 2, The Witcher 3, and Cyberpunk 2077. CD PROJEKT’s market capitalization is approximately 23 billion Polish Zloties (approximately USD 6.0 billion) and exceeds the market value of Polish giant KGHM (Kombinat Górniczo-Hutniczy Miedzi, which describes itself as a “high-tech geological, mining, and metallurgy business”), the largest silver producer and eighth largest copper producer in the world. The intensive application of knowledge is not the only feature of today’s successful businesses. The potential role of public administration in supporting creativity is substantial.
Creative economies do not rely heavily on natural resources, which implies that their negative impact on the climate is relatively lower than that of other industries. “Creative economy” is a broader term for “creative industries”. The creative economy encompasses people with creative occupations working in the creative industries, as well as workers with creative occupations working in another industry and people in non-creative jobs working in a creative industry [10,20]. This definition should also include workers working in the public sector and non-government organizations. Not much academic research has been published so far on the role of local governments in promoting creative industries. Even though many cities and regions across the world publish white papers and analyses describing their role in developing creative industries, there is a deficit of larger-scale comparative studies and conceptual models.
The goal of our research was to propose a new model for measuring the efficiency of local governments in supporting creative industries locally. We will investigate the possible areas of intervention of local government in providing socio-economic stimuli at local level for the growth and proliferation of creative economy and creative industries. We used data collected from a survey conducted on a sample of Polish counties.
This research fits within the 2030 Agenda for Sustainable Development (SDA), which was adopted at the United Nations Summit (UNS) in New York. On 25 September 2015, the Member States of the United Nations agreed on the 17 Sustainable Development Goals (SDGs) of the Post-2015 Development Agenda. The SDGs build on the Millennium Development Goals, the global agenda that was pursued from 2000 to 2015, and will guide global action on sustainable development until 2030 [21].
In Section 2, we discuss the concepts of creative industries, sustainability, and local governments. Section 3 contains a description of our research approach and the research sample. In Section 4, we present the research findings from the empirical study, which we conducted in Polish counties. In Section 5, we propose a conceptual model for measuring the contribution of local governments in supporting creative industries and describe its possible application in counties (regions). The last section of the paper sums up the research findings, discusses potential study limitations, and presents limitations of the study.
2. Creative Industries, Sustainability, and Local Governments
The rapid increase of creative industries makes them an important focus for economic studies, including regional economic development, but so far, not many regional studies on sustainable development have been conducted [18,22]. The United Nations’ SDG Fund runs a number of initiatives to bring creative industries leaders to the forefront of sustainable development [12,16]. When the creative sector becomes part of an overall development and growth strategy, it can contribute to the revitalization of the national economy, where hybrid and dynamic economic and cultural exchanges take place [15,23]. Investing in culture, social capital, and creative industries as drivers of social development can also lead to results that contribute to the overall wellbeing of communities, individual self-esteem and quality of life, dialogue, and cohesion [24].
Sustainability is defined here as a means of meeting our needs today without compromising the ability of future generations to meet their own needs [25]. Those future needs may be endangered by the exploitation of natural resources (including fossil fuels). There is also another danger to economic growth, especially at a local level: running out of ideas. Every year brings new challenges, and we are not able to envisage the answers to all those ideas ahead of us. What we can do, however, is to prepare future generations by equipping them with an environment that will support the creation of new ideas and solutions. Here, we refer to sustainability not only as a concept for preserving the planet’s environmental assets, but also caring for the preservation of creative potential. The original use of the term “sustainable development” was intended to place a higher priority on directly meeting human needs, while considering environmental and ecological implications of development [26,27,28]. The creative industries link traditional knowledge to the ultimate consumer in their capacity to serve both cultural and economic objectives [15,29]. In this regard, the cultural and creative industries can be seen as consistent with the sustainable development paradigm [18]. According to Satterthwaite [27,30], governance structures play a vital role in decision-making processes and implementing appropriate measures. Creative industries require blended technical and creative skills, collaborative interdisciplinary working, entrepreneurialism, and enterprise [31,32]. It is human creativity that drives the success of this sector [10].
The support for regional growth can be prioritized through various measures applied by the local government. Local government could increase the support offered to businesses to protect and exploit intellectual property, but in many countries, including Poland, it is the competence of the central government. Local governments can, however, implement supportive measures. For example, Bazalgette [10] proposes the Creative Clusters Fund, which aims to protect and manage intellectual property (IP). Another important role of local government is matching private and public investment, which will deliver a ‘ladder of growth’ [10] to the local economy. According to the United Nations Educational, Scientific, and Cultural Organization (UNESCO), policies are important for fostering growth of culture and creative industries in support of inclusive development, and partnerships and international cooperation are an essential complement [30]. Local governments can be also active in the field of co-financing project with the private investors.
The highly diversified sector of creative industries is an important element of the Polish economy, which has an ambition to catch-up with the most industrialised countries in the world, but it requires particular concern and care for its development [24,25,26,27,28,30,32,33,34,35,36]. According to the European Commission statistics, the sector of cultural and creative industries in countries such as, among others, Poland, the Czech Republic, Hungary, or Slovakia, produces on average 2% GDP altogether [34]. The macroeconomic context of Poland is an important factor that brought our attention to the position of local governments in supporting the development of creative industries. The Polish economy has been growing steadily over the last three decades since the first democratic elections in the Eastern Bloc, which were held in Poland in 1989. Poland’s annual GDP growth rate mostly stayed between 3% and 7% from 1993 to 2018. One of the main drivers of growth was the low labour costs. In 2019, Poland’s purchasing power parity basis per capita income reached $27,000 per person, which is about the same as Portugal. The continuation of economic growth requires investments in high value-added sectors, including the creative industries. Poland is looking for new drivers of sustainable economic growth. According to the World Bank estimates, only 13 of 101 middle-income economies in 1960 had become high-income economies by 2008 [37]. The so-called ‘middle-income trap’ is frequently mentioned in Poland as a threat to economic prosperity. According to the Polish law, local governments are not obliged to release annual reports on their performance in the field of sustainable development. It has to be noted that sustainable development is not a synonym for fast economic growth. The effect of higher preference for intellectual capital compared with material capital may appear with a time lag and appear in such economic factors as a structure of employment and structure of GDP.
Currently in the world, many different city, country, and regional rankings are being used to present various kinds of information about sustainable development and corporate social responsibility (CSR) [21,38,39,40,41,42,43,44,45,46]. However, these rankings concentrate on the NTS-3 level or higher, or exclusively on metropolitan areas. Their main focus is not, however, on the sustainability of the local creative industries.
3. The Research Approach
The general perspective for our research approach was defined by the necessity to direct the attention of decision makers towards the role of public administration in sustaining economic growth in middle-income countries such as Poland. Our specific research goal was to discover the possible relationships between higher-level indicators of the creative economy at the local level and the actions and attitudes of local governments. On the basis of those relationships, we envisaged to propose a conceptual model for local governments. Local governments, especially in larger cities, dispose of substantial budgets for stimulating local economic development. It would be wise to provide them with direction and highlight opportunities for more efficient investments of public funds into sustainable development. The funds could also be channelled to support preconditions for the development of creative industries. As the outputs of the creative industries are associated with the ability of people to think creatively or metaphorically, to challenge conventionalists and to call for symbolic and affective communication [47], we believe that the emotional and social aspects of the local environment’s interventions play a crucial role in determining the proliferation of creativity at the local level. In our research, we aimed to utilise the empirical results from our study conducted in 2017 concerning Polish counties in the form of a conceptual model. The research sample consisted of 826 responses obtained from the representatives of 80% of Polish counties. There were two main reasons for choosing to research the NTS-4 units (counties) rather than regions (NTS-2) or sub regions (NTS-3):
- Scarcity of data on NTS-4 units. Many national and European Union (EU) statistics limit their scope of research on the creative industries to regions neglecting smaller entities.
- Many predictions say that it will be the cities that will be the key players in economic development of the future (NTS-4 level includes cities and towns). Cities play an increasing role in overall economic development as 55% of the world’s population lives in urban areas, a proportion that is expected to increase to 68% by 2050 [48]. There are 39 large and middle-sized towns with population 100,000+ inhabitants in Poland. Creative economies are predominantly concentrated in towns, cities, and metropolitan areas (which correspond with the county NTS-4 level in regional development analysis), and consequently their development heavily depends on the scale of support from the local governments.
In Poland, public administration is divided into central government structures and local government structures. The local government administration includes inter alia counties and cities that function as and have the tasks of counties. A county always covers a few municipalities (smaller territorial units, gmina in Polish) and does not necessarily have to be a city. In Poland, every county is comprised of several communes (gminas). Efficient cooperation between the authorities of the county and the authorities of the communes is crucial for sustainable development. Simultaneously, big cities (owing to their significant area and population) may constitute a local government unit in their own right, enjoying the rights of a county. The authors are of the opinion that sustainable development of a county that is not a city and sustainable development of cities enjoying the rights of a county can be measured using the same model.
In the years 2014–2015, we conducted exploratory research in the form of in-depth interviews with representatives of 105 Polish counties. They included councilors and mid-level administrative staff from county offices. Our research was conducted for a problem that has not been studied more clearly, intended to establish priorities, develop operational definitions, and improve the final research design. Interviews concerned on the role of intellectual capital and the other drivers of development of Polish counties. Another field of research was hindrances to sustainable development. Exploratory research helps determine the best research design, data-collection method, and selection of subjects. The exploratory research allowed us to fine-tune the research questions (RQ) for the main national research.
Afterwards, we launched the national survey, aiming to reach the representatives of all 380 Polish counties (including 69 Polish cities and towns). The recruitment process for the online survey was conducted by means of sending a total of 7000 e-mail requests to potential participants of the study. We used several databases and the websites of individual counties to identify prospective informants. Over half of the participants of the survey (52.9%) were employees of municipalities. The remainder were experts on local governments, including scholars. Nearly one-quarter of the respondents (23.5%) were from the eastern macro-region (NTS-3), 20.2% from the north-west macro-region, 15.9% from the southern macro-region, 16.1% from the north macro-region, and 7.7% from the southwestern macro-region (which is the smallest macro-region of Poland in terms of population). The highest response rate of the counties came from the Warmińsko-Mazurskie region of −95.2% and Podlaskie region of −94.1%. The smallest response rate was achieved from the Lubuskie region (64.3% of all counties).
The research consisted of four parts. In the first part, we evaluated the current state of sustainable development in Polish cities. Among the different factors related to the sustainable development, both positive and negative factors were identified. We also analysed the quality of leadership in the counties. The research also looked at the future prospects of sustainable development in the counties, based on the opinions of respondents.
On the basis of our exploratory research, we postulated the following research questions, which will be discussed in Section 4.1, Section 4.2, Section 4.3 and Section 4.4:
- Research Question 1 (RQ 1). What were the drivers of sustainable development in county local governments in the past, as well as what will be the drivers in the future?
- Research Question 2 (RQ 2). What were the hindrances to sustainable development in the economies in the past?
- Research Question 3 (RQ 3). What was the role of the business climate and the conditions for the development of a creative economy?
- Research Question 4 (RQ 4). What was the role of public management in counties (including the business climate and climate for the creative class, as well as the quality of local leadership in counties)?
- Research Question 5 (RQ 5). Which elements of intellectual/human capital as a driver of sustainable development in counties played the most important role?
The ranking factors will be based on the above-mentioned research findings. The highest positions will be assigned to those factors that have the highest values. Thus, the most important factors for sustainable development in counties will be identified.
While developing the model of sustainable development measurement for counties, we drew heavily on existing models of intangible asset measurement. Specifically, we took under consideration the renowned balanced scorecard model (BSC) [49,50,51,52,53,54,55,56,57] and concept of the intellectual capital statement (InCaS) [58,59,60,61,62,63,64].
Although research focusing explicitly on sustainable development is not an entirely new field, there does not exist a substantial body of work that combines economic growth models with sustainability issues and the creative economies perspective. Our model was developed based on the empirical results gleaned from a survey among the representatives of 80% Polish counties (826 respondents).
On the basis of the research findings, a model for the sustainable development of a county will be proposed (in Section 5). We believe that our model may contribute to strengthening the environmental, economic, and social dimensions of sustainable development in county local governments, as proposed by the United Nations.
The model proposed by the authors will make it possible to make local level comparisons between smaller administrative units across the world. The model offers an opportunity to create a global context for information about the sustainable development and intellectual capital (IC) in counties.
4. Research Findings
4.1. Drivers and Hindrances for Sustainable Development in County Local Governments
On the basis of the world’s literature review, a series of 105 interviews with experts, and the online survey on sustainable development in county local governments, we identified the following 15 factors (FC1–FC15) related to sustainable development.
Table 1 illustrates the list of factors that were especially important for the development of the analysed counties in the last 10 years (2005–2014) and those factors that will, according to the participants of the study, be the most important in the next 10 years (2016–2025). A ranking of factors is also included in the table.

Table 1.
Drivers for sustainable development of county in the past (2005–2014) and future (2015–2020).
FC1 remained the most important factor in the case of both past and future perspectives. Surprisingly, FC2 lost its position in the ranking, falling from 2 to 5. FC7 may be of a twofold nature. Firstly, the fast expansion of the Polish road system allows for higher mobility of people in many parts of Poland, which used to be excluded from easy access to main economic centres. Another explanation may be the growth of service industries, which is supported by online services and communication.
Nonetheless, the top three most important factors of sustainable development of counties in the future are as follows: ‘engagement of local authorities’ (FC1 = 45.9%); ‘good accessibility by airplane, train, and road’ (FC3 = 41.4%); and ‘well-developed SMEs (small to medium-sized enterprise) sector’ (FC5 = 35.4%).
The following positions relating to the future were occupied: “existence attractions drawing in the visitors” (FC4 = 33.5%), “green environment” (FC2 = 33.1%), “commitment and passion of local leaders” (FC9 = 29.2%), and “quality of the local system of education (system of primary, secondary, and tertiary education” (FC6 = 27.8%). The results reveal that FC9 in the past perspective occupied the remote 9th position, but in the future perspective, it took the higher 6th place. Thus, FC9 appeared to be more important for the future development compared with the past.
The position of the majority of factors was unchanged (e.g., FC4, FC11, FC13), or only slightly changed (e.g., FC14). The least important factors both in the past and in the future were the following: FC7, FC11, FC13, FC14, and FC15. The results obtained allow to state that most of representatives of the counties expect that the factors of development of the counties that were important in the past would also be important in the future. Only some of them see the change of importance of factors conducive for sustainable development in the future.
In a like manner, ten factors hindering (FH1–FH10) sustainable development in county local governments were identified. Table 2 includes the list of factors with the strongest negative impact on sustainable development in the Polish counties in the 10 years prior to the survey (2005–2014). A ranking of factors is also included in the table.
Table 2.
Hindrances for sustainable development of county in the past (2005–2014).
According to the participants of the study, the top five factors hindering sustainable development in the past were FH1–FH5. All of them can be considered creative economy-related factors. For example, tolerance and homophobia are explicitly mentioned in the 3T model of creative economy developed by Florida [5,6]. According to the participants of the study, the following factors were least impactful for sustainable development: FH8, FH9, and FH10. The results show that, in the counties, only rarely were talent migration to other countries and social exclusion the important factors hindering the sustainable development. In the case of those counties, it is necessary to change the priorities of local public management in order to retain talented citizens and improve the social situation of the poorest people.
Table 2 reveals that the most important factor hindering the sustainable development of a county is a poor quality of environment.
Table 2 reveals a real problem with the environment and puts great importance on regulations that ensure improvement of the environment. As it appears, the natural environment plays a key role in the opinions of the participants of the study. The high priority attached to the natural environment reflects favourable conditions in Polish counties for energy transition policy, which is a challenge for the Polish economy (in 2017, Poland’s greenhouse gas emissions increased by 4 % compared with 2016). According to the Agora Energiewende experts between 2020 and 2035, about 60 power plants constructed in the 1970s are expected to retire. This accounts for more than 50 percent of currently installed capacity. It presents a major modernization and investment challenge that is discussed against the backdrop of concerns about energy supply security, clean air—particularly in cities—climate change, and rapidly declining costs for renewable energy. Thus, Poland aims to gradually increase renewable energies like solar, wind, and hydroelectric power. Local governments are now involved in the recently launched programme by the Polish government “Mój Prąd” (My energy), distributing government subsidies for the purchase of PV panels [65].
Resentment towards strangers is the second most important factor hindering the sustainable development of a county. It displays problems with accepting people coming from other regions of a country by citizens of the county. The abovementioned factor means that, very often, entrepreneurs as well as employees from other counties face some more difficulties than the local citizens of the county.
4.2. Evaluation of the Local Business Climate and Conditions for the Development of Creative Economy
On the basis of the main themes recurring in the literature on creative economy development, one can identify some factors that describe the strength and vitality of a creative economy. They would include overall tolerance and a variety of freedoms, for example, freedom of speech, political freedom, education and skills of local citizens, well-developed knowledge-intensive services, entrepreneurship, efficient institutions and public administration, and others. In our survey, the respondents were asked to evaluate the following six propositions (business climate and creative class (BC1–BC6).
Table 3 presents the distribution of answers related to entrepreneurship and creative economy. A ranking of factors is also included in the table. The highest positions in the ranking are occupied by the results that obtained the highest number of the ‘Strongly agree’ and ‘Agree’ answers.
Table 3.
Business climate and climate for creative class (BC).
The respondents indicated the following factors as the most impactful for sustainable development of the county in the future:
- A climate conducive for success-driven, creative businesspersons (BC1 = 66.7%);
- Friendliness of local government to entrepreneurs (BC2 = 65.6%);
- Opportunities for talent development for well-educated and creative citizens (BC3 = 59.4%).
Over 46% of respondents are of the opinion that all entrepreneurs get equal opportunities for success in their own county (BC5 = 46.4%). Over 22% of respondents are of the opinion that talented and creative people will emigrate from their county/municipality in search for better opportunities (BC6). At the same time, however, over 68% of respondents are of the opinion that talented and creative people will not emigrate (BC6). Only 17.6% of the respondents believe that foreign entrepreneurs willing to start a business in the municipality or county could not encounter obstacles and hostility (BC4).
4.3. The Quality of Public Management in Counties
In the following section of our survey, we asked about those factors that, according to the respondents, would spur economic growth in their county in the future by means of increased financial investments and non-financial interventions. Possible areas of intervention included the two following groups of factors (IP) (see Table 4):
Table 4.
Investment priorities for the future (IP).
- Directly involving financial expenditure, for example, hard infrastructure (road, water resources), public transport, healthcare, public security, pre-school education, and cultural institutions.
- Requiring organizational support or changing the directions of intervention, for example, marketing of the county as a site for home and foreign investment.
The results show that the most preferred areas of intervention in the future are the following:
- “Preventing brain drain” (investment perspective (IP)1 = 45.3%);
- “Hard infrastructure (road, water resources)” (IP2 = 43.5%);
- “Marketing of the county as a site for home and foreign investment” (IP3 = 43.2%);
- “Vocational education” (IP4 = 34.6%);
- “Support for grass-roots initiatives of citizens” (IP5 = 32.2%).
The areas that require the highest financial investments include the following: “Hard infrastructure” (IP2 = 43.5%), “Vocational education” (IP4 = 34.6%), “Public transport” (IP7 = 27.8%), “Healthcare” (IP8 = 27.7%), “Pre-school education” (IP9 = 24.3%), ”Tourist infrastructure” (IP10 = 22.9%), “Municipal administration and environmental protection” (IP15 = 14.4%), and “Public security” (IP16 = 13.8%).
The non-financial interventions are the following: “Preventing brain drain” (IP1 = 45.3%), “Marketing of the county” (IP3 = 43.2%), “Support for grass-roots initiatives of citizens” (IP5 = 32.2%), “Development of civic society” (IP6 = 31.2%), “Marketing of the county as a tourist destination” (IP11 = 20%), “Support for talented students” (IP12 = 19.2%), and “Cooperation with other local-government offices” (IP13 = 17.7%).
Those factors that are directly related to the creative economy—such as “Sports and cultural events” (IP14); “Cultural institutions” (IP17); “Increase of Internet accessibility” (IP19); or “Countermeasures for intolerance, racism, homophobia” (IP21)—are not preferred areas of intervention. IP21 describes extremely negative attitudes, especially towards foreigners or homosexual people. On the basis of our research results, we conclude that such attitudes and behaviours do not pose a serious problem. IP21 should not be associated with resentment towards strangers. In this case, “strangers” include inhabitants of other counties and other regions, as well as foreigners. Resentment manifests itself in lower propensity to collaborate and lower trust. It is a passive attitude, whereas IP21 is an active attitude. “Development of civic society” (31.2%) may be one of the measures aimed at the reduction of resentment towards strangers.
Another aspect of sustainable development that was subject to our research was the quality of local leadership. Good quality leadership is considered one of the key attributes of effective organisations. The quality of leadership may also explain the differences in the rate of growth among counties. The participants of our survey were requested to evaluate the quality of leadership in 12 factors (QL1–QL12) characterising the local leader (the city mayor or district foreman (starosta)). The highest values were attributed to the following factors:
- The city mayor/district foreman (starosta) supports the cooperation between the local government and NGOs (non-government organization) (QL1 = 63.0%);
- The city mayor/district foreman (starosta) cooperates with other counties (QL2 = 64.5%);
- The city mayor/district foreman (starosta) efficiently cooperates with the communes belonging to the county (QL3 = 61.8%);
- The city mayor/district foreman (starosta) cares about entrepreneurship (QL4 = 59.3%);
- The city mayor/district foreman (starosta) well represents the county on national level (QL5 = 59.1%);
- The city mayor/district foreman (starosta) is a competent leader (QL6 = 57.5%).
Slightly more than 31.0% of respondents expressed negative opinions about the leader who was holding the position of the city mayor/district foreman (starosta). A total of 32.3% of respondents were of the opinion that the leader favours some interest groups, and 31.2% of respondents agreed with the statement that the leader avoids making important for the country decisions.
Table 5 presents the opinions of the respondents regarding the local leader who was serving his/her tenure in 2015.
Table 5.
The quality of local leadership in counties (QL).
4.4. Intellectual/Human Capital as a Driver of Sustainable Development in Counties
It is generally agreed that intellectual/human capital (IC/HC) has a stronger positive impact on the pace of development of public entities than material assets [35,37,49,60,61,62,63,64]. In order to verify this popularly expressed in the literature conviction, we were interested in the identification of those factors that could have a positive impact on the development of a county. We divided those factors into two groups. One was related to intangible/intellectual capital, and the other to immaterial/traditional/”brick-and-mortar” factors. We were interested in the actual perception of the relative importance of the two groups of factors. Do IC-related factors indeed play a more important role in sustainable development in the 21st century than the old-economy factors? The group of IC/HC-related factors included the following:
- Engagement of local authorities;
- Well-developed system of education;
- Commitment and enthusiasm of local leaders;
- Civic engagement;
- Quality and quantity of the cultural offers;
- Well-educated citizens;
- Competent municipal staff;
- R&D activities in the county.
Contrary to our expectations, the research findings did not reveal the prevailing role of intangible assets in the sustainable development of Polish counties. Only 5% of respondents, who could be dubbed “IC/HC proponents”, placed 100% of their indications on IC/HC-related factors. Further, 50% of the respondents mentioned not more than 40% of IC-related factors among their top-five most important factors for sustainable development.
The aim of the analysis was to verify the following two hypotheses:
Hypothesis 1 (H1).
If the authorities of a county give higher priority to the IC/HC development than to material infrastructure, the county achieves higher long-term results in its socio-economic development.
Hypothesis 2 (H2).
Investments in IC/HC are more profitable to the county than investments in the material infrastructure.
In order to test the H1 hypothesis, a correlation analysis between the set of indices calculated for the variables related to the socio-economic development of counties in the long period (2015 vs. 2006) and the indices for the preference of IC/HC was conducted. The data on socioeconomic development were obtained from Bank of Local Data (BDL) of the Polish Statistical Office (GUS). The indicators for the preference of IC/HC were based on our survey’s results.
We selected the following indices calculated on the basis of the available statistical data on Polish counties:
- Number of registered companies;
- Unemployment rate (%);
- Average gross monthly salary (PLN);
- Population;
- Change in GDP per capita (PLN);
- Migration balance between counties (2006–2015) versus population in 2015.
In the case of three variables—number of registered companies, average gross monthly salary, and change in GDP per capita—the Pearson correlation coefficient, which is the measure of the linear correlation, was very low and indicated no correlation with the IC/HC-preference index in counties.
In the case of the unemployment index, a positive moderate relationship was observed with the IC/HC-preference index (r = 0.510), which means that the higher preferences for IC/HC, the higher the value of the unemployment rate. The relationship between these variables may be bi-directional or indirect relationship may even occur. It is possible that the analysed period is too short to find the positive impact of IC/HC on the labour market. The higher preference in the county for IC/HC may result also from insufficient material infrastructure and insufficient funds to change the situation in these areas.
The indices of population of counties and the migration balance between counties (2006–2015) versus population in 2015 reveal a moderate negative relationship with the IC/HC-preference index in counties (the Pearson correlation coefficient amounts to −0.429 and −0.672, respectively), which means that, as the preference for IC/HC increases, the dynamics of growth in population in counties decreased, and additionally, the cumulative balance of cross-county migrations (2006–2015) decreased in relation to the total population in the county in 2015. It is worth emphasising that the higher the IC/HC-preference, index the lower the preference for material infrastructure.
Our findings reveal that those counties that prefer material infrastructure investments to IC/HC-related investments (based on our survey) achieve better long-term results in socio-economic development (on the basis of statistical data from the Polish Statistical Office (GUS)). As a positive relationship was expected, Hypothesis H1 is thus rejected.
In order to verify the Hypothesis H2, a correlation analysis between the IC-preference indicator (based on the survey results) and the variable describing the dynamics of changes in the period 2006–2015 and the per capita budget income in a county in 2015 achieved by counties (add communes belonging to them) and city-counties (derived from the Polish Statistical Office) was conducted. Hypothesis H2 stated that investments in IC/HC are more profitable to the county than investments in the material infrastructure. The budget revenues index per capita in a county in the period 2006–2015 does not reveal a relationship with the IC/HC-preference index in counties (r = −0.048). The results indicate that higher preferences for IC/HC do not result in higher long-term dynamics of budgetary incomes for counties in the years 2006–2015. On the contrary, the budgetary income per capita in counties in 2015 reveals a strong negative relationship with the IC/HC-preference index (r = –0.711). The higher the preference for IC/HC, the lower the budgetary income for counties and city-counties (including the communes belonging to the county) in 2015. The results report a negative relationship. Thus, Hypothesis H2 is also rejected. One of the possible explanations for the rejection of H2 is the fact that the economic situation of a county is the result of interaction of a number of different factors, which vary in importance in different locations, and is the combined effect of processes at regional, national, and international level. Many counties benefit from public investments from regional and central government funds, which may have a substantial impact on the overall economic situation of a county. Many of those investments are determined by the geographical location of a county. The rejection of H2 may be explained by lower relative importance of IC/HC in shaping the income of the county compared with other factors.
The factors that were the most important in explaining the prospects for future development of a county in the years 2016–2025 include the following: “engagement of local authorities”, “transport accessibility”, “large number of SMEs”, “tourist attractions in the county”, and “good quality of the natural environment”. The share of respondents who indicated those factors ranged from 33.1% to 45.9%. The set of the top five most important determinants of sustainable development in counties for the future was identical with the set of indicators for the years 2005–2014. However, there was a difference in the hierarchy of those factors and the share of respondents indicating the following factors: “engagement of local authorities” (increase by 7.3 points), “large number of SMEs” (increase by 5.9 points), and “transport accessibility” (increase by 4.4 points). In the case of the two remaining factors, the share of respondents who indicated them was lower by −0.6 and −5.1 points.
5. A Conceptual Model for Sustainable Development in Counties
The conceptual model presented further in the text is based on the review of world literature, and our empirical findings from a survey conducted in Polish counties in 2017. The model emphasises the need for looking at creativity as a (potentially) sustainable resource to be cared for and looked after by the local government. The application of our model offers the following opportunities for local governments:
- Developing benchmarking scorecards for comparing local government units using a set collection of metrics. This can be applied to measure the performance of a local government and compare it to that of other local governments over time. Such an approach will often include looking at the practice behind individual metrics as well. Local governments will be able to define “good practices” for specific metrics and compare them to their own approaches and practices.
- Answering the needs of increasingly environment-concerned citizens who expect from municipalities greater engagement in the climate issues.
- Supporting cooperation between municipalities regarding sustainable development, including international cooperation and cross-border cooperation.
- Aligning local strategies for development with the global priorities, including the Sustainable Development Goals as described by the UN [17].
While developing a conceptual model for measurement of the balanced development, we drew on the concept of the balanced scorecard (BSC) developed by Norton and Kaplan [50,52,53]. The first publication on using indicators in management practice should be attributed to Drucker [51]. In a similar vein, we argue that, for the purpose of a sustainable economy, public entities should use certain variations of scorecards. We believe that our model is an applicable and relevant concept in strategic management of counties because any local government can use it. The original concept of the BSC was adapted for non-profit and municipal entities. Today, in Poland, a wide variety of non-for profit and for-profit organisations use it.
The core elements of the BSC by Norton and Kaplan are four perspectives [50,52,53,54,55,56,57]:
- The financial perspective, which concentrates on such issues as cost savings and efficiencies, profit margins, and revenue sources;
- The customer perspective, which concentrates on such issues as customer service and satisfaction, brand awareness, and market share;
- The internal process perspective, which concentrates on such issues as process improvements or quality optimisation;
- The learning and growth perspective, which concentrates on such issues as IC (HC—talent, skills, and knowledge and organisational capital (OC)—culture, information assets, employee alignment, leadership, knowledge management, and teamwork).
On the basis of the literature review and the research findings presented in Section 4.1, Section 4.2, Section 4.3 and Section 4.4, we developed a conceptual model for counties. Our conceptual model consists of four perspectives important for the development of counties and highlights the factors that are of importance for sustainable development:
- The citizens’ perspective, including the quality of local leadership in counties and responsiveness to the citizens’ needs in the past and the future. This perspective refers to the FC factors in Table 1.
- Business climate and creative class perspective, including the financial and non-financial incentives for companies and for the creative class in the past and the future. We consider talented citizens as a special sub-category of citizens in a county, which is a crucial part of the local workforce. This perspective refers to the BC factors in Table 3.
- Investment perspective, including financial and non-financial investments of the county in the past and the future. This perspective refers to the IP factors in Table 4.
- The good governance perspective, including management competences of public administration in the past and the future, implementation of management models, and quality assurance. This perspective refers to the QL factors in Table 5.
Vision and mission are the starting point for strategic planning and corporate objectives. For each of the perspectives a set of strategic objectives, indicators and measurement units related to the vision and mission statement should be developed. They have to be well balanced, which means that none of the perspectives dominates over the other three. The balanced scorecard includes both tangible and intangible elements of the total assets of an organisation. According to the philosophy of the BSC, attention is focused on what is achieved and not how it is achieved. The balanced view of the organisation means that both qualitative and quantitative results are reviewed [50,52,53,54,55,56,57].
In our model, we applied the philosophy for the purpose of local government management as presented in Figure 1.
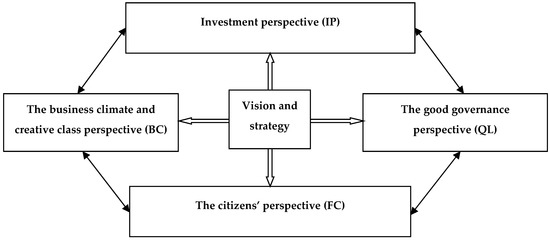
Figure 1.
A sustainable development model for counties. Source: authors.
Our model examines the four perspectives of creative economy development:
- Positive factors for sustainable development (FC);
- Business climate and climate for talented citizens in counties (BC);
- Financial investment into tangible and intangible assets in the future (IP);
- The quality of local leadership in counties (QL).
The model draws heavily on the previous work done by a number of researchers, who have looked more closely at patterns in the use of the BSC in practice [66]. We made an assumption that the vision and strategy statements have an impact on each of the four management perspectives in the BSC. We did, however, analyze the relationships between the four perspectives.
In order to adapt the BSC concept to the context of sustainable development, we also applied the intellectual capital statement (InCaS) approach [59,60,61,62,63]. The InCaS consists of five stages that can be adopted for the purpose of sustainable development measurement.
Figure 2 presents the stages of the balanced development model for counties based on the intellectual capital measurement concept according to InCaS. In our opinion, following the InCaS procedure enables an efficient implementation of our conceptual model in counties (regions). The management of a municipality should consider the following steps:
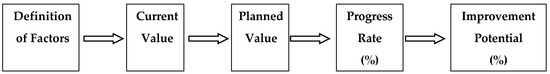
Figure 2.
The stages of the balanced development model for counties based on the intellectual capital statement (InCaS). Source: authors.
- (1)
- define the most important factors for sustainable development of a county (region);
- (2)
- establish the current value for each factor;
- (3)
- estimate the planned value;
- (4)
- propose the expected progress rate (%);
- (5)
- establish the improvement potential (%) (100% minus progress rate).
Our model of balanced development of creative economy consists of four perspectives, and a number of indicators and measurement units related to the vision and mission statement should be developed and attributed to each of them. We selected the most important factors, which were identified based on our empirical study described in Section 4.1, Section 4.2, Section 4.3 and Section 4.4.
Table 6 presents the proposed indicators or measurement units for a sustainable development model in counties.
Table 6.
Proposed indicators or measurement units for the sustainable development model in counties.
The conceptual model presented here may be adjusted to the local context of each individual county. As new technologies, concepts of sustainable development, and methods of production emerge (e.g., artificial intelligence, zero-emission cities, sharing economy), the indices describing each of the perspectives should evolve. As a matter of fact, the selection of indicators is by itself a strategic decision. Regular measurement and reporting of the selected indicators will keep the local government focused. The data needed to implement the model may be collected from the following:
- General statistical information released on regular basis by the National Statistical Office;
- Local surveys conducted by county staff among local organizations;
- Content and sentiment analysis on online social networks;
- Surveys commissioned by the county administration.
6. Conclusions
We based our research on the assumption that, although knowledge is strongly associated with creativity, the conditions and environments supporting creativity are similar, but not equal. Support for the creative industries deserves more attention from the policy-makers and local authorities. On the basis of our findings, we proposed a new model for measuring the efficiency of local governments in supporting creative industries locally.
In our research, we analysed the relative importance of the factors that were potentially important for the development of counties in the past and in the future. Engagement of local authorities remained the most important factor in the case of both past and future perspectives. Another important factor was the proximity of a metropolitan area. Generally speaking, most of the representatives of the counties expect that the factors of development of the counties that were important in the past would also be important in the future. According to the participants of the study, the top five factors hindering sustainable development in the past were as follows: poor quality of environment, resentment towards strangers, lack of tourist attractions, poor quality or insufficient provision of higher education, and low access to cultural goods and institutions. The respondents indicated the following factors as the most impactful for sustainable development of the county in the future: (a) a climate conducive for success-driven, creative businesspersons; (b) friendliness of local government to entrepreneurs; and (c) opportunities for talent development for well-educated and creative citizens. The factors that would spur economic growth in their county in the future by means of increased financial investments and non-financial interventions included the following: preventing brain drain, good quality of hard infrastructure, marketing of the county as a site for home and foreign investment, vocational education, and support for grass-roots initiatives of citizens. Those factors that are directly related to the creative economy—such as sports and cultural events; cultural institutions; increase of Internet accessibility; or countermeasures for intolerance, racism, and homophobia—are not preferred areas of intervention. This may be explained by a low level of economic development in many Polish counties, where lower-level needs of citizens play a more important role compared with the higher-level needs. Resentment towards strangers is the second most important factor hindering the sustainable development of a county. It displays problems with accepting people coming from other regions of a country by citizens of the county.
Good quality leadership is considered one of the key attributes of effective organisations. The highest values were attributed to the following factors: (a) the city mayor/district foreman (starosta) supports the cooperation between the local government and NGOs; (b) the city mayor/district foreman (starosta) cooperates with other counties, and (c) the city mayor/district foreman (starosta) efficiently cooperates with the communes belonging to the county.
On the basis of the results from 826 Polish counties, a new model for the sustainable development of a county was proposed. It is based on the balanced scorecard model (BSC) and the concept of the intellectual capital statement (InCaS). Although the conceptual model was developed in Poland, it was based on the review of world literature on the topic and offers opportunities for application in other countries as well. The possible directions of future research are related to developing an international clearing house for statistical data related to sustainable development at local government levels. As the global economy becomes more and more dominated by metropolitan areas, so should follow the initiatives to collect statistical data. Local governments should take a more holistic view while developing their strategies and key performance indicators. The concept of sustainability in a knowledge-based economy should be extended to include social aspects of economic development related to tolerance, climate for doing business, social capital, and local leadership, which are also very important for the growth of local creative industries. Every local government is a facilitator of change, an employer, and a purchaser of goods and services, so it should be looked upon as an important element of the local creative economy.
Although research focusing explicitly on sustainable development is not an entirely new field, there does not exist a substantial body of work on combining economic growth models with sustainability issues and the creative economies perspective. In our paper, we aimed to combine the creative industries perspective with the challenges of the sustainable economy and the local governments’ perspective.
Our research has certain limitations. Further research should aim to analyze the relationships between the four key areas. Therefore, our model provides a basis for further studies combining sustainable development and creative economy regarding the role of local governments in supporting creative industries. The limitations of this research derive from the fact that the research was conducted only on a national sample of Polish counties. Similar research studies conducted in other countries should be able to provide more reliable conclusions.
The model proposed by the authors will enable local level comparisons between smaller administrative units across the world. The model offers an opportunity to create a global context for information about the sustainable development and intellectual capital in counties. The model can be further developed by analyzing the horizontal relationships between the four main perspectives.
Author Contributions
This paper is the output from the dissertation on which both authors have worked (conceptualization, methodology, validation, formal analysis, investigation, resources, data curation, writing—original draft preparation, writing-review and editing and visualization: E.I.S. and J.F.). All authors have read and agreed to the published version of the manuscript.
Funding
This paper was funded by Polish National Science Centre (grant number: 2013/09/B/HS4/00476; “Kapitał intelektualny powiatów polskich” (Intellectual Capital of Polish County Counties). The project is carried out by the University of Economics and Business in Poznań.
Conflicts of Interest
The authors declare no conflict of interest.
References
- Coyne, C.J.; Boettke, P. The Role of the Economist in Economic Development. Q. J. Aust. Econ. 2006, 9, 47–68. [Google Scholar] [CrossRef]
- Quah, D. The Weightless Economy in Economic Development; C.E.P.R. Discussion, Papers; LSE Economics Department, 1999; Available online: http://eprints.lse.ac.uk/2291/1/The_Weightless_Economy_in_Economic_Development.pdf (accessed on 20 September 2019).
- Lundvall, B.A. Knowledge Management in the Learning Economy; OECD: Paris, France, 2000. [Google Scholar]
- Rhodes, M. An Analysis of Creativity. Phi Delta Kappan 1961, 42, 305–310. [Google Scholar]
- Florida, R. Cities and the Creative Class; American Sociological Association: New York, NY, USA, 2003. [Google Scholar]
- Florida, R. The Rise of the Creative Class; Basic Books: New York, NY, USA, 2004. [Google Scholar]
- Howkins, J. The Creative Economy, 2nd ed.; Penguin: New York, NY, USA, 2013. [Google Scholar]
- Bakhshi, H.; Hargreaves, I.; Mateos-Garcia, J. A Manifesto for the Creative Economy; NESTA: London, UK, 2013. [Google Scholar]
- Burger-Helmchen, T. (Ed.) The Economics of Creativity: Ideas, Firms and Markets; Routledge: London, UK; New York, NY, USA, 2013. [Google Scholar]
- Bazalgette, P. Independent Review of the Creative Industries. 2017. Available online: https://assets.publishing.service.gov.uk/government/uploads/system/uploads/attachment_data/file/649980/Independent_Review_of_the_Creative_Industries.pdf (accessed on 20 September 2019).
- OECD. The Measurement of Scientific and Technological Activities: Guidelines for Collecting and Interpreting Innovation Data: Oslo Manual, 3rd ed.; Working Party of National Experts on Scientific and Technology Indicators: Paris, France, 2005. [Google Scholar]
- Howkins, J. The Creative Economy, How People Make Money from Ideas; Penguin Group: London, UK, 2001. [Google Scholar]
- Markusen, A.; Wassall, G.H.; DeNatale, D.; Cohen, R. Defining the Creative Economy: Industry and Occupational Approaches. Econ. Dev. Q. 2008, 22, 24–45. [Google Scholar] [CrossRef]
- Newbirgin, J. What Is the Creative Economy? Available online: https://creativeconomy.britishcouncil.org/guide/what-creative-economy/ (accessed on 20 September 2019).
- O’Connor, J. The Cultural and Creative Industries: A Literature Review, 2nd ed.; Creativity, Culture and Education Series; Creativity, Culture and Education: London, UK, 2010. [Google Scholar]
- United Nations. The Creative Economy Report; The United Nations Development Programme: New York, NY, USA, 2013. [Google Scholar]
- United Nations. Department of Economic and Social Affairs. 2018. Available online: https://www.un.org/development/desa/en/news/population/2018-revision-of-world-urbanization-prospects.html (accessed on 19 January 2019).
- UNCTAD. Creative Economy Outlook and Country Profiles: Trends in International Trade in Creative Industries. UNCTAD/WEB/DITC/TED/2016/5. 2015. Available online: https://unctad.org/en/pages/PublicationWebflyer.aspx?publicationid=2328, (accessed on 20 September 2019).
- Bloom, B.S.; Engelhart, M.D.; Furst, E.J.; Hill, W.H. Taxonomy of Educational Objectives: The Classification of Educational Goals. Handbook I: Cognitive Domain; David McKay Company: New York, NY, USA, 1956. [Google Scholar]
- Rocks, C. London’s Creative Industries—2017 Update; GLA Economics, Working Paper 89; 2017. Available online: https://www.london.gov.uk/sites/default/files/working_paper_89-creative-industries-2017.pdf (accessed on 20 September 2019).
- UCLG. The Sustainable Development Goals. In What Local Governments Need to Know; United Cities and Local Governments, World Secretariat Barcelona: Barcelona, Spain, 2019. [Google Scholar]
- Aghion, P.; Howitt, P. Endogenous Growth Theory; MIT Press: Cambridge, MA, USA, 1998. [Google Scholar]
- Yang, J.; Černevičiūtė, J. Cultural and Creative Industries (CCI) and sustainable development: China’s cultural industries clusters. Entrep. Sustain. Issues 2017, 5, 231–242. [Google Scholar] [CrossRef]
- Fazlagić, J.; Skikiewicz, R. Measuring sustainable development—The creative economy perspective. Int. J. Sustain. Dev. World Ecol. 2019, 26, 635–645. [Google Scholar] [CrossRef]
- Gorica, K.; Kripa, D.; Zenelaj, E. The Role of Local Government in Sustainable Development. Acta Univ. Danubius. Econ. 2012, 8, 139–155. [Google Scholar]
- Mongomery, A. What Should Government Do to Support the Creative Industries? DesignWeek. 2 January 2014. Available online: https://www.designweek.co.uk/issues/january-2014/what-should-government-do-to-support-the-creative-industries/ (accessed on 20 September 2019).
- Satterthwaite, D. The Role of Cities in Sustainable Development. In Sustainable Development Insights; 2010; pp. 1–8. Available online: https://www.bu.edu/pardee/files/2010/04/UNsdkp004fsingle.pdf (accessed on 20 September 2019).
- Wheeler, S.M. Constructing sustainable development/safeguarding our common future: Rethinking sustainable development. J. Am. Plan. Assoc. 2002, 68, 110–111. [Google Scholar]
- Public-Private Partnerships. In Culture and Creative Industries; UNESCO: London, UK, 2013; Available online: http://www.unesco.org/new/fileadmin/MULTIMEDIA/HQ/CLT/images/Bonapas_Onguglo_Hangzhou_Congress.pdf (accessed on 21 September 2019).
- Fazlagić, J.; Szczepankiewicz, E.I. Intellectual Capital Statement Model for Counties in Poland. Amfiteatru Econ. 2018, 20, 732–752. [Google Scholar] [CrossRef]
- Störmer, E.; Patscha, C.; Prendergast, J.; Daheim, C. The Future of Work Jobs and Skills in 2030; UK Commission for Employment and Skills: London, UK, 2014; Available online: www.ukces.org.uk (accessed on 20 September 2019).
- Strzelecka, E. The Creative Sector in Rural Areas in the Policy of Balanced Regional Development. Barom. Reg. 2016, 14, 15–21. [Google Scholar]
- Kasprzak, R. Creative Industries in The Polish Economy. Quaest. Geogr. 2015, 34, 35–43. [Google Scholar] [CrossRef]
- Wróblewski, L. The Influence of Creative Industries on the Socioeconomic Development of Regions in Poland. Int. J. Entrep. Knowl. Issue 2014, 2, 45–57. [Google Scholar] [CrossRef]
- Danish Government. Structural Monitoring—International Copenhagen; Danish Government: Copenhagen, Denmark, 2000. [Google Scholar]
- Agénor, P.R.; Canuto, O.; Jelenic, M. Avoiding Middle-Income Growth Traps. In Economic Premise; World Bank: Washington, DC, USA, 2012; Volume 98, Available online: http://documents.worldbank.org/curated/en/422121468155111398/Avoiding-middle-income-growth-traps (accessed on 21 November 2019).
- Daley, J. The Intangible Economy and Australia. Aust. J. Manag. 2001, 26, 3–19. [Google Scholar] [CrossRef]
- Iammarino, S.; Rodríguez-Pose, A.; Storper, M. Why Regional Development Matters for Europe’s Economic Future; Working Papers WP 07/2017; Publications Office of the European Union: Luxembourg, 2017; Available online: https://ec.europa.eu/regional_policy/sources/docgener/work/201707_regional_development_matters.pdf (accessed on 21 September 2019).
- UNICAD. Creative Economy Report 2013. UNESCO, 2013. Available online: http://www.unesco.org/culture/pdf/creative-economy-report-2013.pdf (accessed on 21 September 2019).
- Dobbs, R.; Smit, S.; Remes, J.; Manyika, J.; Roxburgh, C.; Restrepo, A. Urban World: Mapping the Economic Power of Cities; McKinsey Global Institute: New York, NY, USA, 2010. [Google Scholar]
- Stelk, M. The Role of the Creative Economy in Sustainability Planning and Development; Muskie School Capstones, 2013; Available online: http://digitalcommons.usm.maine.edu/muskie_capstones/27 (accessed on 21 September 2019).
- The Civil Society Index (CSI). Available online: https://www.odi.org/publications/5389-mapping-political-context-civil-society-index (accessed on 26 June 2019).
- Berglund, T.; Gericke, N. Exploring the Role of the Economy in Young Adults’ Understanding of Sustainable Development. Sustainability 2018, 10, 2738. [Google Scholar] [CrossRef]
- Xiong, L.; Teng, C.-L.; Zhu, B.-W.; Tzeng, G.-H.; Huang, S.-L. Using the D-DANP-mV Model to Explore the Continuous System Improvement Strategy for Sustainable Development of Creative Communities. Int. J. Environ. Res. Public Health 2017, 14, 1309. [Google Scholar] [CrossRef] [PubMed]
- Standar, A.; Kozera, A. The Role of Local Finance in Overcoming Socioeconomic Inequalities in Polish Rural Areas. Sustainability 2019, 11, 5848. [Google Scholar] [CrossRef]
- Kim, D.; Lim, U. Social Enterprise as a Catalyst for Sustainable Local and Regional Development. Sustainability 2017, 9, 1427. [Google Scholar] [CrossRef]
- Mirza, M. Culture Vultures: Is UK Arts Policy Damaging the Arts; Policy Exchange: London, UK, 2006. [Google Scholar]
- Romer, P. Increasing Returns and Long-run Growth. J. Political Econ. 1986, 94, 1002–1037. [Google Scholar] [CrossRef]
- Fazlagić, J. Gospodarka Wiedzy. Problemy Jakości 2001, 2, 4–8. [Google Scholar]
- Kaplan, R.S.; Norton, D.P. The Balanced Scorecard—Measures That Drive Performance; Harvard Business Review: Brighton, MA, USA, 1992. [Google Scholar]
- Drucker, P. The Practice of Management; HarperCollins: New York, NY, USA, 1954. [Google Scholar]
- Kaplan, R.S.; Norton, D.P. The Balanced Scorecard: Translating Strategy into Action; Harvard Business School Press: Boston, MA, USA, 1996. [Google Scholar]
- Kaplan, R.S.; Norton, D.P. The Strategy—Focused Organization: How Balanced Scorecard Companies Thrive in the New Business Environment; Harvard Business School Press: Boston, MA, USA, 2000. [Google Scholar]
- Rampersad, H.D. Total Performance Scorecard: Een Speurtocht Naar Zelf Kennis en Competentie-Ontwikkeling van Lerende Organisaties; Scriptum Management: Chiedam, The Netherlands, 2002. [Google Scholar]
- Rampersad, H.D. Total Performance Scorecard: Reinventing Management to Achieve Performance with Integrity by Dr Hubert K. Rampersand; Scriptum Management: Chiedam, The Netherlands, 2004. [Google Scholar]
- Marciniak, M.; Krwawicz, M. Zrównoważona karta wyników jako narzędzie controllingu strategicznego. Controlling i Rachunkowość Zarządcza 2000, 7, 7–14. [Google Scholar]
- Horvath, P. Balanced Scorecard, Wie Sie Strategien erfolgreich umzetzen. Gablers Mag. 1998, 4, 22–24. [Google Scholar]
- Yeh-Yun Lin, C.; Edvinsson, L. National Intellectual Capital: Comparison of the Nordic Countries. J. Intellect. Cap. 2008, 9, 525–545. [Google Scholar] [CrossRef]
- InCaS. Intellectual Capital Statement—Made in Europe, European Intellectual Capital Statement Guideline Developed by the InCaS Consortium; European Commission: Brussels, Belgium, 2008. [Google Scholar]
- Szczepankiewicz, E.I. The Use of ICS Model for Estimating the Value of Intellectual Capital within an Organization. Management 2011, 2, 183–197. [Google Scholar]
- Szczepankiewicz, E.I. The use of ICS model for estimating the value of human capital in future-oriented organizations. Hum. Resour. Manag. Ergon. 2012, 6, 79–90. Available online: http://frcatel.fri.uniza.sk/hrme/files/2012/2012_1_07.pdf (accessed on 20 December 2012).
- Szczepankiewicz, E.I. The use of ICS model to identification and measuring of structural capital in small and medium enterprises. Management 2012, 2, 102–116. [Google Scholar]
- Szczepankiewicz, E.I. Concept of using the ICS model to identification, measuring and presenting relational capital of a network enterprises. Management 2013, 1, 136–153. [Google Scholar] [CrossRef]
- Vandenbussche, J.; Aghion, P.; Meghir, C. Growth, distance to frontier and composition of human capital. J. Econ. Growth 2006, 11, 97–127. [Google Scholar] [CrossRef]
- RAP. Report on the Polish Power System; Version 2.0 Study Commissioned by Agora Energiewende; Agora Energiewende: Berlin, Germany, 2018. [Google Scholar]
- Madsen, D.O.; Stenheim, T. The Balanced Scorecard: A Review of Five Research Areas. Am. J. Manag. 2015, 15, 24–41. [Google Scholar]


© 2020 by the authors. Licensee MDPI, Basel, Switzerland. This article is an open access article distributed under the terms and conditions of the Creative Commons Attribution (CC BY) license (http://creativecommons.org/licenses/by/4.0/).