1. Introduction
The issue of a fair income distribution has always been, and is at the heart of, scientific research, owing to the fact that fair income distribution in the economy is a motivating factor for its legalisation, effective employment and business activities, and, consequently, for the social and economic development of the state and regions. Unfortunately, in Ukraine, a significant level of oligarchizing, monopolising, and shadowing of the national economy causes a substantial social resonance and aggravation of the income distribution issue. The prevalence of the interests of individual business groups over the public interest, the high level of corruption, and the lack of political will in combating it, on the one hand, lead to the formation of a quantitatively small class of ultra-wealthy people, and, on the other hand, to a wide range of poor and impoverished strata of the population. Besides, a high level of shadow economy deepens the extreme inequality, as it was proved in our previous work [
1]. Along with the issue of income distribution across households, Ukraine also faces a problem of income distribution among the factors of production. In the conditions of high unemployment, low level of trade union movement efficiency, and the social responsibility of employers, the issue of fair distribution of added value intensifies. Thus, scientists emphasize that the differentiation of incomes, especially when compared with existing proportions in neighbouring countries, becomes a significant migration driver, under the influence of which the demographic situation is becoming deteriorated and the perspectives of human capital reproduction are becoming more complicated in low-welfare countries, Ukraine being one of them [
2]. At the same time, not only in developing countries, but also in developed ones, inequality is a fact recognised by scientists as a largely constraining social and economic progress and predetermines the imbalances of regional development [
3,
4,
5]. In this case, one of the most famous works in the field of study of inequality and possibilities of its eradication, grounded by Doyle, M.W. and Stiglitz, J.E. [
6], also confirms the complexity of the problem of income sharing analysis and, as the most important, the substantiation of its acceptable proportions—such ones that would not interfere with the development of the country and personal well-being.
Thus, the overall objective of this research is to identify the links between different structural indicators of income distribution and the most essential features of social and economic well-being basing on improvement of methodological tools of income distribution analysis.
2. Literature Review
F. Quesnay, in his Tableau économique or Economic Table [
7], was the first one to look at the issue of income distribution within the framework of economic theory. According to Quesnay, income flows are distributed between three classes: landowners, farmers, and others—called “sterile” classes—who consumed everything they produced and left no surplus for the next period, i.e., everybody except for the agricultural sector [
7]. The core idea of the concept is the principle of domination of agriculture over other areas of production.
The representatives of the classical economic school (A. Smith, D. Ricardo) believed that every member of a society had a share in national income. Smith [
8] and Ricardo [
9] argued that the welfare of each person depended on the welfare of society. At the same time, according to the doctrine of the classical political economy, all three classes (capitalists, labourers, and landlords), who respectively receive three types of income (profit, wages, and land rent), participate in the distribution of income. It is noteworthy that classical economists have determined that the problem of wealth distribution is crucial to political economy, and the “distortions” in distribution can become an obstacle to economic growth.
In accordance with K. Marx’s theory labour is the source of surplus value, and, hence, all national wealth. Marx stated that all other factors of production are involved only in the appropriation of income created by labourers basing on their exploitation [
10].
The representatives of marginalism (V. Pareto, A.C. Pigou, A. Marshall, and J.B. Clark) considered the issue of income differentiation basing on the theory of marginal utility. In this case, in line with mercantilists, all factors of production create national income and participate in its appropriation. The defining thesis of these works is that the distribution of the income of society is controlled by a natural law, and that this law would give to every agent of production the amount of wealth, which that agent creates [
11].
In the 20th century, J.M. Keynes developed the theory of income distribution in the works. Considering the issue of income, J.M. Keynes states that there is a difference between the income of firms and households, develops the concept of an investment multiplier, and proposes a concept for state fiscal policy based on aggregate demand management [
12].
Unlike the Keynesians, M. Friedman, as a representative of monetarism, argued for the idea of limited state regulation of income on the basis of “establishing” the rules of open and free competition, as well as preserving the priority of private property. He also supported the idea of nonaccepting government social programmes aimed at supporting the poorest strata of the population [
13].
Scientific discussion on the problem of appropriate income distribution and its influence on the state welfare are still incomplete. Starting from the works of F. Quesnay, A. Smith, D. Ricardo, their followers, and other famous researchers till nowadays, we have significant differences in perception of permissible levels of income distribution both for households and economic factors on the whole. No doubt that these differences cause inconsistencies in measurement and strategies of income inequality regulation, which, in turn, as emphasized in many researches, especially devoted to transitive economies’ problems and economies with steep economic growth via social factors impact [
14,
15,
16,
17,
18], and consequently—employment and income increase due to the economic activity growth, influenced by social and economic factors [
19].
Nowadays, these ideas for analysing and regulating income distribution are fundamental for the studies of living standards and economic processes caused by their changes. In particular, the noted studies analyse the links between income distribution and economic growth [
20], including investment flows [
21,
22,
23], income inequality, and current account imbalances [
24,
25]; indirect impact of some specific factors on income inequality [
26,
27,
28], particularly tolerance for corruption [
29]. Baradas and Lagoa [
30] also investigate new trends in globalisation, including changes in education and business cycles, within the framework of the analysis of the impact of the financialization process on the labour force share in Gross domestic product (GDP) due to its impact on government activity and trade union density.
For countries with transition economies, such as Ukraine, the level of income that determines its sufficiency to meet personal needs remains an important factor that can provoke migration and worsen the overall level of socioeconomic well-being of the country. Such conclusions can be done on the basis of the analysis conducted by the International Organisation for Migration [
31]. However, in order to justify its own model of income distribution, which would correspond to the interests of stakeholders in the social sphere, the country should study the experience of those countries that are perceived as “safe” in all aspects of social relations, including distributive ones.
No doubt that the question of fairness is complex and ambiguous. Only the need to observe basic human rights as one of the obvious manifestations of justice is questionable among the academicians working in this direction. At the same time, the justice of the distribution of socioeconomic heritage of higher level (above the minimum, the list of which is defined by the Universal Declaration of Human Rights [
32]) is the subject of research, its discussions being not completed until today. The issue of fairness and its evaluation by the major vectors identified in the well-known theories of justice, the most visible of which, in our opinion, remains the theory of Rawls J.A. [
33], is not a target of this study, since our aim is to find the links between income allocation indicators and key welfare indicators existing in the international statistical practice. Besides, the comparison of relevant ideas with the development and approbation of scientific foundations of social justice assessment was made in our previous works [
34,
35]. Based on the current research of income inequalities, which is perceived as one of the main features of injustice distribution processes, it is possible to confirm that the inequality persists due to rising top income and wealth shares in nearly all countries in recent decades, inclusively. However, the magnitude of the increase varies substantially, thereby suggesting that different country-specific policies and institutions matter considerably [
36].
Other well-known works in the field of social sciences have proved that, in countries with higher income inequality, there is always a higher level of social problems, such as infant mortality, mental illnesses, violence, insufficient educational coverage, low social cohesion, and other signs and consequences of the low level of well-being [
37]. Besides, to define equity in income distribution is only theoretically possible—for this, there are some relevant theoretically grounded, but actually unattainable values of the Gini coefficient at level 0, which corresponds to the full equality of income distribution. Meanwhile, taking into account the realities of the state regulation of distribution relations in the sphere of income, it is clear that such levels are unattainable. Therefore, even in the Millennium Development Goals, the relevant tasks are formulated as the fight against poverty and elimination of excessive inequality, and their adaptation is carried out in the form of tasks for a particular country, basing on indicators of leaders and potentially achievable progress. Another threshold that characterizes the ideal equality regarding income distribution is the value of Palma ratio at 1.0, as defined by Doyle, M.W. and Stiglitz, J.E. However, as the researchers suggest, ‘All countries should focus on
their “extreme” inequalities, that is, the inequalities that do most harm to equitable and sustainable economic growth and that undermine social and political stability. A Palma ratio of 1 is an ideal reached in only a few countries’ [
6].
Current distributive equity studies, as analysed in other works [
1,
34], rely mainly on gross indicators of income distribution, including widely spread income inequality tools such as Gini coefficient and other indicators of income ratios of certain population groups without taking into account economic background of inequality formation. In this context, the analysis of functional distribution of income by economic factors is important, particularly the share of “labour” in GDP, as well as comparative analysis of socioeconomic well-being of countries related to core indicators of income distribution, defined by different approaches to determine income inequality.
3. Materials and Methods
To analyse income distribution, we employed a methodological approach of comparative analysis based on two forms of income distribution: functional (share of “labour” in GDP) and household one (ratio of incomes measured by special decile coefficients). Thus, we identified inconsistencies in distributive strategies using data of EU Member States and Ukraine as country with a transitive economy being on the stage of formation of its regulatory policy in income distribution.
The methodology for the comparative assessment of income distribution and the further analysis of the links of distribution relations and factors characterising social and economic well-being is the analysis of distributive policy of different countries, carried out in accordance with the two most widespread approaches. In consonance with the well-known approaches to income analysis, which are currently presented in detail in the scientific papers [
38,
39,
40], we have conducted our own research on income distribution by
functional and
household principle. Unlike the dominant position to analyse gross indicators of income per capita or household principle, including esteems of related impact on gross economic results (such as GDP, Gross national income-GNI), our study is aimed at investigating the impact of income inequality, measured by both functional and household approaches, on some specific indicators of social and economic development.
Functional income distribution characterises the proportions of distribution of national income among the owners of the factors of production, depending on each factor’s participation in its creation. On the contrary, household income distribution reflects the distribution of GNI between different households, regardless of their income sources and the social strata to which they belong. Household income distribution is investigated based on statistics of total income distribution by decile population group in conjunction with the income ratio of the upper bound value of the ninth to that of the first decile (P90/P10), Palma ratio and Gini coefficient. The research was conducted basing on the case study of Ukraine with comparisons in the group of EU Member States. To check our hypothesis about patterns and links between economic outcomes and social factors of well-being, we used data available at statistical services of the EU and Ukraine (GDP and its constituents in dynamics), as well as data from international reports that illustrated some consequences of public distributive policy [
41,
42,
43,
44,
45,
46].
To certain limitations of our research we can include some remarks expressed in the work of Galbraith, J.K. [
47], as to the fact that indices obtained from different databases are difficult to compare. In fact, there is a problem of data incomparability if the statistical sample draws on many distinct sources and is not based in all cases on actual measurement.
However, in our case, we used data from official surveys of the distribution of household incomes carried out in the EU and Ukraine by the same method, and the samples are recognized by relevant statistical services as representative ones. Therefore, in our further research, we used these data as reliable and the only ones available for macroeconomic comparisons with the purposes of our research.
To define obvious patterns in income distribution that can be used as a background of analysis of relations of social and economic factors of well-being, we employed grouping of countries by their level of economic progress (GDP per capita) and social justice in income distribution (Gini coefficient as one of the most significant indicators of income inequality) with the further correlation analysis.
The study of the functional income distribution is based on the analysis of national income and gross value-added between the factors of production. Nonetheless, the three-factor and four-factor models of income distribution are the most common in the academic community. The current system of statistics makes it possible to identify the patterns of functional income distribution only between two factors of production—labour (workers) and capital (business owners), so we employed this approach in our research.
The State Statistics Service of Ukraine, including the results of a sampling survey ‘The expenditures and resources of households in Ukraine,’ was used to analyze the distribution of income in Ukraine [
46].
Continuing estimation of functional income distribution and its economic impact, we used correlation analysis for the estimation of income distribution links and related socioeconomic indicators of well-being. Taking into account the fact that, the overall level of well-being, like a country’s overall achievement in its social and economic dimensions, the socioeconomic indicators of well-being can be defined by the level of human development (Human Development Index), as provided in the rationale for the concept of Human Development Index (HDI) by United Nations Development Programme (UNDP) [
48]. Additionally, we considered the partial indicators characterizing the state’s regulatory and distribution level (Tax Burden; compliance with Property Rights). Following the works devoted to the research of migration and its causes [
49,
50], we also considered factors illustrating the results of satisfaction/dissatisfaction with the level of welfare in society (Net migration rate; Immigration) and the results of pull factors that arise from different welfare levels in comparable countries.
So, we used the data of International Reports 2016: Human Development Report 2016 [
48], Index of Economic Freedom [
51], International Property Rights index [
52], and Eurostat data. The factor indicators are as follows: Human Development Index (X
1); International Property Rights Index (X
2); Tax Burden, % of GDP (X
3); Net migration rate (per 1000 people) (X
4); Immigrants (per 1000 inhabitants) (X
5), and impact ones are Gross National Income (GNI) per capita (Y
1) Labour share of GDP (Y
2), as well as income distribution, measured by Gini coefficient (Y
3).
Correlation analysis was performed using MS Excel software, which calculated Pearson’s correlations with a significance level of the p-values of 0.95. The statistical significance of the correlation coefficients is verified by standard rules—by comparing the critical and calculated values of t-statistics.
4. Results
The study of the peculiarities of the functional distribution of national income in Ukraine (see
Table 1) shows a decrease in the share of wage earners (from 50.8% in 2015 to 41.6% in 2016). At the same time, the share of gross profit as an indicator of participation of business owners in the national income has slightly increased and, in 2016, it reached 48.4%. It is indicative that the functional distribution of incomes in Ukraine according to the two-factor approach demonstrates relative equity.
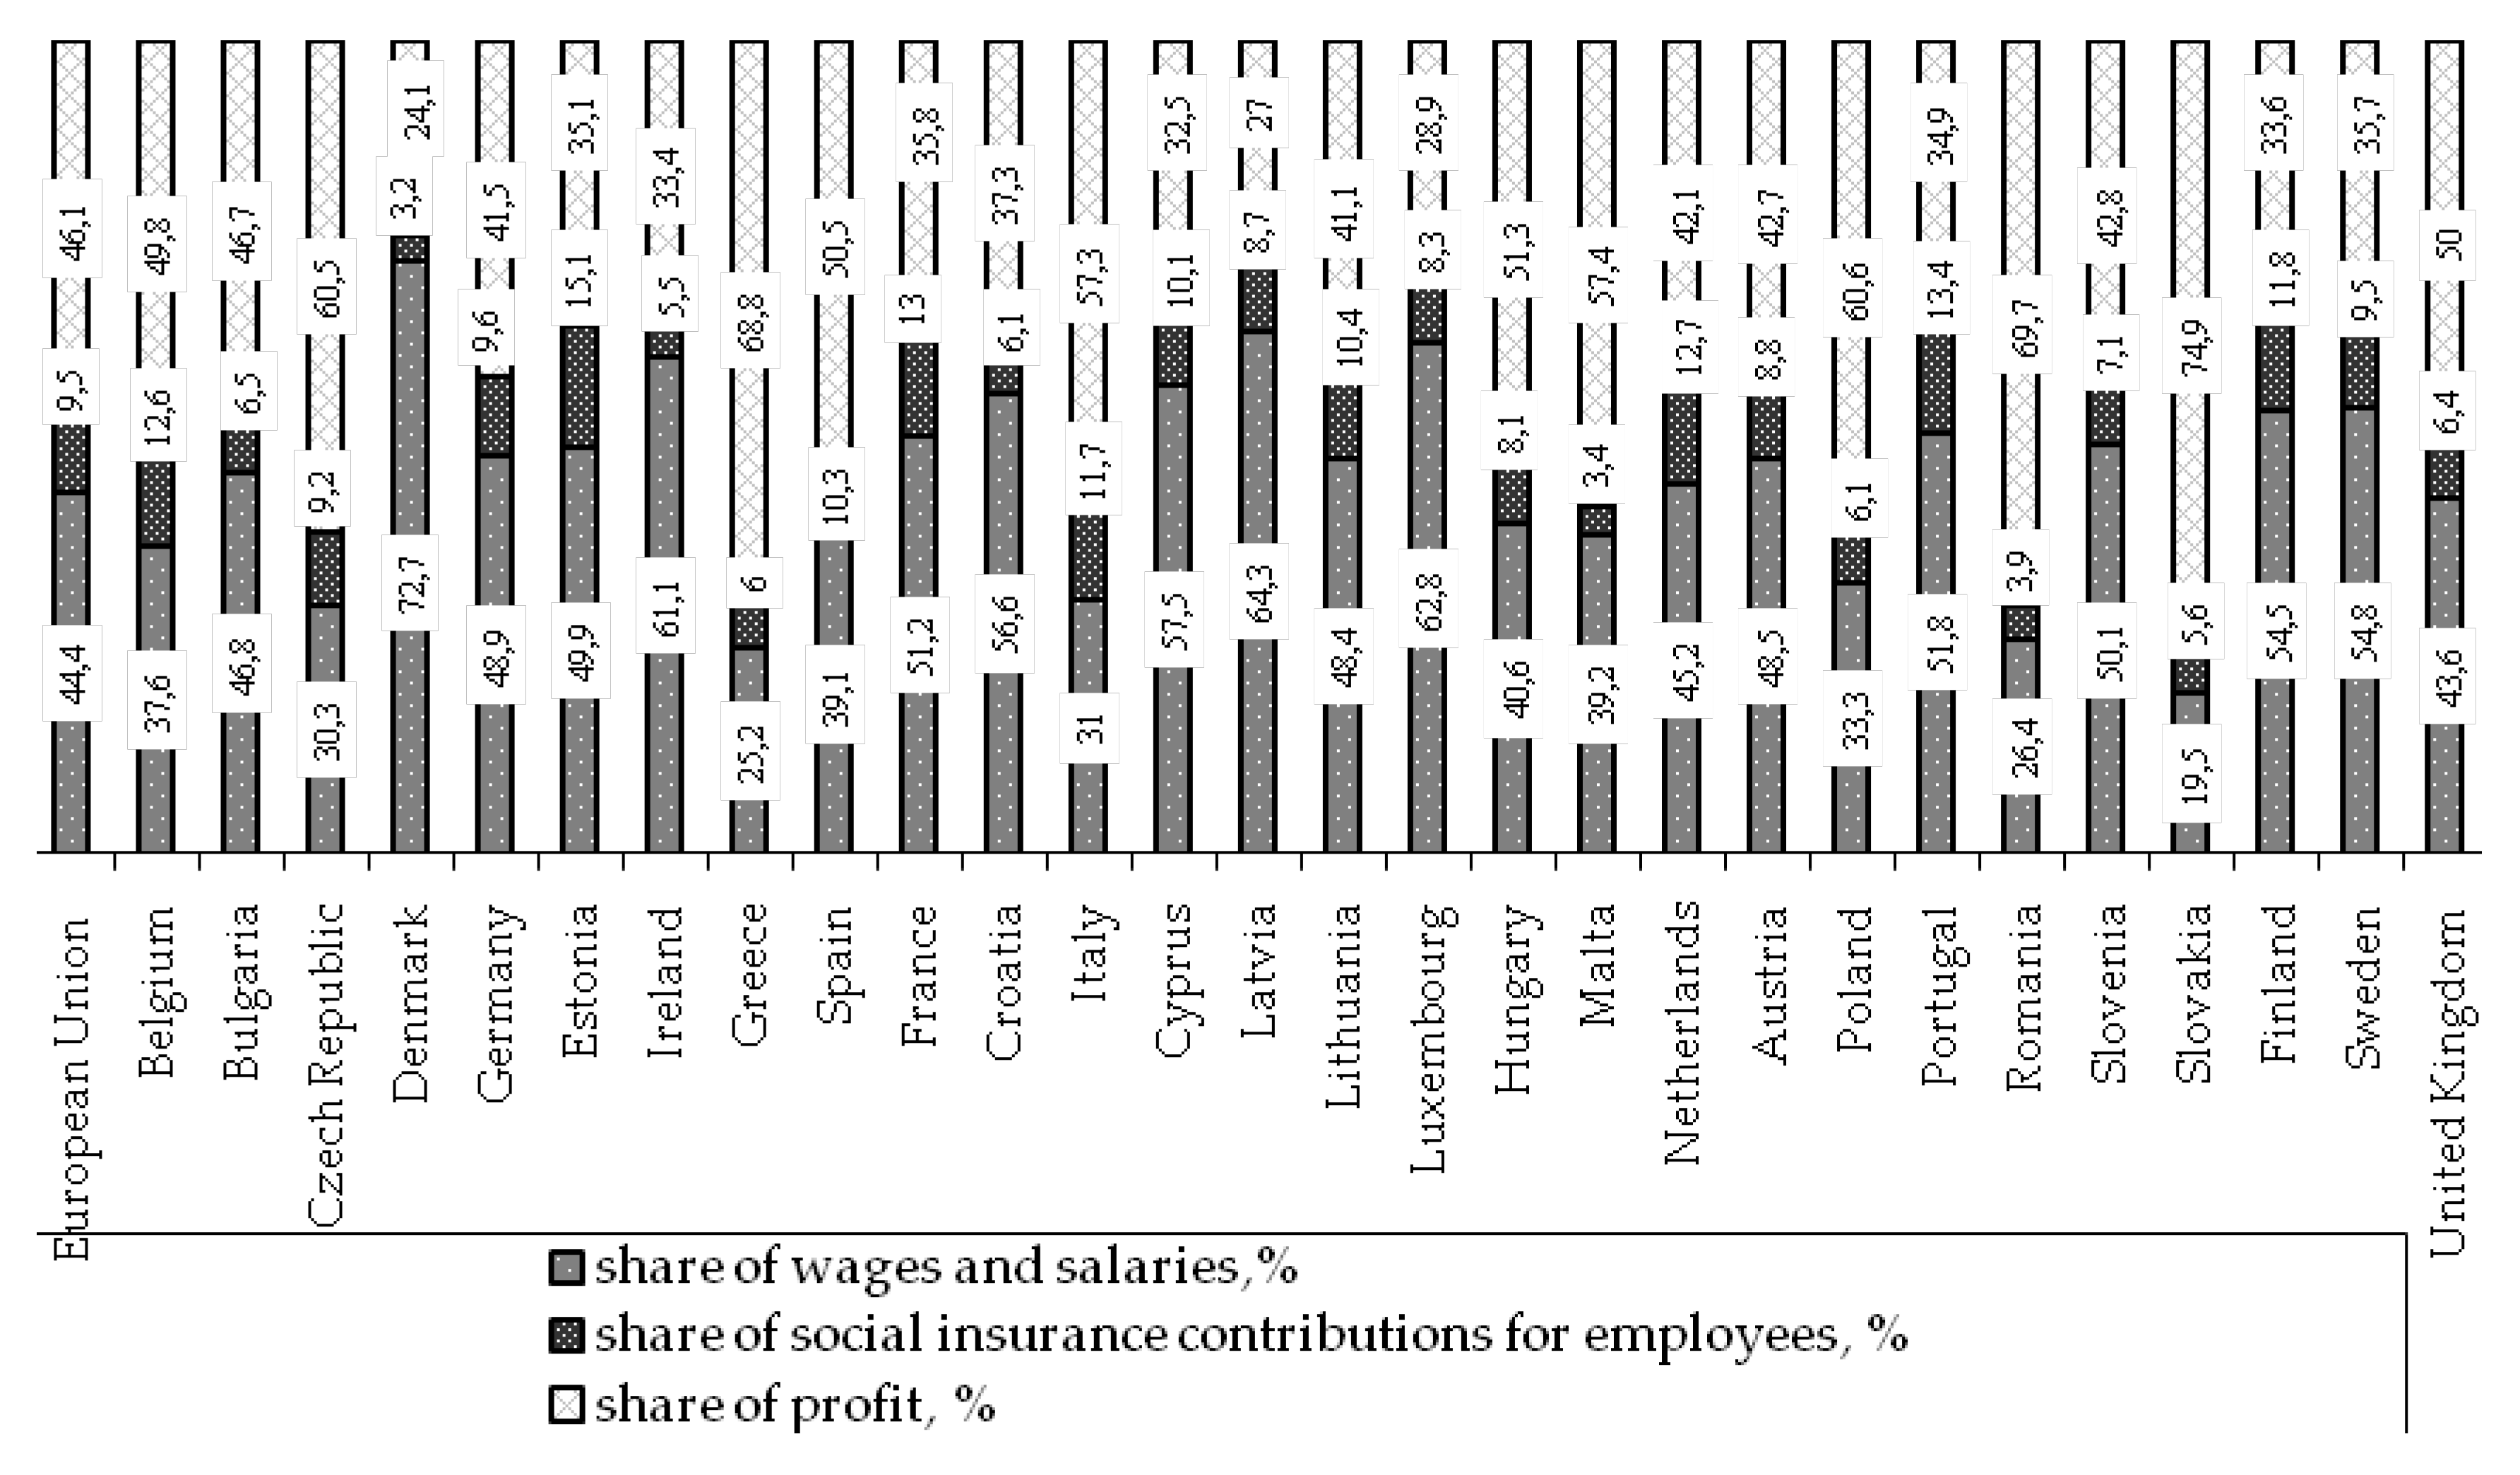
The study of the functional distribution of gross value-added in the EU Member States between “labour” and “capital” indicates its fairly proportional distribution—44.4% versus 46.1%, respectively (see
Figure 1). At the same time, there is considerable differentiation between the EU Member States in the relative indicators of the value-added distribution between the factors of production. Thus, in 2016, the figures revealed the largest share of value-added in Slovakia (75%), Romania (70%), Greece (69%), Poland, and the Czech Republic (about 61%). In contrast to the countries listed above, in Denmark, Latvia, Luxembourg, and Ireland, the share of wages in the structure of value-added prevails and varies in the range of 60–72%. Thus, in the EU, there is no single policy for the factor-based distribution of added value.
Functional distribution does not fully reflect the patterns in the income distribution. Therefore, it should be supplemented by the analysis of household income distribution. In order to do that, researchers usually use a decile distribution of households. According to the data (see
Table 2), in Ukraine and the EU Member States, there is a clear pattern of increase of the share in total incomes from 1 to 10 decile groups. The comparison of the respective shares shows that Romania demonstrates the smallest share in the total income for 1–2 decile groups; Ukraine has the highest one. At the same time, Lithuania and Slovakia have the lowest and highest share of 3–6 decile groups in total incomes, respectively. It is significant that the largest difference between the European Member States is observed with regard to the specific share of the 10th decile group in incomes (28.2% in Bulgaria versus 19.9% in Slovakia).
The calculation of the P90/P10 in the EU and Ukraine shows significant differences in income distribution. Thus, in Ukraine, the difference in income of the 10th decile group in comparison with the 1st one is 4.2 times, while in Belgium it is 15.7. The lowest level of income inequality by the P90/P10 is observed in Great Britain (the difference is 4.9 times).
Based on the results of the decile distribution of incomes, it is possible to calculate other indicators to assess the inequality. In particular, the alternative to Interdecile ratio P90/P10 is Palma ratio, which is sensitive only to changes at the top (10%) and the bottom (40%) parts of income distribution. Its significance for Ukraine is the lowest compared to the EU countries and confirms the results of the Interdecile ratio P90/P10 concerning relative equality in income distribution between upper and lower decile groups of population, compared with the EU. At the same time, if according to the Interdecile ratio P90/P10, the biggest inequality in the distribution of incomes among the EU states was observed in Belgium, Latvia, Portugal, then for Palma ratio—in Bulgaria, Luxembourg, and Lithuania. An alternative to the Palma ratio, to a certain extent, may be the Interdecile ratio P80/P20. It reflects the ratio between incomes of 20% of the richest and 20% of the poorest population, proceeding from the condition that the middle class is conditionally stable and comprises 60%. The analysis of the corresponding indicator for Ukraine and the EU almost fully confirms the results obtained by Palma. Differences in distribution of incomes by different indicators can be explained by methodological peculiarities of their calculation. It is obvious that Interdecile ratio P90/P10 reflects inequality in the distribution of incomes on the principle of extreme polarization. At that time, the base of Palma ratio was based on the concept of the middle class, whose earnings in most cases constitute about half a national income, whereas the other half of income is distributed between the richest and the poorest. Considering this, it is obvious that EU states carry out a different policy on the formation of the middle class and polarization of the population by income. As for Ukraine, the demonstrative equality in the distribution of incomes in comparison with EU countries under the conditions of a significant level of shadowing of the national economy raises serious doubts. According to Leandro Medina and Friedrich Schneider, the level of the shadow economy of Ukraine in 2017 amounted to 42.9%, which significantly exceeds the critical level of 30% [
53]. Of course, under the conditions of high ‘shadowing’ of economic relations, official statistics cannot objectively reflect the distribution of incomes between population groups.
Gini coefficient provides an integral criterion of the differentiation in household income distribution. There is a widespread classification suggested by Atkinson, Rainwater, and Smeeding for the Organisation for Economic Co-operation and Development (OECD) countries in order to compare differences in income distribution by this ratio. According to the classification, the Gini coefficient in the range 33–35 characterises a high degree of inequality, 29–32 is an average one, 25–28 is a low one, and 20–24 is a very low degree of income inequality. Ukrainian scientists, for example Kholod [
54], often use such bounds of countries’ belonging to a certain group for corresponding comparisons. A comparative analysis of the Gini coefficient in Ukraine and the EU Member States, oddly enough, indicates an extremely low level of income inequality in the national economy compared to most of the EU countries (see
Table 3).
Although, at first glance, this is positive; however, in the background of European Member States and Ukrainian realities, we cannot but mention the high share of shadow economy in Ukraine, proved by the certain research [
53]. So, the official statistics do not accurately reflect the real situation, as it only reflects inequality for the part of the economy and the population belonging to the nonshadow economy. It also appraises the need to evaluate the income inequality, taking into account their shadowing—the corresponding method is presented in [
1]. Unlike Ukraine, according to this classification, most EU Member States have an average (9 countries) and low (9 countries) level of income inequality. At the same time, inequalities in income distribution can be described as high in 8 countries (Bulgaria, Romania, Lithuania, Latvia, Spain, Portugal, Greece, Italy).
Therefore, among European Member States, there are significant differences not only in the functional, but also in household income distribution. In this regard, the question then arises: how does income distribution relate to the economic and social development of the country?
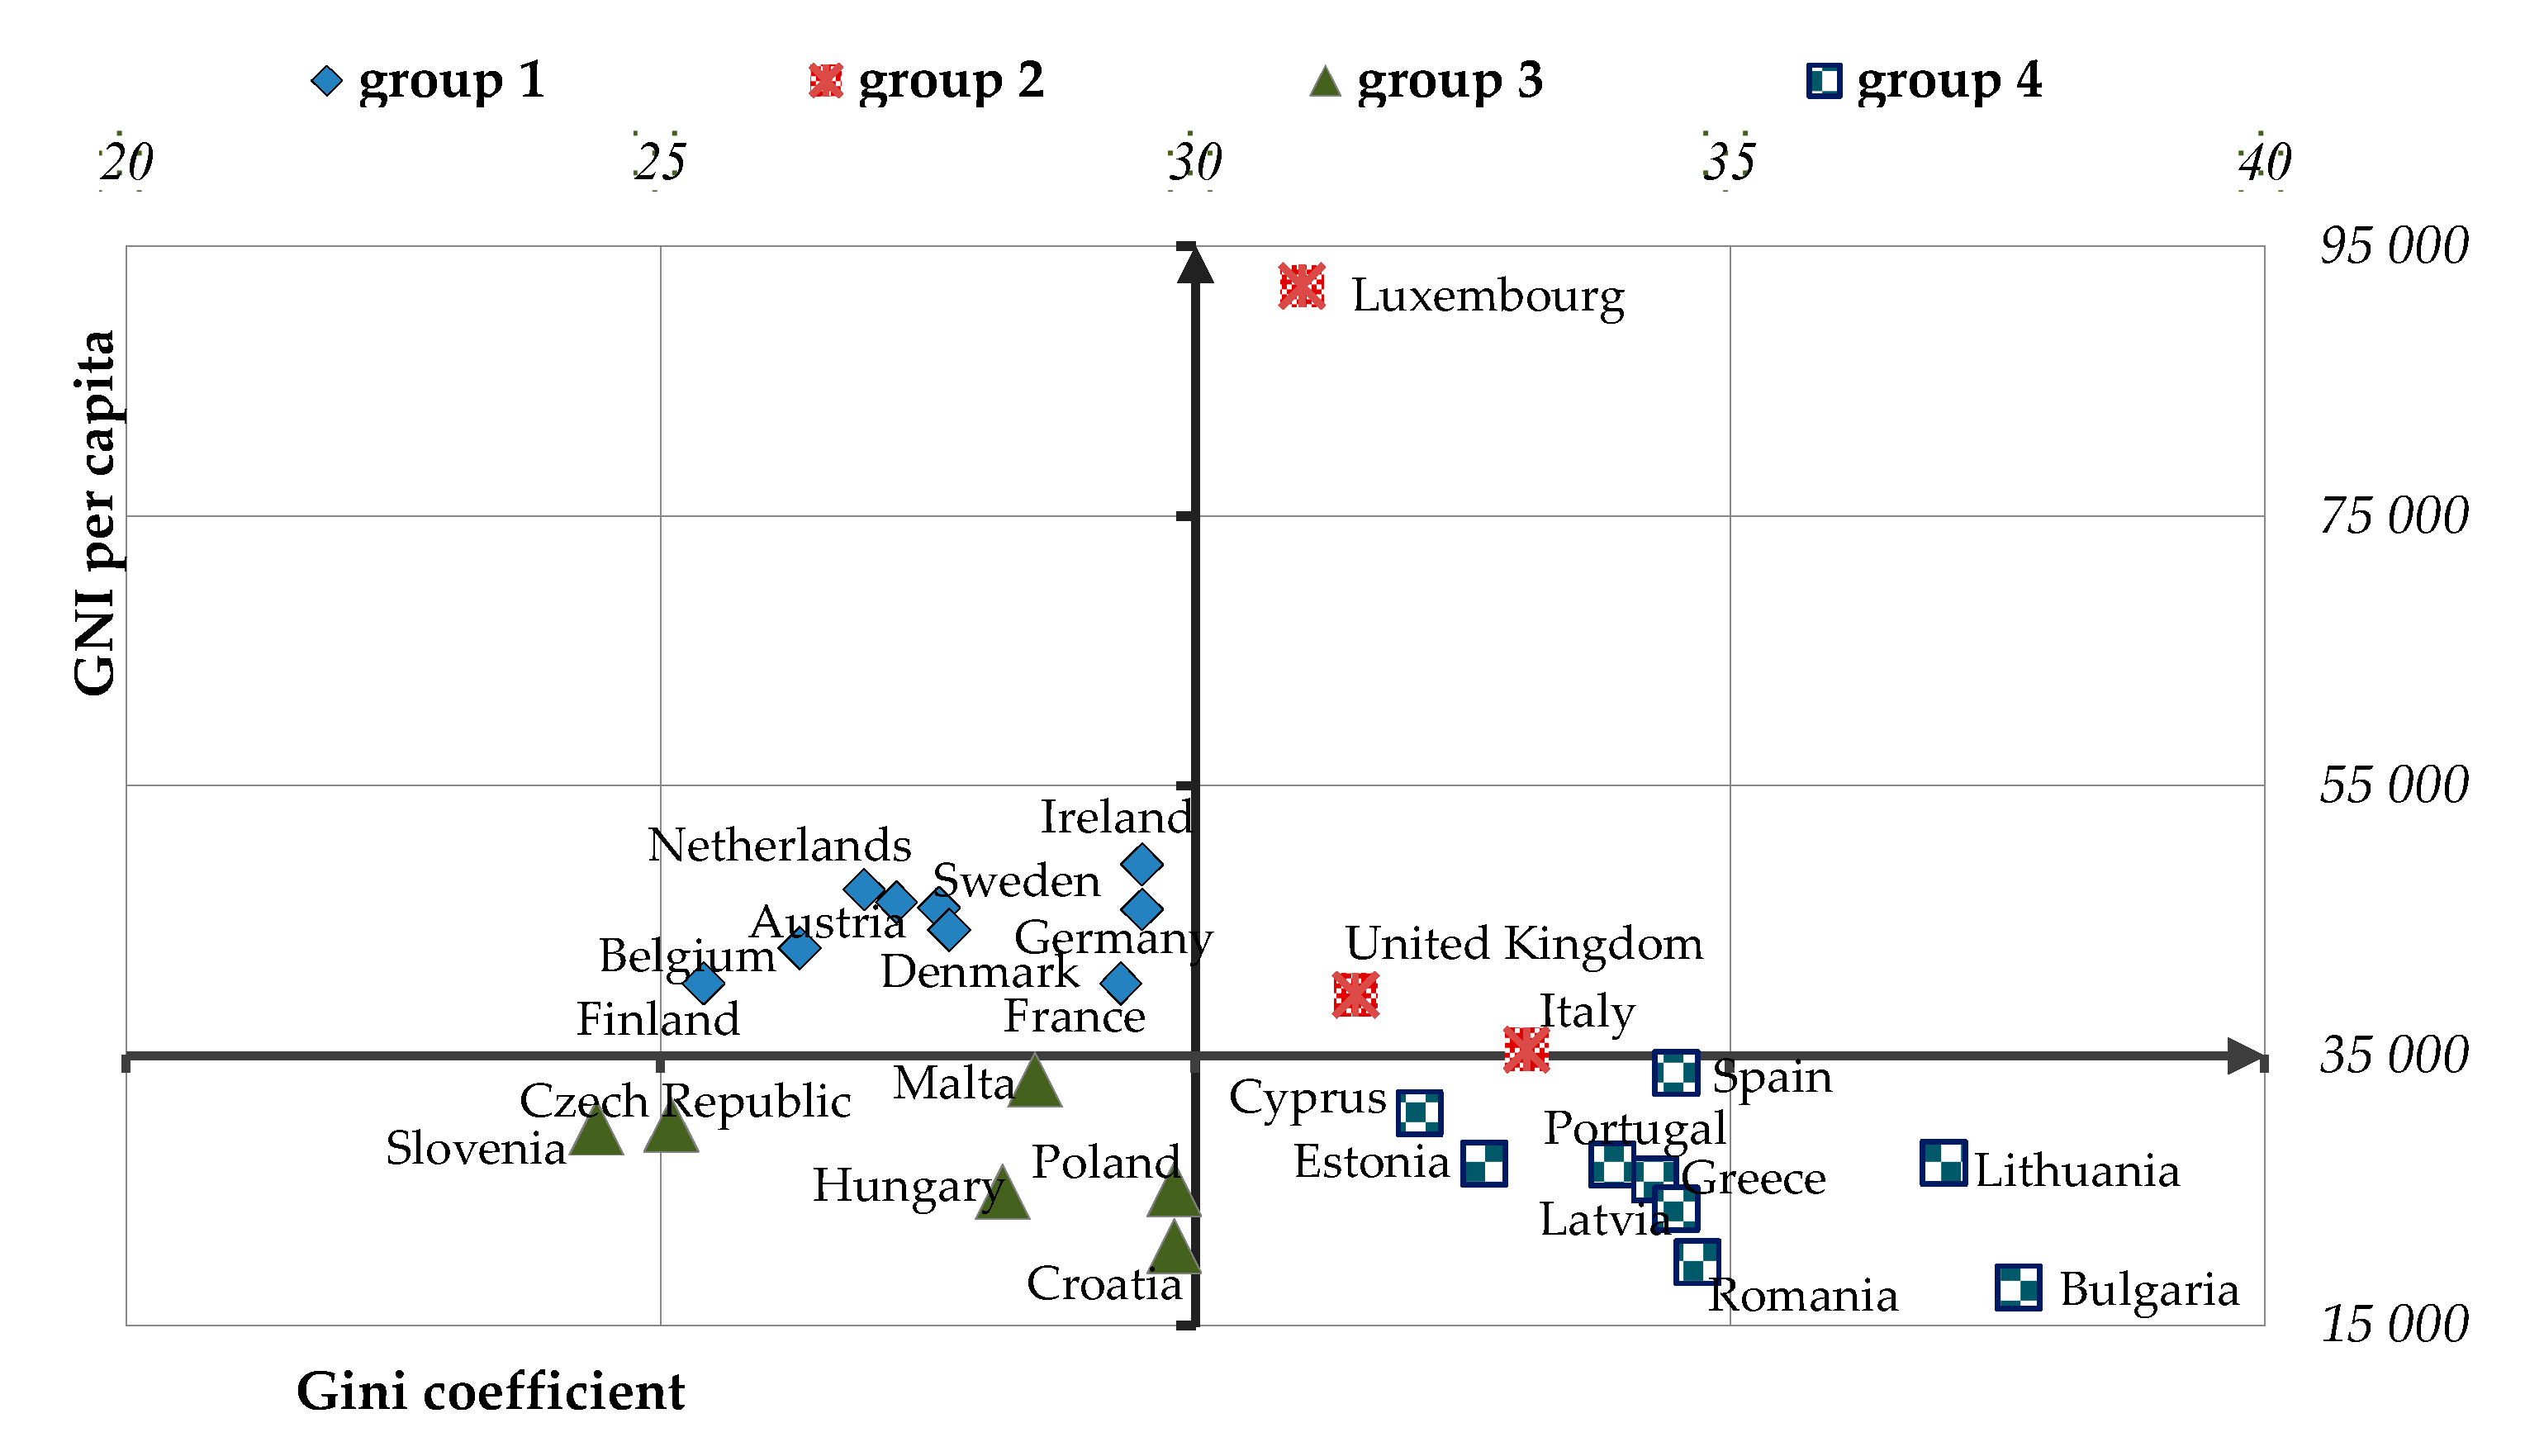
One can use graphical analysis to identify national differences that may be useful in reducing income inequalities, increasing motivation for employment and, accordingly, providing higher GNI. In order to do that, we grouped the countries according to the GNI and inequality in income distribution, ranging them into four groups by the average values of each of the indicators—similarly to the approach, revealed in [
34] (see
Figure 2):
group 1—high GNI, low level of income inequality (Gini coefficient is below the average);
group 2—high GNI, high level of income inequality (Gini coefficient is above the average);
group 3—low GNI, low level of income inequality;
group 4—low GNI, high level of income inequality.
The breakdown is based on the fact that, in 2016, average GDP per capita for the EU-28 was USD 35,517 thousand, and the average Gini coefficient was 30.2%.
The objective of the analysis is to identify the leaders according to the ratios of economic success and low-income inequality (group 1), as well as to select the countries with the worst ratios (group 4).
The first group includes countries with established traditions of democracy and social relations. Their development is based on achieving a balance between economic growth and social stability. Luxembourg, as a country with a high level of human development and the largest GNI per capita in the EU, was “on the edge” with a bloc of leaders (the deviation from the average Gini coefficient of only 0.8), due to the peculiarities of its social and economic policy. Post-socialist countries, in their vast majority, as well as the countries in which the decline in social productivity is due to imperfect state social policy (Bulgaria, Greece), demonstrate the worst correlation between GNI and income inequality. At the same time, Slovenia and Czech Republic, which are relatively young members of the EU, were able to overcome the high inequality in distributive relations. The gap between these countries and leaders in economic growth is contingent, since we talk about successful EU Member States that, by their very nature, have been recognised as capable of providing the high economic and social standards that are typical for the EU.
The given analysis reveals that, in the case of effective model of income distribution and the moderate distribution inequality, the country can have high rates of economic and social development and vice versa. We will conduct a correlation analysis based on the values of the paired correlation coefficient to practically confirm this hypothesis. We performed the study of the effectiveness of regulatory influence mechanisms on distribution ratios on the example of two groups of countries (leaders and outsiders), with well-defined and formed tendencies of economic and social development. Basing on the preliminary analysis, the first group, where the social and economic efficiency of the above criteria is higher than the EU average, includes Sweden, Finland, Belgium, Netherlands, France, Germany, and Austria. The second group (social and economic efficiency below the EU average) includes Cyprus, Greece, Spain, Portugal, Estonia, Latvia, Lithuania, Bulgaria, and Romania.
In order to find out the degree of correlation of economic efficiency and related socioeconomic factors of well-being, we used the data on GNI and labour share of GDP (resulting indices), as well as specific indicators of social and economic development described in
Section 3.
Given that, at the time of this study, the latest data on individual factors (immigrants per 1000 inhabitants) were only available for 2016, the analysis was conducted using the statistics for this year. In order to make the data comparable, we used the 2016 indicators from other sources.
By means of the correlation analysis, the results characterise the degree and direction of the correlation of these factors with the impactful indicators (see
Table 4).
The value of the correlation coefficients indicates a direct close relationship between almost all factor indicators and income per capita, and a somewhat weaker link with the share of GDP belonging to wage earners (workers). As one can see from
Table 4, Gross National Income (GNI) per capita and labour share of GDP directly affect the living standards of the population—the higher the data, the higher the standard of living, and the lower income inequality indicators. “Observance of private and intellectual property rights” belongs to the factors of state regulation, which have significant links with the country’s economic development and the formation of a favourable income distribution environment.
Furthermore, the results of the analysis showed a significant correlation of tax regulation and income per capita and substantially lower links with the functional distribution of income (labour share of GDP). However, in view of the significant differences in tax systems and taxation principles in the EU Member States, it can be assumed that a lower link between taxes and the share of wages and salaries in GDP is offset by redistributive processes in the taxation of entrepreneurial incomes. These models of taxation are often the least efficient distributive mechanism for ensuring economic efficiency and funding for the social needs of the state. The relationship between the resulting indicators and population migration are also significant and one can effortlessly see it in the increase of the immigration flow in countries with higher rates of economic and social development. In particular, countries with lower incomes per capita have smaller positive net migration. At the same time, the impact of income distribution is controversial: as we see, a general high standard of living is still a more convincing argument for migrants than the quality of distributive processes. Concurrently, one of the clearest links is the high impact of distribution policy on human development: the better the ratio of economic outcomes and distributive justice in the form of a low Gini index, the more obvious are the achievements in ensuring human development in general, and not only in terms of income.
6. Conclusions
The factor distribution of incomes between “labour” and “capital” in Ukraine and the EU testifies to its relative fairness. At the same time, in the EU countries, there is a significant variation of the specific share of income participation in favour of hired workers and entrepreneurs. The study of household income distribution based on Interdecile ratio P90/P10, Р80/Р20, Palma ratio testifies to the lowest level of inequality in the distribution of incomes in Ukraine compared to the EU countries. Such results suggest grave doubts due to the high level of the national economy being shadowing.
In EU countries, household income distribution by different indicators demonstrates different results. Thus, by the Interdecile ratio P90/P10, the largest income polarization is observed in Belgium, Latvia, Portugal (the incomes of 10% of the richest population are 13.4–15.7 times higher than of 10% of the poorest population), the lowest—in United Kingdom, Romania (the above mentioned ratio varies within 4.9–5.3 times). However, Interdecile ratio P90/P10 reflects differentiation in incomes on the principle of extreme polarization. More objective indicators based on the concept of the middle class are Palma ratio and Interdecile ratio P80/P20. Among the EU countries, the highest level of differentiation incomes for these indicators is observed in Bulgaria, Lithuania, and Latvia, the lowest—in Slovakia, Slovenia, the Czech Republic. The comprehensive assessment of household income distribution over all the decile groups of population provides the Gini coefficient. The Gini coefficient analysis in Ukraine confirms the low level of inequalities in distribution of incomes by Interdecile ratios P90/P10, Р80/Р20, Palma ratio, compared to all EU countries. Compared to Ukraine, the lowest differentiation income in EU countries is higher. This indicates that, in the face of the high level of “shadowing” of the national economy, there is a need to develop alternative methodological approaches to assess the income distribution, taking into account their “shadowing” components.
The correlation analysis of the connection between the Gini coefficient and a number of socioeconomic indicators (Human Development Index, International Property Rights Index, net migration rate, tax burden % of GDP) proves that, with moderate inequality in the distribution of incomes, high indexes of economic and social development are achieved and vice versa. In addition, high level of per capita income and the proper proportion of GDP belonging to employees are also factors of socioeconomic development. Thus, the EU’s experience convincingly proves that the deliberate income distribution policy, which eliminates the excessive inequality in their distribution, is the basis of human development and socioeconomic progress.


