Abstract
Due to the increasing sustainability concerns among society and investors, companies share information demonstrating their social and environmental impacts to make an impression in corporate reports. Thus, impression management is used to influence company stakeholders’ perception of their performance through graphs. Graphs presented in corporate reports are powerful impression management tools which communicate performance-related messages to the stakeholders. The purpose of this study is to examine the use of graphs to apply various impression management tactics in economic, social, and environmental disclosures of corporate reports. In this research, the use of graphs as an impression management tool has been determined through the corporate reports of 49 companies selected in the BIST (Borsa Istanbul) Sustainability Index of 2018 and 2019, Turkey. In total, 502 graphs in the reports of the selected companies were examined by descriptive analysis and the findings were statistically tested. According to the results, it was found that companies use both presentational enhancement and obfuscation as impression management tactics in corporate reports. This study helps to fill the research gap in the absence of an empirical study conducted in an emerging economy, Turkey. Additionally, it is the first study that focuses on graphs with impression management tactics that has ever been conducted in Turkey.
1. Introduction
Tracing economic, social, and environmental effects of corporations enables input for sustainability-related decisions for companies and also satisfies the needs of stakeholders. Securing the legitimacy and acquisition of sources are the main reasons for firms to inform their stakeholders [1]. Growing interest in economic, social, and environmental issues leads companies to use appropriate ways to interact with their stakeholders and develop trusted relations [2]. The fact that businesses in developing economies need to follow such trends, strategize their business plans and policies, and ensure the communication of this information to stakeholders is inevitable. This also applies to firms operating in Turkey, which is an emerging country. It is therefore impossible to attract and persuade investors without fulfilling their information needs about a firm’s sustainability-related issues, namely economic, environmental, and social information [3]. Hence, sustainability-related considerations are increasing in the Turkish market.
Companies can present a self-serving view of corporate performance in economic, environmental, and social areas by using different impression management tactics in their reports. There is an increasing interest in impression management tactics at the organizational level. Impression management is accepted as a process that individuals or organizations apply when they seek to influence others’ perceptions of them. By this way, they can build their self-presentation to influence people’s perceptions about them [4]. There is a wide range of impression management tactics investigated in corporate reports. Most studies are based on annual reports while some of them are investigating sustainability reports through using different impression classifications by focusing on accounting disclosures, CEO statements, visual representations, sentences, words, readability of sections, and lastly, graphs [5,6,7,8].
This study investigates the use of graphs as a tool to apply several impression management tactics for economic, social, and environmental disclosures in corporate reports. Two major impression management tactics (presentational enhancement and obfuscation) are addressed to analyze the use of graphs during the research. The findings show that companies may use both enhancement and obfuscation impression management tactics through graphs.
This paper, therefore, intended to contribute to the topic of impression management regarding graphics in several ways. Firstly, we try to improve knowledge about impression management at the organizational level. Secondly, graphs ranging from social, economic, and environmental issues were analyzed in different reports—not only stand-alone sustainability reports. Most of the previous studies in graphs have been conducted in developed countries such as U.S., U.K., Australia, and Canada. [9]. There is a need for an investigation into graph use and how impression management tactics are used in graphs in emerging markets. This study aims to fill this gap, and investigates the subject in an emerging market, Turkey. Lastly, previous studies that studied graphs were mostly conducted in developed countries and there is only a limited number of research studies conducted in developing countries. This study was conducted in Turkey as an emerging economy, with a consistently high economic growth rate over a long time span.
This remainder of this study is structured as follows. The first section presents a literature review: impression management in graphs and discussion of enhancement and obfuscation tactics. In the second section, the research method used in this study is explained. Lastly, the findings of the study are discussed.
2. Theoretical Framework
2.1. Impression Management Tactics
Impression management stems from social psychology and progress in organizational behavior since 1980s. Impression management, also termed self-presentation, concentrates on how people behave to be seen favorably by others [10] and how other people think about themselves [11]. People can select various impression management tactics to manage how they are perceived from others. Although some scholars and researchers have used the terms impression management and self-presentation interchangeably, some distinguished between them [11].
Goffman [12] was the first to conceptualize the phenomenon of impression management [3]. According to Erving Goffman [12], “Life is like a play and we each perform for others” [13]. He explained that impression management involves individuals to use their expressiveness to make impressions on their audiences [14]. As actors, we perform differently depending on the situations and audience in order to convey the image of ourselves. Thus, the actor, the audience, the stage, the script, the performance, and the reviews are the key performance elements that create impression management strategies [15]. The theory suggests that human behavior is motivated by impression management concerns. Based on the interaction, the actor can have a better position to obtain desired results, and therefore, impression management consists of purposive and goal-oriented behaviors [16]. Some definitions of impression management in the literature are given in Table 1.

Table 1.
Definitions of impression management.
The research on organizational impression management tactics has been scarce and scattered [21]. In other words, organizational impression management field is wide-open for further investigations [22]. Organizational impression management is defined as ‘‘any action purposely designed and carried out to influence an audience’s perception of an organization’’ [23]. Organizations can use impression management tactics to build their reputation and develop a positive self-presentation for their stakeholders [24], therefore they have tendency to use a variety of impression management strategies to legitimize the impacts of corporate operations in the area of climate change as a subject of environmental issues [25].
2.2. Impression Management Strategies in Corporate Reporting
From the corporate reporting perspective, Godfrey et al. [26] (p. 96) stated that impression management ‘‘occurs when management selects the information to display and presents that information in a manner that is intended to distort readers’ perceptions of corporate achievements.’’ Merkl-Davies et al. identified impression management [27] (p. 318), “entails managers opportunistically taking advantage of information asymmetries” to bias readers’ perceptions of firm performance. According to Beattie and Jones [28] (p.162), impression management of graphs is ‘‘part of presentational management that concerns the manipulation of the content and syntax of narratives or of presentational formats, such as graphs or pictures.’’
There have been different impression management classifications used in previous research. For example, Hooghiemstra [29] identified the impression management tactics as acclaiming and accounting, Bansal and Kistruck [30] classified them as demonstrative and illustrative, Higgins and Walker [31] used credibility, reason, emotion, Sandberg and Holmlund [21] categorized them as description, praise, defense, and admission, Jones and Pittman [32], Cooper and Slack [33], and Mohamed et al. [34] used assertive and defensive tactics. Impression management can enable companies to present a self-serving view in corporate and sustainability reporting. Therefore, companies can use impression management strategies to protect and enhance their image and reputation by involvement in corporate social reporting. In previous reporting studies, there are several research studies that use various impression management strategies about social, economic, and environmental disclosures in different corporate reports. Hooghiemstra [29] focused on impression management tactics in social and environmental disclosures based on Schlenker [35], Rosenfeld [17], and Tedeschi and Riess [18] categorizations: acquisitive and protective strategies. Acclaiming is one of the acquisitive strategies which is defined as “an explanation of a favorable event designed to maximize desirable implications for the organization” [36] (p. 35). These tactics are comprised of enhancement and entitlements strategies. In the opposite view, accounting tactics are used as a form of remedial tactics by explanations and apologies. There are two subcategories under the accounting tactic which are excuses and justifications tactics.
Bansal and Kistruck [30] stated that impression management tactics as demonstrative and illustrative tactics are valuable when organizations have social forces to threaten their legitimacy and to persuade stakeholders of their commitment to environmental concerns. In demonstrative tactics, organizations can give detailed and real information about their actions as data, examples, graphs. Illustrative impression management tactics provide images about a company’s responsibility to the community. Higgins and Walker [31] use strategies to understand how persuasion influences the disclosure in social and environmental reports. Credibility, reason, and emotions are used as persuasive appeals in discourse analysis. Sandberg and Holmlund [21] focused on different organizational impression management tactics in sustainability reports. They found that description (giving information about actions) and admission (admit its failure in environmental responsibility) strategies are more frequently used than praise (portraying itself to environmentally friendly) and defense (give response to reputation damage) strategies. Talbot and Boiral [25] made an analysis to examine the impression management strategies as minimizing, excuses, strategic omissions, and manipulation that were used in companies’ climate-related disclosures.
2.3. Enhancement and Obfuscation Tactics in Graphical Representation
Recent studies in financial graphs such as in Falschlunger et al. [7], Beattie and Jones [28,37], Jones [6], Steinbart [38], and Mather et al. [39] showed that selectivity, graphical measurement distortion, and use of presentational enhancement were used especially in annual reports.
Studies on impression management based on the analysis of annual reports are more than an analysis on sustainability reports. In this area, graphical presentation and its construction in the reports are the main subject to prior research [5,6,40], while others have focused on impression management through website design [41,42] visuals such as headings, bulleted or numbered lists, colors, shading, and logos [43]. Hrasky [5] compared the more and less sustainability-driven companies in regard to how they use graphs in their sustainability reports and found that more sustainable companies rely on graphs more to convey quantitative data. Jones [6] examined the graph usage in social and environmental reports and found that graphs were widely used to enhance the effectiveness of their corporate social and environmental disclosures. Visual representation has a major role in managing readers’ perceptions as graphs, charts, maps, diagrams, and tables are used to present performance-related information in reports [44]. Graphs are defined as ‘‘a collection of visual elements in size, placement, or shape to a quantitative amount, also named as charts’’ [45]. Pesci et al. [46] suggested that graphs should be evaluated by observing their location in reports, reading of their captions, and analyzing the meaning of the visual component. Graphical representation in reports enables companies to portray a more favorable view of their performance. Therefore, companies will be selective in their graphs usage when it comes to social, environmental, and economic disclosures [6].
In this study, we used the use of performance enhancement and obfuscation strategies to analyze graphs.
2.3.1. Enhancement
Enhancement can be used when an organization tries to maximize the perceived merit of a given event [47]. Merkl-Davies et al. [27] (p. 6) defined enhancement in impression management as ‘‘presenting an accurate, but favorable, view of organizational outcomes.” In graph representations, presentational enhancement can be used as designing one or more graphical components to show the given data inadequately by optical illusions, inappropriate use of colors, visual effects, missing numerical labels, time series in reverse order, not starting the graph with a zero baseline [9]. Steinbart [36] stated that companies which have increased net income were more likely to use graphs in their annual reports.
2.3.2. Obfuscation
As a result of asymmetric information between companies that publish corporate reports and the readers, companies tend to manipulate the reports and provide misleading information in order to enhance good news and mask bad news [48]. Previous studies have shown that measurement distortions are used as a way to emphasize good performance and understate poor performance [7]. By using obfuscation strategy, companies can hide their negative impacts or poor performance through the creation of measurement distortions. The findings of several studies [38,49,50] also support the favorable measurement distortion bias in graphs. Mather et al. [39] indicated that companies exaggeratedly emphasize their performance more frequently than understatement. Beattie and Jones [44] found that companies with favorable performance are significantly more likely to use graphs. Beattie et al. [50] also found that graphs (with the exception of sales graphs) were more likely to be included when favorable, rather than unfavorable in annual reports of U.K. listed companies from 1965 to 2004. A research study conducted by Steinbart [38] also indicates that poorly performing companies apply to favorable measurement distortion in their corporate reports. [51]. Steinbart [38] found that companies which have a decline in financial performance present their performance in a more favorable light than warranted.
3. Research Methodology
3.1. Purpose of the Study
The purpose of this paper is to analyze the graphical representation in sustainability reports, annual reports, and integrated reports of Turkish companies and determine the extent of impression management strategies employed. For this purpose, mixed research methods were used by applying both quantitative and qualitative analysis. Hand-collected data were used to review each corporate report to reveal impression management tactics in graph usage. Based on the results of previous studies, we assumed that companies emphasize positive organizational outcomes (enhancement) or obfuscate negative organizational outcomes (obfuscation) [52].
3.2. Sample
The BIST (Borsa Istanbul) Sustainability Index provides a benchmark for Borsa Istanbul companies in corporate sustainability and aims to increase sustainability-related awareness, knowledge, and practices in Turkey. There are 50 companies listed in the BIST Sustainability Index between November 2018 and October 2019. Based on the BIST Sustainability Index, we analyzed 49 corporate reports in English. All reports were gathered through company websites as PDF files. As a result, 35 stand-alone sustainability reports, 11 annual reports, and 3 integrated reports were analyzed. One of the companies—Migros—did not use graphs to present performance-related data in its sustainability report, therefore, the company was not included in the research sample. Table 2 represents the sample characteristics of this study.
Table 2.
Sample of this study.
The sample of this study consists of 8 companies in the finance sector, 6 companies in the energy sector, 7 holdings, 22 companies in the industry sector, 3 companies in the telecommunication sector, and 3 companies in the transportation sector.
3.3. Data Analysis
We applied several steps during the data analysis process to determine impression management tactics performed by companies through graph usage. In the first step, organizational level impression management tactics, obfuscation, and enhancement, were selected based on Cho et al. [52] and Beattie and Jones’ [44] studies. In the second step, each graph in the selected companies’ corporate reports were categorized as line, line plus bar, vertical or horizontal bar, and pie graphs. In the third step, all graphs were analyzed to identify graph distortion by using the relative graph discrepancy index (RGD). Mather et al. [53] proposed that the RGD is a robust and stronger alternative measure compared to the GDI (graph discrepancy index). The RGD defined as:
dl = value of first data point (corresponds to first column);
d2 = value of last data point (corresponds to last column);
g2 = height of last column (graph);
g3 = the correct height of last column (if plotted accurately);
g3 = g1/d1×d2;
RGD = (g2-g3)/g3.
The RGD measures the height of the last column as it is graphed relative to the height at which it should have been graphed. The RGD is positive when an increasing trend is overstated or when a negative trend is understated. On the other hand, the measure results in negative values when increasing trends are understated or decreasing trends are exaggerated. When the value is zero, there is an absence of distortion [8,54] (Table 3).
Table 3.
Distortion measure for graphs.
Obfuscation was measured by determining the degree of graph distortion. A cut-off point of 2.5 percent was selected to classify graphs as materially distorted. We classified materially distorted graphs as favorable or unfavorable distortions. Trend direction should be considered to decide whether the distortion is favorable or unfavorable [55].
Figure 1 represents an example of distorted graphs which give inaccurate information in selected sustainability reports while Figure 2 is an example of undistorted graphs. When compared with the undistorted graph, distortion portrays a more favorable view of water and paper consumption in this example.
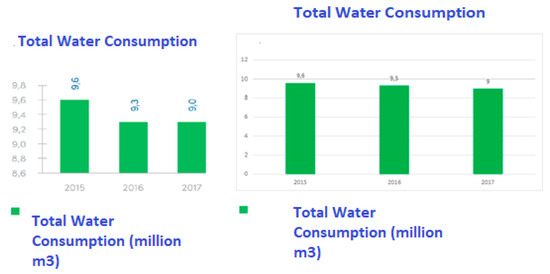
Figure 1.
Example of (left) distorted graph/ (right) undistorted graph about water consumption. Reference: Anadolu Efes Sustainability Report 2017 [56].
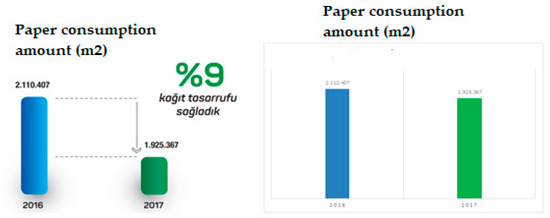
Figure 2.
Example of (left) distorted graph/ (right) undistorted graph about paper consumption. Reference: THY Sustainability Report 2017 [57].
In order to identify presentational enhancement, we determine the use of graph selectivity which occurs when the use of a particular graph is contingent upon good performance. Selectivity was measured to determine favorable or unfavorable direction depending on the nature of the item being graphed.
Figure 3 represents a graph that shows sales volumes with a decreasing trend over years. In this example, to enhance the impression of sales volumes, the last column (2017) of the graph is illustrated 9% greater than it should have been.
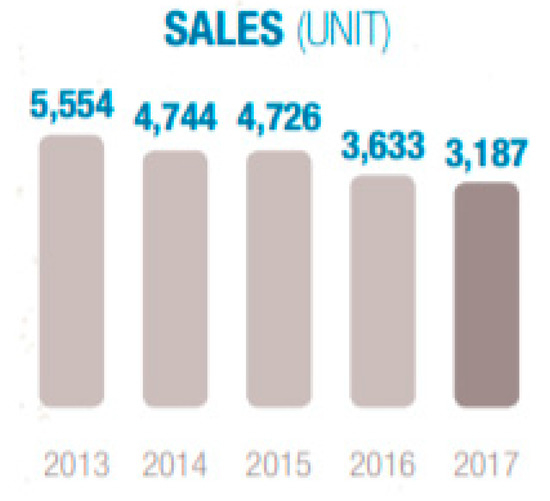
Figure 3.
Example of presentational enhancement. Reference: Otokar Sustainability Report 2017 [58].
Figure 4 represents a graph about total injury frequency rate that shows a favorable trend in the interest of the company publishing the data.
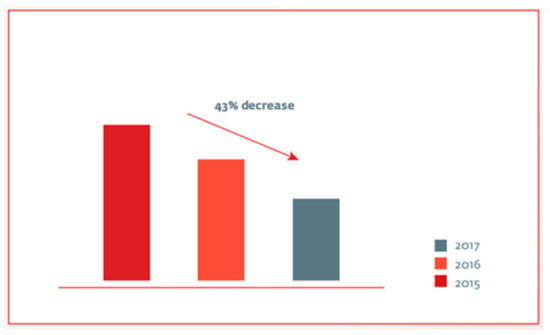
Figure 4.
Example of presentational enhancement. Reference: Şişecam Sustainability Report 2017 [59].
4. Findings
The findings of this study are presented below. Firstly, descriptive statistics were given, then the main analysis was performed to show evidence for the use of impression management tactics in corporate reports.
4.1. Descriptive Statistics
Descriptive statistics about graphs, subject of graphs, and data types are presented in Table 4, Table 5 and Table 6.
Table 4.
Distribution of graphs based on types.
Table 5.
Distribution of graphs based on subject.
Table 6.
Distribution of graphs based on data type.
In Table 4, graph types were categorized as line, line plus bar, horizontal bar, vertical bar, and pie graphs. In previous studies, bar and line graphs were found to be the most common graph types that have been included in corporate reports [36]. According to the descriptive statistics results of our study, vertical bar graphs (204) and pie graphs (180) are the most used graphs among the total 502 graphs in corporate reports.
Table 5 represents the number of graphs in economic, social, and environmental issues. Thirty-nine percent of graphs related to economic performance, 37% of them related to social performance, and 24% of them represented environmental performance.
As reported in Table 6, 231 graphs represented positive performance-related data, 202 graphs showed informative data, and 60 of them illustrated negative performance-related data out of a total of 502 graphs.
Table 7 presents data and summary information regarding the use of graphs in corporate reports of Turkish companies that are included in the sample of this study. Types of graphs in economic, social, and environmental areas are presented in detail.
Table 7.
Use of graphs in corporate reports.
In the finance sector, graphs that illustrate economic performance were mainly presented in corporate reports. These graphs represent important economic performance data such as revenue and sales. The least number of graphs were related to environmental performance. Energy consumption and productivity were the most discussed issues in environment-related graphs. The graphs in corporate reports of holding companies were mostly related to environmental performance such as waste-recycling, water consumption–productivity. It was also found that the least number of graphs were related to economic performance (revenues–sales). When the companies in the industry sectors were examined, it was found that most of the graphs represented companies’ social performance and employee-related disclosures were the most discussed topics in the reports. Telecommunication companies had the least number of graphs in environment-related subjects. Most of the graphs were related to social performance in telecommunication companies’ reports. Customer-related issues were also disclosed in these reports. Lastly, transportation companies included 27 graphs in their reports out of a total of 502 graphs. A significant number of graphs represented by transportation companies were related to environment and social performance.
4.2. Main Analysis
4.2.1. Enhancement in Graphs
The first analysis of graph usage as an impression management tactic was performed by analyzing graphs with a favorable trend and unfavorable trend related to enhancement tactic. Table 8 and Table 9 present the enhancement tactic in graph usage and differences in their use across countries. Seventy-seven percent of graphs included in corporate reports had a favorable trend. Binominal probability was tested to indicate the difference in favorable versus unfavorable proportion. It was found as significant (p < 0,001; two tailed). As reported in Table 8, there is a bias in favor of companies which use graphs in performance data.
Table 8.
Enhancement in graph usage.
Table 9.
Enhancement in graph usage with sector classification.
Table 9 presents the number of graphs that represent a favorable or unfavorable trend across different sectors. As reported in Table 9, companies from a variety of sectors use more graphs depicting a favorable trend than an unfavorable trend. There is a difference in the binominal probability of all sectors. For finance, holding, industry, and transportation sectors, there is a higher ratio of binominal probability than other sectors in presenting graphs that demonstrate a favorable trend. In the telecommunication sector, the binominal probability ratio is lower than other sectors. The hypothesis was not supported which includes presenting favorable trends in graphs. As a result, we found that enhancement impression management tactics are used in graphs of environmental, economic, and social issues.
4.2.2. Obfuscation in Graphs
Second data analysis was conducted to determine obfuscation in graphs. Degree of obfuscation was measured by identifying graph distortion. The relative graph discrepancy (RGD) was used to measure graph distortion. In Table 10, graphs with favorable distortion and graphs with unfavorable or no distortion were presented. Based on RGD scores of each graphs of the sample, it was found that 276 graphs of the total 502 graphs are subject to distortion. A total of 28.63% of graphs were demonstrating favorable distortion and 71.37% of graphs were unfavorable and no distorted graphs. Based on the binominal probability test, the result showed a significant proportion of graphs were distorted favorably (p < 0.001).
Table 10.
Distortion in depiction of graphs.
In Table 11, materially distorted graphs (graph with the RGD results bigger than the absolute value of 2.5%) were classified as favorable and unfavorable distortion. When good company performance is overstated or poor company performance is understated in graphs, favorable distortion occurs. A total of 62.65% of graphs were materially distorted graphs with favorable distortion and 37.34% were materially distorted graphs with unfavorable distortion. The findings showed that the binominal probability test result was significant (p < 0.001). These results are interpreted as evidence of obfuscation.
Table 11.
Materially high distorted graphs.
Table 12 presents the non-materially distorted graphs (graph with the RGD results lower than the absolute value of 2.5%) with favorable and unfavorable distortion. A total of 57.44% of graphs were non-materially distorted graphs with favorable distortion and 42.55% of them were unfavorable distortion. Binominal z-ratio is not significant (p > 0.001).
Table 12.
Non-materially low distorted graphs.
5. Conclusions
With society’s increased focus on environmental and sustainability concerns, attracting coherent interest from investors requires non-financial information demonstrating a firms’ positive sustainable impact. Thus, there has been an increase in the publication of corporate reports that include information illustrating companies’ impacts on environmental and social areas in developing countries, such as Turkey. As graphs are powerful tools to influence stakeholders’ perception of company performance, companies can benefit from impression management tactics by using graphs in their corporate reports. The main purpose of this study is to examine the use of graphs to apply presentational enhancement and obfuscation impression management tactics in economic, social, and environmental disclosures of corporate reports. The sample consists of 49 companies’ corporate reports in the BIST Sustainability Index of 2018 and 2019, Turkey.
The study contributes impression management literature at the organizational level by analyzing graphical representation. It was found that graphs are widely used by companies to disclose economic, social, and environmental issues in corporate reports. This result is consistent with the findings from the graphs study of Jones [6] that showed high levels of graph usage in social and environmental reports. Also, bar and line graphs were found to be the most popular graph format that have been included in corporate reports as found by Beattie and Jones [36].
The graphs ranging from social, economic, and environmental issues were analyzed in different reports—not only stand-alone sustainability reports. Economic subjects are the most presented issue in the graphs. Among the economic graphs, revenues-sales and profits are the most prominent in these graphs. The social disclosures are the second most common issues of graphs. Employee-related issues have higher levels of disclosures within the context of social disclosures. Findings from sectoral differences of economic, environmental, and social issues in graph usage shows that graph usage is concentrated in the industry sector. The industry sector presents their employees activities in graphs of corporate reports. On the other hand, graph usage is limited in the transportation sector. In line with the literature, graphs presenting positive performance-related data are more common than negative and informational graphs [8].
This study extends the scope of the topic in emerging markets. Based on the results, it was found that companies listed in the BIST systematically manipulated the graphics they published in the corporate reports to create a favorable impression of the companies. In line with the results of previous studies, our research findings show that there are two major impression management tactics, presentational enhancement and obfuscation, used. Companies tend to include graphs showing favorable performance-related data rather than unfavorable performance related data. When each sector is considered separately, the number of graphs reflecting positive performance is higher in all sectors. Although statistical significance levels vary according to the sector, the graphs represented in the corporate reports are selective and predominantly provide a positive impression of the company’s performance. Lastly, the results of this study show that companies practice obfuscation through measurement distortion. Materially distorted graphs in corporate reports tend to paint a more favorable picture of the firm. On the other hand, our research did not reach a statistically significant result regarding the non-materially distorted graphs. Therefore, it is believed that the use of non-materially distorted graphs was caused by error rather than an impression management strategy.
Limitations and Suggestions for Further Studies
There are also several limitations inherent in the study. The graphs investigated in this study are only related to corporate reports published in a single year and all corporate reports published by companies listed in the BIST in a single period. Since a longitudinal research design was not used in the study, no comparison could be made regarding the presentation of the graphs in different time sections. For further studies, comparative studies can be done based on different years. Although the study provides evidence for the use of impression management tactics, it has not been tested whether performance data presented in specified areas really have an impact on readers’ impressions. Performance metrics can be used to examine the relationship between graphical representation and sustainability-related performance. In addition to graphs, various formats such as tables, photographs, and number of photos in the company’s disclosures can be analyzed. Lastly, further research should expand the set of communication channels, such as corporate websites, social networking sites to investigate graphical distortion.
Author Contributions
E.E. wrote the introduction part and theoretical framework. T.C. designed the research methodology, collect and analyze the data. A.Ö.Ç. report the analysis and wrote the methodology section. T.C. read and edited the last version of manuscript. All authors have read and agreed to the published version of the manuscript.
Funding
This research received no external funding.
Conflicts of Interest
The authors declare no conflict of interest.
References
- Herzig, C.; Schaltegger, S. Corporate sustainability reporting. An overview. In Sustainability Accounting and Reporting; Schaltegger, S., Bennett, M., Burritt, R., Eds.; Springer: Dordrecht, The Netherlands, 2006; pp. 301–324. [Google Scholar]
- Siano, A.; Conte, F.; Amabile, S.; Vollero, A.; Piciocchi, P. Communicating sustainability: An operational model for evaluating corporate websites. Sustainability 2016, 8, 950. [Google Scholar] [CrossRef]
- Amran, A.B.; Devi, S.S. Corporate social reporting in Malaysia: An institutional perspective. World Rev. Entrep. Manag. Sustain. Dev. 2007, 3, 20–36. [Google Scholar] [CrossRef]
- Chen, Y.Y.; Fang, W. The moderating effect of impression management on the organizational politics–performance relationship. J. Bus. Ethics 2008, 79, 263–277. [Google Scholar] [CrossRef]
- Hrasky, S. Visual disclosure strategies adopted by more and less sustainability-driven companies. Account. Forum 2012, 36, 154–165. [Google Scholar] [CrossRef]
- Jones, M.J. The nature, use and impression management of graphs in social and environmental accounting. Account. Forum 2011, 35, 75–89. [Google Scholar] [CrossRef]
- Falschlunger, L.M.; Eisl, C.; Losbichler, H.; Greil, A.M. Impression management in annual reports of the largest European companies: A longitudinal study on graphical representations. J. Appl. Account. Res. 2015, 16, 383–399. [Google Scholar] [CrossRef]
- Cho, C.H.; Michelon, G.; Patten, D.M. Impression management in sustainability reports: An empirical investigation of the use of graphs. Account. Public Interest 2012, 12, 16–37. [Google Scholar] [CrossRef]
- Uyar, A. An analysis of graphic disclosure in annual reports: The case of Turkey. Manag. Audit. J. 2009, 24, 423–444. [Google Scholar] [CrossRef]
- Merkl-Davies, D.M.; Brennan, N.M. A conceptual framework of impression management: New insights from psychology, sociology and critical perspectives. Account. Bus. Res. 2011, 41, 415–437. [Google Scholar] [CrossRef]
- Leary, M.R.; Kowalski, R.M. Impression management: A literature review and two-component model. Psychol. Bull. 1990, 107, 34–37. [Google Scholar] [CrossRef]
- Goffman, E. The Presentation of Self in Everyday Life; Doubleday: New York, NY, USA, 1959. [Google Scholar]
- Guadagno, R.E.; Cialdini, R.B. Gender differences in impression management in organizations: A qualitative review. Sex Roles 2007, 56, 483–494. [Google Scholar] [CrossRef]
- Solomon, J.F.; Solomon, A.; Joseph, N.L.; Norton, S.D. Impression management, myth creation and fabrication in private social and environmental reporting: Insights from Erving Goffman. Account. Organ. Soc. 2013, 38, 195–213. [Google Scholar] [CrossRef]
- Shah, T.; Mulla, Z.R. Leader motives, impression management, and charisma: A comparison of Steve Jobs and Bill Gates. Manag. Labour Stud. 2013, 38, 155–184. [Google Scholar] [CrossRef]
- Bozeman, D.P.; Kacmar, K.M. A cybernetic model of impression management processes in organizations. Organ. Behav. Hum. Decis. Process. 1997, 69, 9–30. [Google Scholar] [CrossRef]
- Rosenfeld, P.; Booth-Kewley, S.; Edwards, J.E.; Thomas, M.D. Responses on computer surveys: Impression management, social desirability, and the big brother syndrome. Comput. Hum. Behav. 1996, 12, 263–274. [Google Scholar] [CrossRef]
- Tedeschi, J.T.; Riess, M. Identities, the phenomenal self, and laboratory research. In Impression Management Theory and Social Psychological Research; Tedeschi, J.T., Ed.; Academic Press: New York, NY, USA, 1981; pp. 3–22. [Google Scholar]
- Crittenden, K.S.; Bae, H. Self-effacement and social responsibility: Attribution as impression management in Asian cultures. Am. Behav. Sci. 1994, 37, 653–671. [Google Scholar] [CrossRef]
- Kacmar, K.M.; Carlson, D.S. Using impression management in women’s job search processes. Am. Behav. Sci. 1994, 37, 682–696. [Google Scholar] [CrossRef]
- Sandberg, M.; Holmlund, M. Impression management tactics in sustainability reporting. Soc. Responsib. J. 2015, 11, 677–689. [Google Scholar] [CrossRef]
- Highhouse, S.; Brooks, M.E.; Gregarus, G. An organizational impression management perspective on the formation of corporate reputations. J. Manag. 2009, 35, 1481–1493. [Google Scholar] [CrossRef]
- Tyler, J.M.; Connaughton, S.L.; Desrayaud, N.; Fedesco, H.N. Organizational impression management: Utilizing anticipatory tactics. Basic Appl. Soc. Psychol. 2012, 34, 336–348. [Google Scholar] [CrossRef]
- Terrell, K.H.; Kwok, L. Organizational impression management behaviors in social media: A perspective of a social networking site. In Proceedings of the 16th Graduate Student Research Conference in Hospitality and Tourism, Houston, TX, USA, 6–8 January 2011; Available online: https://scholarworks.umass.edu/gradconf_hospitality/2011/Presentation/48/ (accessed on 21 April 2018).
- Talbot, D.; Boiral, O. Strategies for climate change and impression management: A case study among Canada’s large industrial emitters. J. Bus. Ethics 2015, 132, 329–346. [Google Scholar] [CrossRef]
- Godfrey, J.; Mather, P.; Ramsay, A. Earnings and impression management in financial reports: The case of CEO changes. Abacus 2003, 39, 95–123. [Google Scholar] [CrossRef]
- Merkl-Davies, D.M.; Brennan, N.M.; McLeay, S.J. Impression management and retrospective sense-making in corporate narratives: A social psychology perspective. Account. Audit. Account. J. 2011, 24, 315–344. [Google Scholar] [CrossRef]
- Beattie, V.; Jones, M.J. Impression management: The case of inter-country financial graphs. J. Int. Account. Audit. Tax. 2000, 9, 159–183. [Google Scholar] [CrossRef]
- Hooghiemstra, R. Corporate Communication and Impression Management—New Perspectives Why Companies Engage in Corporate Social Reporting. J. Bus. Ethics 2000, 27, 55–68. [Google Scholar] [CrossRef]
- Bansal, P.; Kistruck, G. Seeing is (not) believing: Managing the impressions of the firm’s commitment to the natural environment. J. Bus. Ethics 2006, 67, 165–180. [Google Scholar] [CrossRef]
- Higgins, C.; Walker, R. Ethos, logos, pathos: Strategies of persuasion in social/environmental reports. Account. Forum 2012, 36, 194–208. [Google Scholar] [CrossRef]
- Jones, E.E.; Pittman, T.S. Toward a general theory of strategic self-presentation. Psychol. Perspect. Self 1982, 1, 231–262. [Google Scholar]
- Cooper, S.; Slack, R. Reporting practice, impression management and company performance: A longitudinal and comparative analysis of water leakage disclosure. Account. Bus. Res. 2015, 45, 801–840. [Google Scholar] [CrossRef]
- Mohamed, A.A.; Gardner, W.L.; Paolillo, J.G. A taxonomy of organizational impression management tactics. J. Compet. Stud. 1999, 7, 108–130. [Google Scholar]
- Schlenker, B.R. Impression Management: The Self-Concept, Social Identity, and Interpersonal Relations; Brooks/Cole: Montery, CA, USA, 1980. [Google Scholar]
- Knouse, S.B. Impressions of the resume: The effects of applicant education, experience, and impression management. J. Bus. Psychol. 1994, 9, 33–45. [Google Scholar] [CrossRef]
- Beattie, V.; Jones, M. Corporate reporting using graphs: A review and synthesis. J. Account. Lit. 2008, 27, 71–110. [Google Scholar]
- Steinbart, P.J. The auditor’s responsibility for the accuracy of graphs in annual reports: Some evidence of the need for additional guidance. Account. Horiz. 1989, 3, 60–70. [Google Scholar]
- Mather, P.; Ramsay, A.; Serry, A. The use and representational faithfulness of graphs in annual reports: Australian evidence. Aust. Account. Rev. 1996, 6, 56–63. [Google Scholar] [CrossRef]
- Stanton, P.; Stanton, J.; Pires, G. Impressions of an annual report: An experimental study. Corp. Commun. Int. J. 2004, 9, 57–69. [Google Scholar] [CrossRef]
- Winter, S.J.; Saunders, C.; Hart, P. Electronic window dressing: Impression management with websites. Eur. J. Inf. Syst. 2003, 12, 309–322. [Google Scholar] [CrossRef]
- Connolly-Ahern, C.; Broadway, S.C. The importance of appearing competent: An analysis of corporate impression management strategies on the World Wide Web. Public Relat. Rev. 2007, 33, 343–345. [Google Scholar] [CrossRef]
- Brennan, N.M.; Guillamon-Saorin, E.; Pierce, A. Methodological Insights: Impression management: Developing and illustrating a scheme of analysis for narrative disclosures—A methodological note. Account. Audit. Account. J. 2009, 22, 789–832. [Google Scholar] [CrossRef]
- Beattie, V.; Jones, M.J. The use and abuse of graphs in annual reports: Theoretical framework and empirical study. Account. Bus. Res. 1992, 22, 291–303. [Google Scholar] [CrossRef]
- Havemo, E. Visual trends in the annual report: The case of Ericsson 1947–2016. Corp. Commun. Int. J. 2018, 23, 312–325. [Google Scholar] [CrossRef]
- Pesci, C.; Costa, E.; Soobaroyen, T. The forms of repetition in social and environmental reports: Insights from Hume’s notion of ‘impressions’. Account. Bus. Res. 2015, 45, 765–800. [Google Scholar] [CrossRef]
- Elsbach, K.D.; Sutton, R.I. Acquiring organizational legitimacy through illegitimate actions: A marriage of institutional and impression management theories. Acad. Manag. J. 1992, 35, 699–738. [Google Scholar]
- Courtis, J.K. Annual report readability variability: Tests of the obfuscation hypothesis. Account. Audit. Account. J. 1998, 11, 459–472. [Google Scholar] [CrossRef]
- Beattie, V.; Jones, J.M. Australian financial graphs: An empirical study. Abacus 1999, 35, 46–76. [Google Scholar] [CrossRef]
- Beattie, V.; Dhanani, A.; Jones, M.J. Investigating presentational change in UK annual reports: A longitudinal perspective. J. Bus. Commun. 2008, 45, 181–222. [Google Scholar] [CrossRef]
- Laidroo, L.; Tamme, N. Graphs in Annual Reports of Banks: Trustworthy or Not? In Business Challenges in the Changing Economic Landscape—Volume 1; Springer: Cham, Switzerland, 2016; pp. 147–166. [Google Scholar]
- Cho, C.H.; Michelon, G.; Patten, D.M. Enhancement and obfuscation through the use of graphs in sustainability reports: An international comparison. Sustain. Account. Manag. Policy J. 2012, 3, 74–88. [Google Scholar] [CrossRef]
- Mather, D.; Mather, P.; Ramsay, A. An investigation into the measurement of graph distortion in financial reports. Account. Bus. Res. 2005, 35, 147–160. [Google Scholar] [CrossRef]
- Muiño, F.; Trombetta, M. Does graph disclosure bias reduce the cost of equity capital? Account. Bus. Res. 2009, 39, 83–102. [Google Scholar] [CrossRef]
- Beattie, V.; Jones, M.J. Measurement distortion of graphs in corporate reports: An experimental study. Account. Audit. Account. J. 2002, 15, 546–564. [Google Scholar] [CrossRef]
- Anadolu Efes Sustainability Report. 2017. Available online: http://www.anadoluefes.com/dosya/surdurulebilirlikraporu_in/Anadolu_Efes_Surdurulebilirlik_Raporu_EN12112018.pdf (accessed on 21 May 2018).
- THY Sustainability Report. 2017. Available online: https://investor.turkishairlines.com/documents/ThyInvestorRelations/download/yillik_raporlar/surdur-2017-2.pdf (accessed on 21 May 2018).
- Otokar Sustainability Report. 2017. Available online: https://www.otokar.com/en-us/corporate/sustainable/Documents/Otokar_Sustainability_Report_2017.pdf (accessed on 21 May 2018).
- Şişecam Sustainability Report. 2017. Available online: http://www.sisecam.com.tr/sites/catalogs/en/Documents/sustainability/Sisecam_SR2017_ENG_3107.pdf (accessed on 21 May 2018).
© 2020 by the authors. Licensee MDPI, Basel, Switzerland. This article is an open access article distributed under the terms and conditions of the Creative Commons Attribution (CC BY) license (http://creativecommons.org/licenses/by/4.0/).