Abstract
Road lighting systems require a significant amount of electric energy. To compensate for the utilized energy, the concept of a nanogrid road lighting system is presented. A solar panel is installed on the top of a lighting pole to generate electric power. In this research, a photovoltaic simulator (PV simulator), which is used to simulate solar behavior such as current, voltage, and power based on temperature and solar irradiance levels, is employed to replace a solar panel. In the nanogrid system, grid-connected and stand-alone micro-inverters are employed to convert the electric power. The inverters comprise switching devices that can generate electromagnetic interference (EMI) when operating, which is harmful to the grid system and the electrical equipment. In general, EMI has been studied and reduced in electrical appliances, which only receive electric power. However, for the nanogrid system, which supplies electricity to the grid system, there is less study on the EMI topic because the usage is still not widespread. In the future, the nanogrid system will be widely used delivering high power directly into the electrical grid system. Therefore, the study and attenuation of EMI in the nanogrid system are very promising. Conducted emission (CE) is one form of EMI that flows through a cable connecting several appliances in the frequency range of 150 kHz to 30 MHz. CE of grid-connected and stand-alone micro-inverters have high levels in the low-frequency range between 150 kHz–5 MHz and then decreases steadily. CE attenuation is important for this inverter in a solar power system. This research studies the effect of CE mitigation on the nanogrid system. The result is compared with the Comité International Spécial des Perturbations Radio (CISPR) 14-1 standard. Finally, the passive EMI filter can reduce CE and meets the CISPR 14-1 standard.
1. Introduction
While road lighting systems require a high amount of power to operate, it is vital for road users to be able to detect people, vehicles, and other objects after sunset. A large number of lighting poles are required to illuminate roads sufficiently, and the distance between them should be minimized. The concept of creating a nanogrid road lighting system has been presented in several research studies [1,2,3,4,5,6,7,8,9,10,11,12,13]. The combination of power-generation and electrical-load systems results in a concept referred to as a nanogrid system [1], as shown in Figure 1. During the day, the solar panel generates electric power and supplies it to a battery or the grid system, either to sell or to compensate for the electric power used during the night time. In Figure 1a, the solar panels on the road lighting poles are spaced 36 m apart with a single-side arrangement. Each pole is attached to a 300 W solar panel. Thus, a nanogrid system of 1 km is equivalent to a solar farm installation of 135 m2. However, if the nanogrid road lighting system is staggered in the opposite manner, it would be equivalent to a solar farm area of approximately 270 m2. Therefore, if this nanogrid is installed over a long distance, it will eliminate the need for a solar power plant, which would waste land that could be used for agriculture or forestry. A solar farm of 1 MW requires approximately 16,000 m2, which is equivalent to 60 km in this system. In addition, this nanogrid system enhances stability in the electrical system and can be installed in a city or a nearby area to reduce power losses in the transmission and distribution lines.
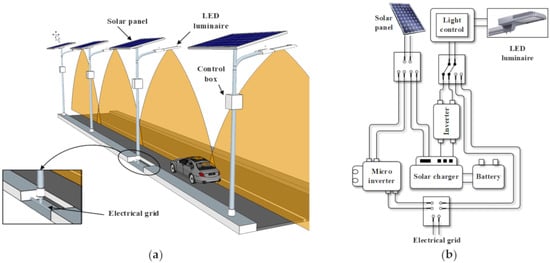
Figure 1.
The road lighting system: (a) Outline of the nanogrid road lighting system; (b) The operation of the nanogrid road lighting system.
The concept of a nanogrid system is the combination of solar power to a road lighting system, as shown in Figure 1. The nanogrid system uses a solar power system to generate electric energy, which is then either sold to the grid system or supplied to compensate for the electric power used for the road lighting system. During its normal daytime operation, shown in Figure 1b, the solar power system is connected to the electrical grid via the grid-connected micro-inverter, or sent to the battery. At night, the system supplies electric energy from the electrical grid or the battery to the road lighting system.
The solar power system is connected to the electrical grid system with an inverter. If the inverter is not effective, it will cause power quality problems to the electrical grid system. In Thailand, two agencies are responsible for the electricity distribution system—The Provincial Electricity Authority (PEA) and The Metropolitan Electricity Authority (MEA). The inverter must meet the aforementioned measurement and certification requirements to be able to be connected to the grid system and sell electricity, and the inverter manufacturer can register the inverter. However, these requirements are not measured in terms of electromagnetic interference (EMI), which is very important for the inverter because it is a switching device.
A grid-connected inverter consists of numerous switching devices, which rely on a switch and a clock. Both the switch and the clock can produce high-frequency noise (referred to as EMI), which constitutes a severe problem in several power applications, particularly in electronic and electrical equipment such as motor drivers, communication devices, and power inverters. EMI can be accompanied by conductive high-frequency currents or even higher-frequency electromagnetic waves. EMI causes several electrical problems, such as disturbances in the communication system, interference of electrical equipment connected with a conductor, and interference in the electrical protection device. Regarding the grid connection, the power quality and the EMI need to be considered because noise from the solar power system can enter the grid system and affect other electronic and electrical devices connected on the same line.
Therefore, EMI is detrimental to the electrical system and should be reduced before the system is connected to the grid system. EMI can be divided into two frequency ranges—conducted EMI within the frequency range of 150 kHz–30 MHz, and radiated EMI within the frequency range of 30 MHz–1000 MHz. Conducted EMI can be divided into two types of transmission; immunity and emission. Conducted emission (CE) is the EMI, which is created by the object and is transmitted through the power line. This can potentially cause problems since power cords are connected to the entire power distribution network [14,15]. The CE is categorized as common-mode (CM) and differential-mode (DM) [14,15]. The CM originates from the line and neutral wires of the same magnitude with a direction to the ground wire. DM noise flows from the line to the neutral wire with the same magnitude but in the opposite direction [16]. Therefore, to analyze the EMI reduction in grid systems caused by the inverter accurately and reasonably, the CE in multiple signal formats, including the CE (total mode), CM, and DM, should be considered.
Grid-connected and stand-alone micro-inverters contain switching devices that can generate the CE, which is dangerous to the grid system and the electrical equipment. In general, EMI has been studied and reduced in electrical appliances, which only receive electric power. However, for the nanogrid system, which supplies electricity to the grid system, there is less study in the EMI topic because the usage is still not widespread. In the future, the nanogrid system will be widely used and delivers high power directly into the electrical grid system. Therefore, the study and attenuation of EMI in the nanogrid system are very promising. Therefore, this research studies the CE attenuation method for grid-connected and stand-alone micro-inverters in the nanogrid system of a conventional road lighting system.
This paper is organized as follows: In Section 2, several research studies will be reviewed and analyzed to be used as a guideline for the present work. In Section 3, the experimental setup in the laboratory, and the equipment placement in the test room of the solar power system will be presented. In Section 4, the CE result and the CE attenuation method of the grid-connected system will be explained in terms of the total CE, CM, and DM. In Section 5, the CE of the stand-alone system is presented and reduced by the EMI filter. Finally, the conclusions will be presented in Section 6.
2. Literature Review
The CE causes significant electrical damages and communication malfunctions in many systems [17,18,19,20,21,22,23,24]. To reduce the CE, there are several methods [18,19,20,21,22,23,24,25,26,27,28,29,30,31,32,33,34] with different signal attenuation patterns. Each electrical system has different CE characteristics, so the CE attenuation method must be appropriately chosen for each system. The CM inductor was mentioned in the work of Hedayati and John [18], in which a 940 µH boost inductors and a 2.75 mH Integrated CM Inductor (ICMI) were used to reduce ground leakage current and EMI for a 5 kW single-phase power converter. The proposed inductor can attenuate CM and DM at low frequencies simultaneously. Jettanasen [23] presented a CM attenuated by a passive EMI Filter in an adjustable-speed alternating-current (AC) motor drive. The optimized EMI filter was compared with a commercial EMI filter; the optimized CM filter reduced CM more effectively than the commercial EMI filter used in this study. The optimization method can be applied for various filter structures (L, T, or Π; a single-stage or more) positioned at the input or output of the power converter. In the research of Akagi et al. [20], the CE of an inverter-driven motor was investigated. Maillet et al. [22] presented strategies to reduce both the DM and CM using a passive EMI filter in a DC-fed motor drive. A new integrated inductor structure was proposed, in which both CM and DM inductances were integrated, taking advantage of the available window area of the CM choke. Typically, the integrated inductor structure comprises a larger DM inductance than the multilayer winding structure owing to the existence of a DM core; therefore, the filter with this type of structure is more suitable for a power electronics system with high DM noise. When the DM noise is sufficiently low, such that a multilayer winding structure can provide enough DM inductance for DM noise attenuation, a multilayer winding structure would be a better choice. The minimization of EMI using passive filters was studied in [25], with a focus on the equipment in the filter. A study was conducted on the distribution of electromagnetic fields around the CM choke co-ordinates on a three-dimensional axis at 500 kHz, 20 MHz, and 30 MHz; it was found that the CM choke orientation affected the attenuation performance. Kotny et al. [26] presented a new design method of EMI filters for power converters using high-frequency models of passive components. To reduce CE, EMI filters were used. In general, the design of such filters is very difficult, because it requires complete mastery of the design process. A new EMI-filter design method based on the optimization of stray elements was proposed, and. it was based on the analysis of conducted EMI, which had been induced by a DC-DC converter. Kumar et al. [28] proposed the use of an inductor, choke, and pi filters to reduce the CM and DM noise of conducted EMI. The inductor and choke filter removed the CM noise, and the pi filter removed the DM noise. In the research of Giglia et al. [28], the automatic EMI filter design for the power converters was presented. Two study cases (induction motor load and resistive load) were investigated for minimum volume and weight EMI filter. The CE attenuation result respect the standard limit, and EMI filters weight/volume were halved from the commercial filter. In Zhu’s research [29], the CE of the boost power factor correction converter was reduced by passive EMI filter compared with the EN55014-1 standard. CM and DM were analyzed and discussed in detail to design the EMI filter. The research of Subramaniam et al. [31] presented the CM reduction in the three-phases grid-tie inverter. The result showed that the harmonic injection method reduced CMV and CMC by 60%. The active power filter (APF) was used to suppress the DM in the nonlinear load power system in the research of Yu et al. [32]. The harmonic problem was solved by the APF shunt and the maximum frequency deviation equal to 800 Hz. Zhai et al. [33] presented CE prediction and mitigation strategies based on the transfer function of a high-low voltage DC-DC converter in electric vehicles. The system was simulated by the Matlab software and Computer Simulation Technology (CST). The CE was lower than the limit of the CISPR 25 standard (GB/T 18655-2010). The comparison between the proposed study and past research is summarized, as shown in Table 1.

Table 1.
Comparison of literature reviews.
For this research, the CE attenuation for grid-connected and stand-alone micro-inverters was presented to reveal the suitable CE reduction method for the solar power system in the nanogrid system of the road lighting system. In the literature reviews, there have less the CE attenuation for grid-connected and stand-alone solar power systems and the effect of each CE attenuation parameter. Therefore, this work applied the CE attenuation methods, which are the popular methods to consider the effect of each method and compare each CE attenuation parameter of passive EMI filters to the CE attenuation.
3. The Conducted Emission Measuring Method
The CE was measured in a shielded room. As shown in Figure 2, the arrangement of the equipment conforms with the CISPR 14-1 standard [17,18,19,20,21,35,36,37,38]. The shielded room consists of a measuring zone (in front of the shielded room) and an operating zone (inside the shielded room). The measured signals are received by an EMI receiver and then, by a computer (Numbers 3 and 4 in Figure 2a). Next, they are shown on an EMI display (Number 2 in Figure 2a). A closed-circuit television (CCTV) system is used to monitor the shielded room during the test, as shown in Number 1 of Figure 2a.
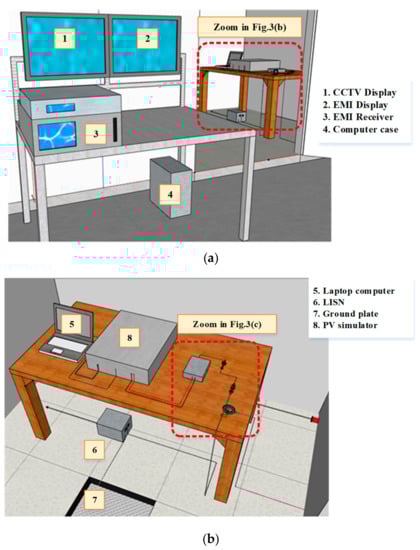
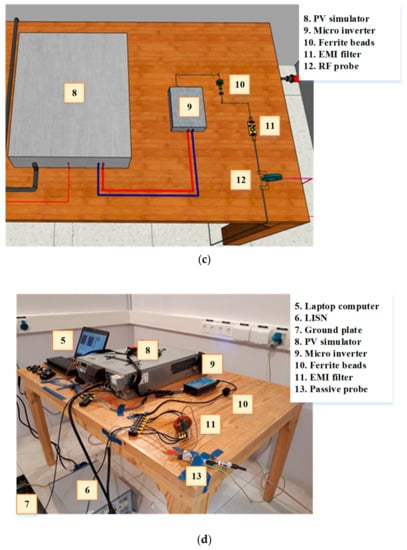
Figure 2.
Equipment placement in the shielded room. (a) Shielded room of the Conducted Emission (CE) test. (b) Experimental setup in a shielded room. (c) Equipment layout in the CE test [21]. (d) The actual shielded room during the test.
In the operating zone, the experimental setup is placed on a wooden table [21]. Three-phase alternating current is supplied to the PV simulator (8 in Figure 2b,c) for DC power generation. A laptop (5 in Figure 2b,d) is used to control the PV curve and the irradiance profile of the DC. Next, the DC is sent to the inverter (9 in Figure 2c,d)) and is converted into a single-phase AC. The AC flows through the EMI block device—which is the line impedance stabilization network (LISN) (6 in Figure 2b,d)—to the electrical grid. The LISN is used to block noise from the electrical grid system and send them to the ground via the ground plate, as shown in 7 in Figure 2b,d.
This research is focused on the EMI attenuation method; therefore, the EMI canceling devices, which consist of ferrite beads and passive EMI filters, are used to attenuate the CE, as shown in 10 and 11 in Figure 2c,d. The attenuated CE signal is measured at the output of the EMI canceling devices using a passive probe and a radio-frequency current probe (RF probe). The passive probe measures the CE, as shown in 13 in Figure 2d. The RF probe measures the CM and a DM, as shown in 12 in Figure 2c.
Regarding CE tests, CE standards are very important to domestic and international customers. The CE magnitude was compared with the one prescribed in the CE standard, which depends on the type of tested device and the country of the customer. In each country, most commercial products must conform to several standards, such as the International Standard, European Standard, and the Thai Industrial Standard (TIS). In this research, the Household Appliances, Electric Tools, and Similar Apparatus Standard (CISPR14-1) was employed [34] to be compared with the results because the CE was measured at the AC side, which met this CISPR14-1 standard. The CISPR14 [34] and EN55014 [15] standards provide approximate values; however, the CISPR 14-1 standard provides a lower value. Therefore, if signals would meet the EN55014, they would meet the CISPR 14-1 as well. The CISPR14-1 and EN55014-1 standards are listed in Table 2 and Table 3, respectively, in terms of the quasi-peak line (QP) and the average line (AV).
Table 2.
Comparison of the results with the Comité International Spécial des Perturbations Radio (CISPR) 14-1 standard [34].
Table 3.
System calibration before test using the EN55014-1 standard [15].
In this research, the grid-connected inverter was assumed to be the cause of CE in the solar power system. To prove this assumption, the CE of the input and output of the inverter was measured to ensure that the CE results of this work were generated by the grid-connected inverter alone. DC from the PV simulator (Figure 3a) and single-phase AC from the shielded room (Figure 3b)—which are the input and output side of the inverter, respectively—were measured to be compared with the EN 55014-1 standard [15]. It was found that the CE from both sides was lower than the one of the EN55014-1 standard within the 150 kHz–30 MHz range. Within the 15–27 MHz range, the EMI of the DC signal (the input of the inverter) rippled to 37 dB(µV); however, it slightly affected the results of this research. The limit of the EN55014-1 standard is lower than that of the CISPR 14-1. If the CE meets the EN 55014-1 standard, it will meet the CISPR 14-1 as well. Therefore, this would ensure that the resulting CE would have only been caused by the grid-connected inverter.
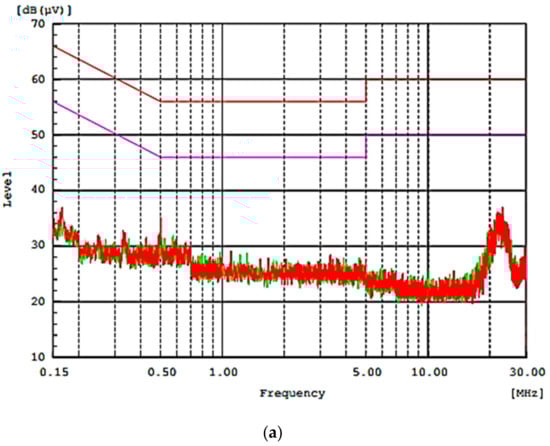
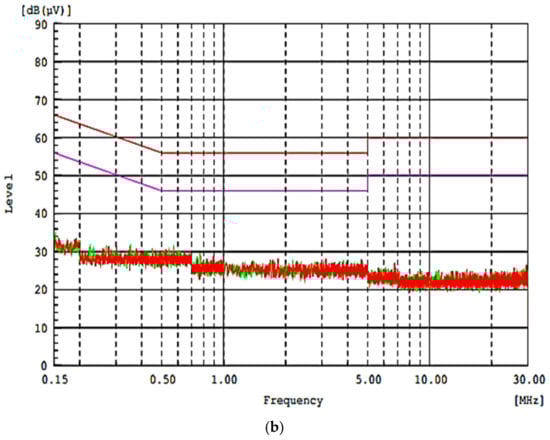
Figure 3.
The CE of the Photovoltaic (PV) simulator and shielded room: (a) The CE of the PV simulator from the DC interference measurement point; (b) The CE of the shielded room from the Alternating Current (AC) interference measurement point.
The CE is classified into two modes: the CM, and the DM. The CM is caused by the CE in phase and neutral lines flow into the ground line and return to the power source; the DM is caused by the CE from the phase line flows into the neutral line and return to the power source by the neutral line. For the measurement of both the CM and the DM, a Radio Frequencies (RF) current probe (10 kHz–1 GHz) was used to hook the phase line and the neutral line to the AC output side of the micro-inverter, as shown in Figure 4.
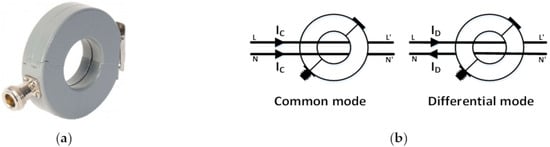
Figure 4.
Measurement of CM and Differential-Mode (DM): (a) An RF current probe (10 kHz–1 GHz); (b) Measurement method for the CM and DM.
4. The Conducted Emission of the Grid-Connected System
The grid-connected system in the nanogrid system was simulated by means of an experimental setup, as shown in Figure 5. A solar panel was replaced by a PV simulator as a DC supply. The DC is converted into AC via a single-phase grid-connected micro-inverter and then sent to the electrical grid system. The inverter consists of several switching devices. Different switching frequencies can cause EMI in the electrical grid system. The CE within the frequency range of 150 kHz–30 MHz accounts for most of the EMI generated from the solar power system with inverters. Therefore, this research is focused on CE attenuation of the single-phase grid-connected micro-inverter.
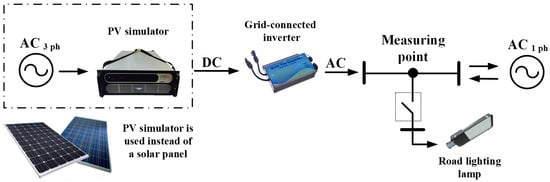
Figure 5.
The experimental setup of a solar power system.
The power quality of this system depended on the inverter output; it is 223 V 0.83 A 50.009 Hz alternating current. Voltage harmonics of this system were compared with the power grid system connection requirements of the Metropolitan Electricity Authority (MEA), as shown in Table 4. The harmonic results showed that all orders of the voltage harmonic passed the power grid system connection requirements of the Metropolitan Electricity Authority (MEA), and the total harmonic distortion voltage is 1.1 percentage. Therefore, the power quality of this inverter passed the standard for the grid-connected system; the CE was considered next.
Table 4.
Voltage harmonics of the grid-connected micro-inverter output.
4.1. The EMI Filter Design for the Grid-Connected System
Grounding and ferrite beads can reduce the CE slightly. Each method affects the CE within a different frequency range; therefore, the design of an appropriate filter is highly important. In this research, five passive EMI filters were designed by using two circuit configurations (with and without DM choke; LDM), as shown in Figure 6.
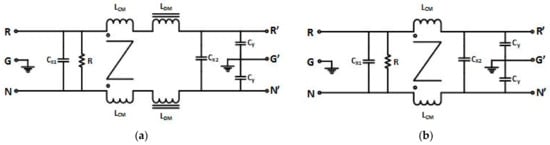
Figure 6.
Two passive Electromagnetic interference (EMI) filter forms: (a) A passive EMI filter with a DM choke; (b) A passive EMI filter without a DM choke.
The CE was divided into two modes: the CM and DM. The CM was attenuated using a CM choke (LCM) and two CM capacitors (CY). The DM was attenuated using two DM chokes (LDM), two DM capacitors (CX), half of the CM capacitor ((1/2) × CY), and leakage inductance of the CM choke (Lleakge) [28]. The half of the CM capacitor ((1/2) × CY) yields a very small value compared with that of the DM capacitor; hence, it was not used to calculate the EMI filter.
For the EMI filter design, the circuit form depicted in Figure 6 was selected. All parameters were first calculated from the CM, as shown in Figure 7 because the CM choke (LCM) affected the leakage inductance (Lleakge), which was used to calculate the DM choke (LDM). Therefore, the design step is important to avoid the overvalue of parameters.
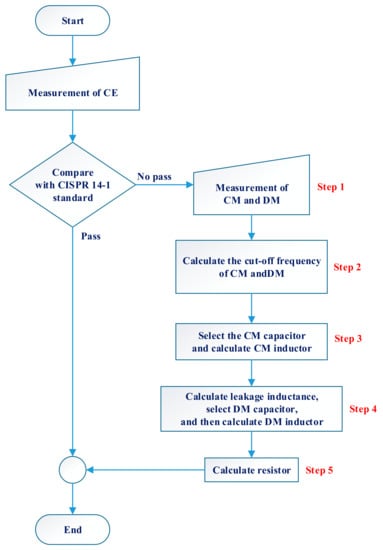
Figure 7.
Design process diagram of passive EMI filters.
The CM calculation starts by setting the cut-off frequency from the CM graph result before CE attenuation, as indicated by Step 2 in Figure 7, and by selecting the CM capacitance (CY). The CM capacitor should be a ceramic capacitor of less than 3.3 nF. Then, as per Step 3 in Figure 7, the CM choke (LCM) is calculated according to Equation (1) [16,38].
Next, the leakage inductance of the CM choke (Lleakge) is estimated from the CM choke (LCM). The value of the leakage inductance is approximately 0.5–2% of that of the CM choke [39,40,41] (typically, approximately 1.5%), according to Equation (2) [16,38].
The DM calculation starts by setting the DM cut-off frequency and by selecting the DM capacitance (CX). The DM inductance (LD) is calculated according to Equation (3) [16,38] as indicated by Step 4 in Figure 7.
As shown in Equation (4) [16,38], the value of the DM choke is half of that of the difference between the DM inductance and the leakage inductance.
Finally, as per Step 5 in Figure 7, the resistance is calculated using Equation (5) [16,38] for the discharge DM capacitors in the filter.
Which
- fR,CM is the cut-off frequency of the CM (Hz)
- fR,DM is the cut-off frequency of the DM (Hz)
- LCM is the CM chock (H)
- Lleakge is the leakage inductance of the CM chock (H)
- LDM is the DM chock (H)
- LD is the DM inductance (H)
- CY is the CM capacitor (F)
- CX is the DM capacitor (CX = CX1 = CX2) (F)
- R is the resistor (Ω)
The EMI filters are calculated using Equations (1)–(5). The following parameters are listed in Table 5; The CM and DM cut-off frequencies (fR,CM and fR,DM), CM choke (LCM), CM capacitance (CY), the leakage inductance of the CM choke (Lleakge), DM choke (LDM), DM capacitance (CX), and the resistance (R).
Table 5.
Parameters of passive EMI filters.
Five models of passive EMI filters were designed in two configurations by using different parameters to compare the effects of the CE, as summarized in Table 6. The CM and DM in the CM and DM graph result before CE attenuation are used to find the cut-off frequencies of the CM and DM (fR,CM and fR,DM); then, the parameters are calculated using Equations (1)–(5). The EMI filter without LDM is used in Models 1 and 2, as shown in Figure 8. The Lleakege is used as LDM to reduce the EMI filter size. On the other hand, Models 3, 4, and 5 use the EMI filter with LDM, according to [16,38,40], as shown in Figure 9. The present research focuses on finding a suitable EMI filter circuit to reduce the CE of the single-phase grid-connected inverter in the solar power system. Therefore, the parameters of each EMI filter were compared to study the CE attenuation effect.
Table 6.
The comparison of passive EMI filter parameters.
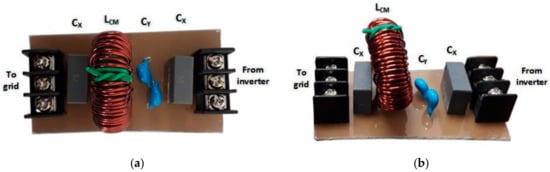
Figure 8.
The model 1 of the passive EMI filter: (a) Top side of the passive EMI filter; (b) Perspective of the passive EMI filter.
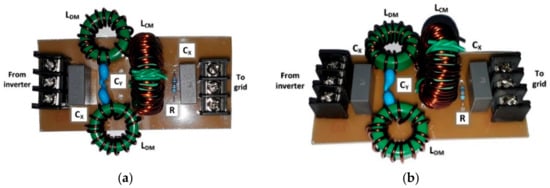
Figure 9.
The model 5 of the passive EMI filter: (a) Top side of the passive EMI filter; (b) Perspective of the passive EMI filter.
Table 6 summarizes the comparison of each EMI filter for each case. The comparison is divided into two cases: 1. a passive EMI filter with and without LDM, and 2. the reduction in the value of certain parameters. In the first case, the CE attenuation of two EMI filter pairs in Table 6 is compared, which each pair of EMI filters almost haas the same parameters; however, one filter has LDM, and the other has no LDM to study its effect on CE reduction. The effect of LDM on the CE attenuation is shown by comparing the CE attenuation results of each pair. The effect of R on the CE attenuation is shown by comparing the CE attenuation results between two pairs. In the second case, certain parameter values are reduced to half or one-third to study the effect of each parameter on CE reduction.
DM capacitors (CX) were used in the class X2 capacitor, and CM capacitors (CY) were used in class X1/Y1 capacitors, according to the IEC 60384-14 standard. In addition, a resistor was installed parallel to the DM capacitor (CX) in certain circuits to improve the capacitor transfer capacitance. Each filter responses to the CE attenuation in different frequencies. The attenuated results of each EMI filter are shown in terms of the CE (measured with a passive probe), CM, and DM (measured with an RF current probe) and were compared with the CISPR 14-1 standard in Section 5 to identify the best EMI filter for this system.
4.2. The Conducted Emission Attenuation of the Grid-Connected System
4.2.1. Conducted Emission
The CE of the nanogrid system was measured at the AC interference measurement point and was then compared with the CISPR 14-1 standard [34]. In Figure 10, the CE of the nanogrid system is represented as three different lines: the system without an attenuating device (solid blue line), the system with grounding (dashed red line), and the system with grounding and ferrite beads (dotted green line). The CE, which is depicted as a solid blue line in Figure 10, exceeds the CISPR 14-1 standard within the frequency range of 150 kHz–5 MHz. Therefore, the EMI attenuation is expected to increase the stability of the electrical system.
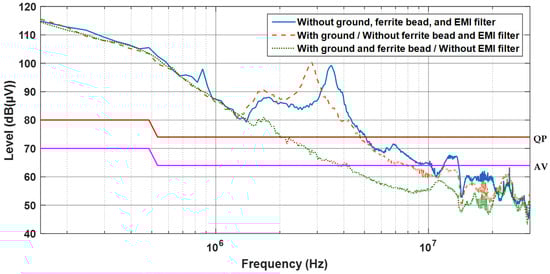
Figure 10.
The conducted emission attenuation by grounding and ferrite beads.
The CE can be attenuated using several methods, such as grounding, ferrite beads, and EMI filters. In the literature, only one EMI attenuation method is presented per research paper, often with a focus on EMI filters (passive, active, or hybrid EMI filters). Most research papers do not present the combination of several methods; however, the present research is focused on the characteristics of the CE attenuation using previously mentioned three methods, which are popular, simple, and inexpensive. To demonstrate the effect of relative attenuation, the CE attenuation methods were added sequentially. First, the grounding was connected to the ground line of the single-phase AC side and to all the frames of the equipment. The dashed red line in Figure 10 demonstrates that the CE with grounding shifts to lower frequencies; however, the CE slightly decreases.
The dotted green line in Figure 10 shows that ferrite beads are added to the output cable of the grid-connected inverter. Ferrite beads are used as a CM choke; they can reduce the CE in the frequency range of 1.5–20 MHz. Ferrite beads reduce the CE from 100 to 67 dB·(µV) at 2 MHz; however, the CE exceeds the CISPR 14-1 standard in the frequency range of 0.15–2 MHz. In Figure 11, the ferrite-bead winding fluxes have the same magnitude but the opposite direction from the DM current; hence, they cancel each other.
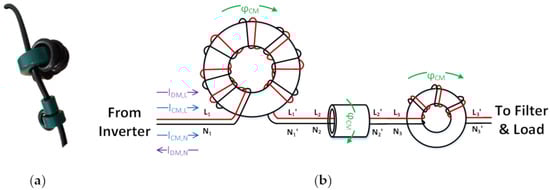
Figure 11.
Wiring of ferrite beads: (a) an actual ferrite bead model; (b) CM and DM parameters of ferrite beads.
The CE attenuation using passive EMI filters in the nanogrid system is shown in Figure 12a. The CE with ferrite beads without an EMI filter (solid blue line with stars in Figure 12a) exceeds the CISPR 14-1 standard within the 0.15–2 MHz range and has a maximum value of 115 dB(µV) at 0.15 MHz. Therefore, passive EMI filters were employed to reduce the CE in this particular frequency range.
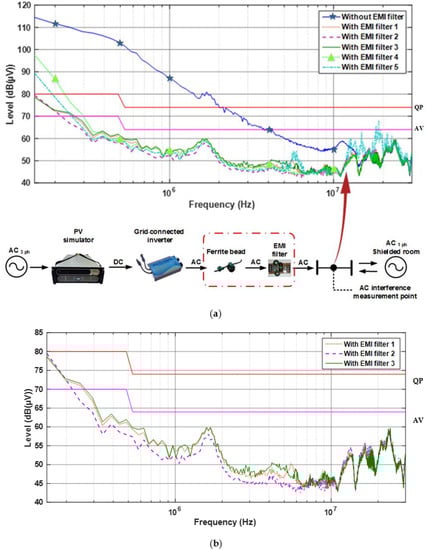
Figure 12.
CE with ferrite beads and Models 1 through 5 of the EMI filters: (a) Comparison of CE with and without each EMI filter; (b) Comparison of CE with Models 1 through 3 of the EMI filters.
Five models of passive EMI filters were designed to reduce the CE; however, the CE attenuation is different in each model. Models 1, 2, and 3 can reduce the CE by more than 40 dB(µV); thus, meeting the CISPR 14-1 standard, as indicated by the dotted red line, the dashed-dotted violet line, and the solid dark-green line in Figure 12a,b Model 2 yields the best EMI attenuation. Although it does not comprise a DM choke, the result shows that the Model 2 filter can reduce the CE more effectively. On the other hand, the CE attenuation of Models 4 and 5 is unsatisfactory because the attenuation does not meet the CISPR 14-1 standard, as indicated by the light-green dotted line with triangles and the seafoam dot-dashed line in Figure 12a. In Model 5, the CE is increased within the 15–20 MHz range.
4.2.2. Common Mode and Differential Mode
The CM and DM without ferrite beads and EMI filters are represented in Figure 13 as a dashed blue line and solid blue line, respectively. Their values are high in the low-frequency range, but they decrease steadily as the frequency increases. The CM values are lower than those of the DM. Next, the ferrite beads were connected to the system at the AC output side of the micro-inverter. The CM and DM of the system with ferrite beads are represented in Figure 13 as a double-dashed pink line and a dotted pink line, respectively; both decrease within the frequency range of 1.5–20 MHz. Figure 11 depicts the wiring of ferrite beads and shows that the DM attenuation is refuted inside the ferrite beads; however, Figure 13 confirms that ferrite beads can reduce the values of the CM and DM within the range of 1.5–20 MHz.
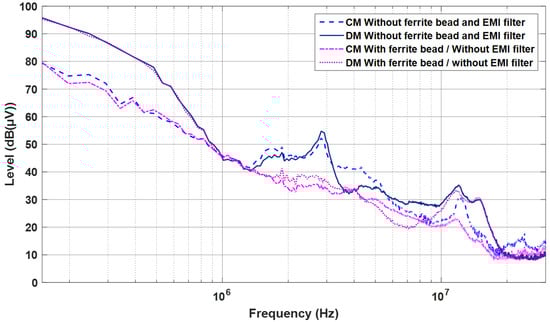
Figure 13.
CM and DM for the solar power system with and without ferrite beads.
CE decreases satisfactorily using grounding and ferrite beads; however, it still exceeds the CISPR 14-1 standard within the frequency range of 0.15–2 MHz. Therefore, passive EMI filters are required to reduce the CE further.
The aforementioned five passive EMI filters can reduce the CM and DM, as shown in Figure 14a,b. The CM of the nanogrid system with and without the five passive EMI filters are shown and compared in Figure 14: CM of the nanogrid system with Model 1 (dashed red line), CM of the nanogrid system with Model 2 (solid green line), CM of the nanogrid system with Model 3 (dot-dashed violet line), CM of the nanogrid system with Model 4 (dotted pink line), CM of the nanogrid system with Model 5 (solid blue line with triangles), and CM of the nanogrid system without an EMI filter (solid brown line with stars). In Figure 14a, the CM attenuation is compared between five EMI filters; it shows that the attenuation of Models 1, 2, and 3 is more effective than that of Models 4 and 5. The Model 2 filter—indicated by the green solid line Figure 14a—yields the best CM attenuation. In Figure 14b, the DM attenuation using Models 1 and 3 is more effective than that of Models 2, 4, and 5. Model 2 presents mediocre attenuation efficiency. Owing to the fact that the testing center in Thailand does not have standards for CM and DM testing, in this research, the CM and DM were not compared with the standards.
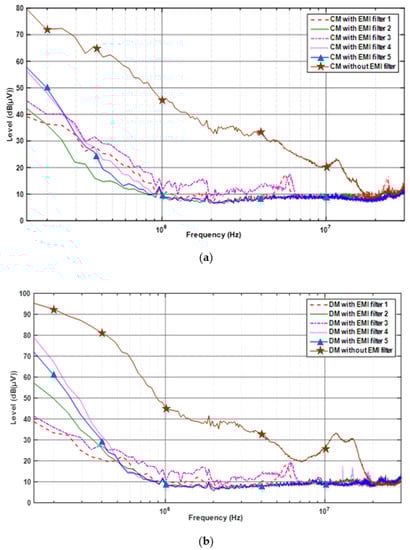
Figure 14.
CM and DM when each filter is connected: (a) The CM; (b) The DM.
In Table 6, parameters of EMI filters are compared to study the CE attenuation. In the first case, EMI filter forms are compared between EMI filters without LDM (Models 1 and 2), and the EMI filters with LDM (Models 3 and 5). The CE attenuation of the EMI filters with and without LDM show that EMI filters without LDM can reduce the CE more than the EMI filter with LDM, as shown in Figure 15a,b. Therefore, the LDM is not necessary for passive EMI filters, as shown in Figure 15. Next, the parameter reduction in the EMI filters was compared in three pairs: the values of LCM and LDM of Model 4 are half of those of Model 5; the values of LCM, CX, and CY of Model 2 are half of those of Model 1; and the values of LCM and CX of Model 5 are one-third of those of Model 4. The results presented in Figure 16a,b show that the parameter reduction has no significant effect on the CE attenuation efficiency. While increasing the number of capacitors or inductors does improve the attenuation, it increases the price of EMI filters, as shown in Figure 16.
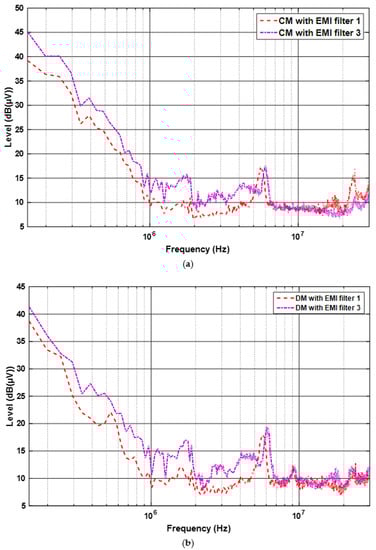
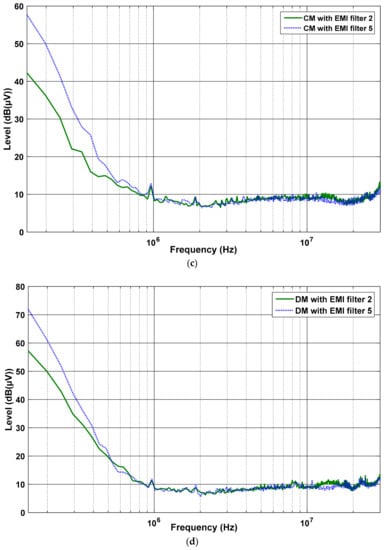
Figure 15.
Comparison of CM and DM between the EMI filters with and without different modes chock (LDM): (a) Comparison of CM between Models 1 and 3; (b) Comparison of DM between Models 1 and 3; (c) Comparison of CM between Models 2 and 5; (d) Comparison of DM between Models 2 and 5.
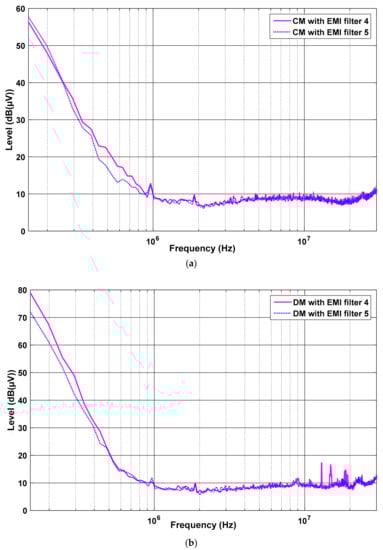
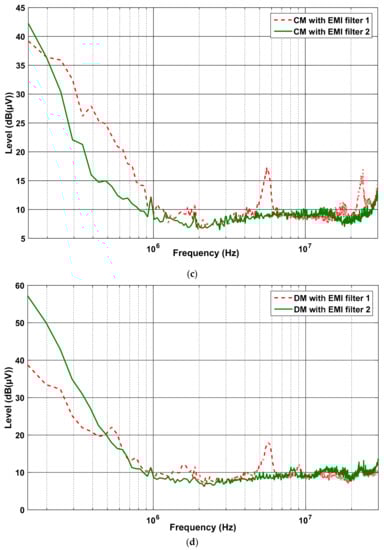
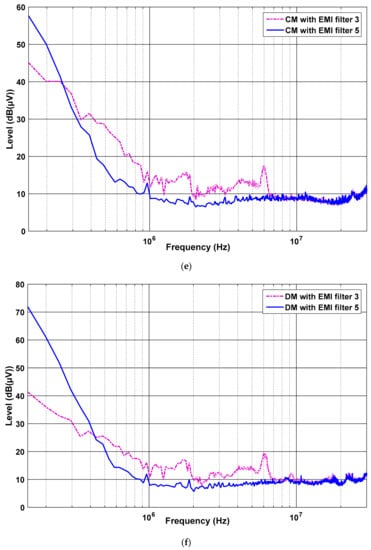
Figure 16.
Comparison of the EMI-filter parameter reduction: (a) Comparison of CM between Models 4 and 5; (b) Comparison of DM between Models 4 and 5; (c) Comparison of CM between Model 1 and 2; (d) Comparison of DM between Models 1 and 2; (e) Comparison of CM between Models 3 and 5; (f) Comparison of DM between Models 3 and 5.
Therefore, the most suitable EMI filter for the solar power grid-connected system should be considered in terms of electromagnetic compatibility and the price of filters. In this research, the results showed that Model 2 of the passive EMI filter was suitable because it could best attenuate the CE in the total mode and the CM. Model 2 had no LDM and the lowest parameter value. Therefore, Model 2 was small, had a high cut-off frequency, and achieved a good CE attenuation.
5. The Conducted Emission of the Stand-alone System
The stand-alone micro-inverter used in this research consists of metal–oxide–semiconductor field-effect transistor (MOSFET), Integrated circuit (IC) drive circuits (IR2110), microcontroller, transformer, and harmonic filter, as shown in Figure 17a. The power MOSFET was used to be a power conversion gate. 5 V and 12 V voltage sources were supplied to a microcontroller and gate driver circuit, respectively. Process control commands were used by the microcontroller. The gate driver circuit amplified the signal from the microcontroller to control the MOSFET. The output voltage was amplifying to 220 V by a transformer, and a harmonic filter was used to filter harmonic noises. The actual inverter is shown in Figure 17b.
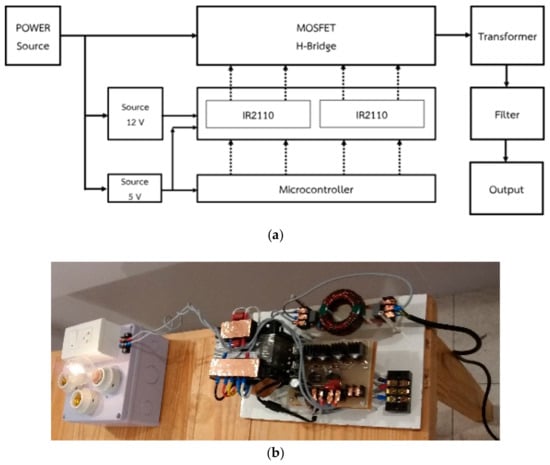
Figure 17.
The stand-alone micro-inverter: (a) Topology of the inverter; (b) Micro-inverter and incandescent lamp load.
The stand-alone micro-inverter information:
- The input DC voltage was 24 V.
- The output AC voltage was 220 Vrms.
- The rated power was 300 W.
- The alternating output frequency was 50 Hz.
- The switching frequency of MOSFET was 20,000 Hz.
- The frequency modulation (mf) was 400 Hz. (20,000 /50)
- The modulated voltage (ma) was 220 Vrms. (Load)
The micro-inverter was designed by using four IC drive circuits (IR2110), which received the control signal from the microcontroller. The four control signals were different and consisted of PWM1H, PWM1L, PWM2H, and PWM2L that used to control S1, S2, S3, and S4 MOSFET, respectively.
The purpose system was tested in the shielded room and took a long time, so it was difficult to use a solar panel as a DC voltage power supply. The 24 V lead-acid battery (two lead-acid batteries connected in series) was used instead of a solar panel. Next, in the output of the micro-inverter, the output signal from four MOSFETs had a voltage value from −24 V to 24 V in the form of the 50 Hz pulse width modulation (PWM). Finally, the output signal was converted into a 220 Vrms 50 Hz single-phase alternating voltage by the transformer and filtered the harmonic by the passive harmonic filter.
The passive harmonic filter was used to filter the harmonics of the PWM output into the sinusoidal waveform. The harmonics of the sinusoidal waveform from order 0 to 10 were shown in Table 7. In Thailand, there was not a standard for the stand-alone inverter, but there was only standard for the grid-connected inverter. Therefore, The Power Grid System Connection Requirements of The Metropolitan Electricity Authority (MEA) was used to compare with the harmonic test result.
Table 7.
Sinusoidal voltage harmonics of the micro-inverter output.
In Table 7, the resulting voltage harmonic was compared with the standard limit voltage harmonics of The Power Grid System Connection Requirements of The Metropolitan Electricity Authority (MEA). All orders of the resulting voltage harmonics passed the standard limit voltage harmonics and the total harmonics distortion voltage (THDV) was 3.035%. Therefore, the harmonic attenuation was not requested; electromagnetic emission was considered to prove next.
CE was measured at the output of the single-phase stand-alone micro-inverter in this solar power system. The measurement devices were installed according to the diagram, as shown in Figure 18. The 24 V battery was used as a direct current (DC) power supply and connected to a Line Impedance Stabilization Network (LISN). The LISN was used to block the CE form unfocused devices. The DC power was sent to the inverter and converted into alternating current (AC) power. After that, the AC power was measured at the inverter output by a passive probe and sent to the electrical load (40 W 220 V Incandescent lamp).
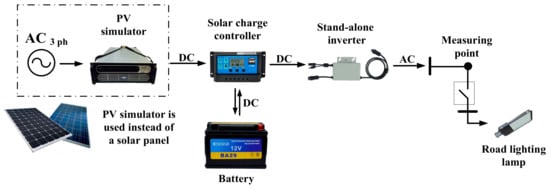
Figure 18.
Block diagram of conducted emission measurements for the stand-alone micro-inverter.
5.1. The EMI Filter Design for the Stand-alone System
The passive EMI filter was considered to provide clear behavioral EMI. Main components in passive EMI filter consist of inductors and capacitors, as shown in Figure 19:
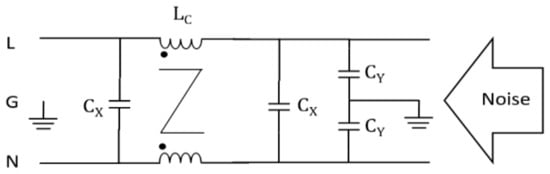
Figure 19.
Structure of passive EMI filter.
- Common Mode Choke: CM Choke: LC
- Differential Mode Choke: DM Choke: LD
- Common Mode Capacitor: CY
- Differential Mode Capacitor: CX
- Resistor: R
The CX was a Metallized Polypropylene Film Capacitor, and the CY was a Ceramic Capacitor that worked efficiently at high frequencies. Both CX and CY were tested in accordance with the International Electrotechnical Commission (IEC) 60384-14 standard (Fixed capacitors for use in electronic equipment—Part 14: Sectional specification—Fixed capacitors for electromagnetic interference suppression and connection to the supply mains).
CM choke (LC) and CY were used for reducing common mode. DM choke (LD), CX, CY, and the leakage inductance of CM choke (Lleakage) were used for reducing differential mode as shown in Figure 20.
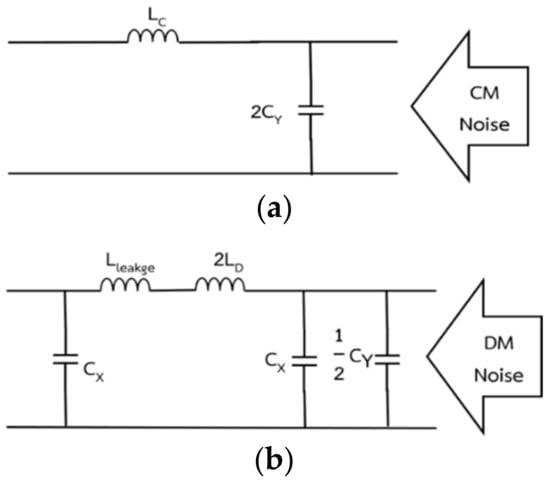
Figure 20.
Equivalent Structure of passive EMI filter: (a) Part of Common mode; (b) Part of Differential mode.
In order to explain the operation of the EMI filter circuit, the EMI filter circuit must be explained in detail in each part. The basic properties of each component are considered in the form of work. The inductor has the property of allowing low frequencies signals to pass through while also preventing high frequencies from passing through. On the other hand, the capacitor allows high frequencies to pass through, but it blocks low frequencies. Therefore, the inductor was connected in series to the system to prevent the high-frequency signals flowing through the system. The capacitor was connected between the line to ground or line to neutron so that the high-frequency signal flows back to the signal source or ground.
In Figure 20a, the CM chock (LC) blocked the CM noise from the inverter, and the CY provided a way for the CM noise to pass through to the ground. For the DM noise in Figure 20b, Lleakage and LD were used to block the DM noise, and CX and CY transmitted the DM noise through to the neutron so that the noise went back to the noise source. Inductance and capacitance values in the passive EMI filter were calculated.
The EMI filter used in the experiment setup was shown in Figure 21. A passive EMI filter with different internal parameter values was used, which is shown in Table 8.
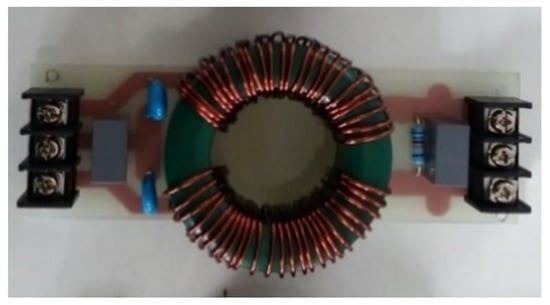
Figure 21.
Real passive EMI filter.
Table 8.
Passive component in the passive EMI filter.
5.2. The Conducted Emission of the Stand-alone System
The CE of the inverter output was measured in the line wire at the AC side by the passive probe and shown in Figure 22 and Table 9. In Figure 22a, the CE excessed the CISPR 14 standard [34]. After that, the EMI filter was installed between the stand-alone micro-inverter and the passive probe. The CE less decreased and until excessed the CISPR 14 standard [34]. The EC of the system with the EMI filter and ground could reduce the maximum and lower than the standard limit in Figure 22c.
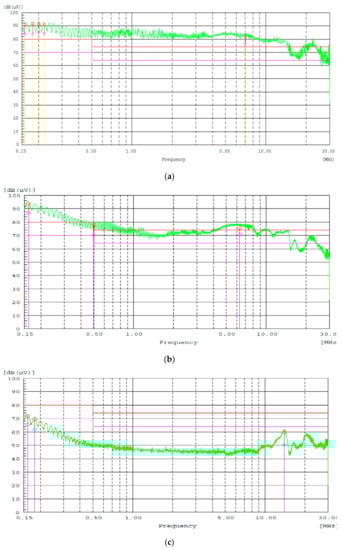
Figure 22.
The CE spectrum of the inverter output: (a) No EMI filter; (b) EMI filter; (c) EMI filter with ground.
Table 9.
The CE spectrum data of the inverter output.
Both CM and DM were shown in Figure 23. The CM was higher than the DM. The EMI filter had very little effect on both, but the ground affected the most CM devaluation. Therefore, the ground is important for CM noise attenuation.
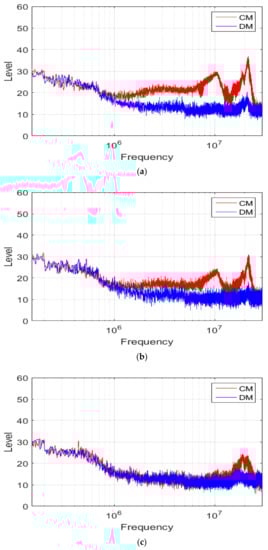
Figure 23.
Separated mode spectrum at the input of the inverter: (a) No EMI filter; (b) EMI filter; (c) EMI filter with ground.
6. Conclusions
Normally, the street lighting system consumes enormous electrical power. The electrical power is sent via a long-distance transmission line resulting in high power loss. The solar power system is chosen to solve this problem because Thailand is located near the equator and has a high solar intensity. For the solar power system, an inverter is the most important device to convert electric power. The inverter consisting of switching components has to be considered the CE. For researches in the past, the CE in the solar power system has not been studied yet, but now it is essential to be studied because this system is connected to the grid and has a significant increase in electric power generation.
In this research for the grid-connected system, the CE of the solar power system exceeds the CISPR 14-1 standard within the range of 150 kHz–5 MHz and has the highest level 115 dB(μV) at 150 kHz. The CE attenuation was presented using grounding, ferrite beads, and passive EMI filters as hybrid methods. The grounding method eliminated excessive CE from the system shifted the CE to lower frequencies. The ferrite beads attenuated the CE within the frequency range of 1.5 MHz–20 MHz from 100 to 67 dB·(µV) at 2 MHz, but the CE still exceeded the CISPR 14-1 standard within the range of 150 kHz–2 MHz. Finally, the passive EMI filters were used to reduce the CE during 150 kHz–2 MHz in this system before connected to the grid system. Five passive EMI filters were designed according to the design principle for a passive EMI filter and compared the effect of each parameter in the EMI filters. The EMI filter forms were compared between the EMI filter with and without LDM, the EMI filter without LDM reduced the CE more than the EMI filter with LDM. Next, the parameter reduction was compared in three pairs of the EMI filters; the parameter reduction had no significant effect on the CE attenuation efficiency. In the comparison result of each EMI filter, Models 1, 2, and 3 reduced the CE to meet the CISPR 14-1 standard. The model 2 was the best CE attenuation filter due to maximum efficiency and smallest size, so it was the most suitable passive EMI filter. Continuous development is required with respect to various EMI filter types, such as active and hybrid EMI filters, to enhance the EMI attenuation performance.
For the stand-alone system, the EMI of the stand-alone micro-inverter was studied and attenuated. The CE was measured in term of CE, CM, and DM. The CE result showed that, in the case of the normal system, the CE exceeded the CISPR 14 standard throughout the test frequency range. The DM was more than the CM at the output inverter. Next, the EMI filter was required to reduce the CE and installed at the output of the inverter. The EMI filter without groundless reduced the CE signal well when installing at the output side. When the ground is connected, the CE on the output side could be significantly reduced and passed the CISPR 14 standard.
Author Contributions
C.J. conceptualization, formal analysis, and design the experiment. A.N. performed the experiments, investigation and analyzed the data; C.J. funding acquisition, and A.N. contributed resource; C.J. wrote the paper, and A.N review and editing. All authors have read and agreed to the published version of the manuscript.
Funding
This research was funded by King Mongkut’s Institute of Technology Ladkrabang Research fund, Thailand grant number No. KREF025606.
Acknowledgments
The authors wish to gratefully acknowledge the financial support for this research (No. KREF025606) from King Mongkut’s Institute of Technology Ladkrabang Research fund, Thailand.
Conflicts of Interest
The authors declare no conflict of interest.
References
- Yoomak, S.; Jettanasen, C.; Ngaopitakkul, A.; Bunjongjit, S.; Leelajindakrairerk, M. Comparative study of lighting quality and power quality for LED and HPS luminaires in a roadway lighting system. Energy Build. 2018, 159, 542–557. [Google Scholar] [CrossRef]
- Tannous, S.; Manneh, R.; Harajli, H.; Zakhem, H.E. Comparative cradle-to-grave life cycle assessment of traditional grid-connected and solar stand-alone street light systems: A case study for rural areas in Lebanon. J. Clean. Prod. 2018, 186, 963–977. [Google Scholar] [CrossRef]
- Panguloori, R.B.; Mishra, P.R.; Kumar, S. Power distribution architectures to improve system efficiency of centralized medium scale PV street lighting system. Sol. Energy 2013, 97, 405–413. [Google Scholar] [CrossRef]
- Roche, O.M.; Blanchard, R.E. Design of a solar energy centre for providing lighting and income-generating activities for off-grid rural communities in Kenya. Renew. Energy 2018, 118, 685–694. [Google Scholar] [CrossRef]
- Shaahid, S.M.; Elhadidy, M.A. Opportunities for utilization of stand-alone hybrid (photovoltaic+diesel+battery) power systems in hot climates. Renew. Energy 2003, 28, 1741–1753. [Google Scholar] [CrossRef]
- Shaahid, S.M.; Elhadidy, M.A. Prospects of autonomous/stand-alone hybrid (photovoltaic+ diesel+battery) power systems in commercial applications in hot regions. Renew. Energy 2004, 29, 165–177. [Google Scholar] [CrossRef]
- Ramadhani, F.; Bakar, K.A.; Hussain, M.A.; Erixno, O.; Nazir, R. Optimization with traffic-based control for designing standalone streetlight system: A case study. Renew. Energy 2017, 105, 149–159. [Google Scholar] [CrossRef]
- Hossain, M.; Mekhilef, S.; Olatomiwa, L. Performance evaluation of a stand-alone PV-wind-diesel-battery hybrid system feasible for a large resort center in South China Sea, Malaysia. Sustain. Cities Soc. 2017, 28, 358–366. [Google Scholar] [CrossRef]
- Milosavljević, D.D.; Pavlović, T.M.; Piršl, D.S. Performance analysis of A grid-connected solar PV plant in Niš, republic of Serbia. Renew. Sustain. Energy Rev. 2015, 44, 423–435. [Google Scholar] [CrossRef]
- Bhattacharya, P.; Dey, S.; Mustaphi, B. Some Analytical Studies on the Performance of Grid Connected Solar Photovoltaic System with Different Parameters. Procedia Mater. Sci. 2014, 6, 1942–1950. [Google Scholar] [CrossRef]
- Hasan, R.; Mekhilef, S.; Seyedmahmoudian, M.; Horan, B. Grid-connected isolated PV microinverters: A review. Renew. Sustain. Energy Rev. 2017, 67, 1065–1080. [Google Scholar] [CrossRef]
- Omar, M.A.; Mahmoud, M.M. Grid connected PV-home systems in Palestine: A review on technical performance, effects and economic feasibility. Renew. Sustain. Energy Rev. 2018, 82 Pt 3, 2490–2497. [Google Scholar] [CrossRef]
- Elkholy, A.; Fahmy, F.H.; El-Ela, A.A.; Nafeh AE, S.A.; Spea, S.R. Experimental evaluation of 8kW grid-connected photovoltaic system in Egypt. J. Electr. Syst. Inf. Technol. 2016, 3, 217–229. [Google Scholar] [CrossRef]
- Han, D.; Li, S.; Wu, Y.; Choi, W.; Sarlioglu, B. Comparative Analysis on Conducted CM EMI Emission of Motor Drives: WBG Versus Si Devices. IEEE Trans. Ind. Electron. 2017, 64, 8353–8363. [Google Scholar] [CrossRef]
- Satish Kumar, M.; Jhansi Rani, A. Reduction of conducted electromagnetic interference by using filters. Comput. Electr. Eng. 2018, 72, 169–178. [Google Scholar] [CrossRef]
- Nasser, N.Y. Practical Approach in Designing Conducted EMI Filter to Mitigate and Differenctail Mode Noises in SMPS. J. Eng. Dev. 2012, 16, 164–183. [Google Scholar]
- Chen, J.; Jiang, D.; Li, Q. Attenuation of conducted EMI for three-level inverters through PWM. CPSS Trans. Power Electron. Appl. 2018, 3, 134–145. [Google Scholar] [CrossRef]
- Hedayati, M.H.; John, V. Novel Integrated CM Inductor for Single-Phase Power Converters with Reduced EMI. IEEE Trans. Ind. Appl. 2017, 53, 1300–1307. [Google Scholar] [CrossRef]
- Jettanasen, C. Passive common-mode EMI filter adapted to an adjustable-speed AC motor drive. In Proceedings of the 2010 Conference Proceedings IPEC, Singapore, 27–29 October 2010; pp. 1025–1030. [Google Scholar]
- Akagi, H.; Shimizu, T. Attenuation of Conducted EMI Emissions from an Inverter-Driven Motor. IEEE Trans. Power Electron. 2008, 23, 282–290. [Google Scholar] [CrossRef]
- Zhang, H.; Yang, L.; Wang, S.; Puukko, J. Common-Mode EMI Noise Modeling and Reduction with Balance Technique for Three-Level Neutral Point Clamped Topology. IEEE Trans. Ind. Electron. 2017, 64, 7563–7573. [Google Scholar] [CrossRef]
- Maillet, Y.; Lai, R.; Wang, S.; Wang, F.; Burgos, R.; Boroyevich, D. High-Density EMI Filter Design for DC-Fed Motor Drives. IEEE Trans. Power Electron. 2010, 25, 1163–1172. [Google Scholar] [CrossRef]
- Mohammadi, F.; Nazri, G.A.; Saif, M.A. Bidirectional Power Charging Control Strategy for Plug-in Hybrid Electric Vehicles. Sustainability 2019, 11, 4317. [Google Scholar] [CrossRef]
- Mehdipour, C.; Mohammadi, F. Design and Analysis of a Stand-Alone Photovoltaic System for Footbridge Lighting. J. Sol. Energy Res. 2019, 4, 85–91. [Google Scholar]
- Ji, J.; Chen, W.; Yang, X.; Zhang, X.; Zhi, N. A layout method of passive EMI filter. In Proceedings of the 2017 IEEE Energy Conversion Congress and Exposition (ECCE), Cincinnati, OH, USA, 1–5 October 2017; pp. 2346–2349. [Google Scholar]
- Kotny, J.L.; Duquesne, T.; Idir, N. EMI Filter design using high frequency models of the passive components. In Proceedings of the 2011 IEEE 15th Workshop on Signal Propagation on Interconnects (SPI), Naples, Italy, 8–11 May 2011; pp. 143–146. [Google Scholar]
- Ji, J.; Chen, W.; Gu, Z.; Yang, X.; Zhang, X. A control method of digital active EMI filter. In Proceedings of the 2017 IEEE Applied Power Electronics Conference and Exposition (APEC), Tampa, FL, USA, 26–30 March 2017; pp. 1141–1145. [Google Scholar]
- Giglia, G.; Ala, G.; Di Piazza, M.C.; Giaconia, G.C.; Luna, M.; Vitale, G.; Zanchetta, P. Automatic EMI Filter Design for Power Electronic Converters Oriented to High Power Density. Electronics 2018, 7, 9. [Google Scholar] [CrossRef]
- Zhu, H.; Liu, D.; Zhang, X.; Qu, F. Reliability of Boost PFC Converters with Improved EMI Filters. Electronics 2018, 7, 413. [Google Scholar] [CrossRef]
- Wu, X.; Xu, D.; Wen, Z.; Okuma, Y.; Mino, K. Design, Modeling, and Improvement of Integrated EMI Filter With Flexible Multilayer Foils. IEEE Trans. Power Electron. 2011, 26, 1344–1354. [Google Scholar] [CrossRef]
- Subramaniam, U.; Bhaskar, S.M.; Almakhles, D.J.; Padmanaban, S.; Leonowicz, Z. Investigations on EMI Mitigation Techniques: Intent to Reduce Grid-Tied PV Inverter Common Mode Current and Voltage. Energy 2019, 12, 3395. [Google Scholar] [CrossRef]
- Yu, S.; Chen, N.; Gao, L.; Zhou, H.; Huang, Y. Suppressing Conducted DM EMI in an Active Power Filter via Periodic Carrier Frequency Modulation. Energy 2019, 12, 1903. [Google Scholar] [CrossRef]
- Zhai, L.; Zhang, T.; Cao, Y.; Yang, S.; Kavuma, S.; Feng, H. Conducted EMI Prediction and Mitigation Strategy Based on Transfer Function for a High-Low Voltage DC-DC Converter in Electric Vehicle. Energy 2018, 11, 1028. [Google Scholar] [CrossRef]
- Wang, Y. Comparison of Differential-Mode and Mixed-Mode Conducted Emission for Household Appliances in Power-Line Communication System. IEEE Trans. Electromagn. Compat. 2017, 59, 2023–2028. [Google Scholar] [CrossRef]
- Morris, C.T.; Han, D.; Sarlioglu, B. Reduction of Common Mode Voltage and Conducted EMI Through Three-Phase Inverter Topology. IEEE Trans. Power Electron. 2017, 32, 1720–1724. [Google Scholar] [CrossRef]
- Jiang, D.; Shen, Z.; Wang, F. Common-Mode Voltage Reduction for Paralleled Inverters. IEEE Trans. Power Electron. 2018, 33, 3961–3974. [Google Scholar] [CrossRef]
- Hedayati, H.; John, V. EMI and ground leakage current reduction in single-phase grid-connected power converter. IET Power Electron. 2017, 10, 938–944. [Google Scholar] [CrossRef]
- Jiraprasertwong, J.; Jettanasen, C. Practical Design of a Passive EMI Filter for Reduction of EMI Generation. In Proceedings of the International Multi Conference of Engineers and Computer Scientists 2015 Vol II, IMECS 2015, Hong Kong, 18–20 March 2015. [Google Scholar]
- Nave, M.J. The Effect of Duty Cycle on SMPS Common Mode Emissions: Theory and Experiment. Procedings of the National Symposium on Electromagnetic Compatibility, Denver, CO, USA, 23–25 May 1989; pp. 211–216. [Google Scholar]
- Ott, W.H.; Nave, M.J. Power Line Filter Design for Switched-Mode Power Supplies; Chapter 5; Van Nostrand Reinhold Co.: New York, NY, USA, 1991; pp. 102–110. [Google Scholar]
- IEEE Standard Association. American National Standard Dictionary of Electromagnetic Compatibility (EMC) including Electromagnetic Environmental Effects (E3). Available online: https://ieeexplore.ieee.org/document/7096895 (accessed on 20 December 2019).
© 2019 by the authors. Licensee MDPI, Basel, Switzerland. This article is an open access article distributed under the terms and conditions of the Creative Commons Attribution (CC BY) license (http://creativecommons.org/licenses/by/4.0/).