Article

Quest for Sustainability: Life-Cycle Emissions Assessment of Electric Vehicles Considering Newer Li-Ion Batteries

by
Arminda Almeida
1,2,
Nuno Sousa
3,4 and
João Coutinho-Rodrigues
1,4,*
1
Department of Civil Engineering, Faculty of Science and Technology, University of Coimbra, 3030-788 Coimbra, Portugal
2
CITTA—Research Centre for Territory, Transports and Environment, 4200-465 Oporto, Portugal
3
Department of Sciences and Technology, Universidade Aberta, 1269-001 Lisbon, Portugal
4
INESCC—Institute for Systems Engineering and Computers at Coimbra, 3030-290 Coimbra, Portugal
*
Author to whom correspondence should be addressed.
Sustainability 2019, 11(8), 2366; https://doi.org/10.3390/su11082366
Submission received: 25 March 2019 / Revised: 15 April 2019 / Accepted: 16 April 2019 / Published: 20 April 2019
(This article belongs to the Section Sustainable Transportation)

Abstract

:
The number of battery electric vehicle models available in the market has been increasing, as well as their battery capacity, and these trends are likely to continue in the future as sustainable transportation goals rise in importance, supported by advances in battery chemistry and technology. Given the rapid pace of these advances, the impact of new chemistries, e.g., lithium-manganese rich cathode materials and silicon/graphite anodes, has not yet been thoroughly considered in the literature. This research estimates life cycle greenhouse gas and other air pollutants emissions of battery electric vehicles with different battery chemistries, including the above advances. The analysis methodology, which uses the greenhouse gases, regulated emissions, and energy use in transportation (GREET) life-cycle assessment model, considers 8 battery types, 13 electricity generation mixes with different predominant primary energy sources, and 4 vehicle segments (small, medium, large, and sport utility vehicles), represented by prototype vehicles, with both battery replacement and non-replacement during the life cycle. Outputs are expressed as emissions ratios to the equivalent petrol internal combustion engine vehicle and two-way analysis of variance is used to test results for statistical significance. Results show that newer Li-ion battery technology can yield significant improvements over older battery chemistries, which can be as high as 60% emissions reduction, depending on pollutant type and electricity generation mix.

1. Introduction

Economic growth and transport demand of the last decades have increased greenhouse gas (GHG) emissions, overall. Currently, road transport represents a total of 72%–77% emissions of the transport sector [1,2]. As passenger car registrations grow in the aftermath of the 2008 economic crisis (3.1% in 2017, as compared to 2016 [3]), cleaner technologies, such as battery electric vehicles (BEV), are a possible way to reduce the environmental impact of private transport [4]. The percentage of BEV sales has been increasing in the EU-15 countries of the ACEA (2018) study [3], representing 1.5% of sales as of 2017 (54% higher than 2016), surpassing the 3 million vehicles mark [2]. Worldwide scenarios are more optimistic, as growing BEV and hybrid plug-in global market shares show [5]. Long-term planning scenarios aim towards global vehicle fleets to be almost entirely made up of electric vehicles by 2050 [6]. Following this trend, several countries have committed to sustainable transportation goals by announcing plans to phase out internal combustion engines vehicle (ICEV) circulation in the mid-term [7].
Current BEV are almost exclusively equipped with Li-ion batteries (LIB) and this is expected to remain the technology of choice for the next decade [8,9]. Other technologies have been under study, such as lithium-sulfur and solid-state batteries [10,11,12]. However, market penetration forecasts of such technologies as of 2030 are 4% and 2%, respectively, rising only to 8% and 12% in 2035 in the forecast of Laslau [13].
Most LIB share a similar design consisting of a graphite anode, a cathode formed by a lithium metal oxide, and an electrolyte consisting of a solution of a lithium salt in a mixed organic solvent imbedded in a separator felt (see e.g., Reference [14]). LIB manufacturers have been under pressure to produce higher energy density battery packs, leading to LIB technology constantly evolving from the current battery types to more advanced ones, mainly consisting of high-voltage cathodes and high-performance anode materials and different designs [15]. As LIB technology evolves, it is important to understand what the environmental impacts are of mass-producing the corresponding battery packs and incorporating them in BEV, as it is by no means clear whether these new technologies actually represent an improvement on the status-quo.
Life-cycle assessment (LCA) is a broad methodology that can be used to account for the environmental impacts of a vehicle throughout its life. LCA includes the vehicle cycle (raw material acquisition, vehicle production, end-of-life treatment, recycling, and final disposal, i.e., cradle-to-grave) and the fuel cycle (fuel production and distribution, and vehicle operation). A standardized LCA methodology is defined in the ISO 14040 (2006) norm [16].
Narrowing down to private vehicles, the greenhouse gases, regulated emissions, and energy use in transportation (GREET) model is a methodology developed by the Argonne National Laboratory which is often used for LCA analyses [17,18,19]. Despite being calibrated mostly for the USA context, it is widely used in other regions as well. The GREET 2018 model includes LIB chemistry advances and caters for different material compositions of LIB for transport applications and the state-of-the-art of industrial production of LIB cathode materials [20]. It yields, as output, LCA emission estimates per vehicle lifetime or km traveled.
GREET provides GHG equivalent emissions, with carbon dioxide (CO2), nitrous oxide (N2O), and methane (CH4) emissions transformed into a CO2-equivalent global warming potential (GWP) (100-year time horizon GWP factors of the fifth assessment report were considered [21]), and other air pollutants, such as carbon monoxide (CO), nitrogen oxides (NOx), sulfur oxides (SOx), volatile organic compounds (VOC), particulate matter with diameters of 10 micrometers or less (PM10), and particulate matter with diameters of 2.5 micrometers or less (PM2.5). The GREET 2018 model updated vehicle emission factors from the EPA’s motor vehicle emission simulator version 2014a [20].
Studies concerning life cycle aspects of BEV exist in the literature. Nordelöf et al. [22] carried out a review article of contributions from 1998 to early 2013, following the review of Hawkins et al. [23]. Then, de Souza et al. [24] analyzed LCA studies from 2012 to 2018. They concluded that results depend on both the researchers’ purposes and approaches used.
Some articles focus on a regional context, such as in Brazil [24], China [19,25,26], UK [27], Poland and the Czech Republic [28], and South Korea [29], highlighting the role of electricity generation mix, which has been appointed as a determinant in emission estimations [22,29,30,31]. The potential reduction in emission cost and human health, resulting from charging BEV through solar charging stations, can be up to 45% and 35%, respectively [32]. Another important aspect is vehicle segment; usually, heavier vehicles cause higher emissions [22,31,33]. Woo, Choi, and Ahn [31] considered four representative vehicle categories: Subcompact, compact, full-size luxury, and sport utility vehicles (SUV). Karaaslan, Zhao, and Tatari [33], in turn, considered only SUV with different fuel options. The well-to-wheel analysis carried out by Woo, Choi, and Ahn [31], considering 70 mixes and 4 vehicle categories, shows that the mix can increase the GHG emissions up to 121%, whatever the vehicle category, and that GHG emissions tend to increase with vehicle size.
Ambrose and Kendall [34] pointed out battery chemistry as also being an important factor in emission estimations. They simulated life-cycle emissions for five commercial lithium chemistries (NCA, NMC, LMO, LFP, and LMO/LTO), concluding that GHG emissions from battery production vary in the range 197–494 kgCO2e/kwh. Hao [35] carried out LCA analyses to study GHG emissions from the production of three lithium chemistries (LFP, NMC, and LMO) in China, finding GHG emissions differences in the order of 30%.
Despite the many studies which have been conducted, they are not easily comparable, as the results depends on key assumptions, such as the vehicles, the electricity mix, the analysis boundaries, the functional unit, and the approaches and methods used. To overcome this, Peters and Weil [36] developed a common base for LCA of LIB production with different oxides (LFP, LTO, LMO, NMC, and NCA) and applied it in their review. They found significant differences regarding key assumptions. In some situations, the higher differences between studies was due to different assumptions, and less attributable to the particular battery chemistry.
The majority of the LCA have mainly been focused on GHG emissions, notwithstanding the impact of other air pollutants on the environment and human health [37,38,39].
Delivering on the need to ascertain the impact of new LIB technology, the present research uses the GREET 2018 model to conduct an LCA of the environmental impact of BEV of different segments and LIB chemistries, in terms of GHG and six other types of air pollutant emissions, in a per km traveled basis, considering several energy mixes. This research is innovative as it evaluates and statistically compares emission estimates caused by BEV with several LIB chemistries (eight in total), including future ones, using the same LCA assumptions. In addition, it considers present and future possible electricity generation mixes, taking into account not only the carbon intensity but also the primary energy source. It considers four vehicle segments, represented by prototype models, as well as both one battery replacement and no battery replacement during the vehicle lifetime.
The present study is an addition to the state-of-the-art because it presents a thorough life-cycle assessment of vehicle environmental impact assuming new LIB technologies, focusing on multiple pollutants, not just GHG, and presenting sizeable statistical results. In addition, this study considers energy generation mixes with different main energy sources which, as will be seen, can influence results considerably.

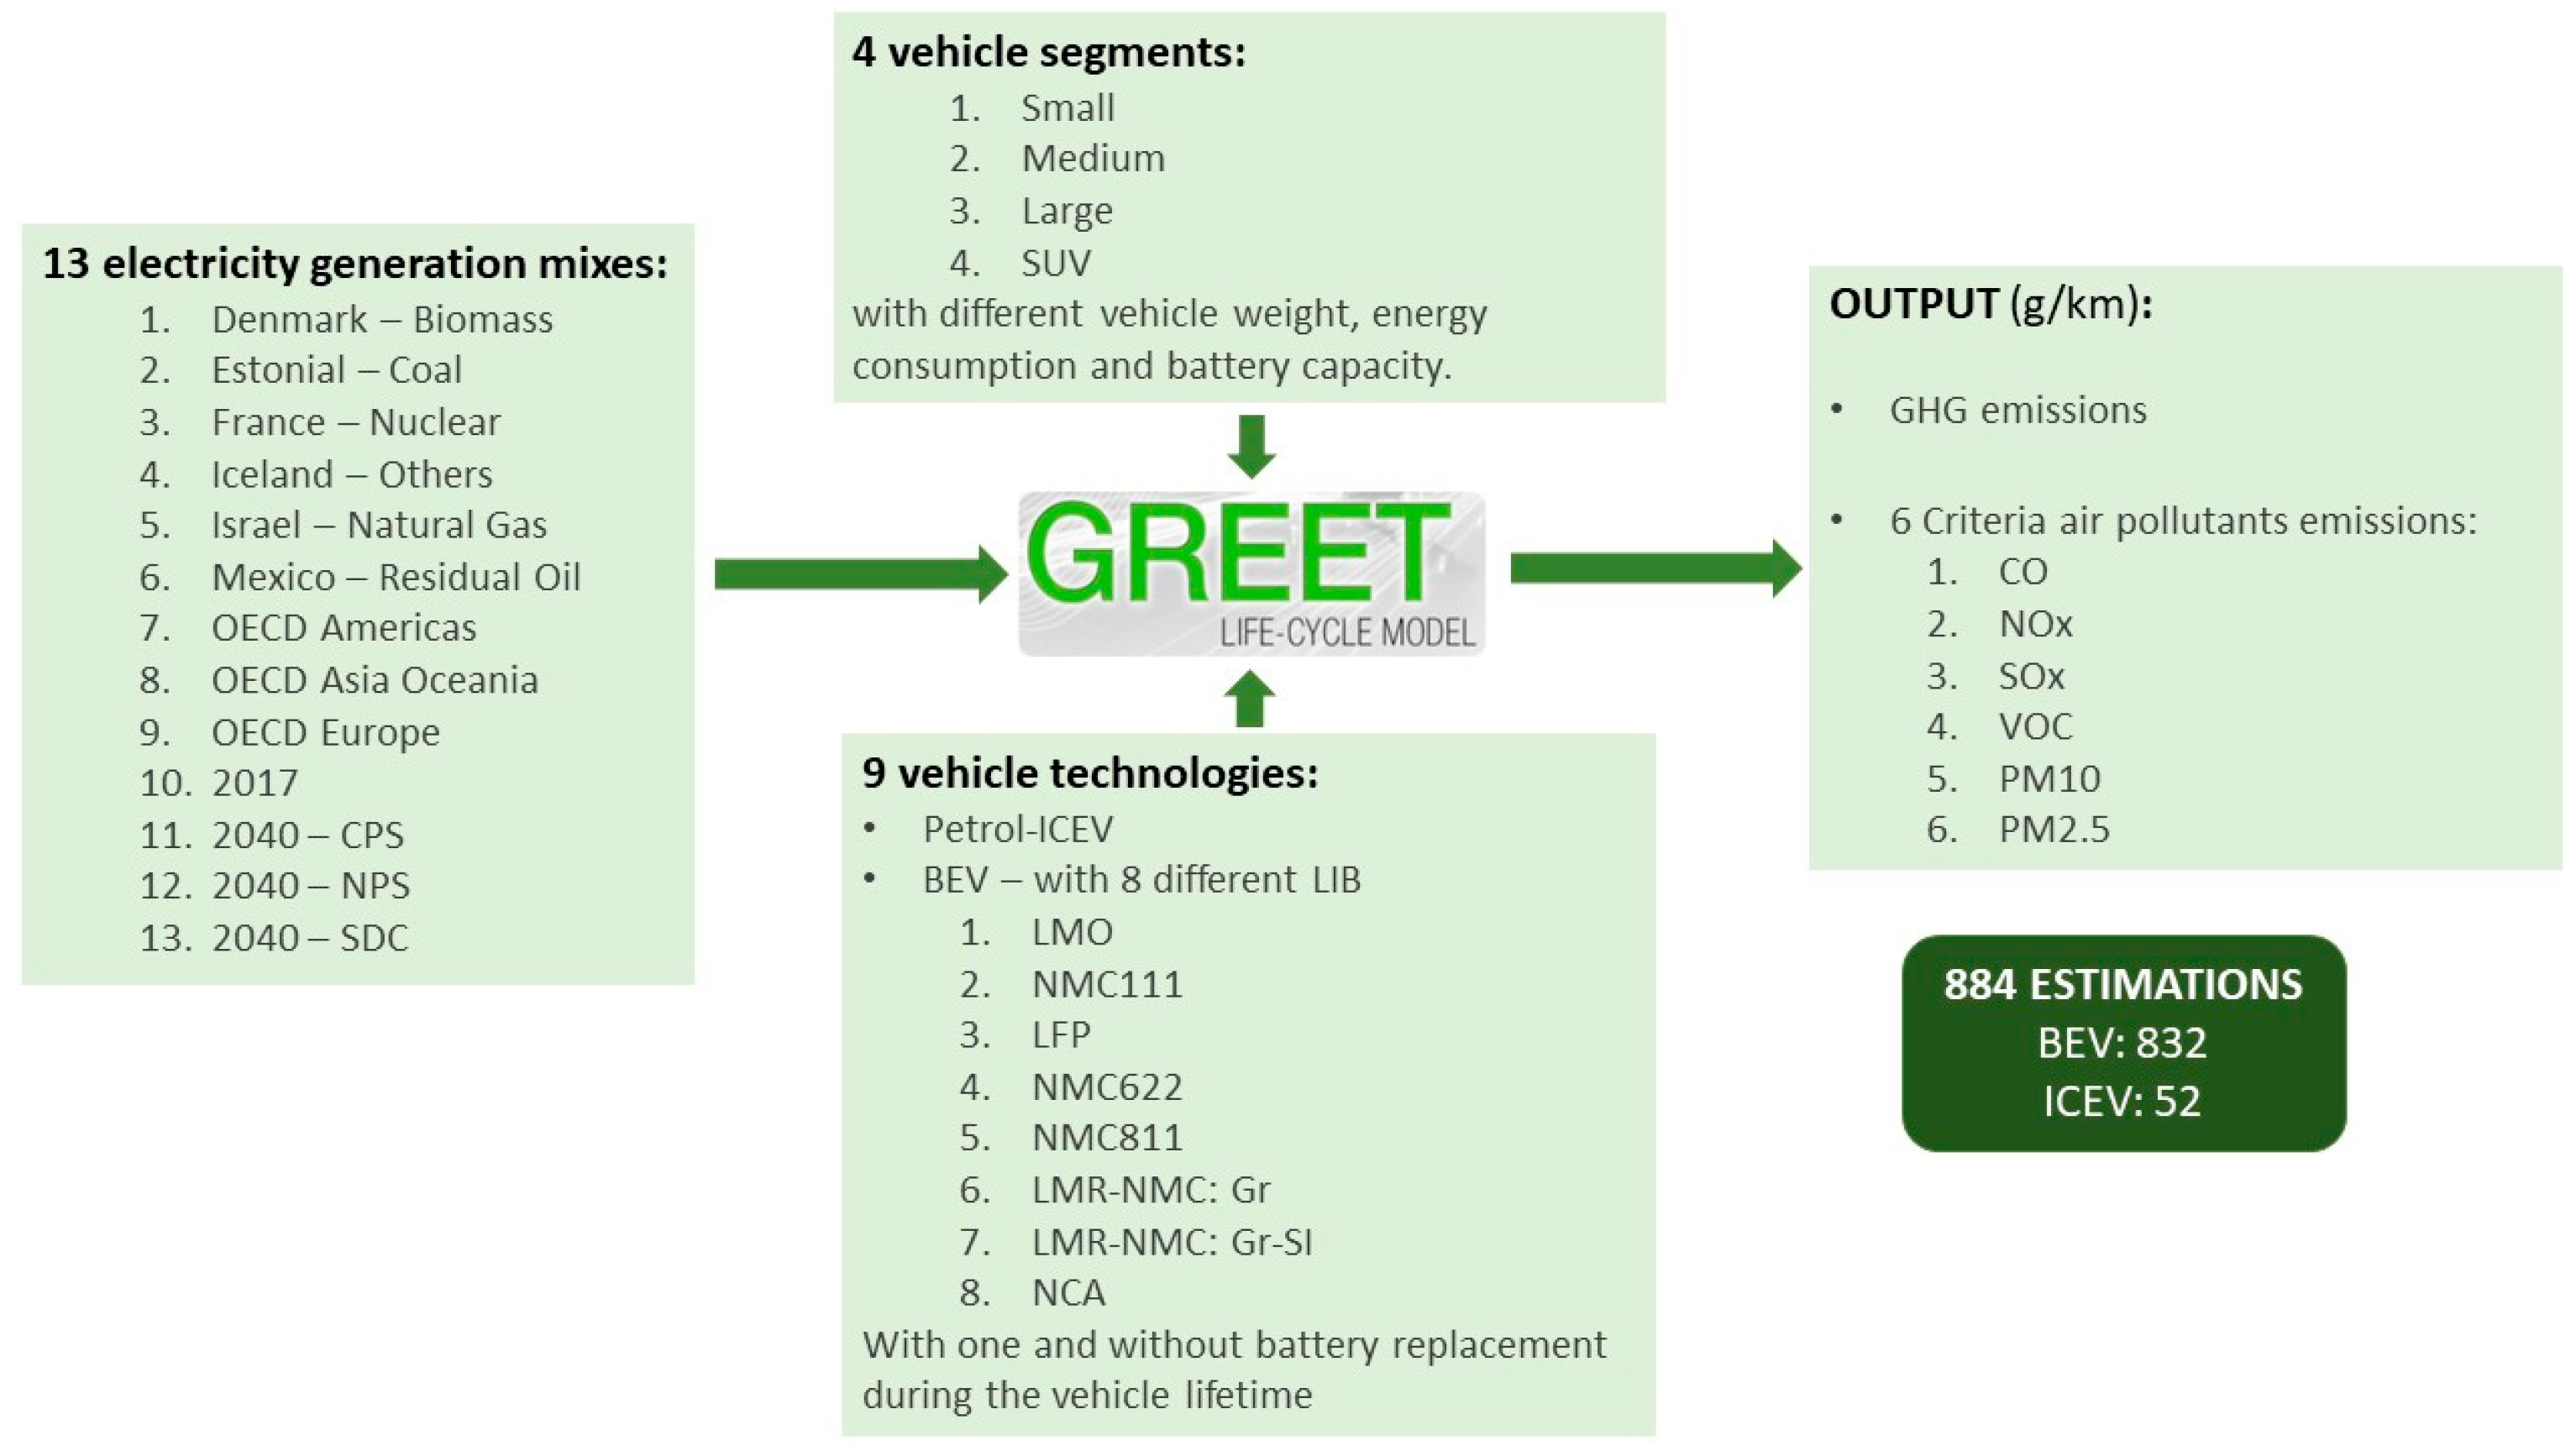
2. LCA Data and Methodology

The GREET 2018 model was used to derive LCA emissions estimates for multiple pollutants. This model distinguishes between regular and SUV-type vehicles, BEV, and ICEV vehicles, including the most recent LIB technologies, and allows the user to choose the electricity mix composition. For the purpose of this study, it requires, as input, vehicle weight, type, and powertrain; LIB chemistry (when applicable); and a breakdown of the electricity mix. This study was carried out for 8 LIB chemistries, 4 passenger vehicle segments (including large SUV), and 13 electricity mixes. In addition, scenarios of one battery replacement and no battery replacement during the vehicle lifetime were considered and emissions estimations were compared to the equivalent petrol-ICEV, also derived from the GREET model. A total of 884 analyses was thus carried out. GREET model input variables other than the ones explicitly mentioned below were kept at their baseline (default) values, as changing these values had only very minor effects on the results. Information on data acquisition is now given.

2.1. Vehicle Characterization
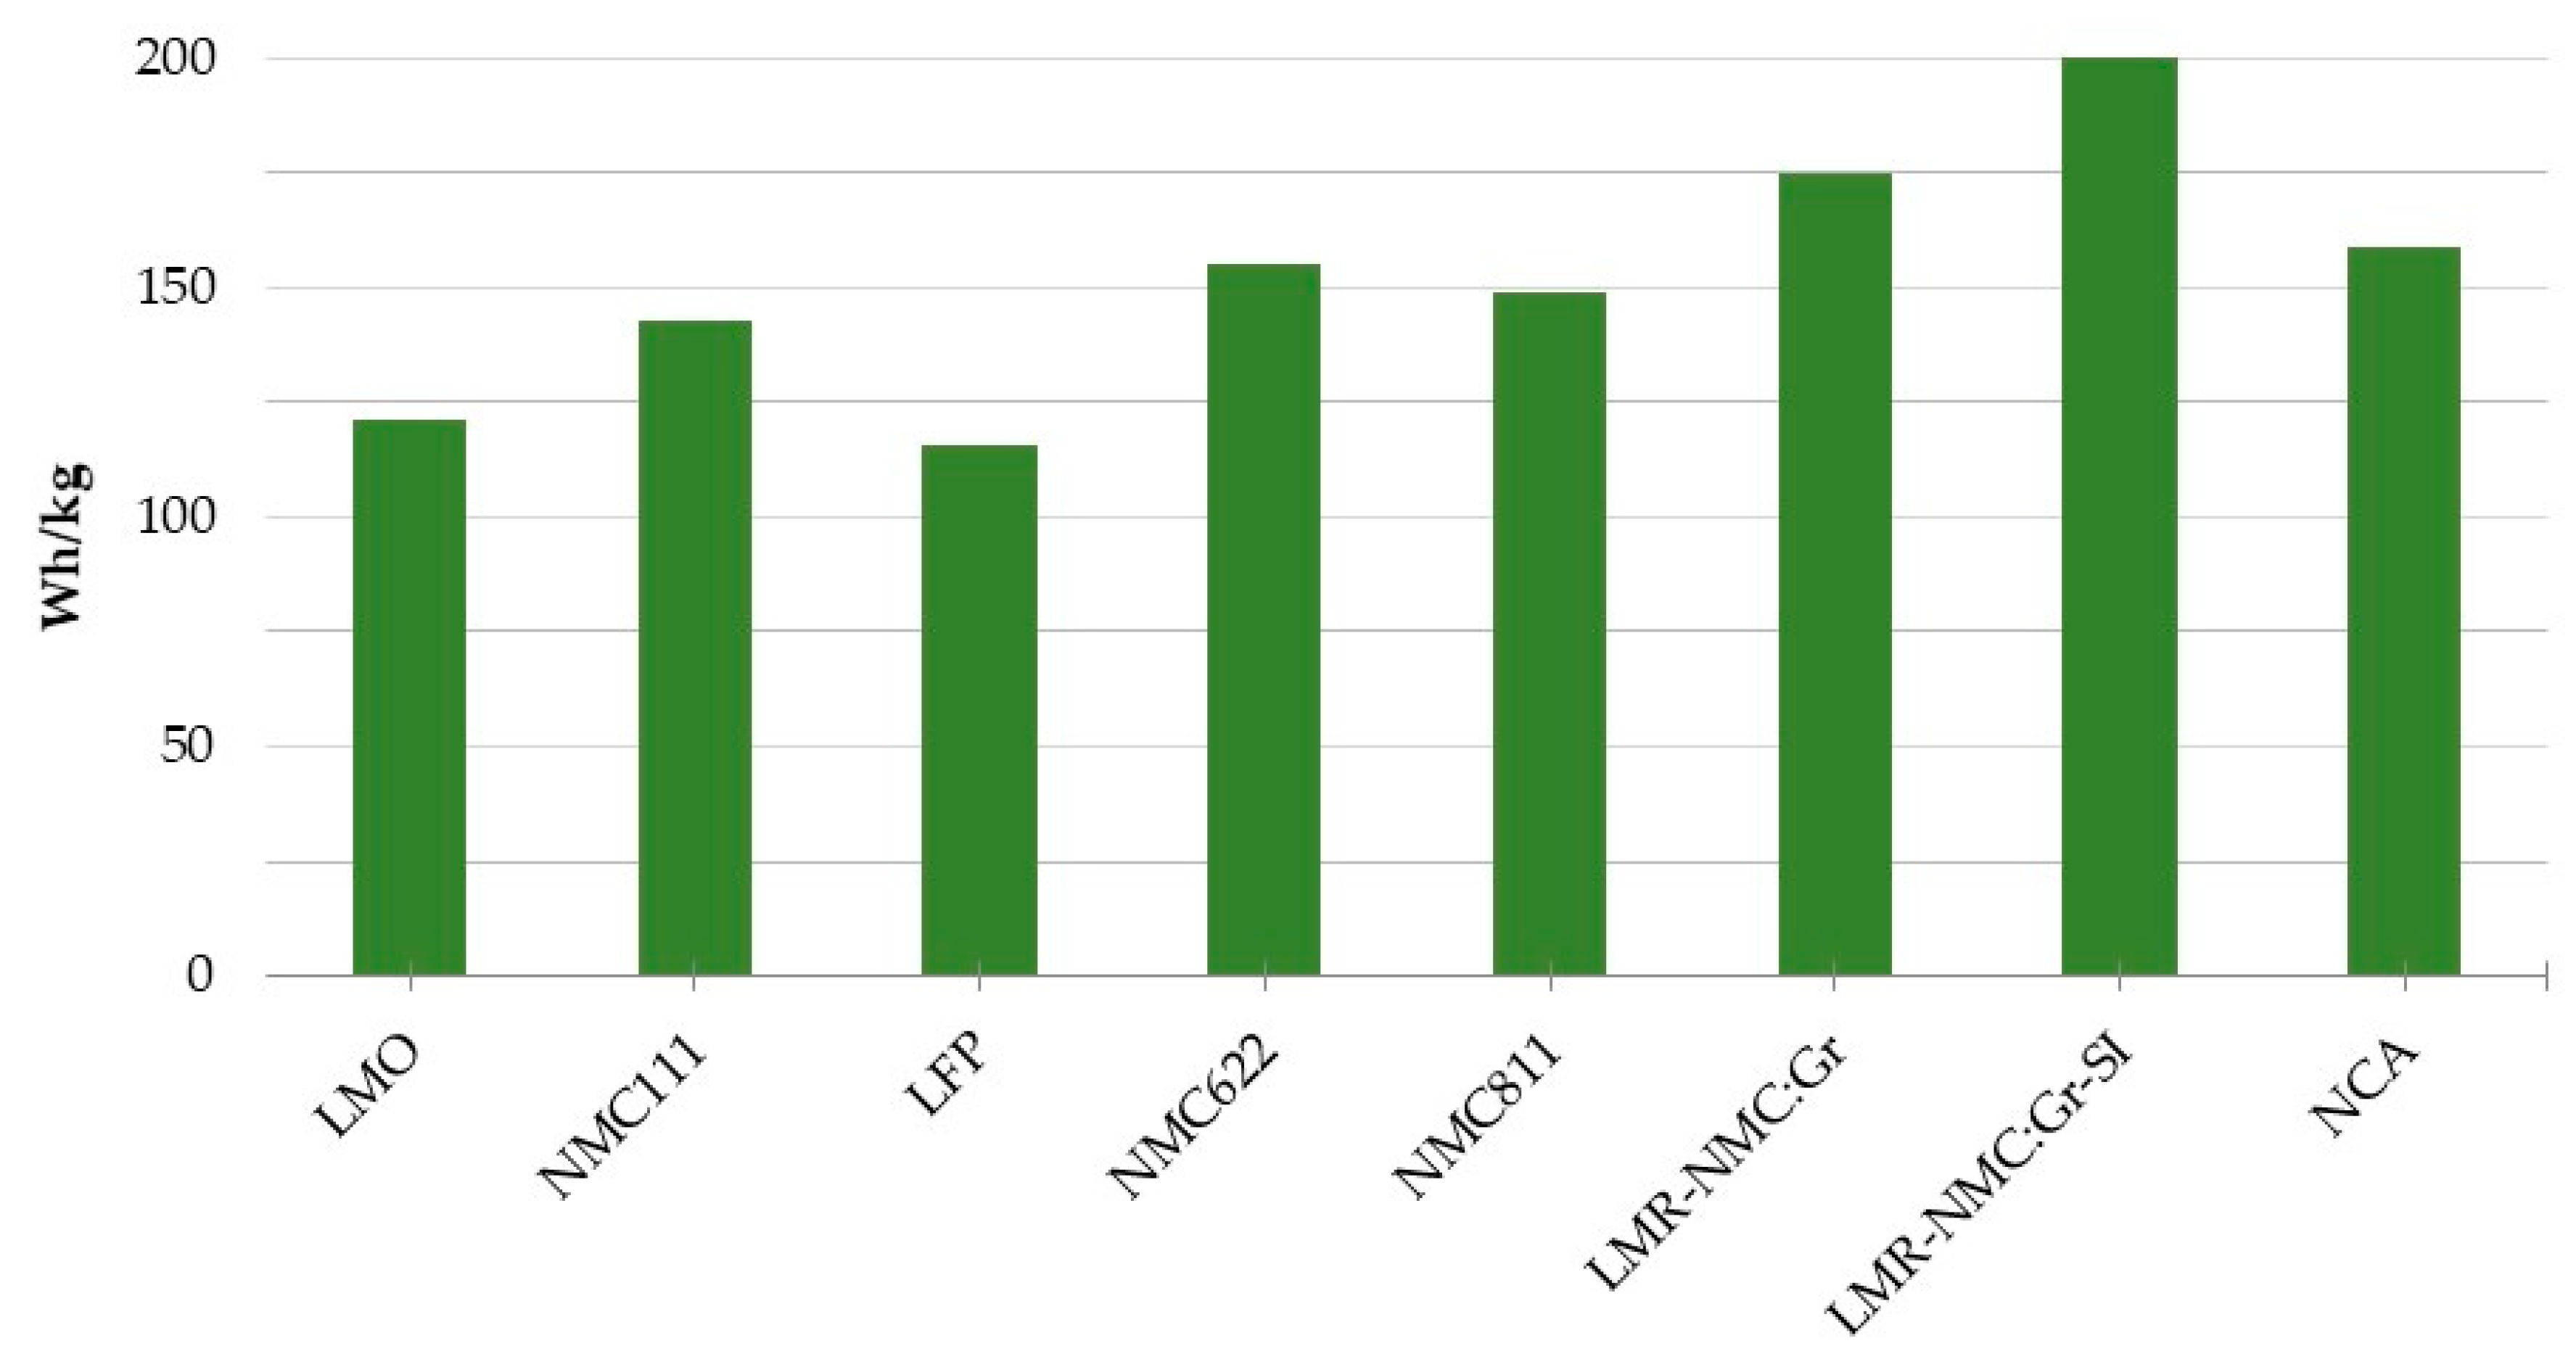
To take into account different passenger car segments, data needed for GREET model concerning vehicle weight, battery capacity, and vehicle energy consumption were collected and average values were derived, resulting in a prototype vehicle for each segment. Vehicle weight was used to define its segment (except for SUV), as this is currently the only way to incorporate segmentation in the GREET model. Segments considered were small city cars (EU A-B segment), medium-sized family cars (EU C-D segment), large full-size cars (EU E-F segment), and large SUV (EU J segment, large vehicles; currently the only electric SUV available in the market).
Vehicle weight, battery capacity, and energy consumption data were collected from brands’ technical specifications at the end of 2018 and used to construct an average model for each segment. All BEV vehicles in the electric vehicle database were considered [40], for a total of 23 examined models. Regarding the equivalent ICEV, whose environmental impact was also calculated for methodological reasons (see Section 2.4), petrol-fueled cars were considered, as they are the most-sold ICEV type in the EU-15 [3], and GREET conventional gasoline was assumed. A prototype average ICEV was considered for each segment, over a representative sample.
Concerning vehicle energy consumption, values from the worldwide harmonized light-duty vehicles test procedure (WLTP) procedure for consumption and emissions tests are desirable [41]. However, given that WLTP data were not available for all the examined vehicles, new European driving cycle (NEDC) data were used instead, with values adjusted for WLTP using ratios suggested in the literature, for both BEV and ICEV [42,43].
Table 1 presents a round-up of the profile of the prototype vehicles obtained, per segment. Note that the GREET model requires separating BEV curb weight from battery weight.

2.2. Batteries

Table 2 presents the LIB types that can be assessed by the GREET 2018 life cycle model.
The LMR-NMC battery, coupled with a graphite or graphite-silicon blend anode material, is of particular relevance, given its potential as a future chemistry for automotive battery packs [44]. According to Zubi et al. [45], overall, in 2030, the cathode market share is very likely to be NMC in first place with a 35% market share, followed by LFP and NCA with a 40% combined market share. In relation to the NMC oxide, the NMC111 is the current one, the NMC622 is being deployed, and the NMC811 is for the next-generation LIB [8]. The NMC811 chemistry, in which battery manufacturers have a growing interest, enables significant reductions in cobalt content compared with other NMC chemistries [8].
Table 3 provides a breakdown of the mass composition of each of these LIB chemistries for comparison and Figure 1 presents their densities.

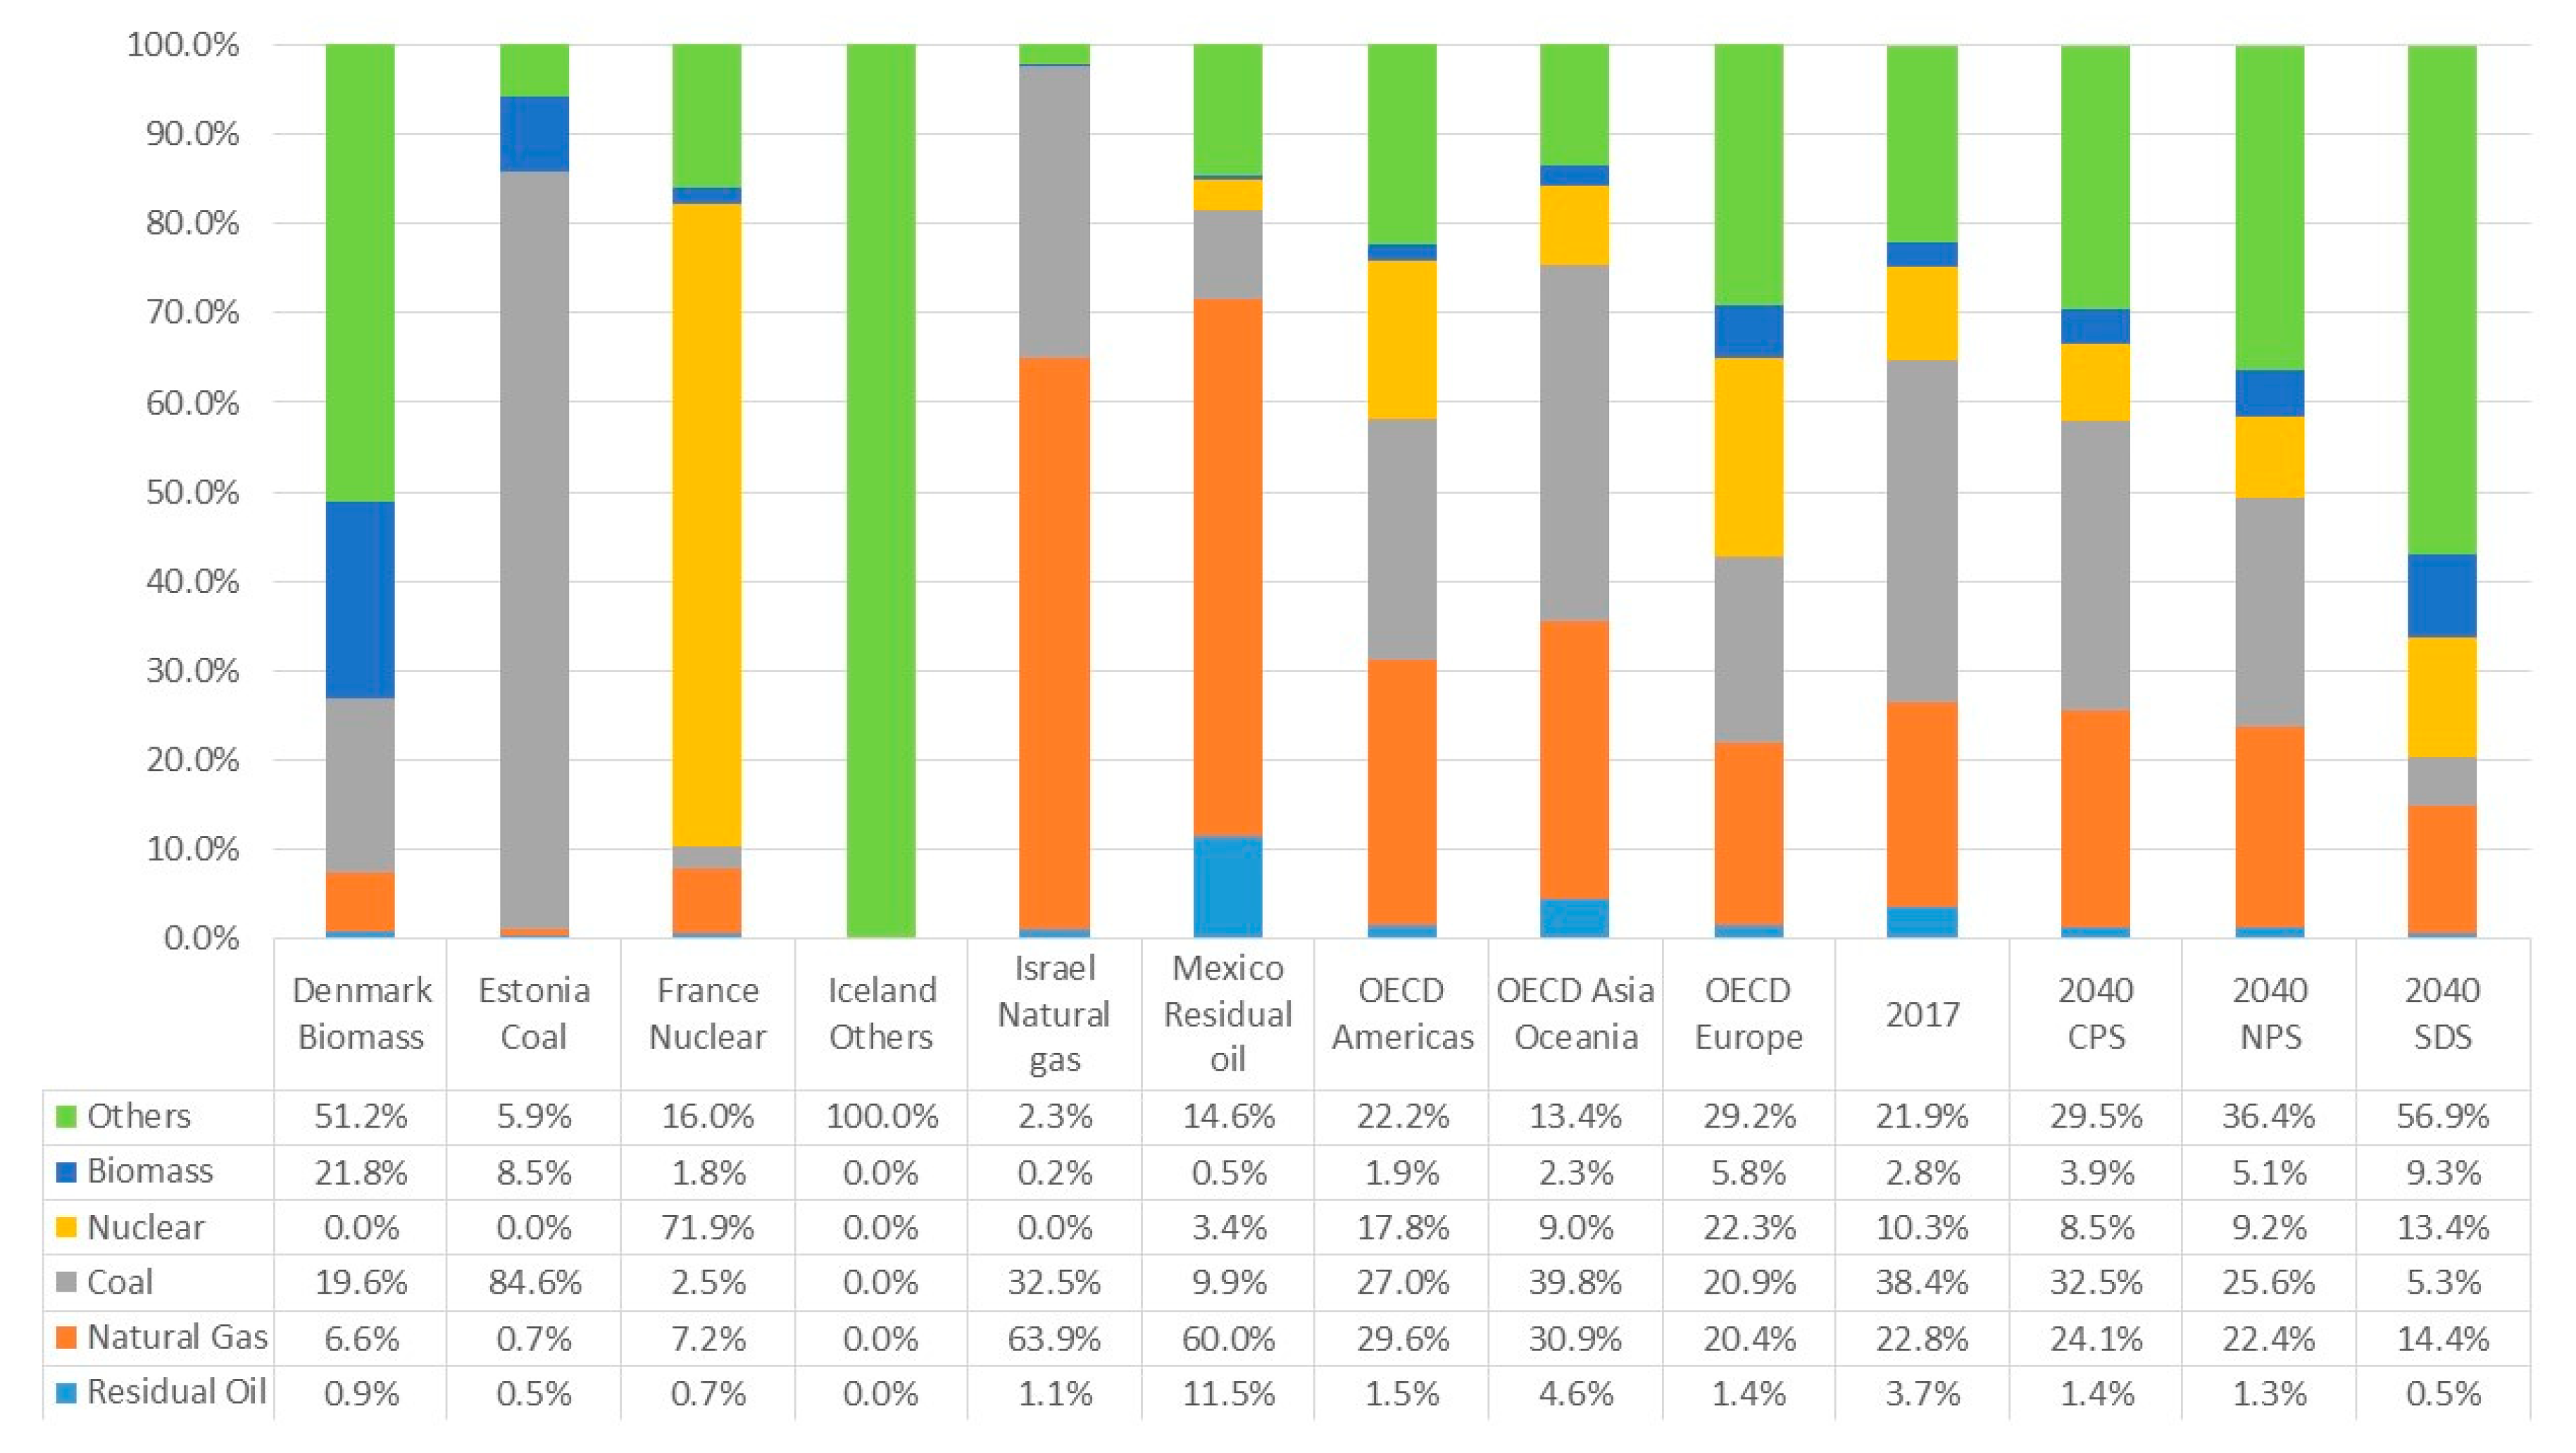
2.3. Electricity Generation Mix

Concerning the electricity generation mix, provisional 2017 data available on the IEA electricity information 2018 [46] were used. This report considers OECD gross electricity production from combustible fuels (coal, oil, natural gas, biofuels, and waste), nuclear power, hydroelectric power, geothermal, solar, wind, ocean power, and other sources for 35 OECD countries. The mix data were recategorized into GREET model primary energy sources—residual oil, natural gas, coal, nuclear, biomass, and others (includes hydroelectric, geothermal, wind, solar).
Out of the 35 electricity generation mixes available, only the most representative, i.e., highest percentage, of a given energy source were considered in the analysis. In order to have a worldwide perspective, the OECD Americas, Asia Oceania, and Europe mixes were also considered, as well as three outlook scenarios provided by the World Energy Outlook [47], focusing on future higher renewable percentages mixes. The three core scenarios, differentiated primarily by their underlying assumptions about the evolution of energy-related government policies, were defined in the report, namely the current policies scenario, which considers the impact of only those policies and measures that are firmly enshrined in legislation as of mid-2018; the new policies scenario, aiming at providing a sense of the direction in which the most recent policy ambitions could take the energy sector; and the sustainable development scenario, which starts from the objectives to be achieved and then assesses what combination of actions would deliver them. This allows exploration of the impact of possible future mixes. Figure 2 presents the GREET breakdown of the considered mixes, a total of 13.
Vehicle GHG emission estimates, in gCO2eq/km traveled originating from electricity generation, were carried out in the GREET model considering only the fuel cycle, which comprises all steps from primary source extraction/production to the charging station, including a charging efficiency of 85% [48,49,50]. These emissions are linearly proportional to the fuel consumption. Therefore, as different vehicle segments were considered in the analysis, the estimations were obtained dividing by vehicle consumption (kWh/km). Figure 3 presents the GHG emission estimates of the electricity generation part (fuel cycle) for all the mixes considered in the analysis, ordered by decreasing emissions.
Note that the fuel cycle also produces other pollutants besides GHG, and this is accounted for in the GREET model.

2.4. Procedure and Statistical Methods

With key input data evaluated, the GREET 2018 life cycle model was used to obtain emissions estimates, in grams per km, of seven pollutants as output. A total of 13 mixes × 8 LIB chemistries × 4 segments × 2 battery replacement options (yes/no) = 832 BEV estimations were carried out, plus 13 mixes × 4 segments = 52 ICEV emissions estimations, for a grand total of 884 estimations. Note that the environmental impact of ICEV also depends on the electricity mix due to the construction and decommissioning phase, albeit to a much lesser extent than BEV. It was assumed that the vehicle is produced, used, and dismantled under the electricity mix considered, as a closed system type of analysis was sought-after. More global analyses are possible, but that is outside the scope of this article, since it would require considering many combinations of datasets, reaching out to the bottom of the supply chain of each vehicle component. Figure 4 presents a structure of the inputs and outputs of the model.
Once all outputs were obtained, their respective emission estimates were subject to a statistical analysis to determine whether significant differences between the distributions of results could be detected.
In order to remove vehicle size bias from the analysis, the response variable considered in the statistical analysis was not the absolute value of the BEV emissions estimate but its quotient by the emissions estimate of the ICEV of the same segment (ratio-to-ICEV variable, or simply ratio variable). Considering absolute values instead would just yield the well-known fact that bigger vehicles pollute more, and this unwanted effect would make it harder to find significant differences.
The statistical analysis was carried out by performing, for each electricity mix, a two-way analysis of variance (ANOVA) without replication, with LIB chemistry and vehicle segment as factors and emissions estimates (in ratio variables) as the statistical variable. The ANOVA test determines whether the factors, as a whole, influence the emission estimates in a statistically significant way. Next, in order to find out which particular levels of the factors, i.e., which chemistry types or segment sizes, lead to statistically significant differences in the emission estimates, all chemistry and segment levels were compared in a pairwise manner by running Tukey honestly significant difference tests. A significance level threshold of 10% was used in all the testing, i.e., statistical test p-values lower than 10% suggest that the observed differences in emissions estimates are indicative of an underlying trend, rather than being just random noise.

3. Results and Discussion

Preliminary descriptive statistics of chemistry and segment effects are shown in Figure 5 and Figure 6, for GHG emissions, in ratio-to-ICEV. Figure 5 boxplots represent GHG ratio values across chemistries. Similarly, Figure 6 boxplots represent values across segments. As can be seen, for GHG there is a clear dependency on the electricity mix: The cleaner it is, the less environmental impact BEV have, regardless of the chemistry and segment factors. This dependency is well known (see e.g., References [30,31]) and is not the main focus of this research. Rather, the present research aims at checking, for each particular mix, whether the differences in observed emissions estimates for the various chemistries and segments (measured in ratio variables) are indicative of statistically significant trends or mere statistical fluctuations.
The figures hint at some LIB chemistries having slightly less environmental impact with respect to GHG. Regarding vehicle segment, an interesting ordering trend can be seen for all mixes: There is less GHG impact for small, followed up by SUV and mid-sized, with large vehicles being more pollutant. Recall that this trend is exhibited in the GHG ratio variable, not in the absolute emissions values.
Similar figures for the other pollutants can be found in the Supplementary Material. The main conclusions are summarized here. For those pollutants, there is a dependency on the mix, but not on its cleanness. Rather, it is the nature of the main source of electricity that is important. For instance, for CO and particulate matter, mix 4 (Denmark) has the highest impact on the ratio emissions due to this mix’s high biomass content. Mix 13 (Estonia, coal) also leads to high PM content. For NOx, mix 9 is the most impactful (Mexico, residual oil) and for the other cases, the dependency on the mix are smaller, albeit, as will be seen, statistically significant in most cases.
What does carry through from the GHG case is the fact that smaller vehicles generally have smaller (ratio) emissions, with SUV emissions being slightly higher than mid-sized vehicles, except for VOC where they are clearly worse off than all other segments. This is, again, a non-trivial fact because it is derived from ratio variables.

3.1. Statistical Analysis

Proceeding to the statistical analysis, two-way ANOVA on chemistry and segment were carried out for all 13 mixes × 2 battery replacements (yes/no) × 7 pollutants = 182 cases, all of them having resulted in significant differences for both the chemistry and segment factors (highest p-values are below 0.1% for both factors). A total of 26 × 7 = 162 two-tailed t-tests of all BEV emissions estimates versus a ratio of 1 (ICEV) were also carried out, whose p-values are shown in Table 4 below (green [red]: BEV significantly less [more] pollutant than ICEV, yellow: no significant differences). BEV yield reduced environmental impacts for four pollutants (out of seven), including GHG, which is arguably the most important one due to the large volumes emitted and their climate impact. BEV are more pollutant than ICEV for SOx and PM. Both these differences come from the fuel and vehicle cycles; the increase cannot be directly attributed to a single cycle. For the particular case of SOx, BEV fuel cycle emissions can be smaller than ICEV for cleaner mixes, but once vehicle cycle is accounted for, SOx emissions always become bigger for BEV due to fabrication of the battery, motor, and power electronics (see e.g., Reference [51]).
Following up on the ANOVA, Tukey tests for chemistry and segment factors were thoroughly carried out for each electricity mix and pollutant type. Figure 7, Figure 8, Figure 9, Figure 10, Figure 11, Figure 12 and Figure 13 summarize the results of the chemistry pairwise comparisons for the GHG, CO, NOx, SOx, VOC, PM10, and PM2.5 emission estimates, respectively. Statistical p-values can be found in the supplementary data.
Each pairwise comparison is displayed in the format “row vs. column”, with green meaning “row chemistry is significantly cleaner (less polluting) than column chemistry” (red meaning dirtier/more polluting, and yellow not significantly different), and contains 13 cells as well, one for each electricity generation mix, ordered as in Figure 3 from the cleaner (1: Iceland) to the dirtier (13: Estonia). For instance, the first row of the Figure 7 reads as follows: LIB chemistry 1 (LMO) produces lower GHG emissions than chemistries 2, 4, 5, and 8, not significantly different for mix 3, and more GHG emissions than LIB chemistry 7, but only for the first three electricity mixes.
The results are now analyzed per pollutant, with general trends commented upon in the end.
For GHG emissions (Figure 7), results indicate a general trend for chemistries 1, 3, 6, and 7 to be statistically cleaner than chemistries 2, 4, 5, and 8 regardless of battery replacement. Cleaner/dirtier electricity mixes slightly change this picture for particular cases but not overall.
A trend very similar to GHG arises for the CO (Figure 8), NOx (Figure 9), and SOx emissions (Figure 10), but in these cases, the differences coming from the electricity mix and battery replacement are even subtler. Again, cleaner/dirtier mixes introduce some variations but overall the conclusion that LIB chemistries 1, 3, 6, and 7 are statistically cleaner than 2, 4, 5, and 8 is reinforced.
As to VOC emissions (Figure 11), the situation is slightly different. For this pollutant, the LMR-NMC-type chemistries (6 and 7) outperform the rest.
The scenario for PM2.5 (Figure 13) is similar to the one for other pollutants. However, for PM10 (Figure 12), the situation differs slightly. While the trend still holds in general, mixes #4 (most biomass content) and #13 (most coal) introduce a slight tendency towards equality of LIB chemistries. This is actually not too unexpected, given the high PM10 amounts produced from burning coal and biomass.
General conclusions can now be derived with respect to the LIB chemistry factor:
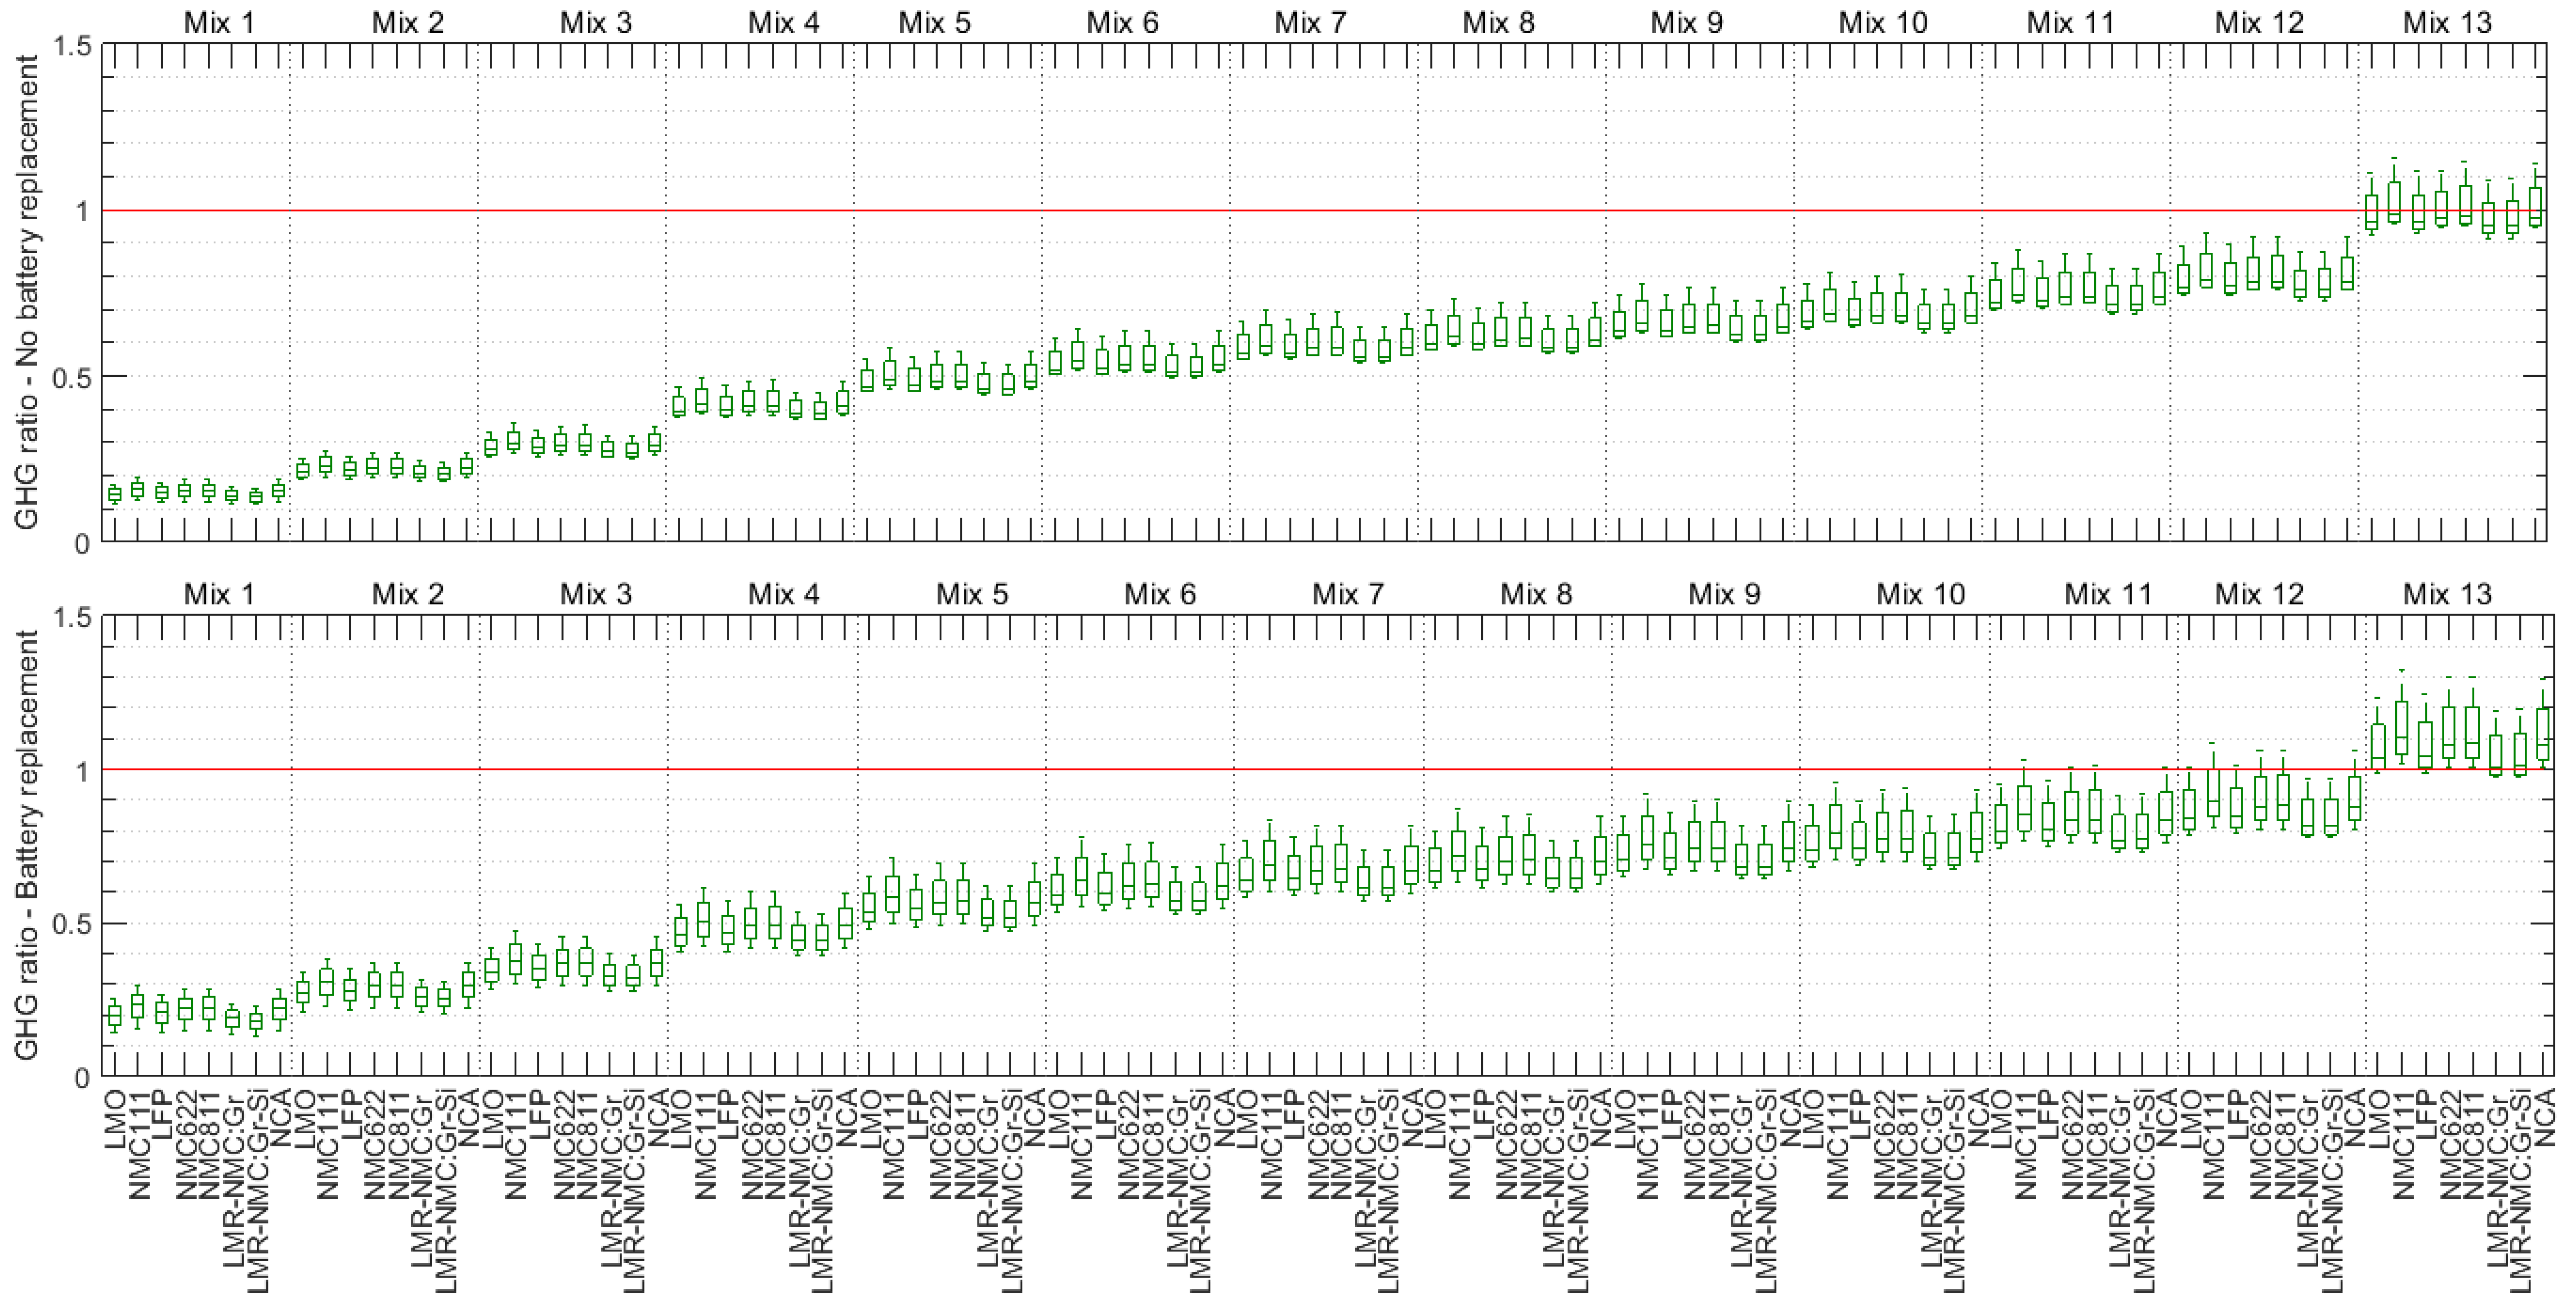
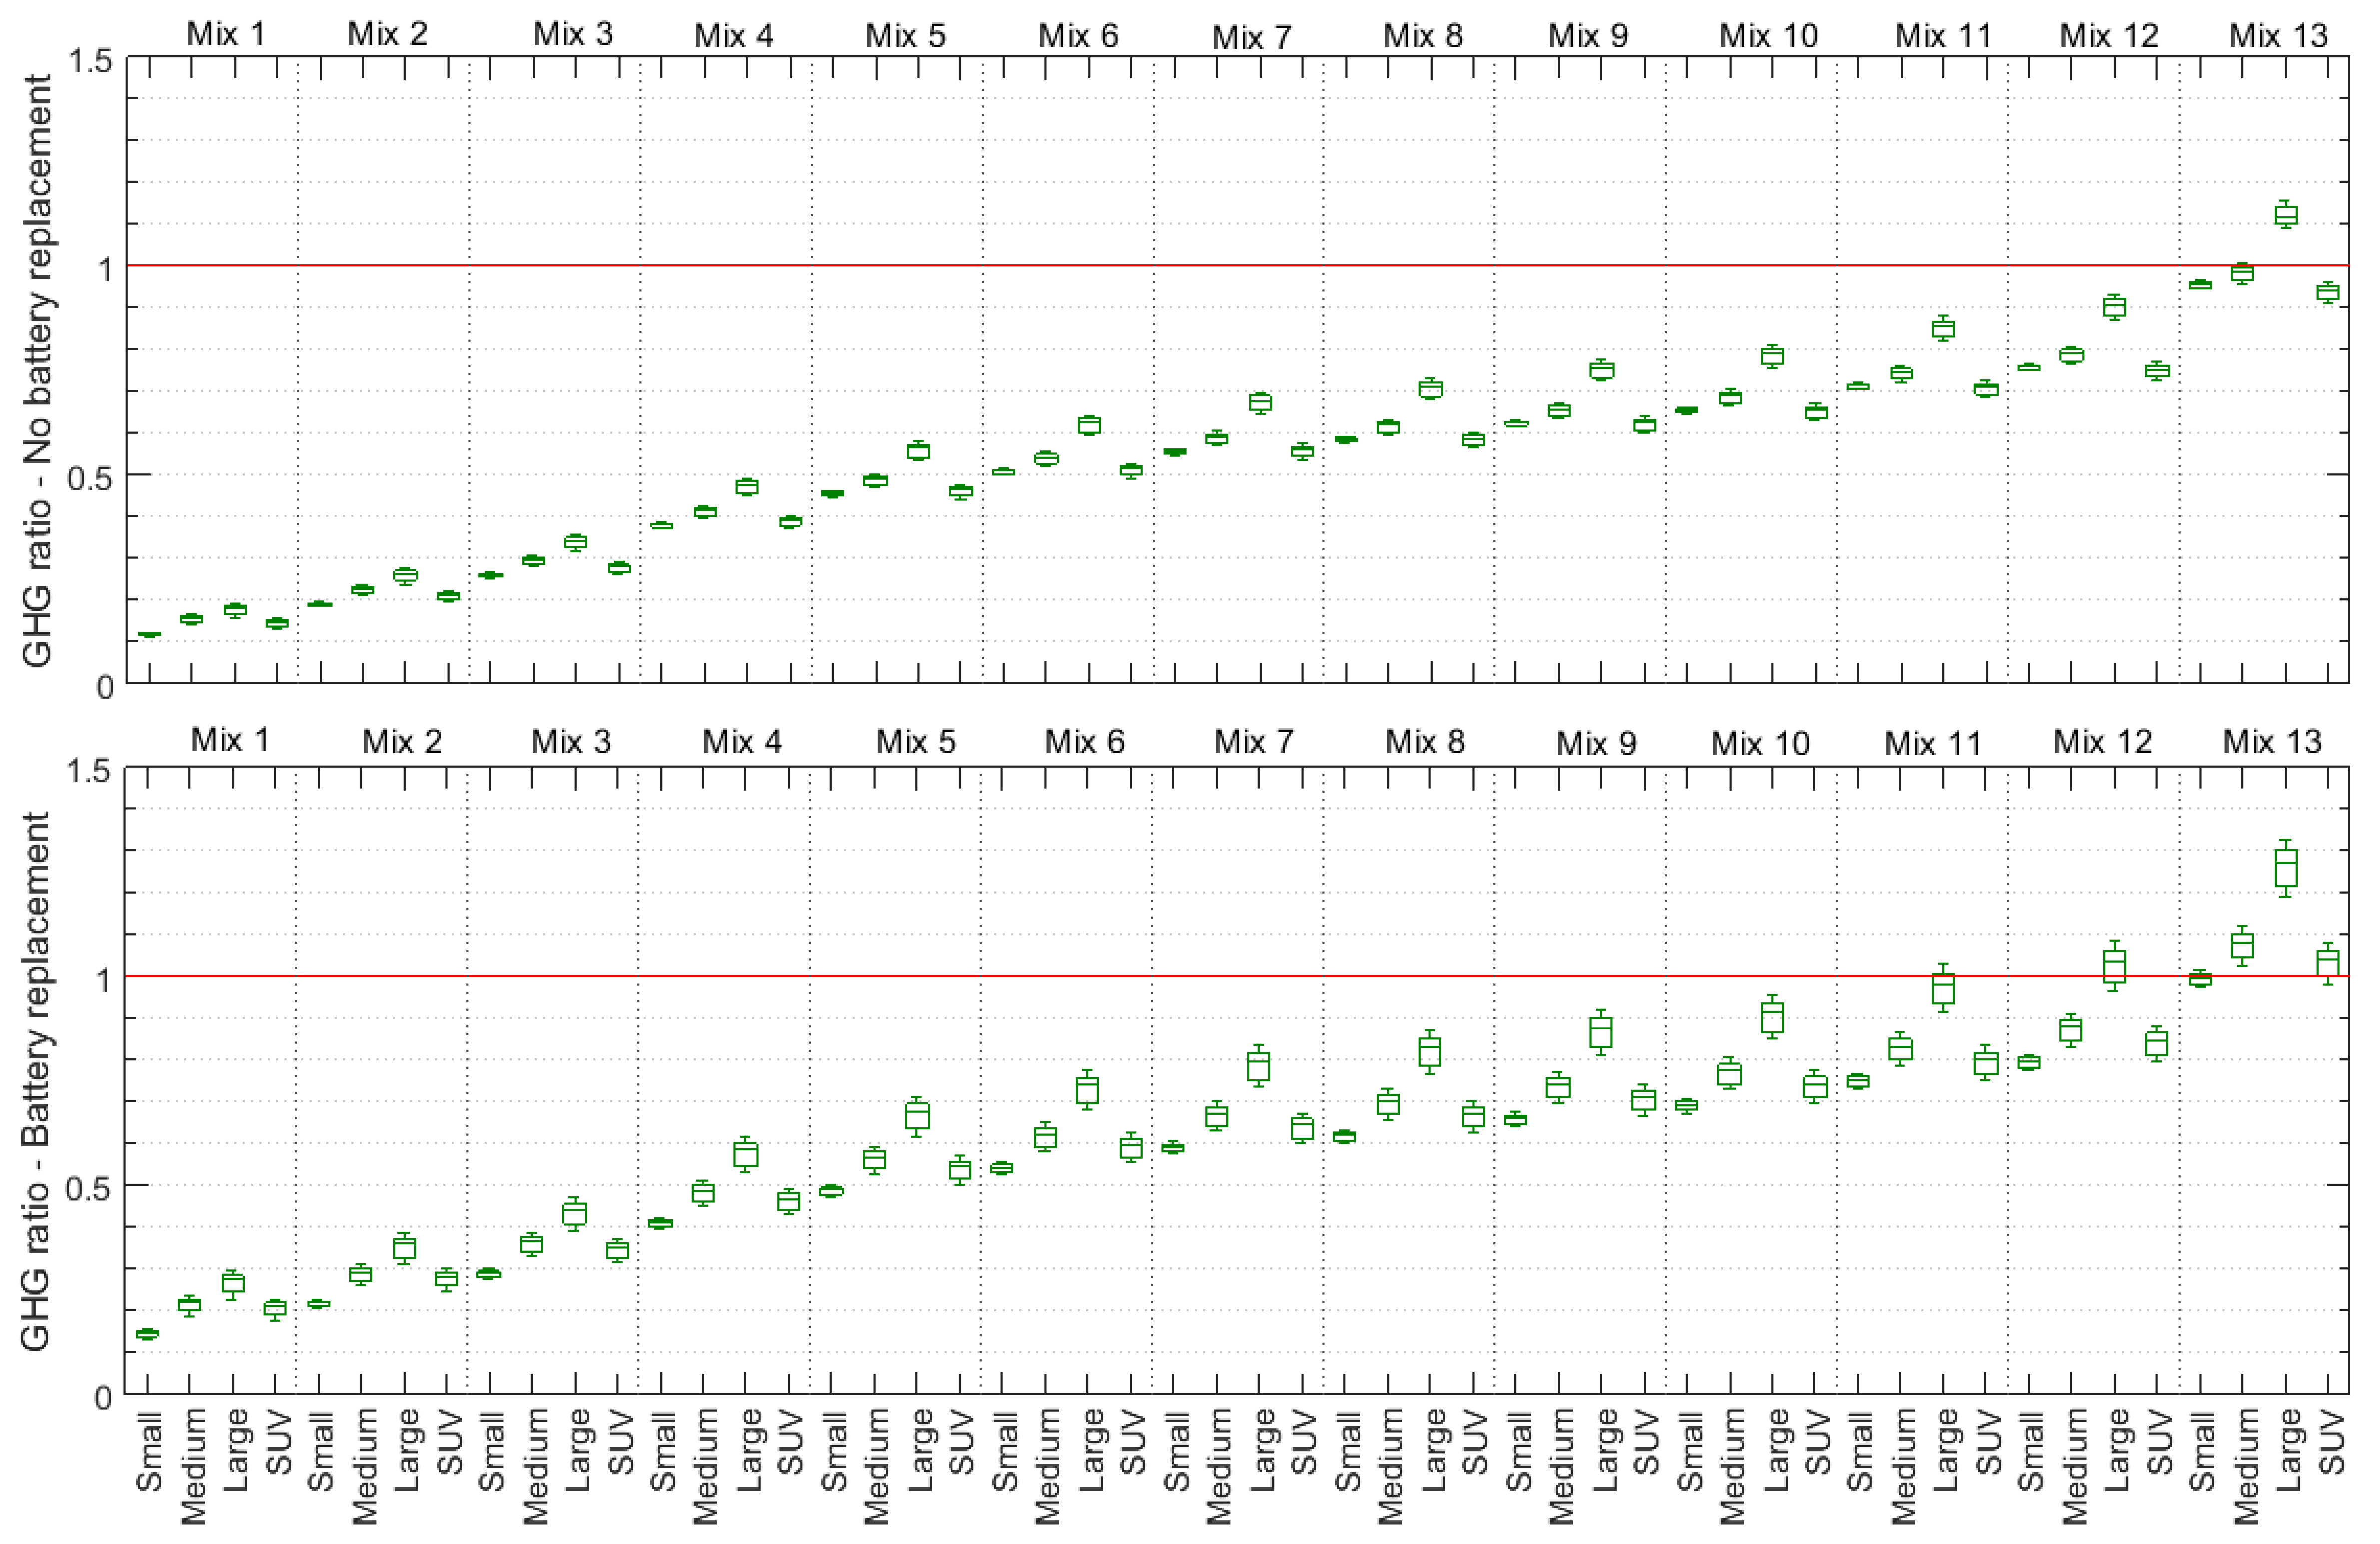
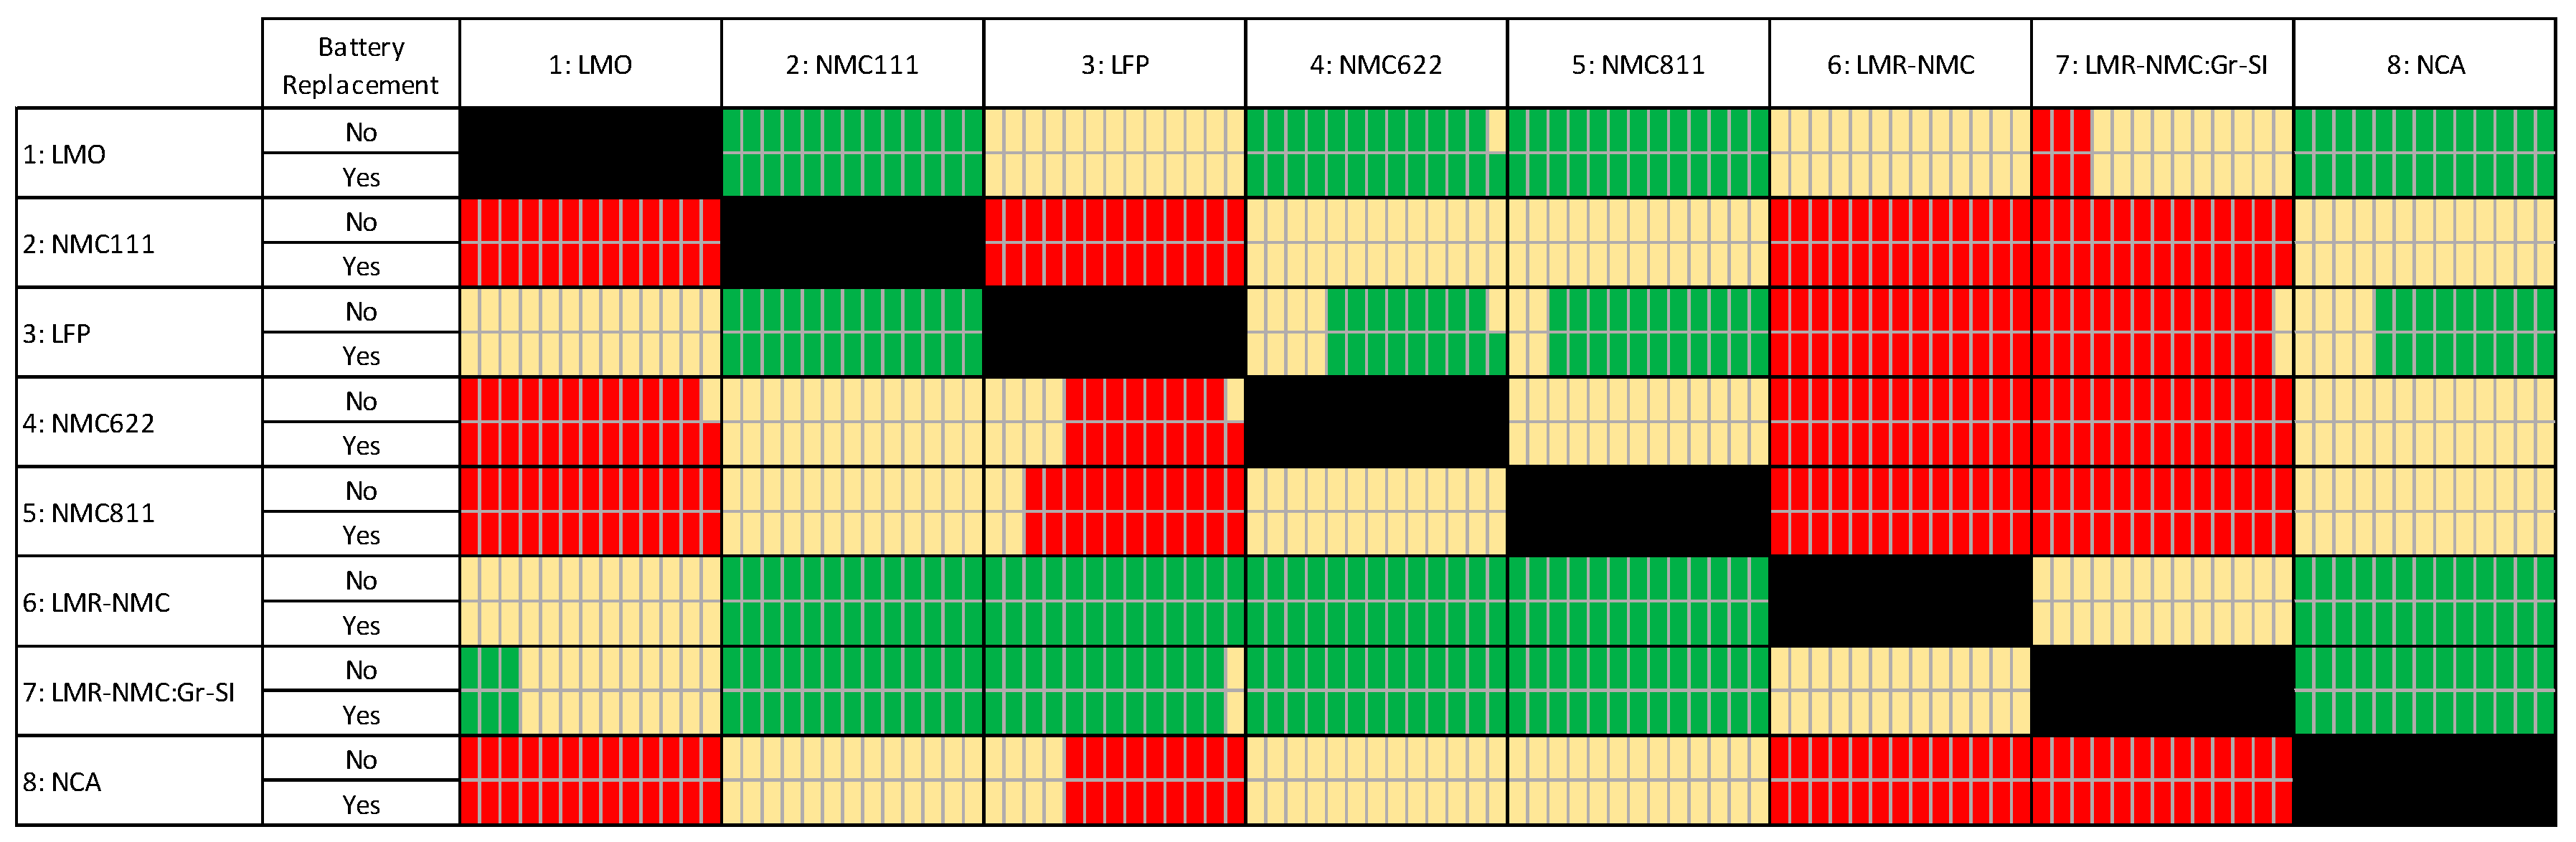
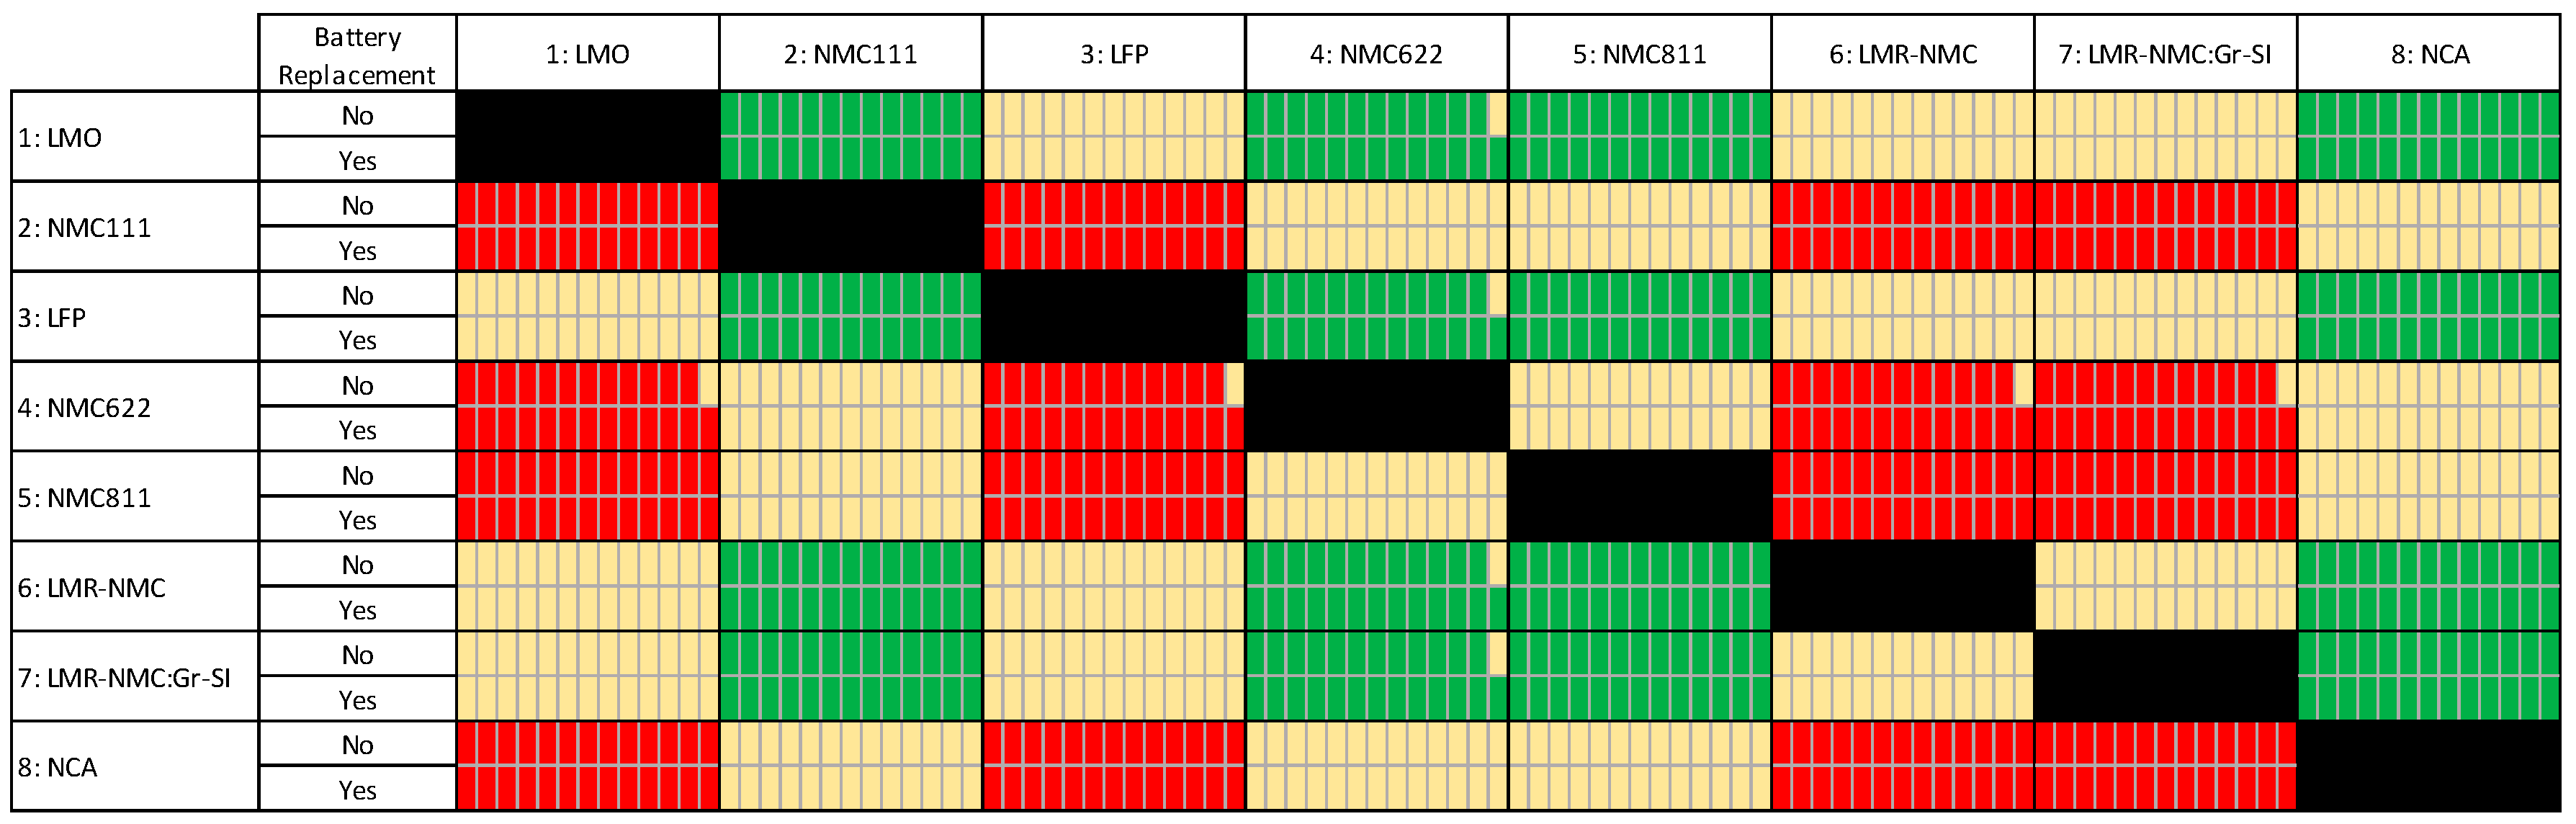
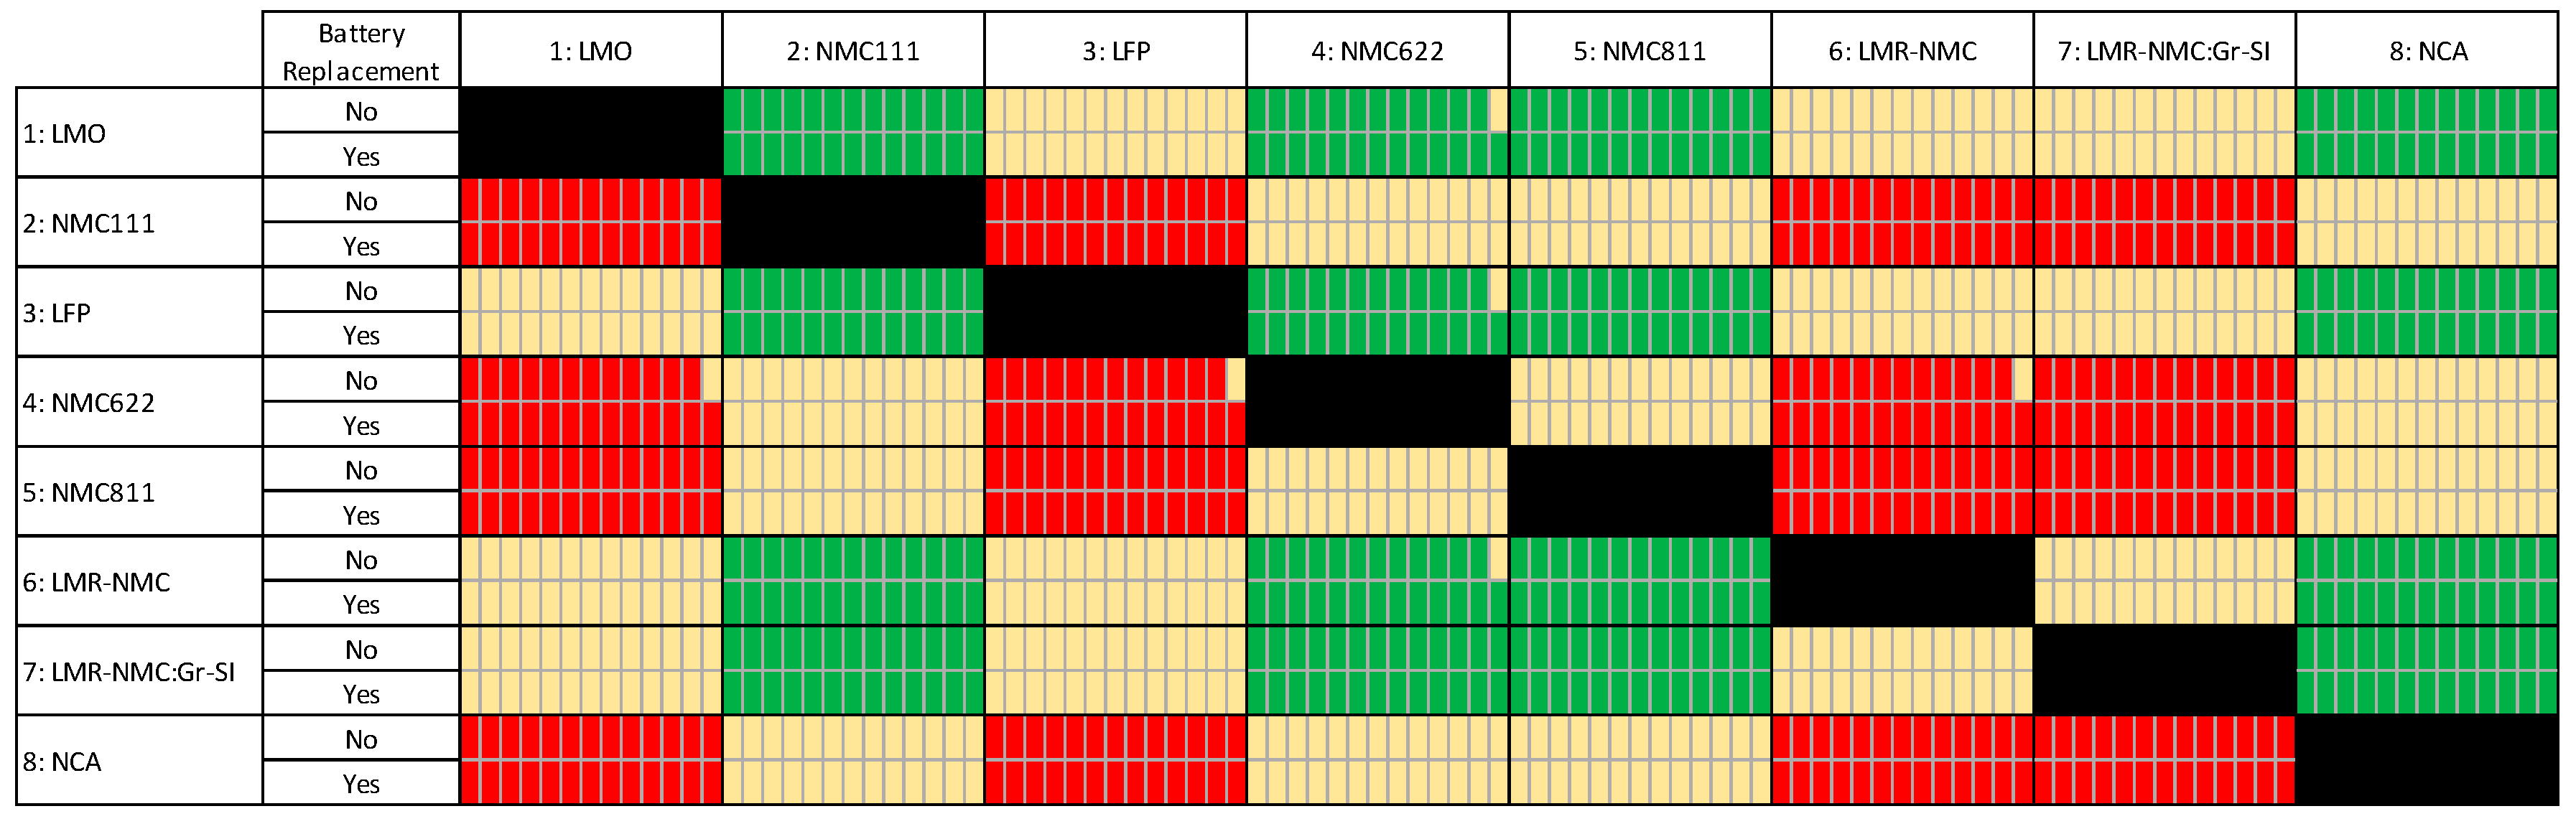
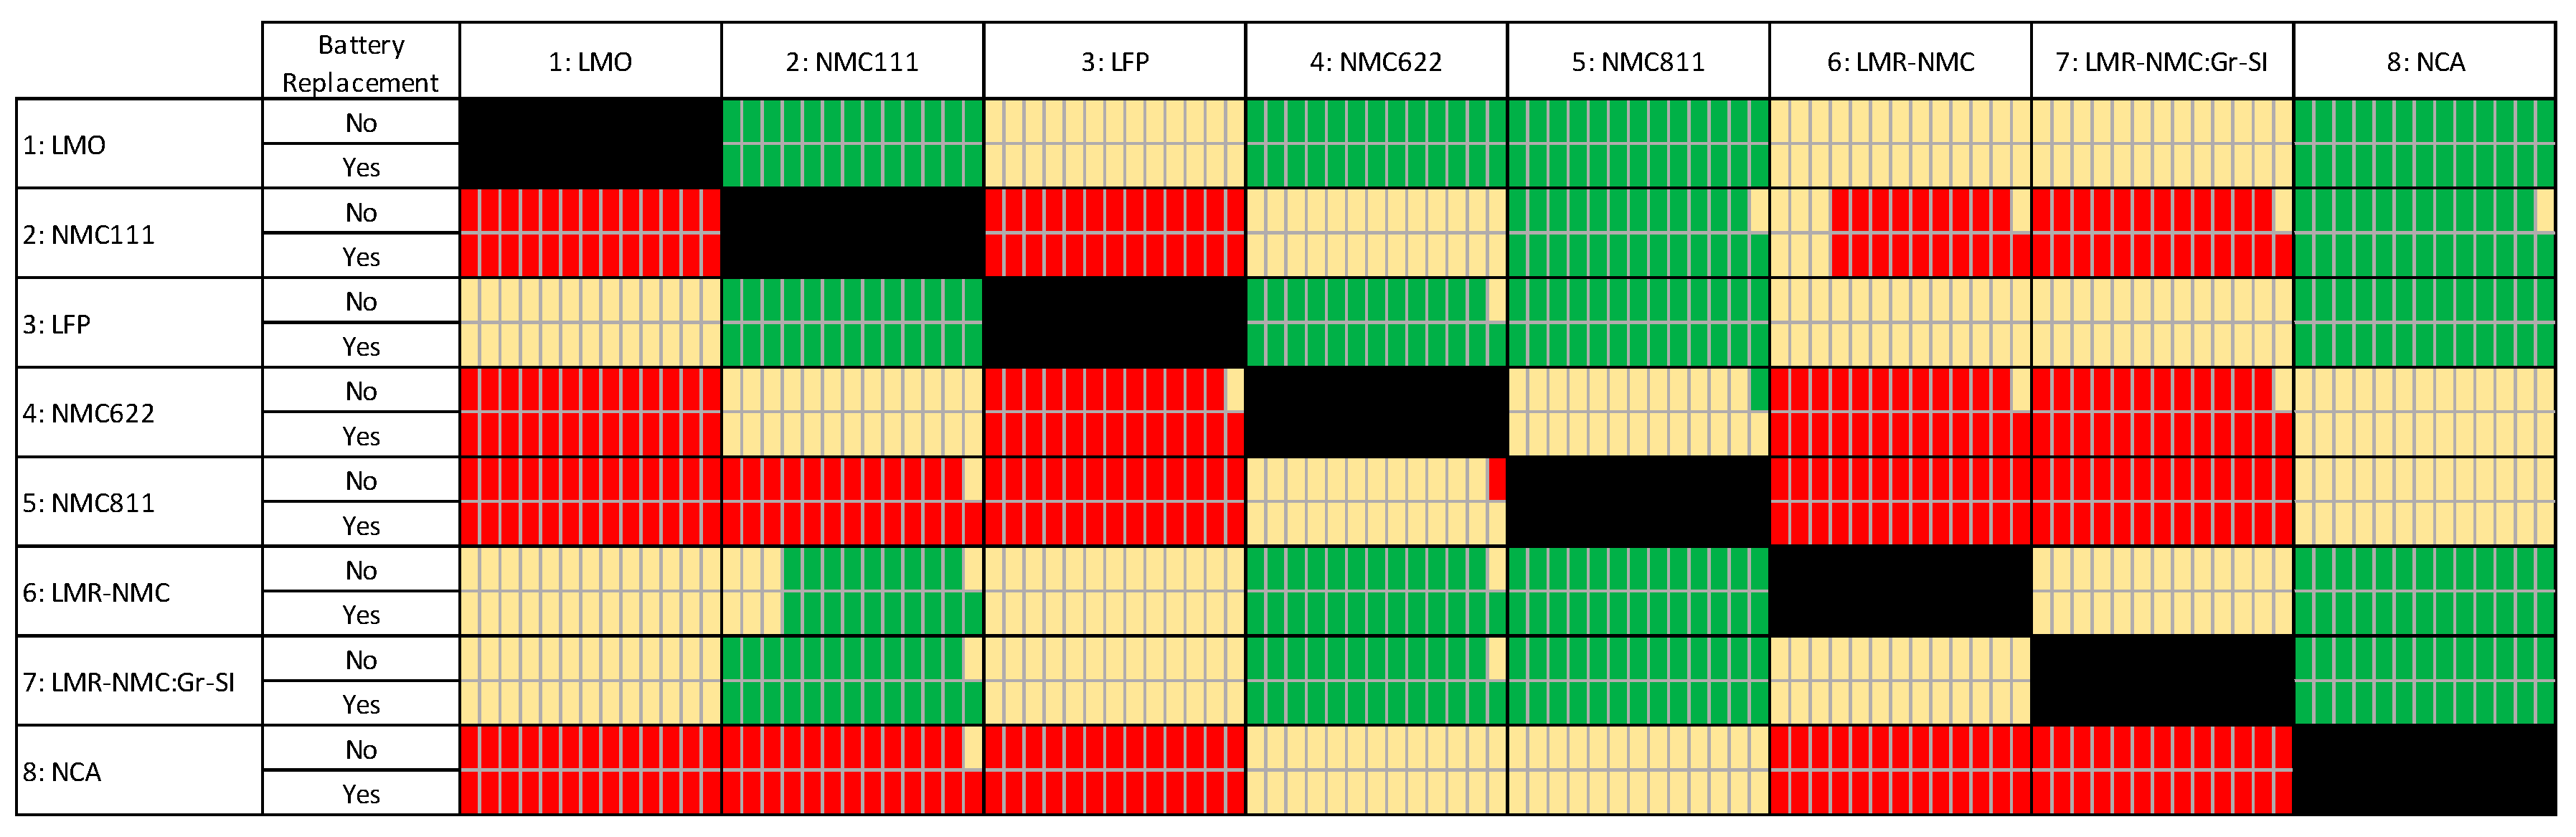
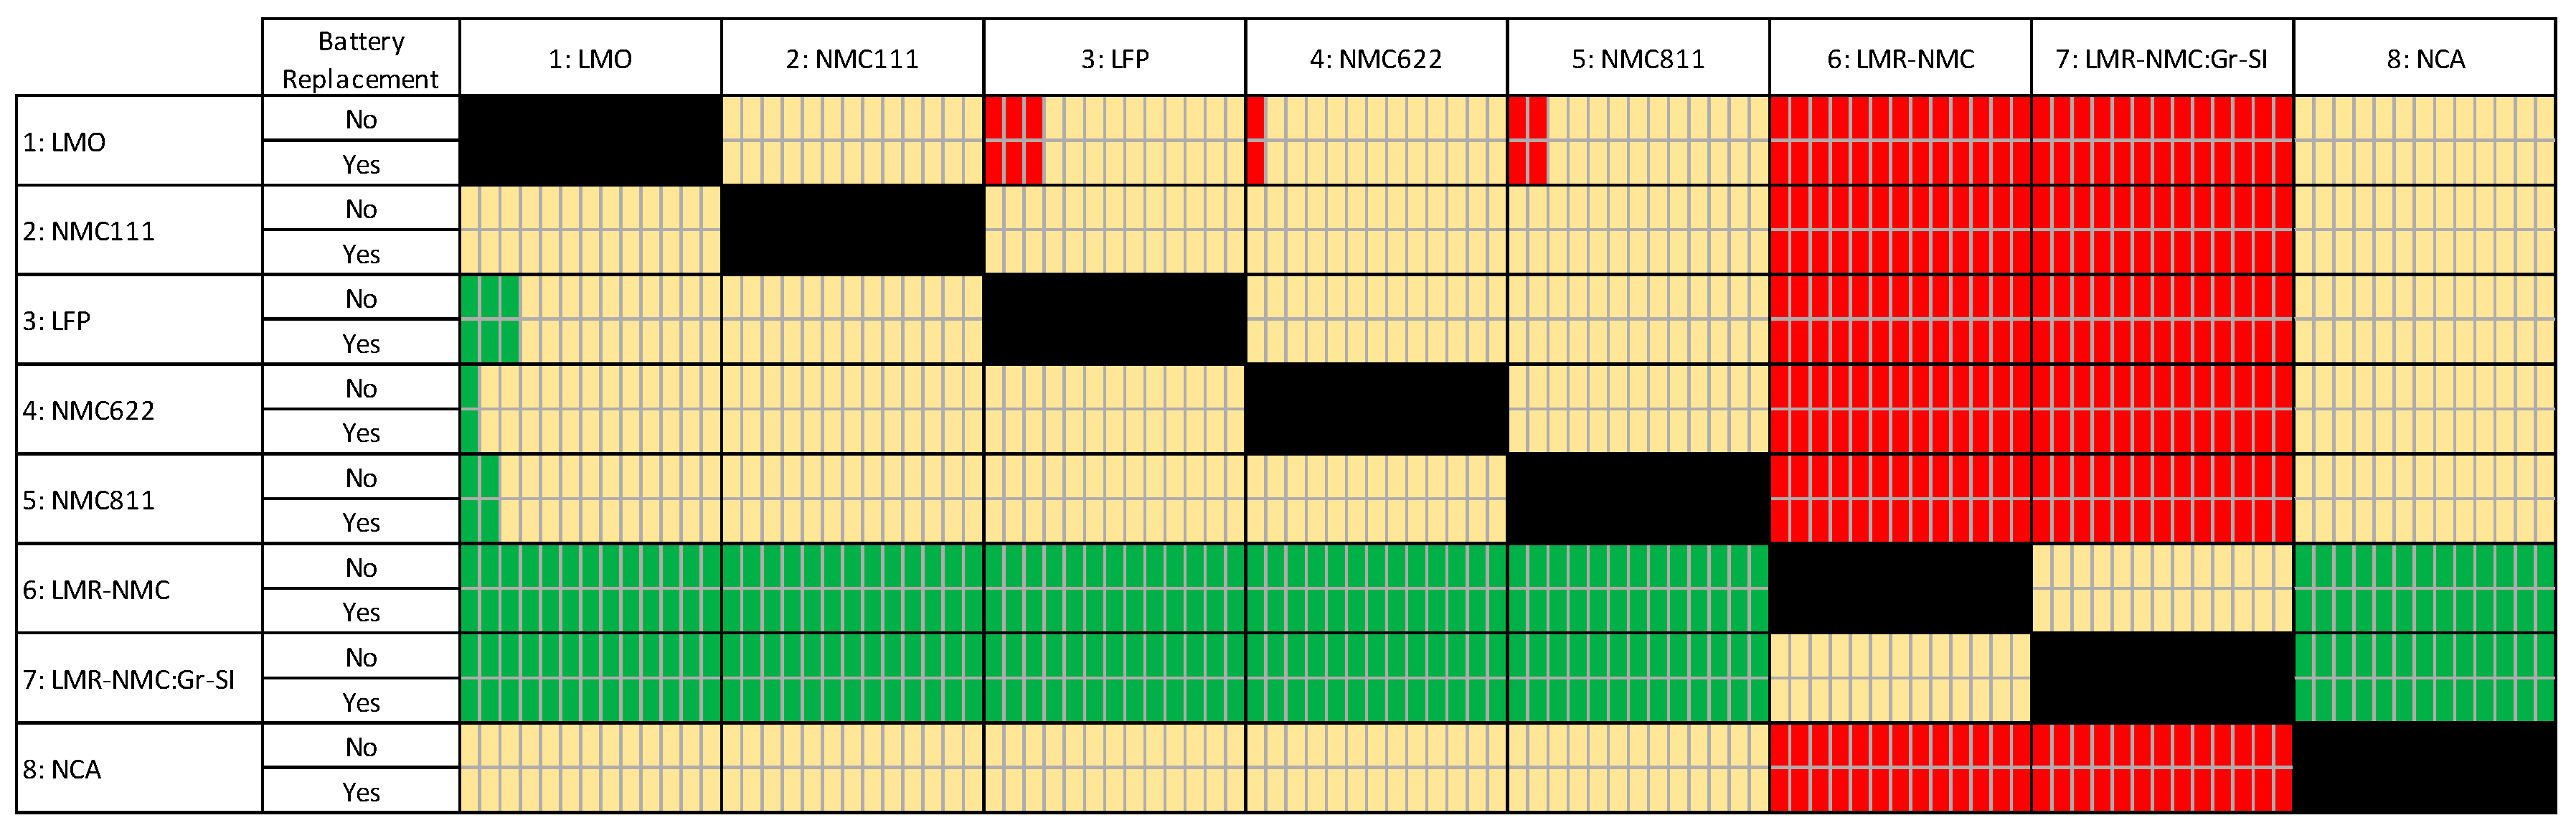
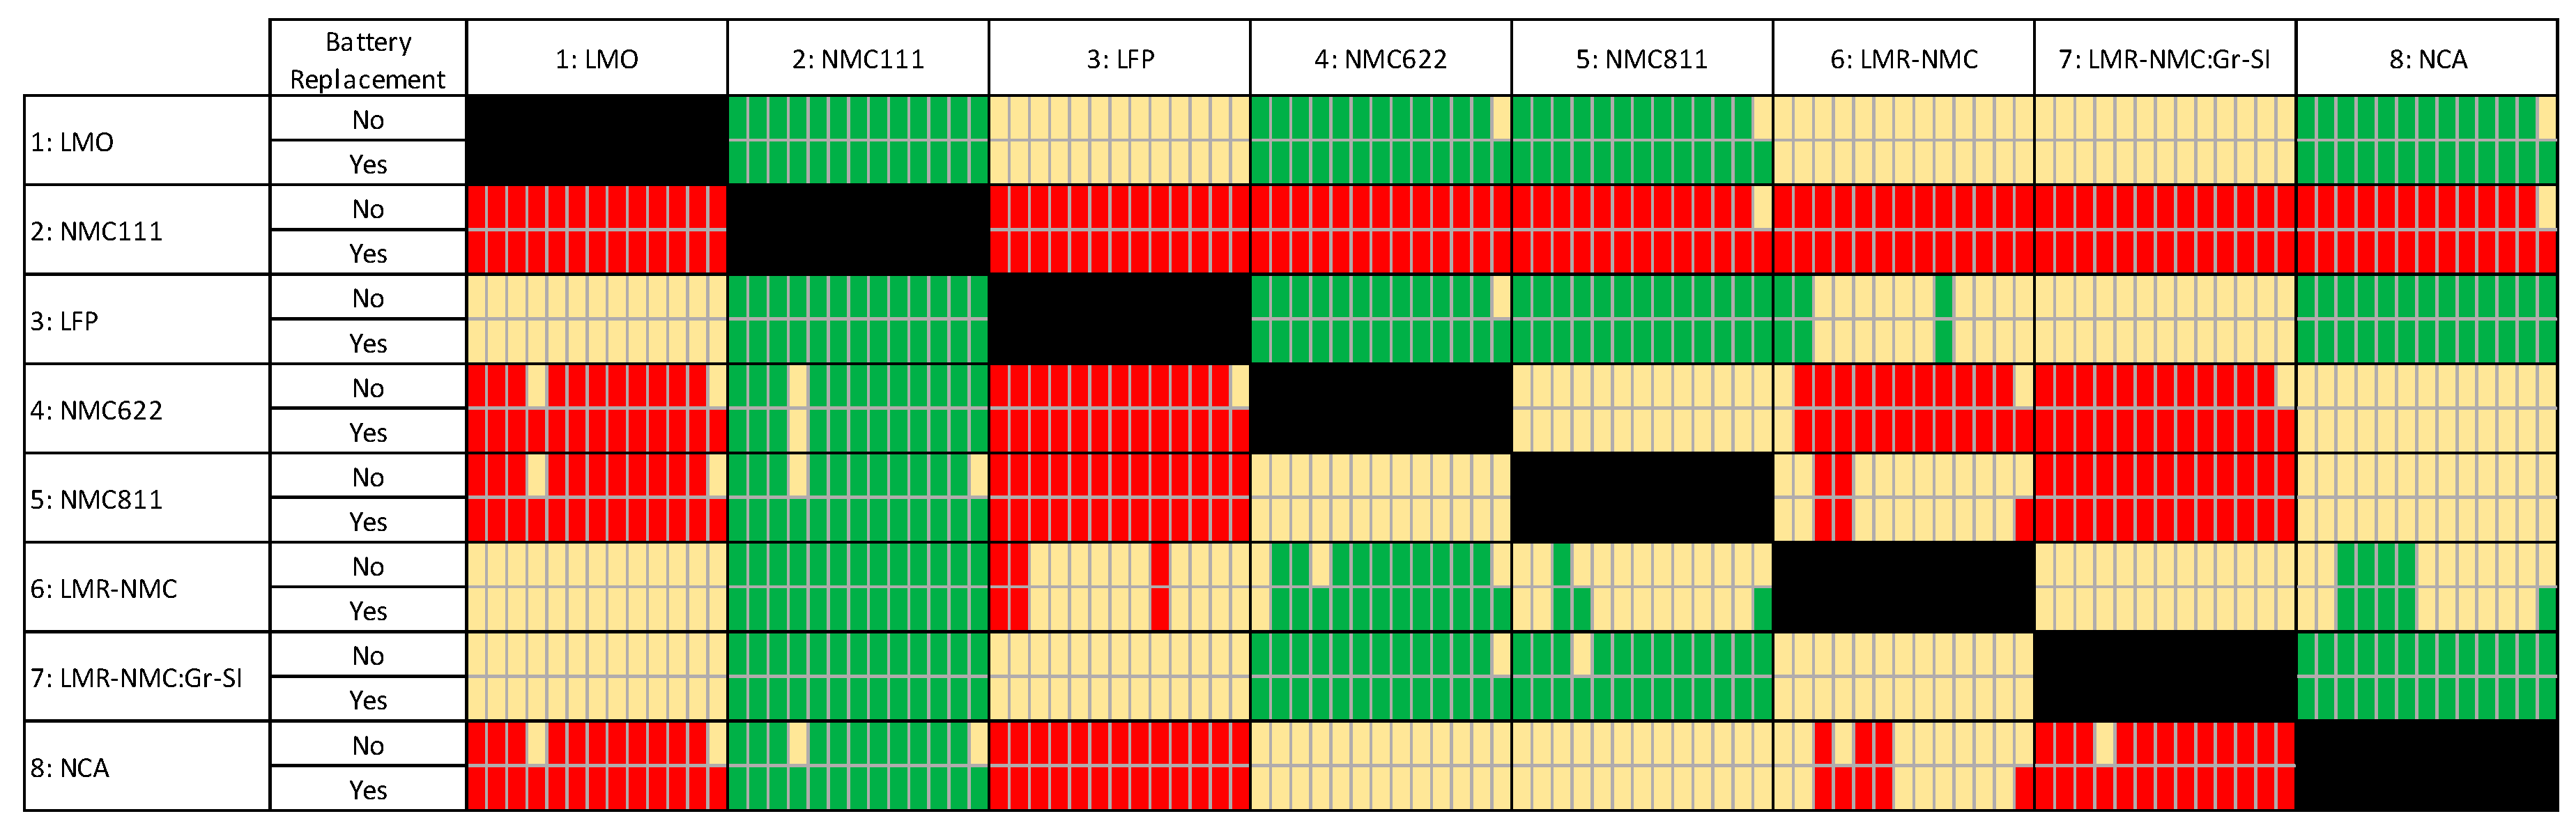
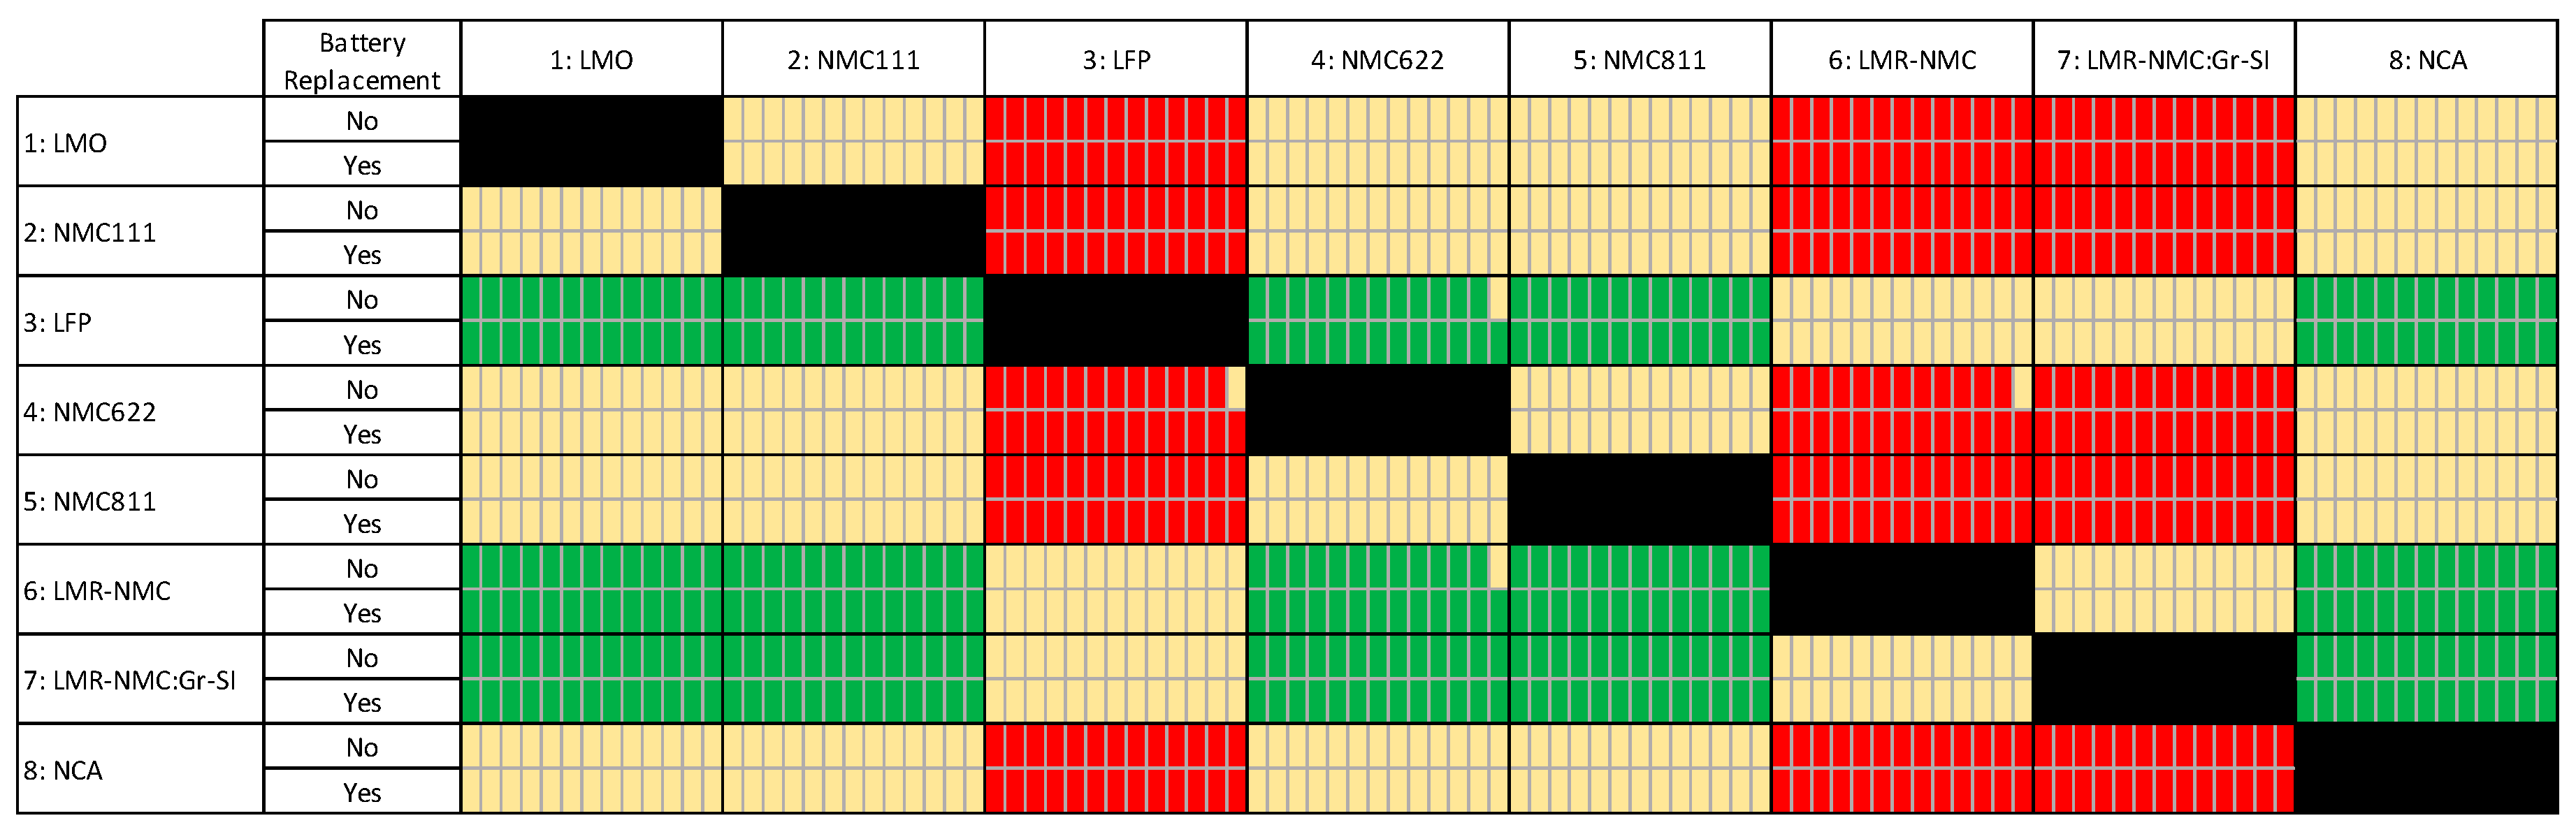
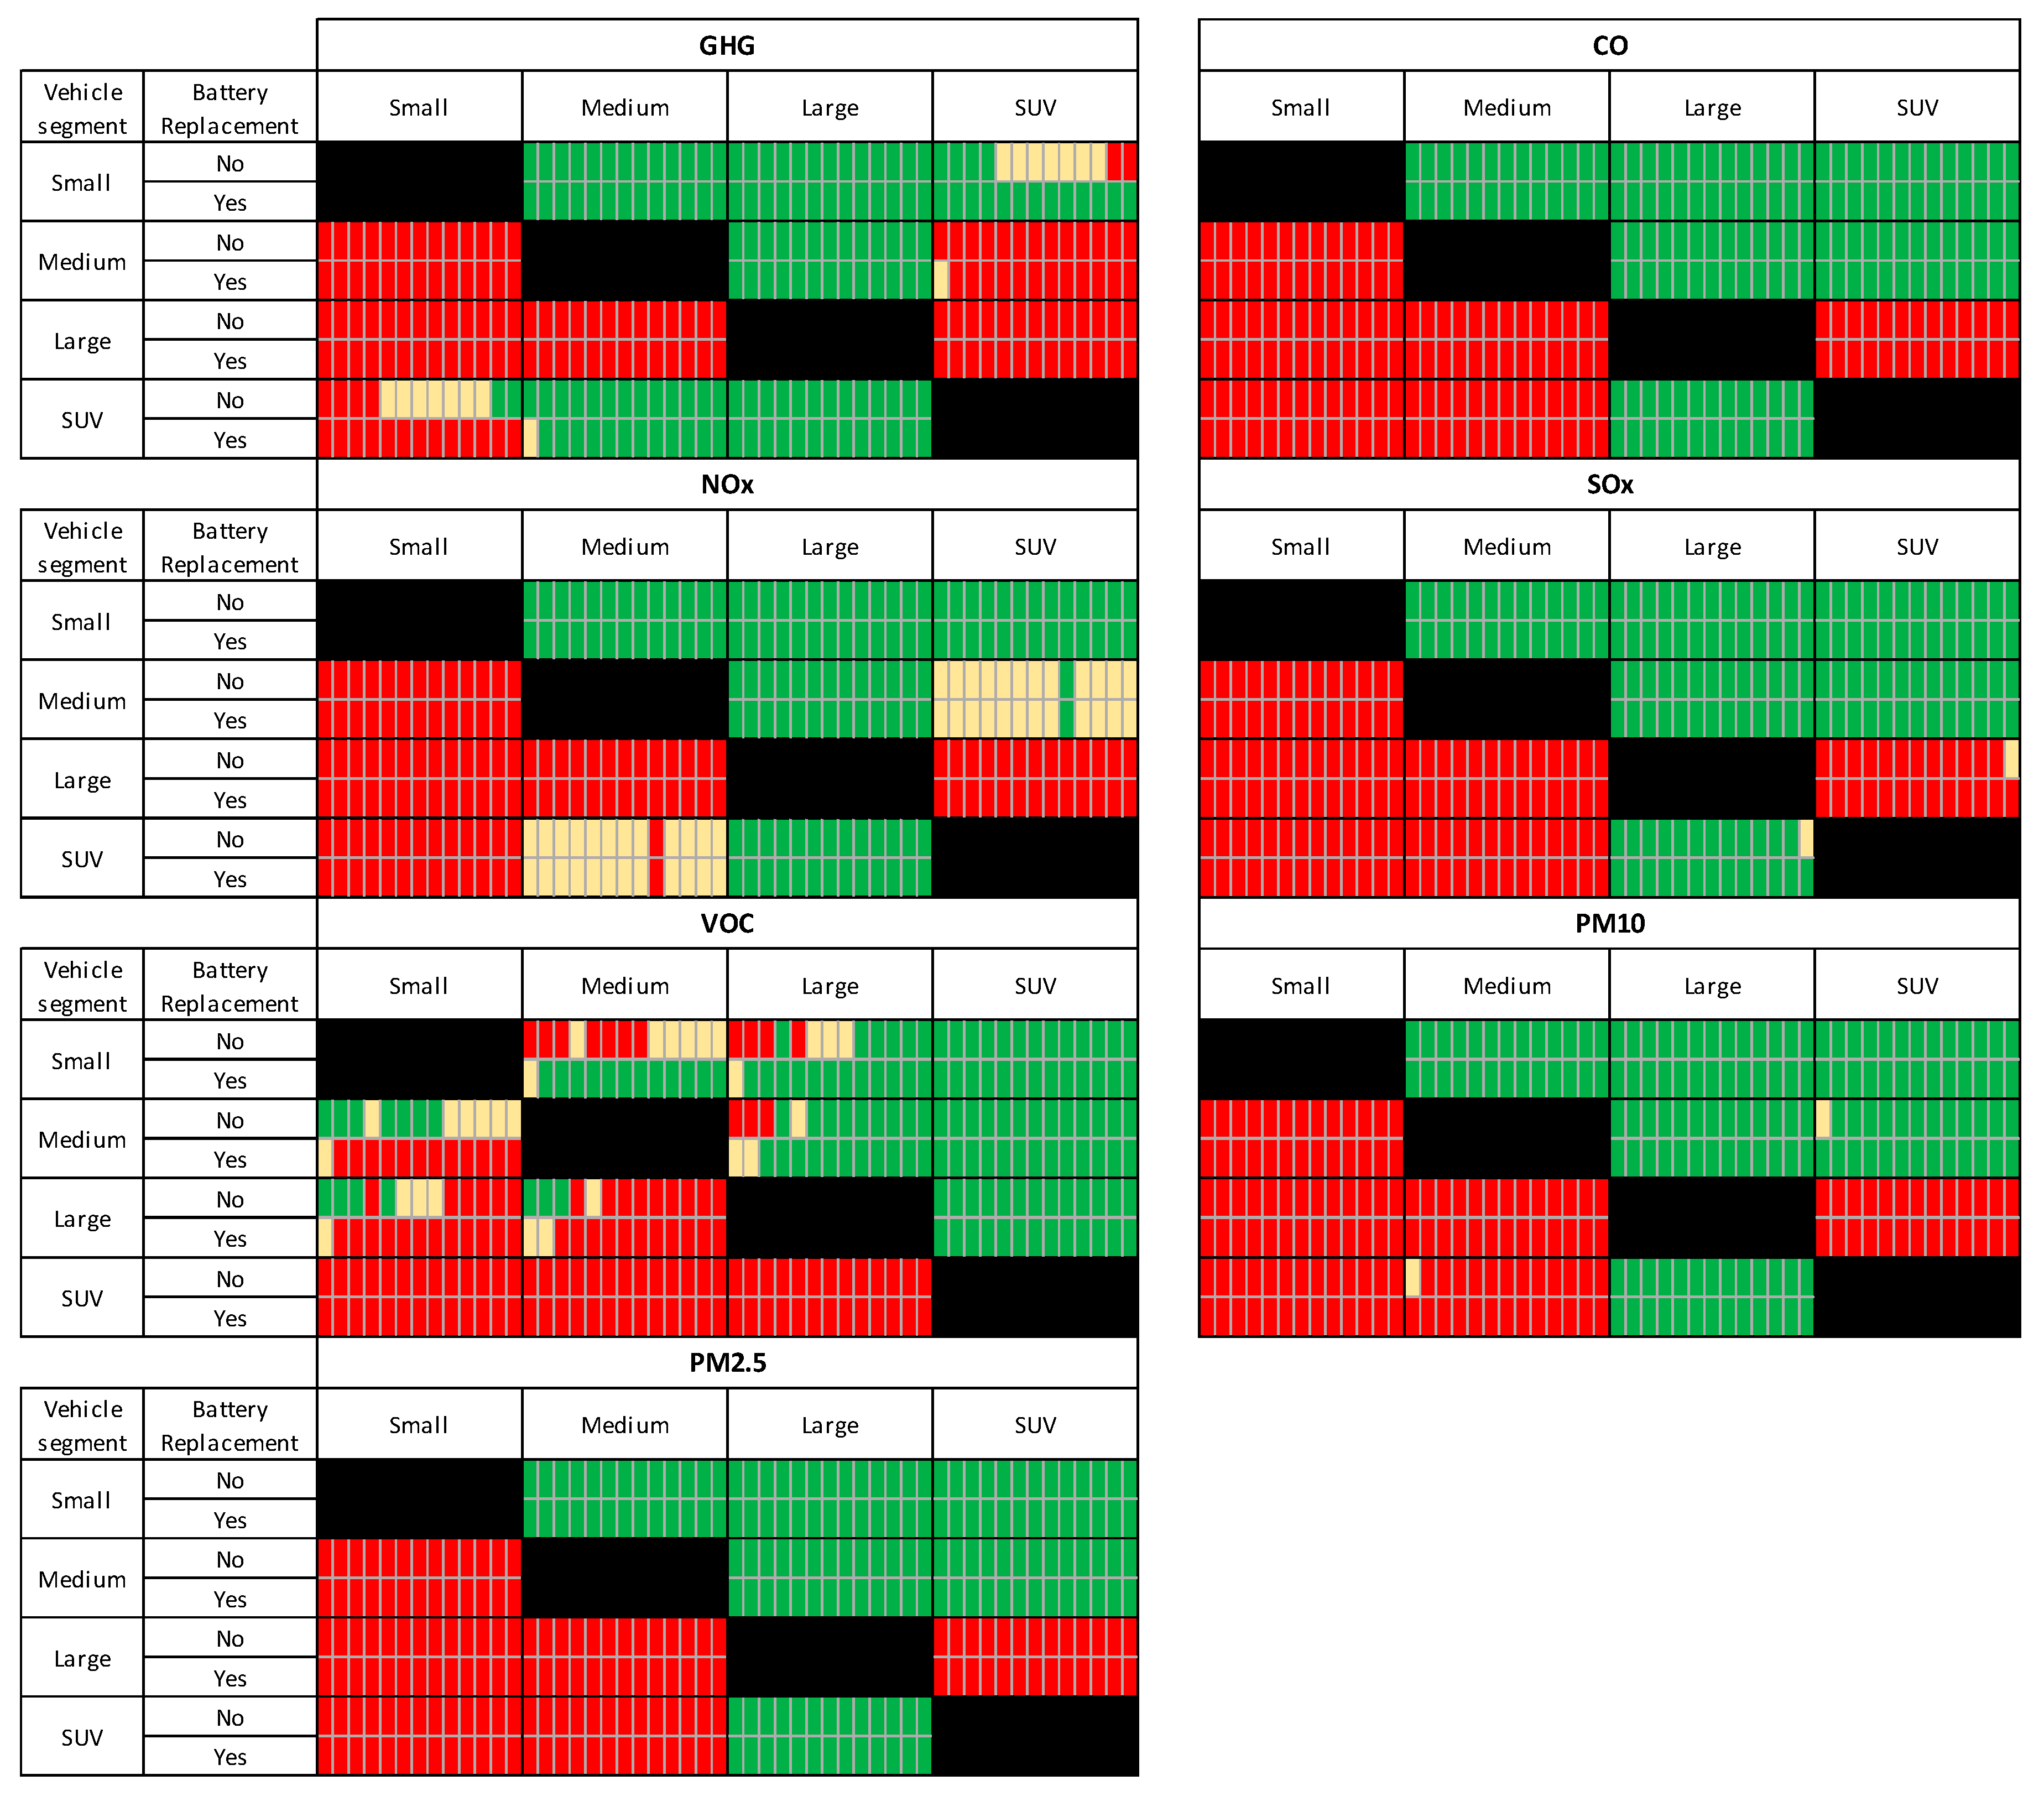
  • In general, results show a clear trend for LIB chemistries 1, 3, 6, and 7 to be cleaner than chemistries 2, 4, 5, and 8.
  • That trend is mildly affected by the carbon content of the electricity mix and primary energy source. High coal mixes tend to make all LIB chemistries more similar to each other for most pollutants, whereas for PM10, the same also happens for high biomass mixes.
  • The consideration of one battery replacement has only a marginal effect in the results, again, biasing chemistries towards equality.
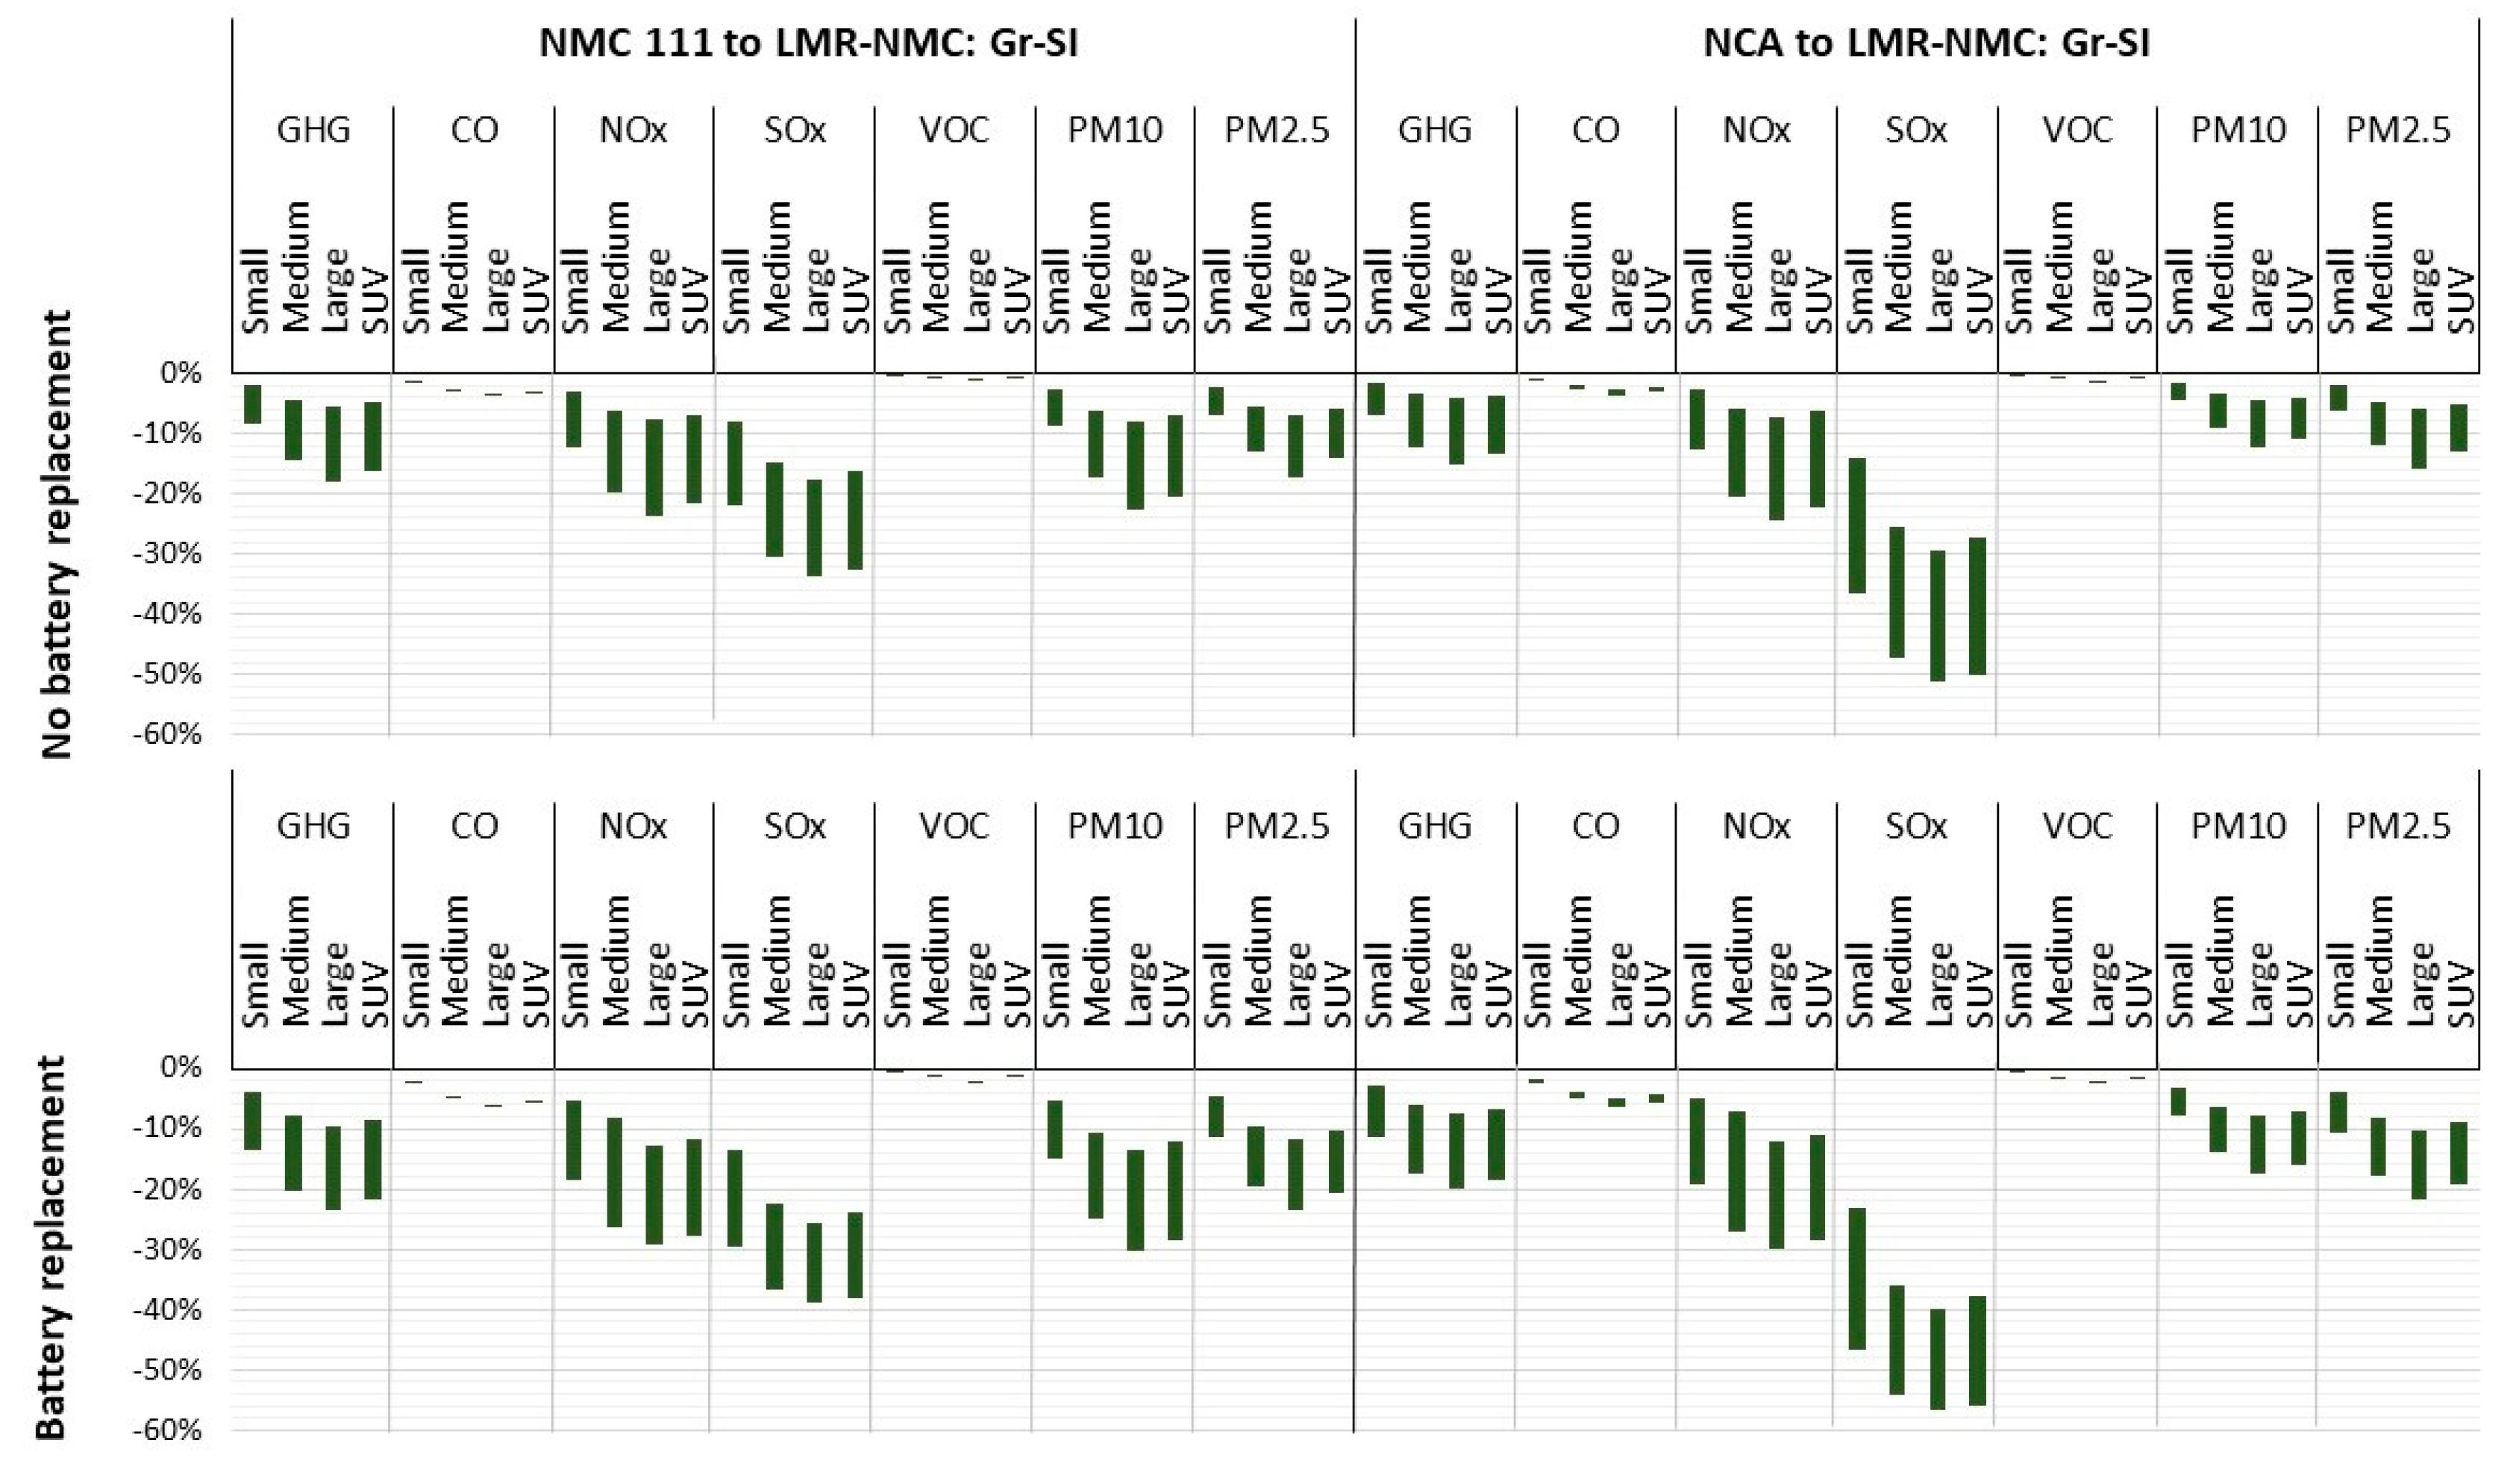
  • LIB chemistries 6 and 7 (LMR-MNC and LMR-NMC: Gr-Si) are more resilient against effects coming from either electricity mix or battery replacement factors and are cleaner when it comes to VOC. These are, thus, the more promising LIB technologies for reaching cleaner automotive transportation in the long run.
This conclusion, that new LIB chemistries, especially LMR-NMC and LMR-NMC: Gr-Si, are statistically less pollutant than older ones is one of the main outcomes of this research. Not only that, they also have the highest energy densities (recall Figure 1). Higher densities partly explain why these chemistries are less pollutant, as it means less mass for the same capacity, hence less materials used. But this is not the only reason: If NCA energy densities are given to the LMR chemistries, the latter still remain statistically less pollutant. In fact, chemistries 1 and 3 are cleaner than current chemistries despite having lower energy densities.
Turning now to the segment factor, Figure 14 summarizes the results for pairwise comparisons across all LIB chemistries.
From Figure 14, it is possible to conclude that, except for VOC, the statistical results suggest an ordering, from cleaner to dirtier, of small < medium < SUV < large. The trend that the smaller the vehicle is, the cleaner it is, not only in absolute terms but also in relative terms when compared with their ICEV counterparts, is by no means trivial and is one of the main results of this study.
Going on to the finer details, one sees that most pollutants behave very regularly and according to the main trend. It is only for GHG and VOC that some deviations occur, which are now discussed. For GHG, when no battery replacement is considered, SUV and small vehicles gradually swap positions as the mix goes from cleaner to dirtier. The need for a replacement would make small vehicles greener, signaling that this replacement penalizes SUV in GHG emissions due to their larger battery size. Without replacement, SUV become cleaner than small vehicles (when looked upon in ratio variables).
The VOC situation has two peculiarities: First, large vehicles are less pollutant than SUV, reverting the main trend for these two segments. This is due to the SUV higher amounts of on-board fluids (engine and transmission oil, powertrain coolant), which cause greater VOC emissions. Second, it is the only case in which small vehicles underperform when compared to medium and large ones. This happens only without battery replacement and for the cleaner electricity mixes. Because the differences in ratio variables is very small, but statistically significant nonetheless, it is not possible to indicate a major reason for this.

3.2. How Much Cleaner Does It Get?

Having ascertained that LIB chemistry and segment do make a statistical difference in terms of emissions estimates, it is interesting to check how far the difference can go. Since vehicle segment is a consumer choice, made according to its personal needs and therefore not likely to change for environmental reasons in the near-future, the LIB chemistry factor is arguably more important to focus on.
Figure 15 indicates, displayed across segments, the emissions reductions for all pollutants in going from the conventional NMC111 and NCA chemistries to the newer, arguably cleaner, LMR-NMC: Gr-Si technology.
The emissions reductions range from marginal (below 10%) to considerable (50%–60%) depending on pollutant type. For clarification, note that a maximum reduction percentage of, say, 50% in a certain pollutant and segment means that there is an electricity mix and segment for which the ratio-to-ICEV variable for that pollutant can drop by one-half. In fact, the same happens for the absolute (non-ratio) emissions estimates values.
Results of emissions reductions coming from the chemistry change exhibit some variability with the electricity mix. For GHG and SOx, it can be checked that the cleaner the mix, the greater the reduction is. For NOx and PM, the fluctuations are mostly due to the mixes with more emissions in the respective pollutant (mix 9, mix 4), in which case the reductions are smaller. For VOC and CO, the reductions are practically independent of the mix. Recall that the cleaner the mix is, the more important the vehicle cycle is.
Overall, the figure shows that a technological shift towards new chemistries has the potential to reduce environmental impact of BEV for most pollutants. Note, though, that certain pollutants are not very much influenced by the LIB chemistry e.g., the VOC emissions, whose principal cause are the vehicle fluids, and the CO, which is mainly caused by the energy mix. Despite this weaker link, results show that the dependency on LIB chemistry is statistically relevant. For the remaining pollutants, significant reductions can be achieved, particularly in SOx. Because BEV emit more SOx and PM than ICEV in their life cycle, reductions in these pollutants are particularly important but, in practice, even with these reductions, BEV still remain the more pollutant vehicle type.
Note that when battery replacement is considered during the vehicle lifetime, the reduction percentages in general increase. This is because the comparison is between two battery types; the more replacements there are, the wider the emissions gap between the two is.

4. Conclusions

This article presented a statistical study of life cycle emissions assessment of several pollutants for battery electric vehicles using the GREET 2018 life-cycle assessment model. The main objective was to determine whether newer LIB chemistries could contribute to a reduction in the environmental impact of those pollutants, and also if a dependency on vehicle segment exists. Because vehicle size has a clear influence on absolute values emissions estimates, ratio variables, i.e., ratio of emissions estimates to the corresponding petrol combustion engine estimate, were considered instead in the analysis. Eight battery chemistries, 13 mixes and four vehicle segments were considered, as well as the possibility of having one (or no) battery replacement during vehicle lifetime. A total of 884 emission estimates for each pollutant and electricity mix were assessed and statistical analysis on the outcome were performed on a per-mix basis using two-way ANOVA with Li-ion battery chemistry and vehicle segment as factors and subsequent Tukey post-hoc tests for the same factors.
Results confirm the (expected) outcome that cleaner electricity mixes lead to lower emissions estimates for all pollutants, but two other main conclusions, which are new, emerged from the statistical analysis. First, newer Li-ion battery chemistries can lead to statistically significant improvements on the environmental impact of all pollutants. Mostly, these improvements lie in the vicinity of a 10%–20% emissions reduction but can go up to 60% for sulphur oxides in the cleaner electricity mixes. Second, vehicle segment is also relevant, and a cleanness rank emerged of smaller < medium < SUV < large, with “<” signifying “less emissions than”. This rank would not be surprising if absolute emissions variables had been used, but given that ratio variables were used instead, it is in fact non-trivial. Extreme electricity mixes (cleaner or dirtier) slightly change these conclusions in some very particular cases, but overall, they hold steadily across the whole analysis.
The above conclusions clearly hint at two political courses of action, if a cleaner and more sustainable environment is to be achieved when it comes to manufacturing and use of private vehicles: An investment in the massification of newer Li-ion battery should be sought after and, at the same time, the incentives for the purchase of smaller and medium-sized battery electric vehicles should be reinforced.

Supplementary Materials

The following are available online at https://www.mdpi.com/2071-1050/11/8/2366/s1, File: Data_Set_Boxplots.docx—Figures S1–S14: boxplots representing pollutants ratio values across chemistries and vehicle segment; File: Data_Set_p-values.xlsx—data used to make Figure 7, Figure 8, Figure 9, Figure 10, Figure 11, Figure 12, Figure 13 and Figure 14; File: Data_Set_Pollutant emissions estimates and ratios.xlsx—GREET emissions estimates and ratio-to-ICEV values.

Author Contributions

Conceptualization, A.A., N.S. and J.C.-R.; methodology, N.S.; validation, A.A.; formal analysis, A.A. and N.S.; investigation, A.A.; resources, A.A.; data curation, A.A.; writing—original draft preparation, A.A., N.S. and J.C.-R.; writing—review and editing, A.A., N.S. and J.C.-R.; visualization, A.A., N.S. and J.C.-R.; supervision, N.S. and J.C.-R.; project administration, N.S. and J.C.-R.; funding acquisition, N.S.

Funding

This research was funded by Fundação para a Ciência e a Tecnologia, grant number UID/Multi/00308/2019, INESC-Coimbra R&D project “Alternative Fuel Vehicles”.

Conflicts of Interest

The authors declare no conflict of interest.

References

  1. EEA. Transport Greenhouse Gas Emissions; European Environment Agency: Copenhagen, Denmark, 2018; Available online: https://www.eea.europa.eu/downloads/9da27f7e2c9849a6948ed6e0a20d6216/1544193381/transport-ghg-emissions.pdf (accessed on 19 April 2019).
  2. IEA. Transport, Tracking Clean Energy Progress. International Energy Agency. Available online: https://www.iea.org/tcep/transport/ (accessed on 15 March 2019).
  3. ACEA. The Automobile Industry Pocket Guide 2018/2019; European Automobile Manufacturers’ Association: Brussels, Belgium, 2018; Available online: https://www.acea.be/uploads/publications/ACEA_Pocket_Guide_2018-2019.pdf (accessed on 19 April 2019).
  4. Lorenzi, G.; Baptista, P. Promotion of renewable energy sources in the Portuguese transport sector: A scenario analysis. J. Clean. Prod. 2018, 186, 918–932. [Google Scholar] [CrossRef]
  5. Irle, R. Global Plug-in Sales for the 1st Half of 2018. Available online: http://www.ev-volumes.com/country/total-world-plug-in-vehicle-volumes/ (accessed on 10 March 2019).
  6. ICCT. Electric Vehicles. Available online: https://www.theicct.org/electric-vehicles (accessed on 20 December 2018).
  7. Burch, I.; Gilchrist, J. Survey of Global Activity to Phase Out Internal Combustion Engine Vehicles; Center of Climate Protection: Santa Rosa, CA, USA, 2018. [Google Scholar]
  8. OECD/IEA. Global EV Outlook 2018—Towards Cross-Modal Electrification; International Energy Agency: Paris, France, 2018. [Google Scholar]
  9. Ding, Y.; Cano, Z.P.; Yu, A.; Lu, J.; Chen, Z. Automotive Li-Ion Batteries: Current Status and Future Perspectives. Electrochem. Energy Rev. 2019, 2, 1–28. [Google Scholar] [CrossRef]
  10. Keshavarzmohammadian, A.; Cook, S.M.; Milford, J.B. Cradle-to-gate environmental impacts of sulfur-based solid-state lithium batteries for electric vehicle applications. J. Clean. Prod. 2018, 202, 770–778. [Google Scholar] [CrossRef]
  11. Wang, Y.; Sahadeo, E.; Rubloff, G.; Lin, C.-F.; Lee, S.B. High-capacity lithium sulfur battery and beyond: A review of metal anode protection layers and perspective of solid-state electrolytes. J. Mater. Sci. 2019, 54, 3671–3693. [Google Scholar] [CrossRef]
  12. Shoji, M.; Cheng, E.J.; Kimura, T.; Kanamura, K. Recent progress for all solid state battery using sulfide and oxide solid electrolytes. J. Phys. D Appl. Phys. 2019, 52, 103001. [Google Scholar] [CrossRef]
  13. Laslau, C.; Xie, L.; Robinson, C. The Next-Generation Battery Roadmap: Quantifying How Solid-State, Lithium-Sulfur, and Other Batteries Will Emerge after 2020; Lux Research Inc.: Boston, MA, USA, 2015; Available online: https://members.luxresearchinc.com/research/report/17977 (accessed on 19 April 2019).
  14. Scrosati, B.; Garche, J. Lithium batteries: Status, prospects and future. J. Power Sour. 2010, 195, 2419–2430. [Google Scholar] [CrossRef]
  15. Feng, K.; Li, M.; Liu, W.; Kashkooli, A.G.; Xiao, X.; Cai, M.; Chen, Z. Silicon-Based Anodes for Lithium-Ion Batteries: From Fundamentals to Practical Applications. Small 2018, 14, 1702737. [Google Scholar] [CrossRef]
  16. ISO 14040. Environmental Management—Life Cycle Assessment—Principles and Framework; International Organization for Standardization: Geneva, Switzerland, 2006. [Google Scholar]
  17. Ke, W.; Zhang, S.; He, X.; Wu, Y.; Hao, J. Well-to-wheels energy consumption and emissions of electric vehicles: Mid-term implications from real-world features and air pollution control progress. Appl. Energy 2017, 188, 367–377. [Google Scholar] [CrossRef]
  18. Bicer, Y.; Dincer, I. Life cycle assessment of ammonia utilization in city transportation and power generation. J. Clean. Prod. 2018, 170, 1594–1601. [Google Scholar] [CrossRef]
  19. Wu, Z.; Wang, M.; Zheng, J.; Sun, X.; Zhao, M.; Wang, X. Life cycle greenhouse gas emission reduction potential of battery electric vehicle. J. Clean. Prod. 2018, 190, 462–470. [Google Scholar] [CrossRef]
  20. Wang, M.; Elgowainy, A.; Benavides, P.T.; Burnham, A.; Cai, H.; Dai, Q.; Hawkins, T.R.; Kelly, J.C.; Kwon, H.; Lee, D.-Y.; et al. Summary of Expansions and Updates in GREET2018; Systems Assessment Group, Energy Systems Division, Argonne National Laboratory. Available online: https://greet.es.anl.gov/files/greet-2018-summary (accessed on 10 March 2019).
  21. IPCC. Climate Change 2014: Synthesis Report. Contribution of Working Groups I, II and III to the Fifth Assessment Report of the Intergovernmental Panel on Climate Change; Pachauri, R.K., Meyer, L.A., Eds.; IPCC: Geneva, Switzerland, 2014. [Google Scholar]
  22. Nordelöf, A.; Messagie, M.; Tillman, A.-M.; Ljunggren Söderman, M.; Van Mierlo, J. Environmental impacts of hybrid, plug-in hybrid, and battery electric vehicles—What can we learn from life cycle assessment? Int. J. Life Cycle Assess. 2014, 19, 1866–1890. [Google Scholar] [CrossRef]
  23. Hawkins, T.R.; Singh, B.; Majeau-Bettez, G.; Strømman, A.H. Comparative Environmental Life Cycle Assessment of Conventional and Electric Vehicles. J. Ind. Ecol. 2012, 17, 53–64. [Google Scholar] [CrossRef] [Green Version]
  24. De Souza, L.L.P.; Lora, E.E.S.; Palacio, J.C.E.; Rocha, M.H.; Renó, M.L.G.; Venturini, O.J. Comparative environmental life cycle assessment of conventional vehicles with different fuel options, plug-in hybrid and electric vehicles for a sustainable transportation system in Brazil. J. Clean. Prod. 2018, 203, 444–468. [Google Scholar] [CrossRef]
  25. Afif, A.; Radenahmad, N.; Cheok, Q.; Shams, S.; Kim, J.H.; Azad, A.K. Ammonia-fed fuel cells: A comprehensive review. Renew. Sustain. Energy Rev. 2016, 60, 822–835. [Google Scholar] [CrossRef]
  26. Yu, A.; Wei, Y.; Chen, W.; Peng, N.; Peng, L. Life cycle environmental impacts and carbon emissions: A case study of electric and gasoline vehicles in China. Transp. Res. Part D Transp. Environ. 2018, 65, 409–420. [Google Scholar] [CrossRef]
  27. Raugei, M.; Hutchinson, A.; Morrey, D. Can electric vehicles significantly reduce our dependence on non-renewable energy? Scenarios of compact vehicles in the UK as a case in point. J. Clean. Prod. 2018, 201, 1043–1051. [Google Scholar] [CrossRef]
  28. Burchart-Korol, D.; Jursova, S.; Folęga, P.; Korol, J.; Pustejovska, P.; Blaut, A. Environmental life cycle assessment of electric vehicles in Poland and the Czech Republic. J. Clean. Prod. 2018, 202, 476–487. [Google Scholar] [CrossRef]
  29. Choi, H.; Shin, J.; Woo, J. Effect of electricity generation mix on battery electric vehicle adoption and its environmental impact. Energy Policy 2018, 121, 13–24. [Google Scholar] [CrossRef]
  30. Moro, A.; Lonza, L. Electricity carbon intensity in European Member States: Impacts on GHG emissions of electric vehicles. Transp. Res. Part D Transp. Environ. 2017. [Google Scholar] [CrossRef]
  31. Woo, J.; Choi, H.; Ahn, J. Well-to-wheel analysis of greenhouse gas emissions for electric vehicles based on electricity generation mix: A global perspective. Transp. Res. Part D Transp. Environ. 2017, 51, 340–350. [Google Scholar] [CrossRef]
  32. Onat, N.; Kucukvar, M.; Tatari, O. Towards Life Cycle Sustainability Assessment of Alternative Passenger Vehicles. Sustainability 2014, 6, 9305–9342. [Google Scholar] [CrossRef] [Green Version]
  33. Karaaslan, E.; Zhao, Y.; Tatari, O. Comparative life cycle assessment of sport utility vehicles with different fuel options. Int. J. Life Cycle Assess. 2018, 23, 333–347. [Google Scholar] [CrossRef]
  34. Ambrose, H.; Kendall, A. Effects of battery chemistry and performance on the life cycle greenhouse gas intensity of electric mobility. Transp. Res. Part D Transp. Environ. 2016, 47, 182–194. [Google Scholar] [CrossRef] [Green Version]
  35. Hao, H.M.Z.; Jiang, S.; Liu, Z.; Zhao, F. GHG Emissions from the Production of Lithium-Ion Batteries for Electric Vehicles in China. Sustainability 2017, 9, 504. [Google Scholar] [CrossRef]
  36. Peters, J.F.; Weil, M. Providing a common base for life cycle assessments of Li-Ion batteries. J. Clean. Prod. 2018, 171, 704–713. [Google Scholar] [CrossRef]
  37. Fan, Y.V.; Perry, S.; Klemeš, J.J.; Lee, C.T. A review on air emissions assessment: Transportation. J. Clean. Prod. 2018, 194, 673–684. [Google Scholar] [CrossRef]
  38. EEA. Air Quality in Europe—2018 Report; European Environment Agency: Luxembourg; Publications Office of the European Union: Luxembourg, 2018; Available online: https://www.eea.europa.eu/publications/air-quality-in-europe-2018 (accessed on 19 April 2019).
  39. Anenberg, S.; Miller, J.; Henze, D.; Minjares, R. A Global Snapshot of the Air Pollution-Related Health Impacts of Transportation Sector Emissions in 2010 and 2015; International Council on Clean Transportation: Washington, DC, USA, 2019; Available online: https://www.theicct.org/sites/default/files/publications/Global_health_impacts_transport_emissions_2010-2015_20190226.pdf (accessed on 19 April 2019).
  40. EV Database. Electric Vehicle Database. Available online: https://ev-database.uk (accessed on 10 March 2019).
  41. Pavlovic, J.; Ciuffo, B.; Fontaras, G.; Valverde, V.; Marotta, A. How much difference in type-approval CO2 emissions from passenger cars in Europe can be expected from changing to the new test procedure (NEDC vs. WLTP)? Transp. Res. Part A Policy Pract. 2018, 111, 136–147. [Google Scholar] [CrossRef]
  42. Pavlovic, J.; Marotta, A.; Ciuffo, B. CO2 emissions and energy demands of vehicles tested under the NEDC and the new WLTP type approval test procedures. Appl. Energy 2016, 177, 661–670. [Google Scholar] [CrossRef]
  43. Tsiakmakis, S.; Fontaras, G.; Cubito, C.; Pavlovic, J.; Anagnostopoulos, K.; Ciuffo, B. From NEDC to WLTP: Effect on the Type-Approval CO2 Emissions of Light-Duty Vehicles; EUR 28724 EN; Publications Office of the European Union: Luxembourg, 2017. [Google Scholar]
  44. Dai, Q.; Kelly, J.C.; Dunn, J.; Benavides, P.T. Update of Bill-of-Materials and Cathode Materials Production for Lithium-Ion Batteries in the GREET Model; Systems Assessment Group, Energy Systems Division, Argonne National Laboratory: Lemont, IL, USA, 2018. Available online: https://greet.es.anl.gov/publication-update_bom_cm (accessed on 19 April 2019).
  45. Zubi, G.; Dufo-López, R.; Carvalho, M.; Pasaoglu, G. The lithium-ion battery: State of the art and future perspectives. Renew. Sustain. Energy Rev. 2018, 89, 292–308. [Google Scholar] [CrossRef]
  46. OECD/IEA. Electricity Information; International Energy Agency: Paris, France, 2018. [Google Scholar]
  47. OECD/IEA. World Energy Outlook 2018; International Energy Agency: Paris, France, 2018. [Google Scholar]
  48. Argonne National Laboratory. GREET Life-Cycle Model; Argonne National Laboratory: Lemon, IL, USA, 2014. Available online: https://greet.es.anl.gov/files/greet-model (accessed on 19 April 2019).
  49. Curran, S.J.; Wagner, R.M.; Graves, R.L.; Keller, M.; Green, J.B., Jr. Well-to-wheel analysis of direct and indirect use of natural gas in passenger vehicles. Energy 2014, 75, 194–203. [Google Scholar] [CrossRef] [Green Version]
  50. Tong, F.; Jaramillo, P.; Azevedo, I.M.L. Comparison of Life Cycle Greenhouse Gases from Natural Gas Pathways for Light-Duty Vehicles. Energy Fuels 2015, 29, 6008–6018. [Google Scholar] [CrossRef] [Green Version]
  51. Mitropoulos, L.K.; Prevedouros, P.D.; Kopelias, P. Total cost of ownership and externalities of conventional, hybrid and electric vehicle. Transp. Res. Procedia 2017, 24, 267–274. [Google Scholar] [CrossRef]
Figure 1. Battery energy density.
Sustainability 11 02366 g001
Figure 2. Electricity generation mixes considered in the life-cycle assessment (LCA) analysis.
Sustainability 11 02366 g002
Figure 3. Greenhouse gas (GHG) emission estimates of electricity generation for all the considered mixes.
Sustainability 11 02366 g003
Figure 4. Structure of the inputs and outputs of the GREET 2018 life cycle model.
Sustainability 11 02366 g004
Figure 5. Impact of electricity generation mix and battery chemistry on GHG ratio.
Sustainability 11 02366 g005
Figure 6. Impact of electricity generation mix and vehicle segment on GHG ratio.
Sustainability 11 02366 g006
Figure 7. Chemistry pairwise comparisons for the GHG emission estimates (ratio-to-ICEV).
Sustainability 11 02366 g007
Figure 8. Chemistry pairwise comparisons for the CO emission estimates (ratio-to-ICEV).
Sustainability 11 02366 g008
Figure 9. Chemistry pairwise comparisons for the NOx emission estimates (ratio-to-ICEV).
Sustainability 11 02366 g009
Figure 10. Chemistry pairwise comparisons for the SOx emission estimates (ratio-to-ICEV).
Sustainability 11 02366 g010
Figure 11. Chemistry pairwise comparisons for the VOC emission estimates (ratio-to-ICEV).
Sustainability 11 02366 g011
Figure 12. Chemistry pairwise comparisons for the PM10 emission estimates (ratio-to-ICEV).
Sustainability 11 02366 g012
Figure 13. Chemistry pairwise comparisons for the PM2.5 emission estimates (ratio-to-ICEV).
Sustainability 11 02366 g013
Figure 14. Vehicle segment pairwise comparisons for all pollutants (ratio-to-ICEV).
Sustainability 11 02366 g014
Figure 15. Reduction percentages in emission estimates from changing battery chemistry. Minimum and maximum obtained across electricity mix.
Sustainability 11 02366 g015
Table 1. Data for greenhouse gases, regulated emissions, and energy use in transportation (GREET) model.
Vehicle SegmentCurb Weight of BEV (without Battery) (kg)Battery Capacity (kwh)Consumption (kwh/100 km)Curb Weight of ICEV (kg)Consumption (L/100 km)
Small950181210005.0
Medium1250501415006.0
Large1600902020007.5
SUV19009022230010.0
Table 2. Types available in the GREET 2018 model.
1: LMOLithium Manganese Oxide coupled with a graphite anode material LiMn2O4
2: LFPLithium iron phosphate oxide coupled with a graphite anode material LiFePO4
3: NMC111Lithium-Nickel Manganese Cobalt oxide coupled with a graphite anode material LiNi0.33Mn0.33Co0.33O2
4: NMC622Lithium-Nickel Manganese Cobalt oxide coupled with a graphite anode material LiNi0.6Mn0.2Co0.2O2
5: NMC811Lithium-Nickel Manganese Cobalt oxide coupled with a graphite anode material LiNi0.8Mn0.1Co0.1O2
6: LMR-NMC: GrLithium Manganese Rich-Nickel Manganese Cobalt oxide coupled with a graphite anode material 0.5Li2MnO3.0.5Li-Ni0.44Co0.25Mn0.31O2
7: LMR-NMC: Gr-SILithium Manganese Rich-Nickel Manganese Cobalt oxide coupled with a graphite-silicon blend anode material 0.5Li2MnO3.0.5Li-Ni0.44Co0.25Mn0.31O2
8: NCALithium- Nickel Cobalt Aluminium oxide coupled with a graphite anode material LiNiCoAlO2
Table 3. Mass composition (%).
ComponentLMONMC111LFPNMC622NMC811LMR-NMC: GrLMR-NMC: Gr-SINCA
Cathode active material30.725.223.823.122.219.523.921.6
Wrought aluminum22.723.923.124.624.522.425.024.9
Graphite/Carbon12.715.713.816.515.920.25.617.1
Copper11.611.710.411.811.514.819.812.1
Silicon0.00.00.00.00.00.01.70.0
Binder2.32.22.02.12.52.12.02.0
Electrolyte10.910.616.110.512.112.913.010.5
Plastic1.661.671.501.671.643.84.51.7
Steel0.60.60.70.60.61.41.20.6
Thermal insulation0.40.50.50.50.50.40.40.5
Coolant (Glycol)3.44.35.14.64.61.11.34.8
Electronic parts3.13.73.04.03.81.51.74.1
Plastic = Polypropylene + Polyethylene + Polyethylene Terephthalate; Electrolyte = Ethylene Carbonate + Dimethyl Carbonate + LiPF6.
Table 4. t-tests p-values battery electric vehicles (BEV) vs. internal combustion engines vehicle (ICEV) (ratio variables).
No battery ReplacementBattery Replacement
GHGCONOxSOxVOCPM10PM2.5GHGCO NOxSOxVOCPM10PM2.5
1: Iceland Others0%0%0%0%0%99%0%0%0%0%0%0%0%44%
2: France Nuclear0%0%0%0%0%0%22%0%0%0%0%0%0%0%
3: 2040 SDS0%0%0%0%0%0%0%0%0%0%0%0%0%0%
4: Denmark Biomass0%0%0%0%0%0%0%0%0%0%0%0%0%0%
5: OECD Europe0%0%0%0%0%0%0%0%0%0%0%0%0%0%
6: 2040 NPS0%0%0%0%0%0%0%0%0%0%0%0%0%0%
7: OECD Americas0%0%0%0%0%0%0%0%0%0%0%0%0%0%
8: 2040 CPS0%0%0%0%0%0%0%0%0%0%0%0%0%0%
9: Mexico Residual oil0%0%0%0%0%0%0%0%0%0%0%0%0%0%
10: 20170%0%0%0%0%0%0%0%0%18%0%0%0%0%
11: OECD Asia Oceania0%0%0%0%0%0%0%0%0%27%0%0%0%0%
12: Israel Natural gas0%0%0%0%0%0%0%0%0%20%0%0%0%0%
13: Estonia Coal99%0%0%0%0%0%0%0%0%59%0%0%0%0%

