Abstract
Exploring the sensitivity of rural households’ livelihood strategies to livelihood capital is of great significance for improving rural households’ livelihood levels. This paper selects 23 livelihood capital measurement indicators and conducts an in-depth survey of rural households. In addition, the entropy method and a weighted comprehensive model are used to explore the basic characteristics of rural households’ livelihood capital in the upper reaches of the Min River, China, in 2017. Furthermore, econometric models are used to analyze the sensitivity of rural households’ livelihood strategies to livelihood capital. As indicated from the research, the livelihood capital levels of different types of rural households in the study area are not equivalent. The types of rural households with different livelihood strategies can be ordered in terms of quantity as follows: non-agricultural type > non-agricultural dominant type > agricultural dominant type > pure agricultural type. Livelihood strategies have different sensitivities to different livelihood capital measurement indicators. Among these indicators, cash income, the number of relatives and friends available for financial assistance, and the number of civil servants have positive effects on the livelihood strategy selection of non-agricultural dominant rural households and non-agricultural rural households. However, the average age of laborers, area of cultivated land and gardens, number of livestock and poultry, and present value of production tools have negative effects. These evaluation results can provide a scientific decision-making basis for the formulation of poverty alleviation policies by relevant government departments.
1. Introduction
Livelihood is “a means or way of life” and a way of making a living based on ability, capital, and activity [1]. As the smallest livelihood unit in rural society, rural households bear multiple livelihood risks, such as nature, market, and policies [2]. The sustainability of rural households’ livelihood has a vital impact on the livelihood security of rural households, the sustainable development of rural areas, and even the future trends of rural human-land relationships [3]. Therefore, it is of great theoretical and practical significance to explore the sustainability of rural households’ livelihood. For a long time, the issue of rural households’ livelihood has been a global focus, especially in developing countries [4,5,6]. With the deepening of research on livelihood issues conducted by relevant scholars, the sustainable livelihood approach (SLA) has gradually developed in theory and practice [7,8,9,10], and the framework for sustainable livelihood analysis proposed by the U.K.’s Department for International Development (DFID) is the most typical. This framework consists of five parts: vulnerability background, livelihood capital, organizational structure and policy system, livelihood strategy, and livelihood status; additionally, it regards rural households as the activity subjects in the vulnerability background and reflects the rural households’ livelihoods from the aspects of livelihood capital, livelihood strategies, and livelihood status [2,11]. Specifically, livelihood capital represents the elements that enhance people’s capacity to engage in different livelihood activities, and it not only plays a major role in making a living but also offers people the opportunity to influence the institutions and structures within which they operate [12,13]. However, livelihood strategies refer to different types of livelihood activities adopted by rural households, and the ability of rural households to implement different livelihood strategies depends on the status of their livelihood capital [14,15]. The framework provides a new research perspective for relevant scholars. On this basis, scholars have discussed and analyzed the structure and spatial characteristics of rural households’ livelihood capital as well as rural households’ livelihood strategy selection [16,17], the impact of livelihood capital and livelihood risk on livelihood strategies [18,19], the influence of climate change, labor migration and returning farmland to forests on rural households’ livelihood capital [20,21,22], and livelihood risk and sustainability [23,24,25] from different research scales. For example, Baffoe and Matsuda assessed rural livelihood assets from a gender perspective in Ghana [12]. Masud et al. evaluated community standards of living using the SLA as an analytical framework within the marine park areas (MPAs) in Peninsular Malaysia [17]. Liu et al. and Milad et al. estimated the influence of livelihood assets on livelihood strategies in the western mountainous area of China and the Hara Biosphere Reserve of Iran [18,19]. Sagynbekova examined the links among the environment, rural livelihoods, and labor migration in central Kyrgyzstan [21]. However, few studies have focused on the sensitivity of rural households’ livelihood strategies to livelihood capital. With the rapid development of urbanization, numerous surplus rural laborers have selected migrant work, and the proportions of non-agricultural laborers and part-time laborers among the total laborers in rural households are increasing, while the proportion of pure agricultural laborers is decreasing, which results in the differentiation of rural households. Corresponding to the differentiation process of rural households is the continuous adjustment of rural households’ livelihood capital structure and livelihood strategies; thus, the sensitivity of livelihood strategies to various types of livelihood capital is also continuously changing.
As China’s largest Qiang population area, the upper reaches of the Min River is considered to be key to the socioeconomic development and national unity of Sichuan Province. Furthermore, this area is an ecological barrier of the upper reaches of the Yangtze River and an important water source for the Chengdu Plain. Due to the influence of the natural environment, socioeconomic development level, and other factors, China’s concentrated contiguous poverty-stricken areas, including the upper reaches of the Min River, have been trapped in a “poverty trap” for a long time [26,27]. In 2015, the Central Poverty Alleviation and Development Working Conference clearly stated that “China will achieve the goal of poverty alleviation for the rural poor and regional overall poverty alleviation under the current standards by 2020”; among these areas, 14 concentrated contiguous poverty-stricken areas identified by the Chinese government are the important areas for regional poverty alleviation [28]. “The Plan for Rural Revitalization Strategy in China (2018–2022)” has noted that it is necessary to take precise poverty alleviation as the priority task for the implementation of rural revitalization strategy to promote the organic integration and mutual promotion of poverty alleviation and rural revitalization. In the current critical period of poverty alleviation, it is of great practical significance to explore the sensitivity of rural households’ livelihood strategies to livelihood capital in the upper reaches of the Min River, China, from the perspective of livelihood and propose targeted policies of rural households’ livelihood sustainability to achieve the goal of regional poverty alleviation and rural revitalization strategy in the region.
Based on the above analysis, this paper takes the upper reaches of the Min River as the research area. First, the basic characteristics of rural households’ livelihood capital in 2017 are analyzed in accordance with the microsurvey data of rural households. Moreover, econometric models are used to explore the sensitivity of different types of rural households’ livelihood strategies to livelihood capital. The analysis results can provide the scientific decision-making basis for the sustainable development of rural households in the upper reaches of Min River, China, and the formulation of poverty alleviation policies by relevant government departments.
2. Overview of the Research Area
Located in Sichuan Province, the upper reaches of the Min River (31°26′–33°16′ N, 102°59′–104°14′ E) represent the transitional zone between the Qinghai-Tibet Plateau and the Sichuan Basin. With a basin area of approximately 22,000 km2, this region coincides with the administrative jurisdictions of Li County, Mao County, Wenchuan County, Songpan County, and Heishui County of Tibetan Qiang Autonomous Prefecture of Ngawa in Sichuan Province (Figure 1). Mainly inhabited by Tibetan, Qiang, and Hui ethnic minorities, this region is a poverty-stricken mountainous area with a relatively backward economy, and it belongs to the scope of 14 concentrated contiguous poverty-stricken areas stipulated in “The Outline for Rural Poverty Alleviation and Development in China (2011–2020)” [29].
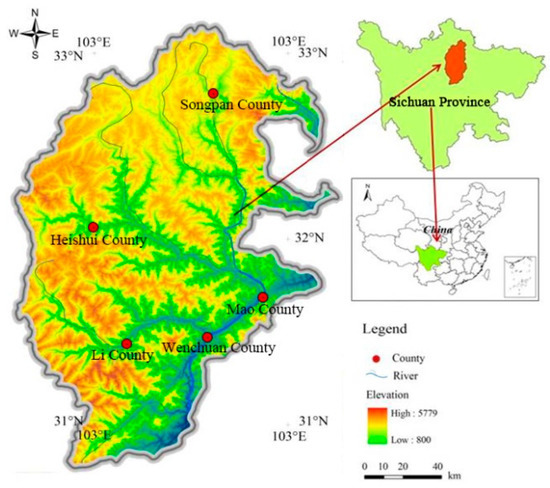
Figure 1.
The location map of the upper reaches of the Min River, China.
In recent years, various poverty alleviation projects have been vigorously promoted in the upper reaches of the Min River, China, and farmers’ lives have been greatly improved; however, many rural people are still in poverty. According to statistics, in 2017, the resident population of the upper reaches of the Min River, China, was 398,200, including approximately 137,500 agricultural populations and approximately 14,100 absolutely poverty-stricken populations; furthermore, the poverty rate reached 3.54%, which was 0.44 percentage points higher than the national poverty rate in the same year [30]. According to the grouping of per capita disposable income of cities and counties in Sichuan Province in 2017 (which can be divided into four groups, namely, the high-income group, middle and high-income group, middle and low-income group, and low-income group), the five counties in the upper reaches of the Min River, China, belonged to the low-income group (Heishui County) and the middle and low-income group (the other four counties), and the per capita disposable income was only 10,766 yuan/year. In the same year, the per capita disposable income of Chinese residents was 25,974 yuan/year.
3. Data Sources and Research Methods
3.1. Data Sources
In this paper, Wenchuan County and Heishui County were selected from the middle and low-income group and the low-income group, respectively, as the sample counties according to the grouping of the per capita disposable income of cities and counties in Sichuan Province in 2017. Then, three townships with high, medium, and low economic levels were selected from each sample county as the sample townships. Finally, administrative villages with high, medium, and low economic levels were selected from each sample township as the sample villages, and 30 rural households were selected as the sample rural households through the random sampling method in each sample village. On this basis, a questionnaire survey and semistructured interviews were used to conduct an in-depth survey of rural households. Questionnaires and interviews mainly included the basic situation of family members, livelihood capital, and livelihood activities of rural households. The formal survey was carried out in January 2018. A total of 406 questionnaires were distributed, and 395 valid questionnaires were collected; thus, the valid rate was 97.29%. The distribution of sample villages and the number of valid questionnaires are detailed in Table 1.

Table 1.
The distribution of sample villages and the number of valid questionnaires.
3.2. Selection of Livelihood Capital Measurement Indicators
According to the way of classifying rural households’ livelihood capital in the framework for sustainable livelihood analysis proposed by the DFID and referring to the existing research on the quantification of rural households’ livelihood capital [12,18,19,20,21,31,32,33,34], this paper divides rural households’ livelihood capital into five types—human capital, natural capital, physical capital, financial capital, and social capital—and 23 specific rural household livelihood capital measurement indicators were selected (Table 2).
Table 2.
Rural households’ livelihood capital measurement indicators and the assignments and weight values.
Human capital mainly includes an individual’s health condition, knowledge, and skills, and the lack of human capital is an important factor that leads to poverty among rural households. Based on the survey data, in this paper, human capital is quantified by seven indicators: age of household head, education level of household head, number of laborers, average age of laborers, health status of laborers, education level of laborers, and vocational skills of laborers.
Natural capital refers to the land, water, and other natural resources used by rural households to survive. In this paper, two indicators, namely, cultivated land area and garden plot area, were selected to characterize the natural capital of rural households.
Physical capital refers to the infrastructure and material equipment needed by rural households to maintain their livelihoods. In this paper, six indicators, namely, number of livestock and poultry, quality of housing, present value of housing, present value of production tools, present value of vehicles, and present value of durable goods, were selected to measure the physical capital of rural households.
Financial capital refers to the disposable and financing cash of rural households. In this paper, five indicators, namely, cash income, opportunity to borrow, loans, usurious loans, and donations, were selected to measure the financial capital of rural households.
Social capital refers to the social resources used by rural households in pursuit of livelihood goals. In this paper, three indicators, namely, number of relatives and friends providing employment opportunities, number of relatives and friends providing financial assistance, and number of civil servants, were selected to characterize the social capital of rural households.
3.3. Division of the Types of Rural Households
Based on previous research results on the division of rural household types and the actual situation of the research area [35,36,37], according to the proportion of non-agricultural income among total household income, this paper divides rural households into four types: pure agricultural rural households, agricultural dominant rural households, non-agricultural dominant rural households, and non-agricultural rural households. Specifically, pure agricultural rural households refer to rural households without non-agricultural income, agricultural dominant rural households refer to rural households whose non-agricultural income accounts for 0–50% of total household income, non-agricultural dominant rural households represent rural households whose non-agricultural income accounts for 50–90% (including 50% and 90%) of total household income, and non-agricultural rural households denote rural households whose non-agricultural income accounts for more than 90% of total household income. An analysis of valid questionnaires showed that in the research area, there were 255 non-agricultural rural households, 61 non-agricultural dominant rural households, 58 agricultural dominant rural households, and 21 pure agricultural rural households, which accounted for 64.56%, 15.44%, 14.68%, and 5.32% of households, respectively.
3.4. Research Methods
3.4.1. The Entropy Method and the Weighted Comprehensive Model
The entropy method is an objective weighting method. Compared with the analytic hierarchy process (AHP) and other subjective weighting methods, the entropy method avoids interference from human factors and the obtained weight value of the indicator has a higher reliability and accuracy [38]. Thus, this paper uses the entropy method to determine the weight value of each livelihood capital measurement indicator. The calculation process is shown in Equations (1)–(5) and implemented in MATLAB 7.0 software (MathWorks, Inc., Natick, MA, USA). The calculation results are detailed in Table 2.
① Data are standardized as follows:
where refers to the original value of the -th indicator of the -th rural household, indicates the standardized value of , and and refer to the maximum and minimum values of the -th indicator of all rural households, respectively .
② The proportion of the -th rural household under the -th indicator is calculated as follows:
③ The entropy of the -th indicator is calculated as follows:
④ The utility value of the -th indicator is calculated as follows:
⑤ The weight value of the -th indicator is calculated as follows:
The weight value of each measurement indicator is determined and combined with the standardized indicator data to develop the weighted comprehensive model, which is used to calculate the indexes of the five types of livelihood capital of rural households and the total index of the livelihood capital of different types of rural households [39]. The details are shown in Equation (6).
where represents the total index of livelihood capital, with a higher value corresponding to a higher rural household livelihood capital, and and denote the weight value and standardized value of the -th indicator (), respectively.
3.4.2. The Ordinal Logistic Regression Model
Rural households’ livelihood strategies are an ordered multi-classified variable; hence, in this paper, the ordinal logistic regression model is constructed to analyze the sensitivity of rural households’ livelihood strategies to livelihood capital [40]. The independent variables of the model are the livelihood capital measurement indicators, and the dependent variable of the model is the rural households’ livelihood strategies. The process is implemented in SPSS 18.0 software (IBM Corporation, Armonk, NY, USA). The specific model is presented in Equation (7):
where p refers to the probability of the occurrence of livelihood strategies, α indicates the intercept term, and indicates the regression coefficient.
Assuming , stands for the occurrence ratio:
When increases by one unit, Ω will increase or decrease by units. Therefore, in this paper, is used to represent the degree of the sensitivity of rural households’ livelihood strategies to livelihood capital measurement indicators.
4. Results
4.1. Statistical Characteristics of Livelihood Capital Measurement Indicators
The descriptive statistical analysis of the data was conducted in SPSS 18.0 software, and the mean value and standard deviation (SD) of each livelihood capital measurement indicator for the different types of rural households were obtained (Table 3).
Table 3.
Statistical characteristics of livelihood capital measurement indicators.
Table 3 shows that in terms of human capital, and regardless of the total sample or rural households with different livelihood strategies, the household heads were mainly middle-aged and the mean age of household heads of pure agricultural rural households was the highest; in contrast, the mean age of household heads of other types of rural households differed little from that of the total sample. The education level of household heads was mostly primary school. The mean number of laborers in a household was approximately 3. The laborers were generally young and presented an average health status, and the education level was mostly primary school, with a very small proportion of laborers with vocational skills (approximately 9%). With regard to natural capital, the per capita cultivated land area and per capita garden plot area of rural households were very small (0.06 hm2/person and 0.02 hm2/person, respectively), and these values were much smaller than the per capita cultivated land area of China in 2017 (0.10 hm2/person).
Concerning physical capital, the mean number of livestock and poultry in the total sample was 3.57, and the mean value of the pure agricultural sample was the largest (14.07), which was much larger than the overall mean value, although they generally belonged to small-scale poultry raising operations. In addition, housing mainly consisted of stone houses and brick-and-tile houses, and the mean present value of housing was 258,800 yuan. The mean value of the agricultural dominant type was the lowest, while that of the non-agricultural type was the highest. Regarding financial capital, the mean per capita annual cash income in the total sample was 10,800 yuan, and that of the pure agricultural type was the smallest (only 3400 yuan), while that of the agricultural dominant type was the largest (12,500 yuan). Moreover, approximately 36% of rural households borrowed money from relatives and friends, 21% of rural households borrow money from banks and credit cooperatives, and only 2% and 5% of rural households had usurious loans and receive donations, respectively. Specifically, pure agricultural rural households did not have usurious loans, while agricultural dominant rural households neither had usurious loans nor received donations. With regard to social capital, in the total sample, the mean number of relatives and friends available for assistance when seeking migrant working opportunities was 3.73, the mean number of relatives and friends available for assistance when in urgent need of considerable funds was 4.6, and the mean number of civil servants in a clan was 0.85. Of these values, the mean values of all three indicators were smallest for pure agricultural rural households.
4.2. Analysis of Rural Households’ Livelihood Capital
In this paper, the weighted comprehensive model was used to calculate the indexes of the five types of livelihood capital and the total index of livelihood capital for different types of rural households. The calculation results are shown in Table 4.
Table 4.
Livelihood capital indexes of different types of rural households.
Table 4 shows that among the different types of rural households, non-agricultural dominant rural households had the highest level of livelihood capital, and they were followed by non-agricultural rural households and agricultural dominant rural households; in contrast, pure agricultural rural households had the lowest level of livelihood capital. From the perspective of the types of livelihood capital, regardless of the type of livelihood strategy adopted, there were great differences in the levels of five types of livelihood capital among rural households. The levels of human capital and financial capital were relatively high (accounting for 40–48% and 40–50% of the total livelihood capital level, respectively), followed by the levels of physical capital and natural capital (accounting for approximately 6% and 4%, respectively), and the level of social capital was the lowest (accounting for only 1%). The level of human capital was relatively high because there were several young laborers in rural households, whereas the education level of laborers was not high, and laborers with vocational skills were scarce. In recent years, rural households had gradually participated in different types of non-agricultural livelihood activities, and their incomes had increased; thus, the level of financial capital was relatively high. With the increase in income, rural households had higher quality of life requirements, and they also had the ability to buy or build better-quality houses and other durable goods; thus, the level of physical capital had improved to some extent. However, due to the influence of the policy of returning farmland to forests (a policy that requires ceasing cultivation of land with serious soil erosion, serious salinization and low grain yield in a planned way as well as carrying out afforestation, grass planting, and vegetation restoration in accordance with local conditions to protect and improve the ecological environment), rural households had few land resources. The social capital of rural households was mainly the social network of kinship or geography, which provided limited support for resisting risks to livelihood and improving livelihood activities.
4.3. Analysis on Rural Households’ Livelihood Strategies
Using the survey data, the main livelihood activities of the different types of rural households were counted. The statistical results are shown in Table 5.
Table 5.
The main livelihood activities of the different types of rural households.
As shown in Table 5, the livelihood activities of pure agricultural rural households included fruit planting and poultry raising. The survey showed that these rural households depended on planting plums, cherries, and other economic crops, as well as raising chickens, pigs, sheep, and other livestock and poultry as the entire source of household income. These rural households’ livelihood activities were relatively simple, and the economic income was easily affected by climate, product market price, and other factors; thus, the livelihood risks were relatively high.
Agricultural dominant rural households mainly relied on planting plums, cherries, and red dates, as well as raising a few pigs as the main source of economic income. In addition, these rural households took migrant work and self-employed businesses as supplementary sources of household income. Non-agricultural-dominant rural households and non-agricultural rural households mainly depended on migrant work, self-employed businesses, and wage work to maintain their household livelihoods, and the proportion of the income from fruit planting and poultry raising was small or zero. Migrant workers were mainly employed as agricultural helpers, construction workers, and food and beverage waiters (or chefs), and migrant work included work in residential areas and trans-provincial work. Self-employed businesses mainly included running farmhouses, running small shops, and taking advantage of their location to provide water to passing vehicles (i.e., selling water).
In general, except for pure agricultural rural households, the livelihood activities of agricultural-dominant rural households, non-agricultural dominant rural households, and non-agricultural rural households included both agricultural livelihood activities and non-agricultural livelihood activities. Therefore, these three types of rural households had both agricultural income and different types of non-agricultural income, and compared with pure agricultural rural households, their livelihood risks were relatively low.
4.4. Analysis of the Sensitivity of Livelihood Strategies to Livelihood Capital
Based on the analysis of rural households’ livelihood capital and livelihood strategies, and according to Equation (7), ordinal logistic regression analysis was conducted in SPSS 18.0 software to obtain various livelihood capital indicators that had significant impacts on the livelihood strategies of different types of rural households. The overall likelihood ratio test of the regression model was significant at the level of 0.001, indicating that the model was meaningful overall. The regression results are detailed in Table 6.
Table 6.
Ordinal logistic regression analysis results of livelihood capital and livelihood strategies.
According to the regression results, eight indicators, i.e., average age of laborers in human capital, cultivated land area and garden plot area in natural capital, number of livestock and poultry and present value of production tools in physical capital, cash income in financial capital, and number of relatives and friends providing financial assistance, and number of civil servants in social capital, had a remarkable influence on the livelihood strategy selection of non-agricultural dominant rural households and non-agricultural rural households.
After the indicators that have a significant impact on the selection of livelihood strategies are obtained, the degree to which these indicators influence livelihood strategies, namely, the degree of sensitivity of these livelihood strategies to the eight indicators, must be determined. Thus, based on Equation (8), this paper measured the degree of sensitivity of Ω, the occurrence ratio of livelihood strategies, to the above indicators. The measurement results are shown in Figure 2.
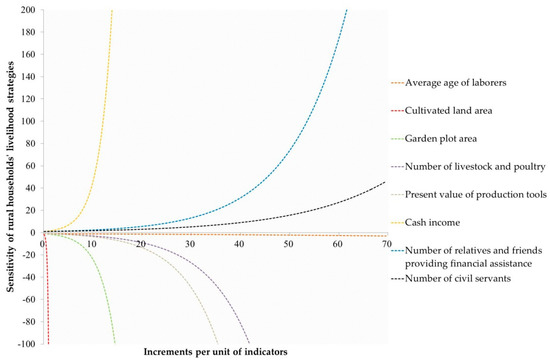
Figure 2.
The sensitivity of non-agricultural dominant rural households’ and non-agricultural rural households’ livelihood strategies to livelihood capital indicators.
As shown in Table 6 and Figure 2, among the eight indicators that had a remarkable influence on the livelihood strategy selection of non-agricultural-dominant rural households and non-agricultural rural households, three indicators—cash income, number of relatives and friends providing financial assistance, and number of civil servants—had a positive effect, and with every one unit increase in each indicator, the occurrence rates of selection of non-agricultural dominant or non-agricultural livelihood strategies by rural households increased by 1.464, 1.090, and 1.057 times, respectively. However, the other five indicators, namely, the average age of laborers, cultivated land area, garden plot area, number of livestock and poultry, and present value of production tools, had a negative effect; with every one unit increase in each indicator, the occurrence ratios of the non-agricultural dominant or non-agricultural livelihood strategy selected by rural households decreased by 0.984, 0.010, 0.728, 0.896, and 0.878 times, respectively.
Due to the age limitation inherent in migrant working and other non-agricultural livelihood activities, older laborers are more inclined to select pure agricultural or agricultural-dominant livelihood strategies. If natural capital and physical capital are more abundant, then rural households will be less likely to select non-agricultural dominant or non-agricultural livelihood strategies. Cash income provides the conditions and possibilities for rural households to engage in non-agricultural livelihood activities; thus, if there is more cash income, rural households will be more likely to select non-agricultural dominant or non-agricultural livelihood strategies. If social capital is more abundant, rural households will have more opportunities and ways to obtain information about non-agricultural livelihood activities; thus, they will be more likely to select non-agricultural dominant or non-agricultural livelihood strategies.
5. Discussion and Conclusions
This paper used the entropy method and the weighted comprehensive model to measure rural households’ livelihood capital level in the upper reaches of the Min River, China, in 2017. In addition, with the help of econometric models, the sensitivity of rural households’ livelihood strategies to livelihood capital was analyzed in the research area.
The results showed that the livelihood capital levels of different types of rural households in the upper reaches of the Min River in 2017 were not equivalent and were ordered as follows: non-agricultural dominant type > non-agricultural type > agricultural dominant type > pure agricultural type. In addition, there were significant differences in the levels of the five types of livelihood capital of rural households. The levels of human capital and financial capital were relatively high, the levels of physical capital and natural capital were moderate, and the level of social capital was the lowest; these findings are inconsistent with the findings of other scholars [12,34]. According to the survey, rural households in the upper reaches of the Min River mainly adopted four types of livelihood strategies in 2017, namely, the pure agricultural type, agricultural dominant type, non-agricultural dominant type, and non-agricultural type. Among them, the number of non-agricultural rural households was the highest and the number of pure agricultural rural households was the lowest.
According to the analysis of the sensitivity of livelihood strategies to livelihood capital, rural households’ livelihood strategies had different sensitivities to various livelihood measurement indicators, which were consistent with the findings from other scholars [13,39,41,42]. Specifically, three indicators, namely, cash income, number of relatives and friends providing financial assistance, and number of civil servants, had marked positive effects on the livelihood strategy selection of non-agricultural dominant rural households and non-agricultural rural households, while five indicators, namely, average age of laborers, cultivated land area, garden plot area, number of livestock and poultry, and present value of production tools, had noticeable negative effects on the livelihood strategy selection of non-agricultural dominant rural households and non-agricultural rural households.
The analysis of the livelihood capital levels of rural households revealed that the education level of laborers was relatively low as a whole, and the proportion of laborers with vocational skills was very small. This phenomenon led to a considerable surplus of low-cultural quality, unskilled or low-skilled laborers, as well as a serious shortage of the high-quality and skilled laborers required by the emerging technology industries, resulting in difficulties in urban recruitment and rural surplus labor force employment. In the new era of national poverty alleviation and urbanization development, it is necessary to gradually improve the quality of education, increase the intensity of farmers’ agricultural and non-agricultural training and enhance their vocational skills through governmental efforts to increase the economic income of rural households and achieve the goal of precise poverty alleviation and new urbanization. In addition, rural households should be encouraged to develop various professional cooperative economic organizations based on kinship, geography, and careers to improve the levels of financial capital and social capital of rural households and enhance the ability of rural households to collectively resist external risks.
The analysis of livelihood strategies revealed that livelihood diversification was a common phenomenon among rural households in the study area and that households were rarely dependent on one source of livelihood for a living, and these results were consistent with the findings of other scholars [43]. This diversification occurred mainly because of the release of a large number of laborers from agriculture and forestry land after the implementation of the policy of returning farmland to forestry in the upper reaches of the Min River, China; thus, to maintain their livelihoods, these laborers had to seek new means of survival. At the same time, the rapid development of new urbanization in China provided employment opportunities and jobs for the rural surplus labor force. Hence, many laborers released from agriculture and forestry land have selected migrant working and other non-agricultural livelihood strategies. The underlying motive for livelihood diversification among the rural households was to provide safety nets for individual families and to smooth consumption. Livelihood diversification is crucial for reducing vulnerability and building sustainable livelihood for rural households. A diversified household stands a better chance of surviving than an undiversified one, such as during exposure to major climatic events [43,44,45]. Pure agricultural rural households and agricultural dominant rural households mainly obtained economic income by planting fruits and raising a small amount of poultry. Fruit planting in the region has begun to take shape, although the degree of industrialization is low. Local government departments should rely on existing tourism resources to expand the sales channels for fruits, and the industrialization management of fruits should be gradually achieved by increasing capital investment and other measures. Non-agricultural dominant rural households and non-agricultural rural households mainly depended on migrant work, self-employed businesses, wage work, and other non-agricultural livelihood activities to maintain their household livelihoods. However, migrant workers were mainly engaged in manual labor and cannot easily work in industries with high technical content; thus, the employment field is relatively narrow, and the income is relatively low. Therefore, the cultural level and vocational skills of farmers should be gradually improved to enhance the diversity of rural households’ livelihood activities, increase the economic income of rural households, and ultimately achieve the goal of poverty alleviation.
This paper revealed the basic characteristics of rural households’ livelihood capital as well as the sensitivity of rural households’ livelihood strategies to livelihood capital in the upper reaches of the Min River, China, in 2017, and the research results can provide a reference for relevant government departments to implement poverty alleviation policies. Moreover, the research ideas and research methods of this paper can provide some reference for research on the livelihoods of rural households in other poverty-stricken mountainous areas of China. However, the study area of this article belongs to minority areas as well as to mountainous and hilly areas from a geomorphological perspective. Therefore, whether the research results of this paper are applicable to areas with larger Han populations, especially the plain areas, still needs to be further explored. In addition, the research results can only reflect the livelihood status of rural households in 2017, and according to the framework for sustainable livelihood analysis proposed by the DFID, the livelihood status of rural households may change because of some external risk shocks. Therefore, in future studies, we should conduct a dynamic follow-up survey of rural households in different years and analyze the changing processes and changing trends of their livelihood status to propose targeted suggestions for the sustainability of rural households’ livelihoods.
Author Contributions
Conceptualization, L.P.; Formal analysis, D.X. and X.W.; Investigation, X.W.; Methodology, L.P.; Resources, D.X.; Writing—review & editing, X.W.
Funding
The research was supported by the National Natural Science Foundation of China (41601612), the Scientific research Fund of Sichuan Provincial Education Department (17ZB0440), the Economic Development Research Center of Sichuan National Mountain Areas (SDJJ1802), and the Longshan talents of Southwest University of Science and Technology (17LZX679, 18LZX660).
Conflicts of Interest
The authors declare no conflict of interest.
References
- Chambers, R.; Conway, G.R. Sustainable Rural Livelihoods: Practical Concepts for the 21st Century; IDS Discussion Paper No. 296; Institute of Development Studies: Brighton, UK, 1992. [Google Scholar]
- DFID. Sustainable Livelihoods Guidance Sheets; Department for International Development: London, UK, 2000. [Google Scholar]
- Block, S.; Webb, P. The dynamics of livelihood diversification in post-famine Ethiopia. Food Policy 2001, 26, 333–350. [Google Scholar] [CrossRef]
- Ellis, F.; Kutengule, M.; Nyasulu, A. Livelihoods and rural poverty reduction in Malawi. World Dev. 2003, 31, 1495–1510. [Google Scholar] [CrossRef]
- Bouahom, B.; Douangsavanh, L.; Rigg, J. Building sustainable livelihoods in Laos: Untangling farm from non-farm, progress from distress. Geoforum 2004, 35, 607–619. [Google Scholar] [CrossRef]
- Bradstock, A. Land reform and livelihoods in South Africa’s Northern Cape Province. Land Use Pol. 2003, 23, 247–259. [Google Scholar] [CrossRef]
- Scoones, I. Sustainable Rural Livelihoods: A Framework for Analysis; IDS Working Paper 72; Institute of Development Studies: Brighton, UK, 1998. [Google Scholar]
- Bebbington, A. Capitals and capabilities: A framework for analyzing peasant viability, rural livelihoods and poverty. World Dev. 1999, 27, 2021–2044. [Google Scholar] [CrossRef]
- Scudder, M.; Baynes, J.; Herbohn, J. Timber royalty reform to improve the livelihoods of forest resource owners in Papua New Guinea. Forest Policy Econ. 2019, 100, 113–119. [Google Scholar] [CrossRef]
- Carr, E.R. From description to explanation: Using the Livelihoods as Intimate Government (LIG) approach. Appl. Geogr. 2014, 52, 110–122. [Google Scholar] [CrossRef]
- Nyirenda, V.R.; Nkhata, B.A.; Tembo, O.; Siamundele, S. Elephant crop damage: Subsistence farmers’ social vulnerability, livelihood sustainability and elephant conservation. Sustainability 2018, 10, 3572. [Google Scholar] [CrossRef]
- Baffoe, G.; Matsuda, H. An empirical assessment of rural livelihood assets from gender perspective: Evidence from Ghana. Sustain. Sci. 2018, 13, 815–828. [Google Scholar] [CrossRef]
- Gautam, Y.; Andersen, P. Rural livelihood diversification and household well-being: Insights from Humla, Nepal. J. Rural Stud. 2016, 44, 239–249. [Google Scholar] [CrossRef]
- Martin, S.M.; Lorenzen, K. Livelihood diversification in rural Laos. World Dev. 2016, 83, 231–243. [Google Scholar] [CrossRef]
- Halloran, A.; Roos, N.; Hanboonsong, Y. Cricket farming as a livelihood strategy in Thailand. Geogr. J. 2017, 183, 112–124. [Google Scholar] [CrossRef]
- Iorio, M.; Corsale, A. Rural tourism and livelihood strategies in Romania. J. Rural Stud. 2010, 26, 152–162. [Google Scholar] [CrossRef]
- Masud, M.M.; Kari, F.; Yahaya, S.R.B.; Al-Amin, A.Q. Livelihood assets and vulnerability context of marine park community development in Malaysia. Soc. Indic. Res. 2016, 125, 771–792. [Google Scholar] [CrossRef]
- Liu, Z.; Chen, Q.; Xie, H. Influence of the farmer’s livelihood assets on livelihood strategies in the western mountainous area, China. Sustainability 2018, 10, 875. [Google Scholar] [CrossRef]
- Milad, D.P.; Akbar, B.A.; Hossein, A.; Jürgen, S. Revealing the role of livelihood assets in livelihood strategies: Towards enhancing conservation and livelihood development in the Hara Biosphere Reserve, Iran. Ecol. Indic. 2018, 94, 336–347. [Google Scholar]
- Peng, L.; Xu, D.; Wang, X. Vulnerability of rural household livelihood to climate variability and adaptive strategies in landslide-threatened western mountainous regions of the Three Gorges Reservoir Area, China. Clim. Dev. 2018, 8, 1–16. [Google Scholar] [CrossRef]
- Sagynbekova, L. Environment, rural livelihoods, and labor migration: A case study in central Kyrgyzstan. Mt. Res. Dev. 2017, 37, 456–463. [Google Scholar] [CrossRef]
- Duan, W.; Lang, Z.; Wen, Y. The effects of the sloping land conversion program on poverty alleviation in the Wuling mountainous area of China. Small-Scale For. 2015, 14, 331–350. [Google Scholar] [CrossRef]
- Cherni, J.A.; Hill, Y. Energy and policy providing for sustainable rural livelihoods in remote locations -the case of Cuba. Geoforum 2009, 40, 645–654. [Google Scholar] [CrossRef]
- Vista, B.M.; Nel, E.; Binns, T. Land, landlords and sustainable livelihoods: The impact of agrarian reform on a coconut hacienda in the Philippines. Land Use Pol. 2012, 29, 154–164. [Google Scholar] [CrossRef]
- Karki, S.T. Do protected areas and conservation incentives contribute to sustainable livelihoods? A case study of Bardia National Park, Nepal. J. Environ. Manag. 2013, 128, 988–999. [Google Scholar] [CrossRef]
- Ying, B.; Fang, Y.; Xu, Y.; Yan, X.; H, H. The heterogeneity of rural households income and its geographical factors in Upper Reach of Minjiang River. Mt. Res. 2014, 32, 652–661. (In Chinese) [Google Scholar]
- Cai, J.; Ma, H.; Xia, X. Analysis on the choice of livelihood strategies of peasant households who rent out farmland and influencing factors: An micro- empirical study of the contiguous destitute areas of Liupan Mountains. Resour. Sci. 2017, 39, 2083–2093. (In Chinese) [Google Scholar]
- Xu, X.; Feng, S. Estimation and spatio-temporal evolution analysis of self-development capacity in Chinese 14 pieces concentrated destitute areas. Econ. Geogr. 2017, 37, 151–160. (In Chinese) [Google Scholar]
- Wang, Q.; Shi, M.; Guo, Y.; Zhang, Y. The vertical differentiation of the mountain settlement niche in the upper reaches of Minjiang River. Acta Geogr. Sin. 2013, 68, 1559–1567. (In Chinese) [Google Scholar]
- Sichuan Statistical Bureau. Sichuan Statistical Yearbook; China Statistics Press: Beijing, China, 2018. (In Chinese)
- Soltani, A.; Angelsen, A.; Eid, T.; Naieni, M.S.N.; Shamekhi, T. Poverty, sustainability, and household livelihood strategies in Zagros. Iran. Ecol. Econ. 2012, 79, 60–70. [Google Scholar] [CrossRef]
- Parker, P.; Thapa, B.; Jacob, A. Decentralizing conservation and diversifying livelihoods within Kanchenjunga Conservation Area, Nepal. J. Environ. Manag. 2015, 164, 96–103. [Google Scholar] [CrossRef]
- Freduah, G.; Fidelman, P.; Smith, T.F. The impacts of environmental and socio-economic stressors on small scale fisheries and livelihoods of fishers in Ghana. Appl. Geogr. 2017, 89, 1–11. [Google Scholar] [CrossRef]
- Xu, D.; Liu, E.; Wang, X.; Tang, H.; Liu, S. Rural households’ livelihood capital, risk perception, and willingness to purchase earthquake disaster insurance: Evidence from Southwestern China. Int. J. Environ. Res. Public Health 2018, 15, 1319. [Google Scholar] [CrossRef]
- Diniz, F.H.; Hoogstra-Klein, M.A.; Kok, K.; Arts, B. Livelihood strategies in settlement projects in the Brazilian Amazon: Determining drivers and factors within the Agrarian Reform Program. J. Rural Stud. 2013, 32, 196–207. [Google Scholar] [CrossRef]
- Cao, M.; Xu, D.; Xie, F.; Liu, E.; Liu, S. The influence factors analysis of households’ poverty vulnerability in southwest ethnic areas of China based on the hierarchical linear model: A case study of Liangshan Yi autonomous prefecture. Appl. Geogr. 2016, 66, 144–152. [Google Scholar] [CrossRef]
- Xu, D.; Peng, L.; Liu, S.; Su, C.; Wang, X.; Chen, T. Influences of migrant work income on the poverty vulnerability disaster threatened area: A case study of the Three Gorges Reservoir area, China. Int. J. Disaster Risk Reduct. 2017, 22, 62–70. [Google Scholar] [CrossRef]
- Su, F.; Saikia, U.; Hay, I. Relationships between livelihood risks and livelihood capitals: A case study in Shiyang River Basin, China. Sustainability 2018, 10, 509. [Google Scholar] [CrossRef]
- Wan, J.; Deng, W.; Song, X.; Liu, Y.; Zhang, S.; Su, Y.; Lu, Y. Spatio-temporal impact of rural livelihood capital on labor migration in Panxi, southwestern mountainous region of China. Chin. Geogr. Sci. 2018, 28, 153–166. [Google Scholar] [CrossRef]
- Hogarth, N.J.; Belcher, B.; Campbell, B.M.; Stacey, N. The role of forest-related income in household economies and rural livelihoods in the border-region of Southern China. World Dev. 2013, 43, 111–123. [Google Scholar] [CrossRef]
- Babulo, B.; Muys, B.; Nega, F.; Tollens, E.; Nyssen, J.; Deckers, J.; Mathijs, E. Household livelihood strategies and forest dependence in the highlands of Tigray, Northern Ethiopia. Agric. Syst. 2008, 98, 147–155. [Google Scholar] [CrossRef]
- Xu, D.; Deng, X.; Guo, S.; Liu, S. Sensitivity of livelihood strategy to livelihood capital: An empirical investigation using nationally representative survey data from rural China. Soc. Indic. Res. 2018. Available online: https://doi.org/10.1007/s11205-018-2037-6 (accessed on 17 November 2018).
- Baffoe, G.; Matsuda, H. An empirical assessment of households livelihood vulnerability: The case of rural Ghana. Soc. Indic. Res. 2018, 140, 1225–1257. [Google Scholar] [CrossRef]
- Vincent, K. Creating an Index of Social Vulnerability to Climate Change for Africa; Working Paper 56; Tyndall Centre for Climate Change Research and School of Environmental Sciences, University of East Anglia: Norwich, UK, 2004. [Google Scholar]
- Baffoe, G.; Matsuda, H. Why do rural communities do what they do in the context of livelihood activities? Exploring the livelihood priority and viability nexus. Community Dev. 2017, 48, 715–734. [Google Scholar] [CrossRef]


© 2019 by the authors. Licensee MDPI, Basel, Switzerland. This article is an open access article distributed under the terms and conditions of the Creative Commons Attribution (CC BY) license (http://creativecommons.org/licenses/by/4.0/).