Abstract
Rapid urbanization and industrialization in Chinese cities have substantially elevated carbon emissions, and transportation plays a major role in these emissions. Due to data availability, research on the impact of both high-speed rail (HSR) and other urban transportation modes on urban carbon emissions is rare. Using a relatively large panel of 194 Chinese cities from 2008–2013, we examine the impact of HSR, conventional rail, bus, roads, and subways on urban carbon emissions. We further document the interaction of these transport modes with geo-economic variables, and more accurately measure HSR’s impact on emissions using a comprehensive accessibility metric. During this time, China developed, constructed and began to operate an extensive HSR network. Our results show that increases in HSR lead to rises in carbon emissions, emissions per GDP unit and per capita. We also find that transportation’s impact on carbon emissions differs by city size and region, and transportation modes significantly interact with GDP, population and urban area to affect carbon emissions. These interactions imply that the government’s promotion of HSR over conventional rail may have unintended consequences and boost urban carbon emissions.
1. Introduction
Rapid urbanization and economic growth have led to accelerating transport growth and substantial accompanying carbon emissions in China. Carbon emission reduction or carbon footprint downsizing are increasingly viewed as critical in promoting health benefits and environmentally-friendly cities [1,2]. China is the world’s largest emitter of carbon dioxide and accounts for 27% of global emissions, and its transportation sector accounts for 12.7% of its total energy consumption [3]. From 2005 to 2013, rapidly rising GDP and industrialization in China contributed to steadily increasing carbon emissions. Over the past decade, China has also devoted considerable resources to develop the world’s largest high-speed rail (HSR) network, along with substantial expenses to advance roads and metro infrastructure. Infrastructure spending has however spurred the urbanization and motorization that contributes to rising carbon emissions and mortality problems including acute bronchitis [1]. Although the government has a long-term strategic plan to substantially reduce the urban carbon footprint by 2020 [4], this goal will be difficult to achieve given rising economic and transportation activity [5]. Thus, it is relevant for the government to quantify, appraise and implement strategies to address its urban carbon footprint concerns [6]. Critical to these plans are modeling and evaluating transportation’s impact on carbon emissions, carbon emissions per GDP and emissions per capita.
Most of the carbon footprint literature [7,8] focuses on two areas. One area examines the measurement of the carbon footprint, including but not limited to overall carbon emissions [9], carbon emissions for transportation industries [10] and land use related to carbon emissions [11,12]. A second area investigates the influential factors that generate a carbon footprint, which include population size [13], industrial structure [14,15], urban formation [16,17], urban scale [18,19] and land use [12,14].
Transportation by railway, including HSR, is widely recognized as a pro-environment transportation mode, and these merits are often used to promote further rail development [20]. Increasing HSR routes, measured by rising accessibility, may lower carbon emissions by inducing substitution away from more carbon-emitting highway and short aviation usage [21,22]. However, by facilitating travel, communication, commuting and commerce, HSR, along with other public transport modes, may have positive synergistic consequences on the economy, thus inducing more energy consumption. We investigate whether extending the HSR network along with promoting other urban transport modes leads to unintended consequences that could exacerbate greenhouse gas emissions.
Based on a nationwide panel of data on HSR, conventional rail, bus, roads and subways from 2008 to 2013, a period when the Chinese HSR network quickly connected many large cities, the paper advances the literature in four ways. First, we examine the rationale and mechanism through which HSR and urban transport directly or indirectly affect the urban carbon footprint. Second, we estimate the effect of HSR and other urban transport modes on the urban carbon footprint measured by overall carbon emissions, carbon emissions per GDP and carbon emissions per capita. Third, we investigate transportation’s impact on carbon emissions by city size and region as well as the existence of quadratic transportation effects and transportation’s interactions with GDP, population and area. Fourth, unlike most work, we measure HSR’s impact using a comprehensive accessibility metric instead of dummy variables for the presence of high-speed investment or implementation. Overall, although a growing literature now exists on carbon emissions in China, research that examines both HSR and other urban transportation’s impacts on carbon emissions in Chinese cities and their interactions with economic variables such as GDP, area and population have not been examined.
Our approach tests an augmented IPAT model to evaluate the impacts of population, economy, transportation, and interactions effects on China’s urban carbon footprint. A brief preview of our results highlights that HSR development has unintended consequences on carbon emissions. Increasing HSR, measured by rising accessibility, significantly and positively raises carbon emissions, emissions per GDP and emissions per capita; results are robust when controlling for GDP, population, economic structure and area. Buses and subways further have a significant positive influence on urban carbon emissions. We attribute these counter-intuitive results to these modes inducing more economic activity during a period of rapid urbanization and rising economic activity. Results also document substantial economic interactions between transportation modes and GDP, population and area. In terms of policy implications, HSR development has unintended consequences on the environment, which are considerably larger than conventional rail. HSR leads to rising carbon emissions, in big and small cities, and thus the authorities may want to rethink promoting HSR over rail.
Table 1 reveals that HSR’s impact on carbon emission is widely recognized. It documents differing substitution and consumption promotion effects between HSR and both highways and civil aviation. The internal mechanism of how HSR contributes to carbon emission changes is well-known. However, research on HSR’s carbon emission in cities is rare, and the interaction between HSR and urban social-economic variables has not been investigated.

Table 1.
Literature on high-speed rail (HSR) environmental impacts.
HSR development began initially in Japan with a maximum operational speed of 210 kph in 1964 [35]. In China, it began in 2008, and rapid construction led to a network length by 2017 that reached over 25,000 kilometers [36] covering 180 prefectural cities [37]. The network is projected to cover 30,000 kilometers by 2025 and 38,000 kilometers by 3030 [38]. Over the next several years, it is projected that over 80% of China’s major cities will be connected by the HSR network [39]. Table 2 provides additional details on HSR development in including the number of HSR lines, its rail length, passenger volume, percentage of total rail passengers and key accounting performance metrics.
Table 2.
HSR development in China.
2. Conceptual Framework, Hypotheses and Model
2.1. Background and Conceptual Analytic Framework
Most work on transportation’s impact on carbon emissions in China generally focuses on the emissions contribution of different modes as well as policies to reduce their footprint [43,44]. There is a broad consensus that highway and civil aviation are the leading sources of CO2 transportation emissions in China, while more environmentally-friendly rail and water transportation modes have lower emission intensity [45]. The literature finds the transportation’s carbon footprint differs regionally [46,47]; further, relevant factors that influence urban carbon emissions are travel distance, car usage, travel frequency, urban size and specific transportation modes available in the city [48]. Urban municipalities have devoted considerable resources to urban transportation development in recent decades. In 2016, there were over 530 thousand public bus numbers, and an urban rail transit system that exceeds 3728 kilometers. Further, more than 5000 kilometers of urban rail lines were under construction by the end of 2017 [49,50]. It has been widely recognized that urban public transportation modes, including bus and metro systems, can reduce carbon emissions [51,52], while growing motorization and traffic turnovers generally offset their effect. Other research shows the rapid rise in car use will continue until an inflection point in 2030, and imply increasing emissions of carbon in cities and the need for more roads to curb congestion and accompanying pollution [53].
The impacts of HSR and urban transport on the carbon footprint can be classified into transportation and non-transportation effects. In terms of the transportation effect, HSR can directly replace short air routes; this reduces carbon emissions, since rail emits less greenhouse gas per travel unit (e.g., passenger kilometer or ton kilometer) [27]. The same rationale applies to road transport [25] and urban transport such as metros [54,55]. For instance, research finds that encouraging public transport and restricting car use reduces the overall energy consumption of China’s transportation industry by 21% and contributes to lower carbon emissions [56]. If cities increase the market share of their public transit system by replacing cars or other high-carbon emission transport modes, they reduce their carbon footprint. However, if HSR or the public transit system in cities induce more travel demand through a substitution effect to high-carbon emission transport modes emissions, the net carbon footprint is ambiguous [57,58].
In terms of the non-transportation effects, HSR and other urban transport interacting with urban economic variables such as GDP, population or urban area size can affect urban carbon emission levels through synergizing these economic driving forces. Increases in these synergies (such as greater accessibility leading to lower travel times contributing to rises in commerce and trade that then lifts migration to suburbs) may lead to countervailing effects: (1) An industry effect may occur where carbon emission reductions outweigh an emission rebound effect. The industry effect refers to greenhouse gas emission reductions, where industry structure develops toward less carbon consuming activities. This occurs as upgrading industries toward a tertiary structure induces less energy and discharges less carbon emissions than heavy manufacturing. (2) An interaction effect may also occur when transportation development reinforces socio-economic development through interactions with GDP or the population, inducing more economic activities, and carbon consumption [59,60]. We illustrate these relationships in Figure 1.
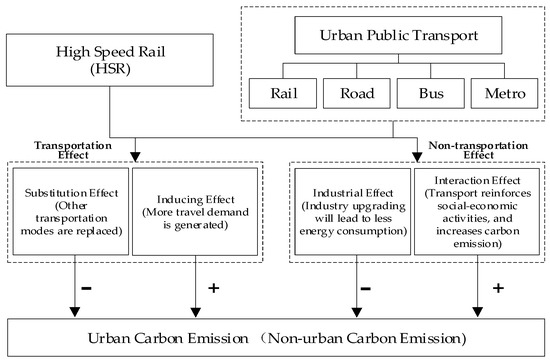
Figure 1.
An analytical explanatory framework of HSR and urban transport on carbon emissions.
Figure 1 illustrates that the relationship between carbon emissions, HSR and other urban public transport including rail, road, buses and metros, is complicated. Our fundamental hypotheses are that: (1) More accessible public transport created by decreasing travel time (by HSR) or increasing the numbers of rail and buses may increase carbon emissions by inducing more travel demand. (2) Higher accessibility can, through industrial upgrading or interacting with the GDP or population, boost economic activities and expand urbanization, lifting carbon emissions. In our paper, we focus on urban emissions rather than total emissions because of data availability, which is a limitation of our research; yet, at the same time, a focus on urban emissions is both relevant and important to evaluate the effects of city public transport on the urban environment.
2.2. Fundamental Hypotheses
To examine the interrelationship between transport factors and urban carbon footprint, we use a panel econometric framework to analyze the interrelationships among HSR, urban transport and other social-economic factors. Before we test our econometric model, we discuss theoretical interconnections between HSR, urban transportation and urban carbon emission as well as present several fundamental hypotheses.
Although HSR can potentially reduce carbon emission through a substitution effect [24,28], it may also have positive consequences on carbon emissions by facilitating face-to-face communication and interaction [61] and improving the accessibility and connectivity [62,63] of cities along the HSR route. This economic benefit attracts production factors to cluster and facilitate population and economic agglomeration. Further, HSR may expand urban integration for small and medium-sized cities, and promote economic growth, urban expansion, land usage, energy consumption and accompanying carbon emissions [64]. Hence, the constructed hypotheses for HSR are:
H1:
HSR significantly affects urban carbon emissions.
Note that HSR not only affects urban size but also drives urban industrial restructuring [65]. Big cities tend to obtain favorable land usage policies from government administrations, attract more net inflow population than small- and medium-sized ones [66,67], and enjoy comparably higher economic growth rates [68]. Therefore, big cities, especially those located along the more developed coast, are still experiencing service-oriented industrial restructuring, high economic growth, and correspondingly outsized energy consumption. However, industrial structure upgrading for big cities accelerates the spatial relocation of high-energy consumption heavy industries away from these cities to small- and medium-sized ones. Thus, it is uncertain whether HSR will increase carbon emissions for big cities in China. Hence, the constructed hypotheses for HSR are:
H2a:
HSR leads to an overall increase in carbon emissions for all cities.
H2b:
HSR has a greater impact on big cities’ carbon emissions than on small- to medium-sized ones.
H2c:
HSR has a relatively large effect on eastern Chinese cities.
HSR’s impact on carbon emissions may also be synergistic through interacting with other socio-economic factors, since HSR is regarded as a convenient transportation facility to attract production factors such as people, capital and knowledge into cities. The migration then will positively affect the urban population, GDP and land usage area, which then in turn promote economic activities through agglomeration economies and induce higher energy consumption and carbon emissions [60,68]. We test these interrelationships using interaction terms. Hence, the extended hypotheses for HSR are:
H3a:
HSR interacts with the urban population and increases urban carbon emissions.
H3b:
HSR interacts with the urban GDP and increases urban carbon emissions.
H3c:
HSR interacts with urban land usage areas and increases carbon emissions.
The rationale for HSR’s potentially conflicting consequences on carbon emissions can be applied to other modes of urban public transport. On the one hand, urban public transportation can replace private car usage, promote industrial structure upgrading and reduce urban carbon emissions [56,69]. On the other hand, promoting urban public transportation may also have unintended consequences on the environment; e.g., increasing travel convenience can induce more travel demand, which then consumes more energy and emits greater greenhouse gases into the environment [54,55]. Hence, the constructed hypotheses for urban public transportation are as follows:
H4:
Public transport significantly influences urban carbon emissions.
H5:
Public transport decreases carbon emissions.
The urban public transport system is composed of roads, buses, and subways. Buses and subways are widely regarded as more efficient methods of green transportation than cars [70]. If urban roads give priority to their public transit system instead of car users, urban carbon emissions will decline. However, if car users benefit from a convenient road network and thus increase car ownership and usage, there will be more gas consumption and carbon emissions. Most work recognizes that public transport should be prioritized in cities to alleviate problems of air pollution, noise and high carbon emissions [71,72]. Hence, the hypotheses for public transport are:
H6a:
The bus transit system decreases urban carbon emissions.
H6b:
The subway transit system decreases urban carbon emissions.
H6c:
Urban road expansion decreases urban carbon emissions.
Similar to HSR’s impact on carbon emissions through interaction with the population, GDP and land usage, urban public transport can potentially boost urban emissions through reinforcing interactions with these variables [73]. Spatial planning guidelines affect the layout of cities, which through its interaction with public transportation influences urban mobility, energy consumption and greenhouse gas emissions. A public transit system can help foster compact and high-density development in a city that limits carbon emissions. However, availability of public transport may also encourage sprawling development which induces unintended carbon emissions. For instance, the availability of more bus lines makes it easier for people to live further away from the city center. This may deteriorate job–housing relationships, inefficiently increase travel demand, impose greater pressures on the public transport system and generate more greenhouse gas emissions [74]. Urban land use for cities, particularly located in the northern and western regions, is less efficient and urban sprawling is a widespread phenomenon in China [75]. As a result, public transportation development may increase urban carbon emissions through interaction with socio-economic factors. Hence, the constructed hypotheses for public transport are as follows:
H7:
Land usage area expansion increases urban carbon emissions.
H8a:
Urban public transport interacts with population and increases urban carbon emissions.
H8b:
Urban public transport interacts with urban GDP and increases urban carbon emissions.
H8c:
Urban public transport interacts with urban land usage area and increases carbon emissions.
The basic assumption of our paper is that HSR can induce more traffic and promote urban socio-economic development, which increases the overall demand for energy consumption and boosts carbon emissions in cities. Public transit systems such as bus and metro can substitute for automobile usage and thus contribute to the reduction of carbon emissions.
2.3. Augmented IPAT Model
Ehrlich and Holdren [76] developed the IPAT model to reflect the environmental impacts of factors including population, economy and technology.
where the IPAT acronym represents I for impact (on the environment) and P, A, and T are population, affluence and technology respectively.
I = P × A × T,
Dietz and Rosa in 1977 [14] extended the IPAT model and introduce a STIRPAT (Stochastic Impacts by Regression on Population, Affluence and Technology) framework:
where a1, a2 and a3 are estimated parameters, and e is a stochastic error term.
I = Pa1 × Aa2 × Ta3 e,
Based on the IPAT and STIRPAT models, this paper explains urban carbon emissions and tests the impact of different transportation modes on these emissions, while controlling for population, GDP, and other economic factors. Since the impacts of transportation on urban carbon emission are our research focus, the other variables are city control variables. The estimated model is:
where subscripts i and t denote to city and time, CO2it carbon emission, Pit population, Ait economic factors, Tit technology, CITYit city variables such as urban land scale, TRANSit transportation factors, and eit is a stochastic error term.
ln(CO2 it) = α1t + α2t ln(Pit) + α3t ln(Ait) + α4t ln(Tit) + α5t ln(CITYit) + α6t ln(TRANSit) + eit,
To evaluate the indirect effect of transportation factors with other socio-economic variables, we follow Wang and Wu [77] to test the impacts of interactions terms on carbon emissions. Thus, we augment (3) by adding interaction terms to test Equation (4):
ln(CO2 it) = α1t + α2t ln(Pit) + α3t ln(Ait) + α4t ln(Tit) + α5t ln(CITYit) + α6t ln(TRANSit)
+ α7t ln(SCALEit) * ln(TRANSit) + eit.
+ α7t ln(SCALEit) * ln(TRANSit) + eit.
The added item SCALEit tests transportation’s interactions with urban population, GDP and land area on carbon emissions.
We examine the environment (CO2), population (P), economy (A), city (CITY), and transportation (TRANS) variables and present these in Table 3 (see Appendix Table A1 for abbreviations):
Table 3.
Variables used in the augmented IPAT model.
For robustness, we also investigated several additional control variables TS (the value added of the tertiary industry over the secondary industry), TESE (the employment of the tertiary industry divided by the secondary industry), IMP (urban internal potential measured by total retail sales over secondary industry) and TECH (science and technology expenditure budget). IMP and TECH are highly correlated with GDP, and TS is correlated with MAN. While TESE is not highly correlated with the other exogenous variables, it is not significant at the 95% confidence level in any of the estimated specifications we examine. IMP, TECH and TS are sometimes significant, but inference for the transportation variables in the regression specifications remains unchanged. We also test inflation, but it is insignificant; all variables are real and the variation in carbon emissions is across the panel (see Figure 2A,B), so it’s unlikely that aggregate macro variables will have significant effects.
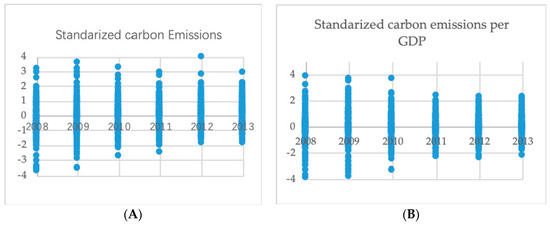
Figure 2.
Standarized Carbon emissions across cities and time. (A) In Figure 2A, standarized carbon emission means that carbon emission quantity fo r every city is converted or normalized into a set [0,1], of which, the city with the maximum amount of carbon emission is measured as 1, and other cities will be calibrated by the proportion of its carbon emission to that of maximum one; (B) In Figure 2B, standarized carbon emission per GDP means that carbon emission quantity per GDP output for every city is converted or normalized into a set [0,1], of which, the city with the maximum amount of carbon emission per GDP is measured as 1, and other cities will be calibrated by the proportion of its carbon emission per GDP to that of the maximum one.
Carbon emissions in Chinese cities are mainly generated by fossil fuel combustion and indirect carbon emissions from the consumption of electric power, largely produced by coal plants that discharge greenhouse gas into the environment [78]. Due to data availability of prefectural cities in China, indirect carbon emissions are beyond our research scope. Fossil fuels consist of natural gas (NG), artificial gas (AG) and liquefied petroleum gas (LPG). We follow the measurement formula developed by several Chinese scholars [79,80]:
where NGit, AGit and LPGit are the total consumption tons of natural gas, artificial gas and liquefied petroleum gas respectively; k1, k2 and k3 are conversion coefficients of natural gas, artificial gas and liquefied petroleum gas into equivalent standard coal respectively, and m1, m2 and m3 are carbon emission coefficients for NGit, AGit and LPGit separately. Table 4 presents the data used to calculate carbon emissions for Equation (5)
CO2it = NGit × k1 × m1 + AGit × k2 × m2 + LPGit × k3 × m3,
Table 4.
Carbon emission measurement parameters and coefficients.
Accessibility measures transportation improvements. There are two ways of calculating it. The first is the more traditional method that represents the weighted average travel time of HSR:
where ACC1it is the HSR accessibility for city i in year t, and is the travel time between city i and j in year t [81,82]. only takes HSR’s weighted travel time into the accessibility calculation, and hence is a narrower measurement of transportation improvement than the more recently developed ACC2, which includes minimum weighted travel time and expenditure of all transportation modes [83]. The weighted travel time and expenditure of transportation is a more generalized accessibility metric that captures the change of HSR, conventional railway and highway:
where is the generalized weighted accessibility between city i and j in year t, and k represents the transportation mode. is the travel expenditure measured by ticket price between city i and j in year t by transportation mode k. TVjt is the weighted time value developed by Shi and Zhou [84]:
where WH is the legal working hours for workers in China, WAGE is the city resident’s average annual disposable income, r is the proportion of travel in working hours while is the ratio between time value for personal and work trips. The annual average working hours per work is 2000, and 0.5 and 0.4 are recommended for parameters r and [85,86].
Based on Equations (6)–(8), represents a more comprehensive accessibility measure for a city and is measured by including minimum weighted travel time and expenditure:
The China City Statistics Yearbook (2014) [87] reports 275 prefecture-level cities in total. After we removed cities with missing data, we had 194 cities with all data needed to test our econometric model. All cities are connected by HSR, and most of them are located in Eastern and Central China. The China Bureau of Statistics and the China City Statistics Yearbook (2008–2013) [87] contain data covering fossil fuel consumption, demography, economy, and technology and city variables. For transportation variables, data for conventional railway and HSR come from the National Railway Passenger Time Schedule (2007–2013) [88]. Highway data are from the China Transportation Statistics Yearbook (2008–2014) [89].
3. Empirical Research Results
3.1. Data Description
Figure 2A,B present a scatterplot of the 194 cities from 2008–2003, where we plot two of our dependent variables, standardized carbon emissions and standardized carbon emissions per GDP. Figure 2A shows considerable variation across time and a modest upward trend. Most of the variation in carbon emissions is across cities, not across time. Figure 2B also displays substantial variation across cities and no upward trend. Our regressions demonstrate that GDP is a very significant determinant of overall carbon emissions; however, 2B illustrates that even after adjusting for GDP, other factors determine carbon emissions across cities. These factors are likely differing transportation modes, industrial structures and additional economic factors not captured directly by GDP.
The correlation matrix in Table 5 shows a high correlation between ACC1 and ACC2, and thus we evaluate these variables separately in our econometric models. Both ACC1 and ACC2 are correlated with GDP, POP and Area as well as the four other transportation variables, BUS, Road, Rail and Subway (SUB). Little correlation between ACC variables and MAN (manufacturing).
Table 5.
Correlation matrix.
3.2. Empirical Research Results
We applied R and Eviews software to estimate the empirics. Table 6 presents the impact of transportation on total carbon emissions, carbon emission per GDP, and carbon emissions per capita. All variables are in logarithms and normalized. Robust standard errors are reported that accommodate for autocorrelation across periods. We also used white cross-sectional robust standard errors, and results are slightly stronger for most transportation variables; hence, we report the more conservative standard errors that allow for correlations across periods to mitigate serial correlation.
Table 6.
Transportation effect on carbon emissions by city size.
We used OLS due to the assumption of limited feedback between carbon emissions and transportation modes. The lack of simultaneity is particularly true for HSR, as these routes are planned years in advance and the connectivity is determined by city size, location and region; e.g., the authorities have connected all the major cities of China through a four-by-four grid. Government authorities also decide plans for roads, metro systems and number of buses and bus routes years in advance. Construction and implementation take years, implying there is limited feedback between carbon and these transportation modes. The volume of rail also is likely to be exogenous, as commerce, population and overall economic activity between cities primarily determine rail volume. Thus, there is unlikely to be endogeneity problems between transportation modes and carbon on an annual basis. The area variable is exogenous. This means the only variables with possible endogeneity with carbon emissions are population, GDP, and manufacturing. Annual feedback effects are likely small for these variables; e.g., higher carbon emissions may induce people to move away from a city, but population growth is likely to be dominated by demographics, economic opportunity and government decisions (Nonetheless, we employed a GMM framework that allowed endogeneity of population, GDP manufacturing by using lagged instruments of these variables, and results were very similar. A second GMM approach allowed endogeneity of buses and rail. GMM coefficients and standard errors generate little change in inference.).
Results highlight that increases in ACC1 and ACC2 significantly boost carbon emissions, carbon emissions per GDP and carbon emissions per capita. The positive effect likely implies that HSR induces positive traffic demand, economic and social activities in cities, while the substitution effect for civil aviation and cars are to a great extent offset [20,90]. Further, the impact of carbon emissions is significantly greater for smaller (big) cities with less (more) than one million people. Inspection reveals that HSR’s impact on carbon emissions is substantially greater than rail for all cities; however, rail’s effect on carbon emissions is higher for bigger cities, while it is negative and significant for smaller cities. Buses have a large and positive effect on carbon emissions, and the carbon responses are robust across city size. Increases in roads reduce carbon emission across the country, and the effect is more negative for smaller cities. How important is transportation in contributing to carbon emissions? A regression of our control variables on carbon per GDP on the national level has an adjusted R2 of only 11%, while results in the fourth column with the transportation variables possess an adjusted R2 of 29%. Thus, transportation modes substantially explain carbon emissions per GDP.
Table 6 presents several relevant conclusions: (1) transportation including HSR, bus, and subways leads to higher total carbon emissions, per GDP and per capita for cities, both large and small. Rapid urbanization and industrialization in China imply public transportation induces greater traffic demand and economic activities in cities; this contributes to a positive relationship between HSR, buses and carbon emissions. As mentioned above, the availability of more bus lines may boost urban sprawl by encouraging people to move further away, leading to more carbon emissions. (2) Road expansion in cities reduces carbon emission per GDP and per capita; this likely implies that road network expansion in China may promote a more compact and concentrated urban development mode and raise urban economic productivity [91]. (3) HSR generates substantially smaller carbon emissions in bigger cities, while conventional rail can mitigate carbon emissions in smaller cities. One explanation is that conventional rail serves industries that enjoy agglomeration economies in a spatially clustered area through its passenger and freight station. (4) For city controls, rising GDP and larger urban areas generate more carbon emissions, while a rising population does not contribute to boosts in carbon. Increases in GDP lower carbon emissions per GDP, which implies that economic activity raises emissions but not one-for-one. If China initiates comprehensive policies to reduce carbon emissions [92], cities will favor public transportation development in an attempt to develop pro-environment policies. Our results suggest that authorities prioritize rail over HSR, closely monitor subways and bus emissions, and favor electric buses.
Table 7 documents that transport modes’ impact on carbon emissions differ by regions. Both ACC1 and ACC2 are significant and positive in the eastern and central regions, but insignificant in the West. The regional disparity may be due to lower HSR benefit in the west; this region is poorer, distances are greater, the HSR tariffs are high and have a lower value of time [30]. Results show expansion of buses boosts emissions for all regions and is especially significant for Western cities. The impact of roads differs between regions and measurement of carbon emissions. Rail’s impact on carbon emissions is considerably lower than HSR, and the effect varies by region. Subways boost carbon emissions, per GDP and per capita for all regions. Increases in GDP raise carbon emissions in the east and central regions, while larger area contributes to greater carbon emissions in the West.
Table 7.
Transportation effect on carbon emissions by regions.
The interaction between transport, land and human development has been the focus of several works in the literature; see for instance [11,93]. However, the impact of transportation interactions with city controls on carbon emissions in Chinese cities is still largely unresolved. Table 8 demonstrates that transportatio’sn impact on carbon emissions has significant nonlinear effects. ACC1, ACC2 and roads have a positive quadratic impact on carbon emissions. In contrast, buses have a negative quadratic effect on carbon output. ACC1, roads and rail have significant interactions with GDP on carbon emissions; ACC2, roads and rail significantly interact with population to affect carbon emissions. Buses also interact with GDP and POP and impact carbon emissions per GDP or per capita. Furthermore, for conciseness, we present transportation’s effect on carbon emissions with area interactions in Appendix Table A2.
Table 8.
Overall transportation effect on carbon emissions with interactions.
Lastly, we investigated the effect of transportation growth on urban carbon emissions. Table 9 documents that the growth of ACC1 and ACC2 positively affect the growth of carbon emission, carbon per GDP and carbon per capita. These results contrast with rail, which has no impact on the growth rate of carbon emissions. Further, buses have no impact on the growth rate of emissions; these results contrast with our earlier results in levels.
Table 9.
Transportation growth on carbon emission growth.
Table 9 documents substantial interactions terms, and demonstrates the importance of understanding how rising transportation and economic activity have a synergistic influence on the growth of carbon emissions. ACC2 particularly has a large quadratic effect with estimates of 0.54, 0.70, and 0.62 on the growth of carbon emissions, carbon emissions per GDP and emissions per capita. The size and significance add further evidence of the synergetic/interaction effects of HSR on carbon emissions. ACC1 also has significant interaction effects on carbon emissions, though its effects are a little smaller. Roads have a significant quadratic effect on carbon emissions, though its sign depends on whether total emissions or emissions per GDP or capita. Further, if quadratic or interaction terms are included, buses and rail have significant positive effects on carbon emissions, although both effects are relatively small, particularly compared to HSR. Columns (7)–(9) in Table 9 further document interactions with area on the growth of carbon emissions.
The policy implication for reducing carbon emissions growth in Chinese cities is that conventional rail and public bus transit system are preferred to HSR and roads. Additionally, Appendix Table A3 shows that HSR, bus, and rail boost the growth of carbon emissions, while road’s impact is negative but insignificant. HSR, bus and rail interact with area and raise the growth of carbon emissions. Road, however, interacts with area and decreases the growth of carbon emissions. Overall, the evidence is persuasive; increases in HSR in levels and growth rates lead to significant increases in carbon emissions and growth in carbon emissions.
4. Results and Discussion
Table 10 summarizes the paper’s hypotheses and empirical results. Based on annual panel data of 194 prefecture-level cities from 2008 to 2013, this paper examines the relationship between HSR, urban transportation and China’s urban carbon footprint. The paper develops a conceptual analytic framework to explain both direct and indirect effects of transportation on urban carbon emissions. We test an augmented IPAT model to evaluate the impacts of different transportation modes and its interactions with the geo-economic variables on China’s urban carbon footprint.
Table 10.
Fundamental hypotheses and empirical results.
Results demonstrate that HSR has a significant, positive effect on total carbon emissions, emissions per GDP and emissions per capita. This counter-intuitive result is likely attributable to HSR leading to increased travel and economic activity that boosts carbon emissions. Significant interaction terms confirm that HSR promotes urban population agglomeration and increases carbon emissions. Buses and subways further have a significant positive influence on urban carbon emissions. This counter-intuitive result may also be due to these modes likely inducing more demand during a period of rapid urbanization and industrialization in China. Promoting a city’s public transit system can reduce car usage; however, by extending a city’s public transit system, it can attract or induce more traffic demand. Therefore, the net impact of public transport on carbon emissions is positive. Results further highlight that roads sometimes contribute to carbon emission reductions. The reason behind this is that road development in cities, along with government policies encouraging public transport, makes it attractive for citizens to substitute away from cars to more environmentally friendly bus or metro systems, which, in turn, leads to overall energy consumption saving and carbon emission reduction. We further document that transportation modes explain 20% of carbon emissions per GDP. In future work, it would be interesting to extend the data several more years as the HSR network has become more extensive from 2014–2018, car purchases have grown and road expansion has continued.
Results highlight that HSR has substantially larger impacts on carbon emissions, carbon emissions per GDP and carbon emissions per capita than conventional rail. These results are particularly true in China’s east and central regions and smaller cities. The impact of other transportation modes show differential effects on emissions that are a function of city size and region. Further, most transportation modes, particularly HSR, have large quadratic effects on carbon emissions; moreover, most transport modes significantly interact with GDP, population and land area to influence emissions.
In terms of policy implications, the government plan to reduce city carbon emissions should consider many transportation factors, city size, region, and their relevant interactions on the urban environment. The impact of transport on carbon emissions via synergies and interactions with the economy implies the law of intended consequences applies. For instance, the government’s promotion of HSR and bus routes have encouraged travel, economic activity and urban sprawl, leading to more carbon consumption. Rail development plans should consider environmental impact evaluation factors and prioritize conventional rail rather than HSR [94,95]. The authorities should promote high-density development around rail and urban transit stations to enhance economic efficiency [96], reduce the negative externalities of urban sprawl and limit a city’s carbon footprint [97].
Author Contributions
All authors have contributed to the designed theoretical model, data collection, econometric analysis and write up the paper. All authors have read and approved this manuscript. L.L. helped collect the data and literature review, H.L. worked on the model, overall theme of the paper and much of the writing, and J.S. estimated the data and also worked on writing of the paper.
Funding
This research was funded by the research project of The National Social Science Fund of China “Economic Evaluation System Restructuring for High Speed Rail Project”, grant number 18BJY170.
Acknowledgments
This paper is financially supported by the research project of The National Social Science Fund of China “Economic Evaluation System Restructuring for High Speed Rail Project” (Project number: 18BJY170).
Conflicts of Interest
The authors declare that they have no conflicts of interest to any other parties.
Appendix A
Table A1.
Abbreviation table.
Table A1.
Abbreviation table.
| Terms | Abbreviation | Terms | Abbreviation | Terms | Abbreviation |
|---|---|---|---|---|---|
| High-speed rail | HSR | Gross domestic product | GDP | Electric multiple unit | EMU |
| Transport demand management | TDM | Transport supply management | TSM | Impact, population, affluence, technology | IPAT |
| Stochastic Impacts by Regression on IPAT | STIRPAT | Population | P, POP | Economy | A |
| City | CITY | Transportation | TRANS | Accessibility | ACC |
| Subway | SUB | Carbon emission | CARB | Population | POP |
| % of economy employed in manufacturing | MAN | Build up area | AREA | The value added of the tertiary industry over the secondary industry | TS |
| The employment of the tertiary industry divided by the secondary industry | TSTE | Urban internal potential | IMP | Science and technology expenditure budget | TECH |
| Artificial gas | AG | Liquefied petroleum gas | LPG | Natural gas | NG |
| Generalized weighted accessibility | gwt | Travel expenditure | F | Weighted time value | TV |
| Working hour | WH | Average annual disposable income | WAGE | Transit oriented development | TOD |
Note: the authors compiled.
Table A2.
Transportation effect on carbon emissions with area interactions.
Table A2.
Transportation effect on carbon emissions with area interactions.
| Variables | CARB CARB/GDP CARB/POP | CARB | CARB Growth Rate | |||||||
|---|---|---|---|---|---|---|---|---|---|---|
| Nat | Nat | Nat | East | Central | West | CARB | CARB/GDP | CARB/POP | ||
| Transportation | ACC2 | 0.111 *** | 0.143 *** | 0.126 *** | 0.114 *** | 0.113 *** | −0.051 | 0.122 *** | 0.157 *** | 0.140 *** |
| (0.004) | (0.006) | (0.005) | (0.015) | (0.009) | (0.040) | (0.041) | (0.053) | (0.047) | ||
| ACC1 | 0.130 *** | 0.167 *** | 0.148*** | 0.119 *** | 0.129 *** | 0.024 | 0.030 * | 0.157 *** | 0.035* | |
| (0.003) | (0.004) | (0.004) | (0.014) | (0.008) | (0.028) | (0.016) | (0.053) | (0.019) | ||
| BUS | 0.241 *** | 0.310 *** | 0.275 *** | 0.127 *** | 0.300 *** | 0.675 *** | 0.024 ** | 0.031 ** | 0.027 ** | |
| (0.015) | (0.020) | (0.018) | (0.026) | (0.045) | (0.157) | (0.010) | (0.013) | (0.011) | ||
| ROAD | −0.078 *** | −0.100 *** | −0.088 *** | 0.238 *** | −0.089 ** | −0.212 *** | −0.003 | −0.004 | −0.004 | |
| (0.015) | (0.019) | (0.017) | (0.022) | (0.043) | (0.069) | (0.010) | (0.013) | (0.012) | ||
| RAIL | 0.026 ** | 0.034 ** | 0.030 ** | 0.045 * | −0.074 ** | −0.019 | 0.012 *** | 0.016 *** | 0.014 *** | |
| (0.012) | (0.015) | (0.013) | (0.026) | (0.030) | (0.063) | (0.003) | (0.003) | (0.003) | ||
| SUB | 0.382 *** | 0.491 *** | 0.435 *** | 0.434 *** | 0.265 *** | 0.138 *** | ||||
| (0.050) | (0.065) | (0.057) | (0.024) | (0.025) | (0.132) | |||||
| Interactions | ACC2 | 0.004 | 0.005 | 0.009 | 0.188 *** | −0.017 | 0.035 * | 0.100 *** | 0.129 *** | 0.115 *** |
| (0.008) | (0.010) | (0.009) | (0.013) | (0.012) | (0.021) | (0.005) | (0.007) | (0.006) | ||
| ACC1 | 0.008 | 0.010 | −0.056 *** | 0.190 *** | −0.024 ** | 0.024 | 0.061 *** | 0.078 *** | 0.069 *** | |
| (0.008) | (0.010) | (0.019) | (0.011) | (0.012) | (0.018) | (0.004) | (0.005) | (0.004) | ||
| BUS | −0.038 ** | −0.049 *** | −0.056 ** | 0.055 ** | 0.035 | −0.054 | 0.009 *** | 0.012 *** | 0.010 *** | |
| (0.018) | (0.017) | (0.019) | (0.020) | (0.046) | (0.072) | (0.002) | (0.002) | (0.002) | ||
| ROAD | −0.050 *** | −0.061 *** | −0.042 *** | −0.102 *** | −0.031 | 0.131 ** | −0.010 ** | −0.021 *** | −0.022 *** | |
| (0.017) | (0.021) | (0.017) | (0.019) | (0.033) | (0.065) | (0.004) | (0.005) | (0.004) | ||
| RAIL | 0.050 *** | 0.062 ** | 0.060 *** | 0.081 *** | −0.110 *** | −0.091 *** | 0.010 *** | 0.022 *** | 0.011 *** | |
| (0.018) | (0.024) | (0.021) | (0.020) | (0.036) | (0.016) | (0.003) | (0.004) | (0.003) | ||
| Adjusted R2 | 0.83 | 0.31 | 0.69 | 0.90 | 0.87 | 0.74 | 0.04 | 0.93 | 0.91 | |
Notes: We use the same control variables as the earlier regressions (GDP, POP, MAN and AREA), but do not report them for conciseness. We add area interaction terms.
Table A3.
Regional transportation effect on carbon emissions with interactions.
Table A3.
Regional transportation effect on carbon emissions with interactions.
| Variables | CARB (GDP Interaction) | CARB (Population Interaction) | CARB/GDP (GDP Interaction) | |||||||
|---|---|---|---|---|---|---|---|---|---|---|
| East | Central | West | East | Central | West | East | Central | West | ||
| Transportation | ACC2 | 0.097 *** | 0.115 *** | 0.046 | 0.125 *** | 0.121 *** | −0.074 | 0.124 *** | 0.155 *** | 0.059 |
| (0.010) | (0.013) | (0.045) | (0.009) | (0.009) | (0.045) | (0.022) | (0.020) | (0.113) | ||
| ACC1 | 0.106 *** | 0.128 *** | 0.112 *** | 0.125 *** | 0.136 *** | 0.032 | 0.137 *** | 0.176 *** | 0.144 | |
| (0.009) | (0.013) | (0.045) | (0.009) | (0.008) | (0.054) | (0.023) | (0.021) | (0.122) | ||
| BUS | 0.092 *** | 0.228 *** | 0.799 *** | 0.125 *** | 0.272 *** | 0.956 *** | 0.118 *** | 0.392 *** | 1.026 *** | |
| (0.025) | (0.04) | (0.167) | (0.010) | (0.048) | (0.175) | (0.040) | (0.059) | (0.208) | ||
| ROAD | 0.243 * | −0.034 | −0.193 *** | 0.229 *** | −0.105 *** | −0.169 ** | 0.312 *** | −0.144 ** | −0.248 | |
| (0.020) | (0.043) | (0.033) | (0.023) | (0.037) | (0.060) | (0.040) | (0.068) | (0.162) | ||
| RAIL | 0.040 | −0.033 ** | −0.080 | 0.047 * | −0.019 | −0.110 ** | 0.051 *** | −0.119 *** | −0.102 | |
| (0.032) | (0.015) | (0.062) | (0.028) | (0.020) | (0.049) | (0.020) | (0.042) | (0.104) | ||
| SUB | 0.529 *** | 0.220 *** | 0.153 | 0.448 *** | 0.186 *** | −0.085 | 0.680 *** | 0.294 *** | 0.196 | |
| (0.028) | (0.054) | (0.137) | (0.036) | (0.043) | (0.154) | (0.096) | (0.094) | (0.527) | ||
| Interactions | ACC2 | 0.220 *** | −0.012 | −0.016 | 0.152 *** | −0.041 *** | 0.150 *** | 0.283 *** | −0.009 | −0.020 |
| (0.019) | (0.011) | (0.035) | (0.005) | (0.005) | (0.027) | (0.021) | (0.019) | (0.104) | ||
| ACC1 | 0.222 *** | −0.021 | −0.030 | 0.152 *** | −0.037 *** | 0.153 *** | 0.286 *** | −0.028 * | −0.039 | |
| (0.016) | (0.01) | (0.047) | (0.006) | (0.004) | (0.039) | (0.021) | (0.020) | (0.112) | ||
| BUS | 0.025 | −0.075 | 0.097 | 0.000 | −0.102 | −0.045 | 0.056 | 0.110 * | −0.315 * | |
| (0.019) | (0.022) | (0.040) | (0.022) | (0.026) | (0.058) | (0.035) | (0.066) | (0.211) | ||
| ROAD | −0.090 *** | 0.040 | 0.070 * | −0.090 *** | 0.021 | 0.101 * | −0.130 *** | −0.032 *** | 0.341 * | |
| (0.016) | (0.039) | (0.036) | (0.015) | (0.015) | (0.063) | (0.033) | (0.049) | (0.158) | ||
| RAIL | 0.100 *** | −0.070 *** | −0.161 *** | 0.142 *** | 0.019 | −0.070 *** | 0.111 *** | −0.142 *** | −0.009 | |
| (0.037) | (0.019) | (0.030) | (0.019) | (0.023) | (0.016) | (0.029) | (0.050) | (0.103) | ||
| Adjusted R2 | 0.90 | 0.87 | 0.70 | 0.91 | 0.89 | 0.82 | 0.53 | 0.31 | 0.25 | |
Notes: We use the same control variables as the earlier regressions. See Table 6 for details. ***, ** and * denote significance at 1%, 5% and 10% levels.
References
- Liu, L.; Wang, K.; Wang, S.; Zhang, R.; Tang, X. Assessing energy consumption, CO2 and pollutant emissions and health benefits from China’s transport sector through 2050. Energy Policy 2018, 116, 382–396. [Google Scholar] [CrossRef]
- Lombardi, M.; Laiola, E.; Tricase, C.; Rana, R. Assessing the urban carbon footprint: An overview. Environ. Impact Assess. Rev. 2017, 66, 43–52. [Google Scholar] [CrossRef]
- Shunping, J.; Baohua, M.; Shuang, L.; Qipeng, S. Calculation and analysis of transportation energy consumption level in China. J. Transp. Syst. Eng. Inf. Technol. 2010, 10, 22–27. [Google Scholar]
- Notice of Coping with Climate Change Plan (2014–2020). Available online: http://www.ndrc.gov.cn/zcfb/zcfbtz/201411/t20141104_642612.html (accessed on 11 December 2018).
- Lin, W.; Chen, B.; Xie, L.; Pan, H. Estimating Energy Consumption of Transport Modes in China Using DEA. Sustainability 2015, 7, 4225–4239. [Google Scholar] [CrossRef]
- Addanki, S.C.; Venkataraman, H. Greening the economy: A review of urban sustainability measures for developing new cities. Sustain. Cities Soc. 2017, 32, 1–8. [Google Scholar] [CrossRef]
- Pandey, D.; Agrawal, M.; Pandey, J.S. Carbon footprint: Current methods of estimation. Environ. Monit. Assess. 2011, 178, 135–160. [Google Scholar] [CrossRef]
- Ma, M.; Shen, L.; Ren, H.; Cai, W.; Ma, Z. How to measure carbon emission reduction in China’s public building sector: Retrospective decomposition analysis based on STIRPAT model in 2000–2015. Sustainability 2017, 9, 1744. [Google Scholar] [CrossRef]
- Acquaye, A.; Feng, K.; Oppon, E.; Salhi, S.; Ibn-Mohammed, T.; Genovese, A.; Hubacek, K. Measuring the environmental sustainability performance of global supply chains: A multi-regional input-output analysis for carbon, sulphur oxide and water footprints. J. Environ. Manag. 2017, 187, 571–585. [Google Scholar] [CrossRef]
- Southworth, F.; Sonnenberg, A. Set of comparable carbon footprints for highway travel in metropolitan America. J. Transp. Eng. 2011, 137, 426–435. [Google Scholar] [CrossRef]
- Van Vuuren, D.P.; Stehfest, E.; Gernaat, D.E.; Doelman, J.C.; Van den Berg, M.; Harmsen, M.; Girod, B. Energy, land-use and greenhouse gas emissions trajectories under a green growth paradigm. Glob. Environ. Chang. 2017, 42, 237–250. [Google Scholar] [CrossRef]
- Li, Z.; Zhong, J.; Sun, Z.; Yang, W. Spatial pattern of carbon sequestration and urban sustainability: Analysis of land-use and carbon emission in Guang’an, China. Sustainability 2017, 9, 1951. [Google Scholar] [CrossRef]
- Martínez-Zarzoso, I.; Maruotti, A. The impact of urbanization on CO2 emissions: Evidence from developing countries. Ecol. Econ. 2011, 70, 1344–1353. [Google Scholar] [CrossRef]
- Dietz, T.; Rosa, E.A. Effects of population and affluence on CO2 emissions. Proc. Natl. Acad. Sci. USA 1997, 94, 175–179. [Google Scholar] [CrossRef] [PubMed]
- Zaman, K.; Moemen, M.A.E.; Islam, T. Dynamic linkages between tourism transportation expenditures, carbon dioxide emission, energy consumption and growth factors: Evidence from the transition economies. Curr. Issues Tour. 2017, 20, 1720–1735. [Google Scholar] [CrossRef]
- Marquez, L.O.; Smith, N.C. A framework for linking urban form and air quality. Environ. Model. Softw. 1999, 14, 541–548. [Google Scholar] [CrossRef]
- Glaeser, E.L.; Kahn, M.E. The greenness of cities: Carbon dioxide emissions and urban development. J. Urban Econ. 2010, 67, 404–418. [Google Scholar] [CrossRef]
- VandeWeghe, J.R.; Kennedy, C. A spatial analysis of residential greenhouse gas emissions in the Toronto census metropolitan area. J. Ind. Ecol. 2007, 11, 133–144. [Google Scholar] [CrossRef]
- He, B.J.; Zhao, D.X.; Zhu, J.; Darko, A.; Gou, Z.H. Promoting and implementing urban sustainability in China: An integration of sustainable initiatives at different urban scales. Habitat Int. 2018, 82, 83–93. [Google Scholar] [CrossRef]
- Chen, Z.; Xue, J.; Rose, A.Z.; Haynes, K.E. The impact of high-speed rail investment on economic and environmental change in China: A dynamic CGE analysis. Transp. Res. Part A Policy Pract. 2016, 92, 232–245. [Google Scholar] [CrossRef]
- Wang, K.; Xia, W.; Zhang, A. Should China further expand its high-speed rail network? Consider the low-cost carrier factor. Transp. Res. Part A Policy Pract. 2017, 100, 105–120. [Google Scholar] [CrossRef]
- Xia, W.; Zhang, A. Air and high-speed rail transport integration on profits and welfare: Effects of air-rail connecting time. J. Air Transp. Manag. 2017, 65, 181–190. [Google Scholar] [CrossRef]
- Westin, J.; Kågeson, P. Can high speed rail offset its embedded emissions? Transp. Res. D Transp. Environ. 2012, 17, 1–7. [Google Scholar] [CrossRef]
- Li, L.; Loo, B.P. Railway development and air patronage in China, 1993–2012: Implications for low-carbon transport. J. Reg. Sci. 2017, 57, 507–522. [Google Scholar] [CrossRef]
- Wee, B.V.; Janse, P.; Brink, R.V.D. Comparing energy use and environmental performance of land transport modes. Transp. Rev. 2005, 25, 3–24. [Google Scholar] [CrossRef]
- Janic, M. Assessing some social and environmental effects of transforming an airport into a real multimodal transport node. Transp. Res. D Transp. Environ. 2011, 16, 137–149. [Google Scholar] [CrossRef]
- Givoni, M. Environmental benefits from mode substitution: Comparison of the environmental impact from aircraft and high-speed train operations. Int. J. Sustain. Transp. 2007, 1, 209–230. [Google Scholar] [CrossRef]
- Åkerman, J. The role of high-speed rail in mitigating climate Change—The Swedish case Europabanan from a life cycle perspective. Transp. Res. D Transp. Environ. 2011, 16, 208–217. [Google Scholar] [CrossRef]
- Lin, H.; Zeng, S.; Ge, S.; Chen, Y. Can the bullet train speed up climate change mitigation in China? Front. Eng. 2017, 4, 104–105. [Google Scholar] [CrossRef]
- Wu, J.; Nash, C.; Wang, D. Is high speed rail an appropriate solution to China’s rail capacity problems? J. Transp. Geogr. 2014, 40, 100–111. [Google Scholar] [CrossRef]
- Chang, B.; Kendall, A. Life cycle greenhouse gas assessment of infrastructure construction for California’s high-speed rail system. Transp. Res. D Transp. Environ. 2011, 16, 429–434. [Google Scholar] [CrossRef]
- Fu, Y.; Liu, H.; Zhang, S. Calculation method for carbon dioxide emission in the life cycle of high-speed railway. China Railw. Sci. 2013, 34, 140–144. [Google Scholar]
- Givoni, M. Development and impact of the modern high-speed train: A review. Transp. Rev. 2006, 26, 593–611. [Google Scholar] [CrossRef]
- Albalate, D.; Bel, G. High-speed rail: Lessons for policy makers from experiences abroad. Public Admin. Rev. 2012, 72, 336–349. [Google Scholar] [CrossRef]
- Hall, P.; Banister, D. The second railway age. Built Environ. 1993, 19, 157–162. [Google Scholar]
- Railway Development Bulletin of 2017. Available online: http://www.nra.gov.cn/xwzx/zlzx/hytj/201804/t20180412_55248.shtml (accessed on 12 April 2018).
- Statistics Information of China Railway Corporation. Available online: http://www.china-railway.com.cn/cpyfw/tjxx/ (accessed on 21 December 2018).
- Medium and Long-Term Railway Network Plan. Available online: http://www.ndrc.gov.cn/zcfb/zcfbtz/201607/t20160720_811696.html (accessed on 13 July 2016).
- High-Speed Rail Network to Cover 80% of Major Cities in China by 2020. Available online: https://gbtimes.com/high-speed-rail-network-to-cover-80-of-major-cities-in-china-by-2020 (accessed on 2 January 2018).
- Railway Statistics Bulletin (2008–2016). Available online: http://www.china-railway.com.cn/ (accessed on 10 January 2018).
- National Statistics Bureau. Available online: http://data.stats.gov.cn/easyquery.htm?cn=C01 (accessed on 16 March 2018).
- Annual Audit Report of China Railway Corporation (2008–2016). Available online: https://www.chinabond.com.cn/ (accessed on 18 March 2018).
- Dong, D.; Duan, H.; Mao, R.; Song, Q.; Zuo, J.; Zhu, J.; Liu, G. Towards a low carbon transition of urban public transport in megacities: A case study of Shenzhen, China. Resour. Conserv. Recycl. 2018, 134, 149–155. [Google Scholar] [CrossRef]
- Li, P.; Zhao, P.; Brand, C. Future energy use and CO2 emissions of urban passenger transport in China: A travel behavior and urban form based approach. Appl. Energ. 2018, 211, 820–842. [Google Scholar] [CrossRef]
- Loo, B.P.; Li, L. Carbon dioxide emissions from passenger transport in China since 1949: Implications for developing sustainable transport. Energy Policy 2012, 50, 464–476. [Google Scholar] [CrossRef]
- Xu, B.; Lin, B. Factors affecting carbon dioxide (CO2) emissions in China’s transport sector: A dynamic nonparametric additive regression model. J. Clean. Prod. 2015, 101, 311–322. [Google Scholar] [CrossRef]
- Zhang, N.; Wei, X. Dynamic total factor carbon emissions performance changes in the Chinese transportation industry. Appl. Energ. 2015, 146, 409–420. [Google Scholar] [CrossRef]
- Ma, J.; Chai, Y.; Liu, Z. The Mechanism of CO2 emissions from urban transport based on individuals’ travel behavior in Beijing. Acta Geogr. Sin. 2011, 66, 1023–1032. [Google Scholar]
- Urban Public Transport. Available online: http://data.stats.gov.cn/easyquery.htm?cn=C01 (accessed on 21 December 2018).
- Yearly Statistical Report 2017 of China Association of Metros. Available online: http://www.camet.org.cn (accessed on 21 December 2018).
- Miao, L. Examining the impact factors of urban residential energy consumption and CO2 emissions in China—Evidence from city-level data. Ecol. Indic. 2017, 73, 29–37. [Google Scholar] [CrossRef]
- Zhang, L.; Long, R.; Chen, H.; Yang, T. Analysis of an optimal public transport structure under a carbon emission constraint: A case study in Shanghai, China. Environ. Sci. Pollut. R. 2018, 25, 3348–3359. [Google Scholar] [CrossRef]
- Wu, T.; Zhao, H.; Ou, X. Vehicle Ownership Analysis Based on GDP per Capita in China: 1963–2050. Sustainability 2014, 6, 4877–4899. [Google Scholar] [CrossRef]
- Zahabi, S.A.H.; Miranda-Moreno, L.; Patterson, Z.; Barla, P.; Harding, C. Transportation greenhouse gas emissions and its relationship with urban form, transit accessibility and emerging green technologies: A Montreal case study. Procedia Soc. Behav. Sci. 2012, 54, 966–978. [Google Scholar] [CrossRef]
- Focas, C. Travel behaviour and CO2 emissions in urban and exurban London and New York. Transp. Policy 2016, 46, 82–91. [Google Scholar] [CrossRef]
- He, D.; Liu, H.; He, K.; Meng, F.; Jiang, Y.; Wang, M.; Wang, Q. Energy use of, and CO2 emissions from China’s urban passenger transportation sector–carbon mitigation scenarios upon the transportation mode choices. Transp. Res. Part A Policy Pract. 2013, 53, 53–67. [Google Scholar] [CrossRef]
- Andong, R.F.; Sajor, E. Urban sprawl, public transport, and increasing CO2 emissions: The case of Metro Manila, Philippines. Environ. Dev. Sustain. 2017, 19, 99–123. [Google Scholar] [CrossRef]
- Chapman, L. Transport and climate change: A review. J. Transp. Geogr. 2007, 15, 354–367. [Google Scholar] [CrossRef]
- Brännlund, R.; Ghalwash, T.; Nordström, J. Increased energy efficiency and the rebound effect: Effects on consumption and emissions. Energy Econ. 2007, 29, 1–17. [Google Scholar] [CrossRef]
- Darido, G.; Torres-Montoya, M.; Mehndiratta, S. Urban transport and CO2 emissions: Some evidence from Chinese cities. Wiley Interdiscip. Rev. Energy Environ. 2014, 3, 122–155. [Google Scholar] [CrossRef]
- Hongchang, L.; Strauss, J.; Shunxiang, H.; Lihong, L. Do high-speed railways lead to urban economic growth in China? A panel data study of China’s cities. Q. Rev. Econ. Finance 2018, 69, 70–89. [Google Scholar]
- Jiao, J.; Wang, J.; Jin, F.; Dunford, M. Impacts on accessibility of China’s present and future HSR network. J. Transp. Geogr. 2014, 40, 123–132. [Google Scholar] [CrossRef]
- Jiao, J.; Wang, J.; Jin, F. Impacts of high-speed rail lines on the city network in China. J. Transp. Geogr. 2017, 60, 257–266. [Google Scholar] [CrossRef]
- Ishii, S.; Tabushi, S.; Aramaki, T.; Hanaki, K. Impact of future urban form on the potential to reduce greenhouse gas emissions from residential, commercial and public buildings in Utsunomiya, Japan. Energy Policy 2010, 38, 4888–4896. [Google Scholar] [CrossRef]
- Nakamura, H. The economic evaluation of transport infrastructure: Needs for international comparisons. Transp. Policy 2000, 7, 3–6. [Google Scholar] [CrossRef]
- Ramaswami, A.; Jiang, D.; Tong, K.; Zhao, J. Impact of the economic structure of cities on urban scaling factors: Implications for urban material and energy flows in China. J. Ind. Ecol. 2018, 22, 392–405. [Google Scholar] [CrossRef]
- Ji, X.; Chen, B. Assessing the energy-saving effect of urbanization in China based on stochastic impacts by regression on population, affluence and technology (STIRPAT) model. J. Clean Prod. 2017, 163, 306–314. [Google Scholar] [CrossRef]
- Vickerman, R. Can high-speed rail have a transformative effect on the economy? Trans. Policy 2018, 62, 31–37. [Google Scholar] [CrossRef]
- Wang, S.; Liu, X.; Zhou, C.; Hu, J.; Ou, J. Examining the impacts of socioeconomic factors, urban form, and transportation networks on CO2 emissions in China’s megacities. Appl. Energy 2017, 185, 189–200. [Google Scholar] [CrossRef]
- Pojani, D.; Stead, D. The Urban Transport Crisis in Emerging Economies; Springer International Publishing: Cham, Switzerland, 2017. [Google Scholar]
- McLeod, S.; Scheurer, J.; Curtis, C. Urban public transport: Planning principles and emerging practice. J. Plan. Lit. 2017, 32, 223–239. [Google Scholar] [CrossRef]
- Black, J. Urban Transport Planning: Theory and Practice; Routledge: Abingdon-on-Thames, UK, 2018. [Google Scholar]
- Williams, K. Spatial Planning, Urban Form and Sustainable Transport. In Spatial Planning, Urban Form and Sustainable Transport: An Introduction; Routledge: Abingdon-on-Thames, UK, 2017. [Google Scholar]
- Pan, H. Urban spatial structure towards low carbon: New urban transport and land use model. Urban Stud. 2010, 17, 40–45. [Google Scholar]
- Zeng, C.; Yang, L.; Dong, J. Management of urban land expansion in China through intensity assessment: A big data perspective. J. Clean Prod. 2017, 153, 637–647. [Google Scholar] [CrossRef]
- Ehrlich, P.R.; Holdren, J.P. Impact of population growth. Science 1971, 171, 1212–1217. [Google Scholar] [CrossRef] [PubMed]
- Wang, G.; Wu, J. The impact of urban scale and spatial structure on carbon emissions. Urban Stud. 2012, 3, 89–95. [Google Scholar]
- Du, Q.; Xu, Y.; Wu, M.; Sun, Q.; Bai, L.; Yu, M. A network analysis of indirect carbon emission flows among different industries in China. Environ. Sci. Pollut. R. 2018, 25, 1–19. [Google Scholar] [CrossRef]
- Zhao, R.; Chuai, X.; Huang, X.; Lai, L.; Peng, J. Carbon emission and carbon footprint of different industrial spaces in different regions of China. In Assessment of Carbon Footprint in Different Industrial Sectors; Springer: Singapore, 2014; Volume 1, pp. 191–220. [Google Scholar]
- Lan, J.; Fu, W.; Yuan, B. Analysis of carbon emission and carbon footprint of different land use in Chongqing. J. Soil Water Conserv. 2012, 26, 146–150. [Google Scholar]
- Harris, C.D. The market as a factor in the localization of industry in the United States. Ann. Assoc. Am. Geogr. 1954, 44, 315–348. [Google Scholar]
- Head, K.; Mayer, T. Non-Europe: The magnitude and causes of market fragmentation in the EU. Rev. World Econ. 2000, 136, 284–314. [Google Scholar] [CrossRef]
- Hongchang, L.; Tjia, L.; Shunxiang, H. The impact of China’s high-speed railway on economic agglomeration and equalization of cities along the routes. J. Quant. Tech. Econ. 2016, 11, 127–143. [Google Scholar]
- Shi, J.; Zhou, N. How cities influenced by high speed rail development: A case study in China. J. Transp. Technol. 2013, 3, 7–16. [Google Scholar] [CrossRef]
- Li, J. Survey and analysis on passenger travel characteristics and distribution features of Wuhan-Guangzhou high speed railway. Railw. Stand. Des. 2011, 11, 1–4. [Google Scholar]
- Tao, Y. Research on economic impacts of HSR. Rail. Transp. Econ. 2007, 29, 4–6. [Google Scholar]
- The China City Statistics Yearbook (2008–2014). Available online: http://data.cnki.net/ (accessed on 20 March 2018).
- National Railway Passenger Time Schedule (2007–2013). Available online: https://www.wandoujia.com/mip/apps/za.co.nasdev.gt.ui/history (accessed on 20 March 2018).
- China Transportation Statistics Yearbook (2008–2014). Available online: http://www.chinayearbook.com/yearbook/ (accessed on 20 March 2018).
- Robertson, S. The potential mitigation of CO2 emissions via modal substitution of high-speed rail for short-haul air travel from a life cycle perspective—An Australian case study. Transp. Res. D Transp. Environ. 2016, 46, 365–380. [Google Scholar] [CrossRef]
- Yu, N.; de Roo, G.; De Jong, M.; Storm, S. Does the expansion of a motorway network lead to economic agglomeration? Evidence from China. Transp. Policy 2016, 45, 218–227. [Google Scholar] [CrossRef]
- Liu, W.; Qin, B. Low-carbon city initiatives in China: A review from the policy paradigm perspective. Cities 2016, 51, 131–138. [Google Scholar] [CrossRef]
- Acheampong, R.A.; Silva, E.A. Land use—Transport interaction modeling: A review of the literature and future research directions. J. Transp. Land Use 2015, 8, 11–38. [Google Scholar] [CrossRef]
- Baron, T.; Martinetti, G.; Pépion, D. Carbon Footprint of High Speed Rail; UIC: Paris, France, 2011; pp. 23–25. [Google Scholar]
- Ribalaygua, C.; Perez-Del-Caño, S. Assessing spatial planning strategy in high-speed rail station areas in Spain (1992–2018): Towards a sustainable model. Eur. Plan. Stud. 2019, 1–23. [Google Scholar] [CrossRef]
- Cao, X.J.; Pan, Q. Rapid transit and land development in a diverse world. Transp. Policy 2016, 51, 1–3. [Google Scholar] [CrossRef]
- Lin, X.; Yang, J.; MacLachlan, I. High-speed rail as a solution to metropolitan passenger mobility: The case of Shenzhen-Dongguan-Huizhou metropolitan area. J. Transp. Land Use 2018, 11, 1257–1270. [Google Scholar] [CrossRef]


© 2019 by the authors. Licensee MDPI, Basel, Switzerland. This article is an open access article distributed under the terms and conditions of the Creative Commons Attribution (CC BY) license (http://creativecommons.org/licenses/by/4.0/).