Abstract
Aid from the government can play a critical role as a risk-coping device in a post-disaster situation if the recipients are properly targeted. We analyze the accuracy of disaster aid targeting and self-reporting bias in disaster damage and aid receipt by combining (i) satellite images (objective information on flood damage), (ii) administrative records (objective information on post-flood aid receipt), and (iii) unique survey data (self-reported information on damage assessment and aid receipt) on a large-scale flooding in 2012 in the Philippines. We find that damage is over-reported while aid receipt is under-reported, and as a result, the estimated targeting accuracy based on self-reported information is substantially downward-biased.
1. Introduction
Disasters triggered by natural hazards cause negative economic shocks to individuals and households. According to the Centre for Research on the Epidemiology of Disasters (CRED [1]), there were 335 disasters recorded around the world in 2017, killing 9697 people and affecting an additional 95.6 million people. The CRED database shows an increasing trend in the occurrence of disasters in the past few decades, and in Asia in particular. Although disasters affect households both in the developed and developing worlds, Kahn [2], and Noy and Yonson [3], among others, have illustrated that households in developing countries are more vulnerable because of their limited capacity to cope with the sudden negative shocks caused by disasters.
Although households and individuals in developing countries adopt various risk-coping strategies, both ex ante and ex post, their private risk-coping strategies are not always enough to compensate for the damage caused by natural hazards. For instance, Aldrich, Sawada, and Oum [4] found that only 9% of the disaster damages in Asia were insured. As private risk-coping is insufficient, public risk-coping, particularly aid from the government, can be an important risk-coping strategy in the aftermath of disasters (Morris, et al. [5]; Shoji [6]; Strömberg [7]).
The precise targeting of aid, however, is known to be difficult, because of the asymmetric information, i.e., aid providers (in many cases, the government) have less information compared with potential beneficiaries. In economics literature, the targeting of food aid (e.g., Abdulai, Barrett, and Hoddinott [8]; Galasso and Ravallion [9]; Jayne, et al. [10]) and other resource transfers to low-income households (e.g., Alatas, et al. [11]; Alderman [12]; Bardhan and Mookherjee [13]) have been investigated thoroughly, and these studies have found that targeting is generally undermined by an inclusion error (providing transfer to those who do not need it) and an exclusion error (failing to provide transfer to those who need it). Owing to such targeting errors, some researchers and policymakers argue that universal resource transfers, or universal basic income, is preferable to targeted transfers (see a recent survey by Hanna and Olken [14]). The targeting of governmental transfers is even more difficult in disaster relief and aid (e.g., Amin and Goldstein [15]; Morris and Wodon [16]; Takasaki [17]), because they have to be provided in a timely manner in the aftermath of disasters, when the government would have other responsibilities, such as the reconstruction of damaged infrastructure, and where the government functioning itself might have been affected by the disasters.
While the existing micro-level quantitative studies, including those cited above, mostly rely on self-reported information collected by household surveys, it is well-known that survey data suffer from various types of reporting biases, such as recall error and strategic misreporting (in expectation of aid, for instance) (e.g., Bound, Brown, and Mathiowetz [18]; Gibson and Kim [19]; Kennickell and Starr-McCluer [20]). Hence, the existence and extent of targeting inaccuracy is still largely unknown, despite its importance in policy design. Further, as data collection is more difficult in the aftermath of disasters (Heltberg, Oviedo, and Talukdar [21]), not much is known about the targeting accuracy of post-disaster relief and aid.
To investigate the accuracy of disaster aid targeting, we constructed a unique data set containing both the self-reported and objective information. Our data set was based on three different sources of information collected after a large-scale flood in the Philippines in 2012. First, we conducted a survey of 122 farmers in the affected village and collected the self-reported information on flood damage and aid receipt. Second, we used satellite images that show the border of the flood submergence. The unexpected flooding resulted in within-village variations in flood damage—about half of the paddy fields were inundated. As satellite images provide objective information on the affected fields, we can identify the intended beneficiaries of post-flood aid. Importantly, the damage is not systematically correlated with the characteristics of the sample farmers, and, hence, the flood damage can be considered an exogenous shock. Lastly, we created a data set from the administrative records of the seed aid provided to the farmers whose agricultural land was inundated. We obtained a list of the recipient farmers from the local government office, which provided objective information on the recipients of the seed aid.
Combining these data, we find that more farmers reported to have been affected by the flooding than those identified based on the satellite images, and less farmers reported to have received the seed aid than those recorded in the administrative list. In other words, flood damage is over-reported, while aid receipt is under-reported. Because of these two types of self-reporting bias, if we rely solely on the self-reported information, the exclusion error rate increases, and, thus, the estimated accuracy of the targeting becomes substantially lower than that based on objective information. Our regression results show that the affected farmers were only 19–20 percentage points more likely to have received aid than the farmers without damage, if we rely only on the subjective information. Based on the objective information, however, the farmers with damage were 45–49 percentage points more likely to have received aid. Although targeting is still far from perfect, its accuracy is higher than the estimation based on self-reported data. These results suggest that aid targeting is a challenging task, but it may not be as challenging as discussed in the existing studies. Our findings support the recent trend in economics studies, to combine household survey data with more objective data, such as remote sensing data, that are normally used in the natural science disciplines (see an excellent survey by Dell, Jones, and Olken [22]).
2. Data
In this section, we describe the flooding that occurred in the Philippines in 2012; our study site is located in the affected area. Then, we explain the details of our data set.
2.1. The 2012 Habagat Flooding
In August 2012, large-scale flooding occurred because of torrential monsoon rains in the Philippines. This flood was known as “Habagat,” which means southwest monsoon in Tagalog. The 2012 Habagat flooding started with an eight-day period of heavy rains and thunderstorms from 1 August 2012. It was caused by two typhoons, Saola (Gener) and Haikui. However, it was not the typhoons themselves that caused damage, rather, the strong southwest monsoons caused typhoon-like damage, such as river overflows and landslides (Sawada and Kuroishi [23]). Manila, the capital city of the Philippines, and its surrounding provinces, were severely affected. The most severe flooding was recorded from 7–9 August, and a state of calamity was declared on 8 August. According to the National Disaster Risk Reduction and Management Council (NDRRMC) of the Philippines, 112 people were killed and over four million people were affected. The estimated cost of damage was PHP 651 million (equivalent to USD 15.4 million, as of August 2012) in infrastructural loss, and PHP 2404 million (USD 57.0 million) in agricultural loss (NDRRMC [24]).
Laguna province was one of the provinces severely affected by the Habagat flooding. It is located at the south end of Metro Manila, and alongside the Laguna Lake, the largest lake in the Philippines. The torrential monsoon rains caused extreme flooding of the lake, and the outflow submerged the rice fields on its banks.
2.2. Study Site
We studied the rice farmers in a village located in Laguna province, approximately 80 kilometers from Metro Manila. The proximity of the village to the International Rice Research Institute (IRRI) has enabled researchers to conduct many surveys in cooperation with IRRI. The earliest documented survey in the village dates to 1966, when a geographer, Hiromitsu Umehara, conducted a total enumeration survey of the village households. Subsequently, 18 rounds of household surveys were conducted between 1974 and 2007 (Sawada, et al. [25]), providing us with abundant available benchmark information on the village.
After the Habagat flooding, we visited the village, situated on the bank of the Laguna Lake, and found that the paddy fields were severely affected. During our visit, we interviewed government officials of Pila municipality, under which the village falls, and learned that 203.5 hectares out of the 367.5 hectares of the total village area were submerged. According to many farmers in the village, they had never experienced flooding of this magnitude from the lake.
2.3. Data
We employed three data sets for this study. The first was based on our survey conducted during February–March 2013. All of the farmers in the village were identified, using the information collected by the previous surveys, and the interviews were conducted with the village leader and other knowledgeable villagers for updates. We defined households that own agricultural land in the village as farmers, and found 122 rice cultivators. According to the interviews, no farmer had migrated out of the village because of the Habagat damage. After our visit, we developed a questionnaire and hired an ex-IRRI researcher as the survey leader, who worked with six enumerators to conduct the data collection interviews. Each interview took roughly a day, because we collected information on the Habagat damage and post-disaster aid, as well as on agricultural production, household composition, and household account, among others, so as to extend the panel data from the village. All 122 farmers were interviewed with the attrition rate of zero, which provides the subjective information for our analyses.
The second data set is from the satellite images taken before and after Habagat. Panel (a) of Figure 1 shows the land cover before Habagat. The lake is on the upper left, the rice fields are in blue, and the residential area located in the center is surrounded by the paddy fields. The black lines in the paddy fields indicate the land plot borders created by visually interpreting the satellite image taken by IKONOS (a commercial Earth observation satellite) on 23 May 2012. Panel (b) shows the land cover shortly after Habagat. Based on the image analysis of the satellite image taken on 11 August 2012, we drew the border of the submerged area in red in the figure, and used it as our objective damage indicator. Figure 1 illustrates that about half of the paddy fields, located close to the lake, were inside the border of submergence.
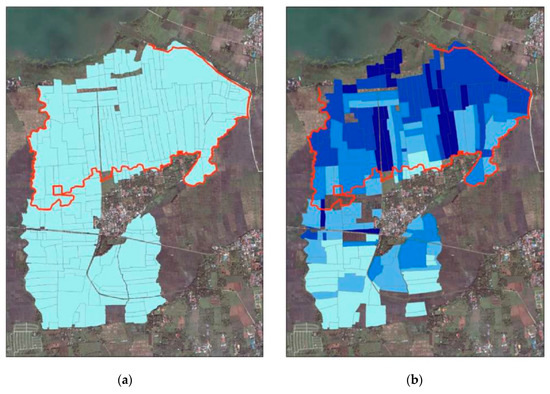
Figure 1.
Flooding border and self-reported water depth. (a) Before Habagat in the first panel; (b) After Habagat in the second panel. The data on the self-reported water depth are overlaid with five categories, namely: lightest blue (below ankle depth <10 cm), light blue (below knee depth < 40 cm), blue (below hip depth < 80 cm), dark blue (below chest depth < 120 cm), and darkest blue (above chest depth > 120 cm).
For comparison, we overlayed the plot-level subjective damage information on the satellite images in such a way that self-reported water depth before and after Habagat is presented in different hues of the color blue in Panels (a) and (b), respectively. Panel (b) shows that most farms inside the red line were subjectively reported to have been submerged after Habagat.
The third data set is from the administrative record of seed aid distribution, obtained from the municipal government office. Soon after Habagat, village-level politicians surveyed the rice fields in the village and made a list of the affected fields. This list was submitted to the municipal government, and the municipal government distributed one bag (30 kilograms) of seed aid for each hectare of affected paddy to all the farmers on the list. As the signature of each recipient farmer is on the list (see Figure 2), we believe that the administrative records are reliable source for objective data on aid receipt. These records also have information on farm area size and number of bags, showing that one bag was indeed provided for each hectare of damaged farms.
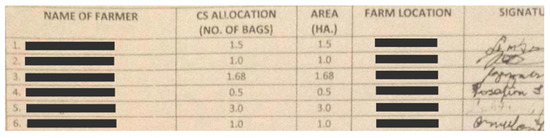
Figure 2.
An example of administrative record.
3. Descriptive Analyses
In this section, we report on the descriptive statistics of the damage caused by Habagat, as well as seed aid receipt. Then, we show the discrepancy between self-reported information and objective information, and show the correlation of damage and aid receipt.
3.1. Damage
Table 1 presents the descriptive statistics of the damage and the aid receipt. The satellite images show that the rice fields of 60% of the farmers were affected by the flooding. We categorized the farmers as affected if their agricultural land was located within the red line in image (b) of Figure 1. According to the self-reported information, a larger proportion of farmers (76%) reported their rice paddies as being affected. We discuss the issue of discrepancy below, but these data show that a large proportion of the sample farmers were affected by the 2012 Habagat. Since the incidence of flooding occurred in the period critical for rice growth, many farmers (42%) reported that their income had declined. Based on the self-reported information on the expected and actual quantity of rice harvested and the expected and actual rice price, we computed the value of the rice harvest loss. As the largest reported loss was PHP 1,449,250, the standard deviation (SD) was large compared with the mean. The median value of the reported loss of PHP 59,261 (USD 1404) was high, as it was equivalent to more than 200 man-days of earnings, considering the average daily wage for agricultural labor in this area in 2012 was about PHP 250.

Table 1.
Damage and aid receipt.
The Philippines is prone to typhoons—some of them severe. Usually, typhoons, accompanied by strong winds, cause damage to infrastructure, housing, and other productive assets, but in the case of the Habagat, only a few farmers reported house damage (2%) and asset loss (2%). In addition, the reported incidence of sickness or injury was limited (1%). Hence, our data show that the damage by Habagat was mostly caused by flooding, and was concentrated in agricultural land.
3.2. Disaster Aid
From the administrative records, we constructed a dummy variable that takes the value of 1 if a farmer received seed aid, and 0 otherwise. We found that 57% of farmers were recorded to have received seed aid. From the information collected from our survey, a smaller proportion of farmers (43%) reported to have received the seed aid. While administrative records were only available for seed aid, we collected self-reported information of the receipt of other forms of aid as well. The collected information includes fertilizer aid and lump-sum aid from each organization (i.e., local government, local non-governmental organizations (NGOs), church, and politicians). Of the farmers, 5% reported receiving fertilizer aid, while the average value of the aid received from local government amounted to PHP 1012, roughly equal to a four-day wage. The average aid amount, however, was much less than the reported loss of PHP 112,816, and, thus, Table 1 presents the severity of the Habagat damage.
3.3. Self-Reporting Bias
To analyze the discrepancy between the self-reported and objective information, Table 2 presents the data from two sources on damage (Panel A) and aid receipt (Panel B). Panel A shows that 96% of the farmers whose rice fields were affected, according to the satellite images, reported their paddy as submerged (row 1). Yet, of the 49 farmers whose fields were not submerged, according to the satellite images, 23 reported their rice fields as submerged (row 2). Although the correlation coefficient is positive and the p-value for the Pearson’s chi-squared test for a null hypothesis of no correlation is rejected (rows 4 and 5), the correlation coefficient is substantially smaller than the one that is observed when the self-reported information perfectly corresponds with the objective information. While we cannot judge whether such a discrepancy was because of intentional over-reporting or because of the existence of submergence that did not appear on the satellite images, the influence of the latter is more or less random. As we will discuss in Section 4.1, whether a field is located within the boundary of submergence is not correlated with observable characteristics of the farmers. Hence, to the extent that there was almost no under-reporting of flood damage (only 3 of 73), the flood damage was likely be over-reported.
Panel B shows that, of the 69 farmers shown on the record to have received seed aid, only 39 of them reported to have actually received it (row 1). These 39 farmers might intentionally have under-reported in the expectation of getting more aid from researchers, or they might have simply forgotten, because our survey was conducted about half a year after Habagat. In addition to the under-reported aid receipt, 13 out of the 53 farmers who were not on the recipient list reported having received it (row 2). They might have indirectly received seed aid from their relatives or neighbors, or they might have confused the seed aid with some other forms of aid, such as fertilizer aid. Owing to such reporting bias in both directions, the correlation coefficient of the objective information and the subjective information is 0.32, substantially less than 1 (row 4). From the 43% under-reports and the 25% over-reports, the general tendency is under-reporting of aid reception.
3.4. Accuracy of Targeting
Table 3 reports the correlations between flood damage and seed aid receipt. Panel A is based on the objective information—the satellite images and administrative record, and Panel B is based on the self-reported, subjective information collected in our survey. Panel A shows that 74% ((55+35)/122 farmers) of the sample farmers were properly targeted. Fourteen farmers were not affected but received aid, and 18 farmers were affected but did not receive aid, and, thus, the inclusion error rate is 11% (14/122 farmers) and the exclusion error rate is 15%. As targeting was correctly done for almost three-quarters of our sample, the accuracy of targeting is reasonably high, given that it was carried out during an emergency.
In Panel B, the correct targeting rate is 53% ((44+21)/122 farmers), the inclusion error rate is 7%, and the exclusion error rate is 40%. Owing to the low accuracy of targeting, the correlation coefficient is 0.17, much less than 0.46 in Panel A. Furthermore, we cannot reject the null hypothesis, that there is no correlation between the paddy submergence data and the seed aid data at the 5% significance level, as the p-value for Pearson’s chi-squared test is 0.061. The high exclusion error rate is consistent with our discussions in the previous sub-section, because over-reported damage and under-reported aid receipt increases the exclusion error rate. Hence, if we only rely on self-reported information, we would mistakenly conclude the accuracy of the targeting to be low.
4. Regression Analyses
In this section, we first present the farmers’ characteristics stratified by flood damage to test whether the Habagat damage is exogenous, and then we present the estimation results to discuss the accuracy of disaster aid targeting.
4.1. Sample Farmer Characteristics and Exogeneity Test
Table 4 shows a comparison of characteristics of the farmers by their paddy submergence status based on the satellite images. The survey was conducted half a year after Habagat, but we collected data to obtain pre-disaster information. As for household composition, for example, we collected information on the household members at the time of survey, the members who left after Habagat, and the members who joined after it. According to our survey data, 17 members had left and 21 had joined the household after (but not necessarily because of) Habagat.
Table 4.
Farmer characteristics and exogeneity Test.
The means and standard deviations of the affected farmers are presented in columns (1) and (2), the means and standard deviations of the unaffected farmers in columns (3) and (4), and the p-values of the t-tests (for the null hypothesis that the mean values are the same in the two groups) are reported in column (5). Most of the farmers are male, in their late 50s, secondary school graduates, and their average family size is four to five members (this includes children, adults, and the elderly in the household). Although the information is missing from six farmers, the average per capita weekly consumption before Habagat was PHP 1324 (USD 31.4) for the affected households, and PHP 1161 (USD 27.5) for the unaffected households. The corresponding values of food consumption (not reported in Table 4) were PHP 639 (USD 15.1) and PHP 702 (USD 16.6), and these values are not statistically different between the two groups. About 20% of the sample are migrant households, that is, the household head was not born in the village, and the average agricultural landholding size is about three hectares. As the p-values reported in column (5) are high for all of the variables, the Habagat damage can be considered exogenous in the sample village. We used these variables as control variables in the regression analyses below.
4.2. Regression Results
To formally analyze the accuracy of disaster aid targeting, we ran regressions with a dummy variable for seed aid receipt on the left-hand side, and a dummy variable for paddy submergence on the right-hand side. Table 5 shows the ordinary least squares (OLS) results (i.e., linear probability model) and Table 6 shows the probit results. In doing so, we compare two sets of damage and aid receipt information. In columns (1) and (2), we use the objective information, and in columns (3) and (4), we use subjective, self-reported information. In the odd-numbered columns, we report the benchmark results with no covariates, and in the even-numbered columns, we report the results with the control variables, that is, the farmer characteristics listed in Table 4.
Table 5.
Ordinary least squares (OLS) results.
Table 6.
Probit results.
In Table 5, the estimated coefficient of damage is 0.45–0.47 in columns (1) and (2), suggesting that the damage significantly increases the probability of receiving seed aid by 45 to 47 percentage points. These coefficients are statistically significant at the 1% level. If seed aid is perfectly targeted, the estimated coefficients become one. Although we reject the null hypothesis that the coefficient is equal to one (see the p-values reported at the bottom), the point estimate is reasonably high. The coefficients of some control variables are statistically significant, for instance, the per capita weekly consumption is positive and marginally significant. We could speculate that as rich farmers are more well-connected, they are more likely to receive aid, however a detailed discussion of the control variables is beyond the scope of this paper.
The coefficient reported in columns (3) and (4) is 0.19–0.20, which is much smaller in magnitude than those reported in columns (1) and (2). In addition, the coefficient estimated with control variables is only marginally significant in column (4). The R-squared and adjusted R-squared reported at the bottom are close to zero in columns (3) and (4), which means that whether a farmer reported to have received the seed aid is not explained by whether the same farmer reported damage from the flooding. These findings support our discussions in Section 3.4, that if we rely only on the self-reported information, the accuracy of disaster aid targeting is likely to be under-estimated, even after controlling for potential confounding factors.
According to Coady, Grosh, and Hoddinott [26], who had surveyed 85 anti-poverty programs in 36 countries, the average targeting accuracy was low, with only approximately 25% more resources getting transferred to the intended beneficiaries than the random allocations. Furthermore, 20 out of the 85 programs were found to be regressive, that is, more resources were transferred to non-beneficiaries. The programs under their study were targeted at poor households, and, hence, are not strictly comparable to the disaster aid program in our study, but our results suggest that the targeting accuracy could have been overstated in their survey. While the targeting accuracy based on the self-reported information is low and does not deviate from the surveyed 85 programs, the actual targeting accuracy based on the objective information is substantially higher.
Table 6 reports the marginal effects evaluated at the means, using probit regressions. Column (1) shows that the farmers whose rice paddies were affected were 47 points more likely to have received seed aid. The point estimate is similar to the OLS results. Column (3) shows that the farmers with reported damage were 20 points more likely to report to have received the aid. The estimated coefficient with control variables reported in columns (2) and (4) is also similar to the OLS estimates. Hence, our results are robust to a different estimation model (without and with the control variables) and method (liner probability model and probit model).
5. Conclusions
We studied the 2012 Habagat flooding, where rice farmers were affected by a sudden, exogenous shock, as a natural experiment, by constructing our original data sets with three different sources of information. We found that disaster damage was over-reported and aid receipt was under-reported, and, hence, there was a discrepancy in the objective information and the self-reported information. If only the subjective, self-reported information was used, then the accuracy of targeting was substantially under-estimated, erroneously over-emphasizing the difficulty in disaster aid targeting.
As the majority of farmers were severely affected, Habagat can be considered a covariate shock to the village. Although within-village risk sharing mechanisms might work to some extent (which is outside the scope of this paper), external supports are indispensable for such a large covariate shock. We found that the actual targeting was fairly well-executed, but the null hypothesis of perfect targeting was rejected, and, hence, there is room for improving the accuracy of disaster aid targeting.
Our findings highlight the importance of using objective information when researchers analyze damage and aid data for disasters and policy makers implement targeting programs. As subjective information is biased, the use of objective information can improve the accuracy of targeting. With the increased availability of objective data, including remote sensing data, biometric data, and IoT (Internet of things), the effective use of such data could help governments design more effective post-disaster policies. This is in line with the recent study of Muralidharan, Niehaus, and Sukhtankar [27], who demonstrated that the introduction of a biometrically authenticated card for workfare programs results in a faster and less corrupt payment process. Hence, the introduction of such biometric smart cards or the improved use of (real-time) remote sensing information to identify disaster victims can lead to quicker aid disbursement with improved targeting precision.
Author Contributions
Y.H. is listed first as the lead author who undertook the main analyses, followed by the alphabetical listing of the other four authors. N.F. and K.K. conducted the survey and collected the administrative data, T.S. collected and analyzed the satellite images, and Y.S. conceptualized and directed this research project. Each author made substantial contributions in writing, reviewing, and editing the manuscript.
Funding
This research is funded by the Economic Research Institute for ASEAN and East Asia (ERIA), the Japan Society for the Promotion of Science (JSPS) KAKENHI [17H01653, 15H06540, and 22223003], and Grant-in-Aid for Research in Nagoya City University.
Acknowledgments
We would like to thank Booyuel Kim, Hitoshi Shigeoka, Yasuharu Shimamura, and Masahiro Shoji for their valuable suggestions, and three anonymous referees for their constructive comments. We would also like to thank Raphael Aramil, Fe Gascon, Esther Marciano, and Yoko Sakai for their hard work in data collection, and Mizumo Ito for her excellent research assistance. Lastly, we would like to thank Editage (www.editage.jp) for English language editing.
Conflicts of Interest
The authors declare no conflict of interest.
References
- CRED (Centre for Research on the Epidemiology of Disasters). Natural Disasters 2017; CRED: Brussels, Belgium, 2018; Available online: https://cred.be/sites/default/files/adsr_2017.pdf (accessed on 20 December 2018).
- Kahn, M.E. The death toll from natural disasters: The role of income, geography, and institutions. Rev. Econ. Stat. 2005, 87, 271–284. [Google Scholar] [CrossRef]
- Noy, I.; Yonson, R. Economic Vulnerability and Resilience to Natural hazards: A survey of concepts and measurements. Sustainability 2018, 10, 2850. [Google Scholar] [CrossRef]
- Aldrich, D.P.; Sawada, Y.; Oum, S. Resilience and Recovery in Asian Disasters; Springer: Tokyo, Japan, 2015. [Google Scholar]
- Morris, S.; Neidecker-Gonzales, O.; Carletto, C.; Munguia, M.; Wodon, Q. Hurricane Mitch and the livelihood of the rural poor in Honduras. World Dev. 2002, 30, 49–60. [Google Scholar] [CrossRef]
- Shoji, M. Religious fractionalisation and crimes in disaster-affected communities: Survey evidence from Bangladesh. J. Dev. Stud. 2018, 54, 1891–1911. [Google Scholar] [CrossRef]
- Strömberg, D. Natural disasters, economic development, and humanitarian aid. J. Econ. Perspect. 2007, 21, 199–222. [Google Scholar] [CrossRef]
- Abdulai, A.; Barrett, C.B.; Hoddinott, J. Does food aid really have disincentive effects? New evidence from sub-Saharan Africa. World Dev. 2005, 33, 1689–1704. [Google Scholar] [CrossRef]
- Galasso, E.; Ravallion, M. Decentralized targeting of an antipoverty program. J. Public Econ. 2005, 89, 705–727. [Google Scholar] [CrossRef]
- Jayne, T.S.; Strauss, J.; Yamano, T.; Molla, D. Targeting of food aid in rural Ethiopia: Chronic need or inertia? J. Dev. Econ. 2002, 68, 247–288. [Google Scholar] [CrossRef]
- Alatas, V.; Banerjee, A.; Hanna, R.; Olken, B.A.; Tobias, J. Targeting the poor: Evidence from a field experiment in Indonesia. Am. Econ. Rev. 2012, 102, 1206–1240. [Google Scholar] [CrossRef] [PubMed]
- Alderman, H. Do local officials know something we don’t? Decentralization of targeted transfers in Albania. J. Public Econ. 2002, 83, 375–404. [Google Scholar] [CrossRef]
- Bardhan, P.; Mookherjee, D. Pro-poor targeting and accountability of local governments in West Bengal. J. Dev. Econ. 2006, 79, 303–327. [Google Scholar] [CrossRef]
- Hanna, R.; Olken, B.A. Universal basic incomes versus targeted transfers: Anti-poverty programs in developing countries. J. Econ. Perspect. 2018, 32, 201–226. [Google Scholar] [CrossRef]
- Amin, S.; Goldstein, M. Data Against Natural Disasters: Establishing Effective Systems for Relief, Recovery, and Reconstruction; The World Bank: Washington, DC, USA, 2008. [Google Scholar]
- Morris, S.; Wodon, Q. The allocation of natural disaster relief funds: Hurricane Mitch in Honduras. World Dev. 2003, 31, 1279–1289. [Google Scholar] [CrossRef]
- Takasaki, Y. Targeting cyclone relief within the village: Kinship, sharing, and capture. Econ. Dev. Cult. Chang. 2011, 59, 387–416. [Google Scholar] [CrossRef]
- Bound, J.; Brown, C.; Mathiowetz, N. Measurement error in survey data. In Handbook of Econometrics; Heckman, J., Leamer, E., Eds.; Elsevier: Amsterdam, The Netherlands, 2001; Volume 5, pp. 3705–3843. [Google Scholar]
- Gibson, J.; Kim, B. Measurement error in recall surveys and the relationship between household size and food demand. Am. J. Agric. Econ. 2007, 89, 473–489. [Google Scholar] [CrossRef]
- Kennickell, A.; Starr-McCluer, M. Retrospective reporting of household wealth: Evidence from the 1983–1989 survey of consumer finances. J. Bus. Stat. Econ. Stat. 1997, 15, 452–463. [Google Scholar]
- Heltberg, R.; Oviedo, A.M.; Talukdar, F. What do household surveys really tell us about risk, shocks, and risk management in the developing world? J. Dev. Stud. 2015, 51, 209–225. [Google Scholar]
- Dell, M.; Jones, B.F.; Olken, B.A. What do we learn from the weather? The new climate-economy literature. J. Econ. Lit. 2014, 52, 740–798. [Google Scholar] [CrossRef]
- Sawada, Y.; Kuroishi, Y. How does a natural disaster affect people’s preference? The case of a large scale flood in the Philippines using the convex time budget experiments. In Disaster, Risks, Social Preferences, and Policy Effects: Field Experiments in Selected ASEAN and East Asian Countries; Sawada, Y., Oum, S., Eds.; Economic Research Institute for ASEAN and East Asia (ERIA): Jakarta, Indonesia, 2015. [Google Scholar]
- NDRRMC (National Disaster Risk Reduction and Management Council). Update: SitRep No. 20: Re Effects of South-west Monsoon Enhanced by Typhoon Haikui; NDRRMC: Manila, Philippines, 2012. Available online: http://ndrrmc.gov.ph/2-uncategorised/2051-effects-of-southwest-monsoon-enhanced-by-tropical-storm-haikui (accessed on 20 December 2018).
- Sawada, Y.; Higuchi, Y.; Kajisa, K.; Fuwa, N.; Marciano, E.B.; Estudillo, J.P. The East Laguna Village: Four decades of studies in a Filipino village. In PRIMCED Discussion Paper Series No. 18; Hitotsubashi University: Tokyo, Japan, 2012. [Google Scholar]
- Coady, D.; Grosh, M.; Hoddinott, J. Targeting of Transfers in Developing Countries: Review of Lessons and Experience; The World Bank: Washington, DC, USA, 2004. [Google Scholar]
- Muralidharan, K.; Niehaus, P.; Sukhtankar, S. Building state capacity: Evidence from biometric smartcards in India. Am. Econ. Rev. 2016, 106, 2895–2929. [Google Scholar] [CrossRef]
© 2019 by the authors. Licensee MDPI, Basel, Switzerland. This article is an open access article distributed under the terms and conditions of the Creative Commons Attribution (CC BY) license (http://creativecommons.org/licenses/by/4.0/).