Article

Impacts of Climate on Spatiotemporal Variations in Vegetation NDVI from 1982–2015 in Inner Mongolia, China

1
School of Water Conservancy and Hydroelectric Power, Hebei University of Engineering, Handan 056038, China
2
School of Earth Science and Engineering, Hebei University of Engineering, Handan 056038, China
3
School of Mining and Geomatics Engineering, Hebei University of Engineering, Handan 056038, China
*
Authors to whom correspondence should be addressed.
Sustainability 2019, 11(3), 768; https://doi.org/10.3390/su11030768
Submission received: 15 December 2018 / Revised: 18 January 2019 / Accepted: 28 January 2019 / Published: 1 February 2019
(This article belongs to the Special Issue Data Analytics on Sustainable, Resilient and Just Communities)

Abstract

:
By using the Global Inventory Modeling and Mapping Studies (GIMMS) third-generation normalized difference vegetation index (NDVI3g) data, this paper explores the spatiotemporal variations in vegetation and their relationship with temperature and precipitation between 1982 and 2015 in the Inner Mongolia region of China. Based on yearly scale data, the vegetation changes in Inner Mongolia have experienced three stages from 1982 to 2015: the vegetation activity kept a continuous improvement from 1982–1999, then downward between 1999–2009, and upward from 2009 to 2015. On the whole, the general trend is increasing. Several areas even witnessed significant vegetation increases: in the east and south of Tongliao and Chifeng, north of Xing’anmeng, north and west of Hulunbir, and in the west of Inner Mongolia. Based on monthly scale data, one-year and half-year cycles exist in normalized difference vegetation index (NDVI) and temperature but only a one-year cycle in precipitation. Finally, based on the one-year cycle, the relationship between NDVI and climatic were studied; NDVI has a significant positive correlation with temperature and precipitation, and temperature has a greater effect in promoting vegetation growth than precipitation. Moreover, based on a half-year changing period, NDVI is only affected by temperature in the study region. Those findings can serve as a critical reference for grassland managers or policy makers to make informed decisions on grassland management.

1. Introduction

Vegetation is one of the most critical elements of terrestrial ecosystems and plays an important role in material cycling and energy flow [1,2,3,4]. Spatiotemporal variations in vegetation growth can affect the terrestrial carbon cycle and other biochemical processes [5], thus explaining why the study of its dynamics is an emerging issue in the field of environmental analysis. Vegetation changes are constantly affected by differences in factors such as precipitation, temperature, and human activities [6,7].
Vegetation change dynamics are important indicators for assessing these eco-environmental changes. Long-time series data of vegetation cover are often used to detect the dynamic vegetation changes and extract change characteristics and patterns [8,9,10]. Vegetation indices, such as the normalized difference vegetation index (NDVI), are important characteristic parameters for revealing surface vegetation features [11]. Some prior research results confirm that changes in NDVI time series could indicate variations in vegetation conditions proportionally to the absorption of radiation used for photosynthesis [12]. The NDVI is also very sensitive to the physical characteristics of vegetation: sensor observation angles, solar radiation, and different soil backgrounds [13,14]. Several vegetation properties, such as the length of the growing season, onset date of greenness, and date of maximum photosynthetic activity, can be derived from the NDVI time series to monitor vegetation changes [15,16,17,18].
Remote sensing techniques have provided unique insights to global environmental change research during the past thirty years [19]. Remote sensing data products have become important and very useful data sources in monitoring the changes in global vegetation coverage. These data have significantly improved our understanding of intra-annual and interannual variations in vegetation from a regional to global scale in the past three decades [20,21,22,23]. NDVI imagery data in particular, which are acquired by different remote sensors, are the most widely used data in many research fields, such as vegetation dynamic monitoring, ecological environment evaluation, spatial distribution and pattern analysis, and dynamic evolution [8].
The Inner Mongolia grassland is the third largest in the world and supports the world’s largest population of sheep and goats as well as the fourth largest population of cattle [21]. At present, it is considered an important timber and livestock region in China. The main portion of Inner Mongolia is characterized by a typical continental climate with infrequent precipitation and frequent drought and with windy episodes during winter and spring. The primary vegetation includes grass, trees, shrubs, and cropland. In the past few decades, it has experienced dramatic climate change, which has been more pronounced there than in most other areas in China [7,24,25,26,27]. For this reason, many remote sensing data archives have been processed to examine various aspects of the vegetation cover change dynamics [28,29,30,31], such as habitat maps [32], the degradation of grassland [33,34], phenology patterns [21], and the driving forces of vegetation changes [35,36,37]. For instance, time series Moderate Resolution Imaging Spectroradiometer (MODIS) NDVI datasets from 2000–2008 and statistical methods were used to investigate the changes in spatiotemporal characteristics of the entire Inner Mongolia area [11]. National Oceanic and Atmospheric Administration (NOAA) data were used to analyze the changes in the regularity of the spatiotemporal variations from 1982–1999, and SPOT4 VGT data were used to assess the influence of climate trends, land cover changes, and so on [38].
Most researchers agree that climate change is one of the main drivers of the interannual variation in vegetation activity. Studying the correlation between the NDVI and climate factors could aid in finding the key factors that control the changes in the terrestrial ecosystem carbon cycle and shed light on the mechanisms controlling the response of terrestrial carbon storage to climate variability [39]. Many analyses have explored the relationship between the NDVI and climate factors in different geographic areas and ecosystems. For example, many studies have used the NDVI to monitor the vegetation response to climatic fluctuations in regional zones such as China [40], US [41] and Northern Patagonia [42] and at a global scale [43]. However, the mechanisms behind the relationship between the vegetation and climate change are far from clear [43]. Most previous studies have related the NDVI with climate factors during the growing season or over time. Few studies have considered different time periods for different climate factors like precipitation and temperature, which impacts the response of the NDVI.
Previous studies have suggested that the vegetation activity in most regions has a close relationship with the climate factors, but the connection between climate change and vegetation growth in the Inner Mongolian grasslands has not been adequately quantified, especially with respect to how the climate factors change in different time periods. Furthermore, no effort has been made to investigate the effects of climate change on the relationship between vegetation growth and climate variables and its spatial patterns.
This paper has three objectives. The first is to analyze the vegetation change from 1982 to 2015 and its spatiotemporal distribution. The second is to examine the correlation between the NDVI and climate factors, taking into account the factor’s features in a specific time period. The last objective is to determine the factor with the most impact on vegetation growth. We hope that those findings can serve as a critical reference for grassland managers or policy makers to make informed decisions on grassland management.

2. Materials and Methods
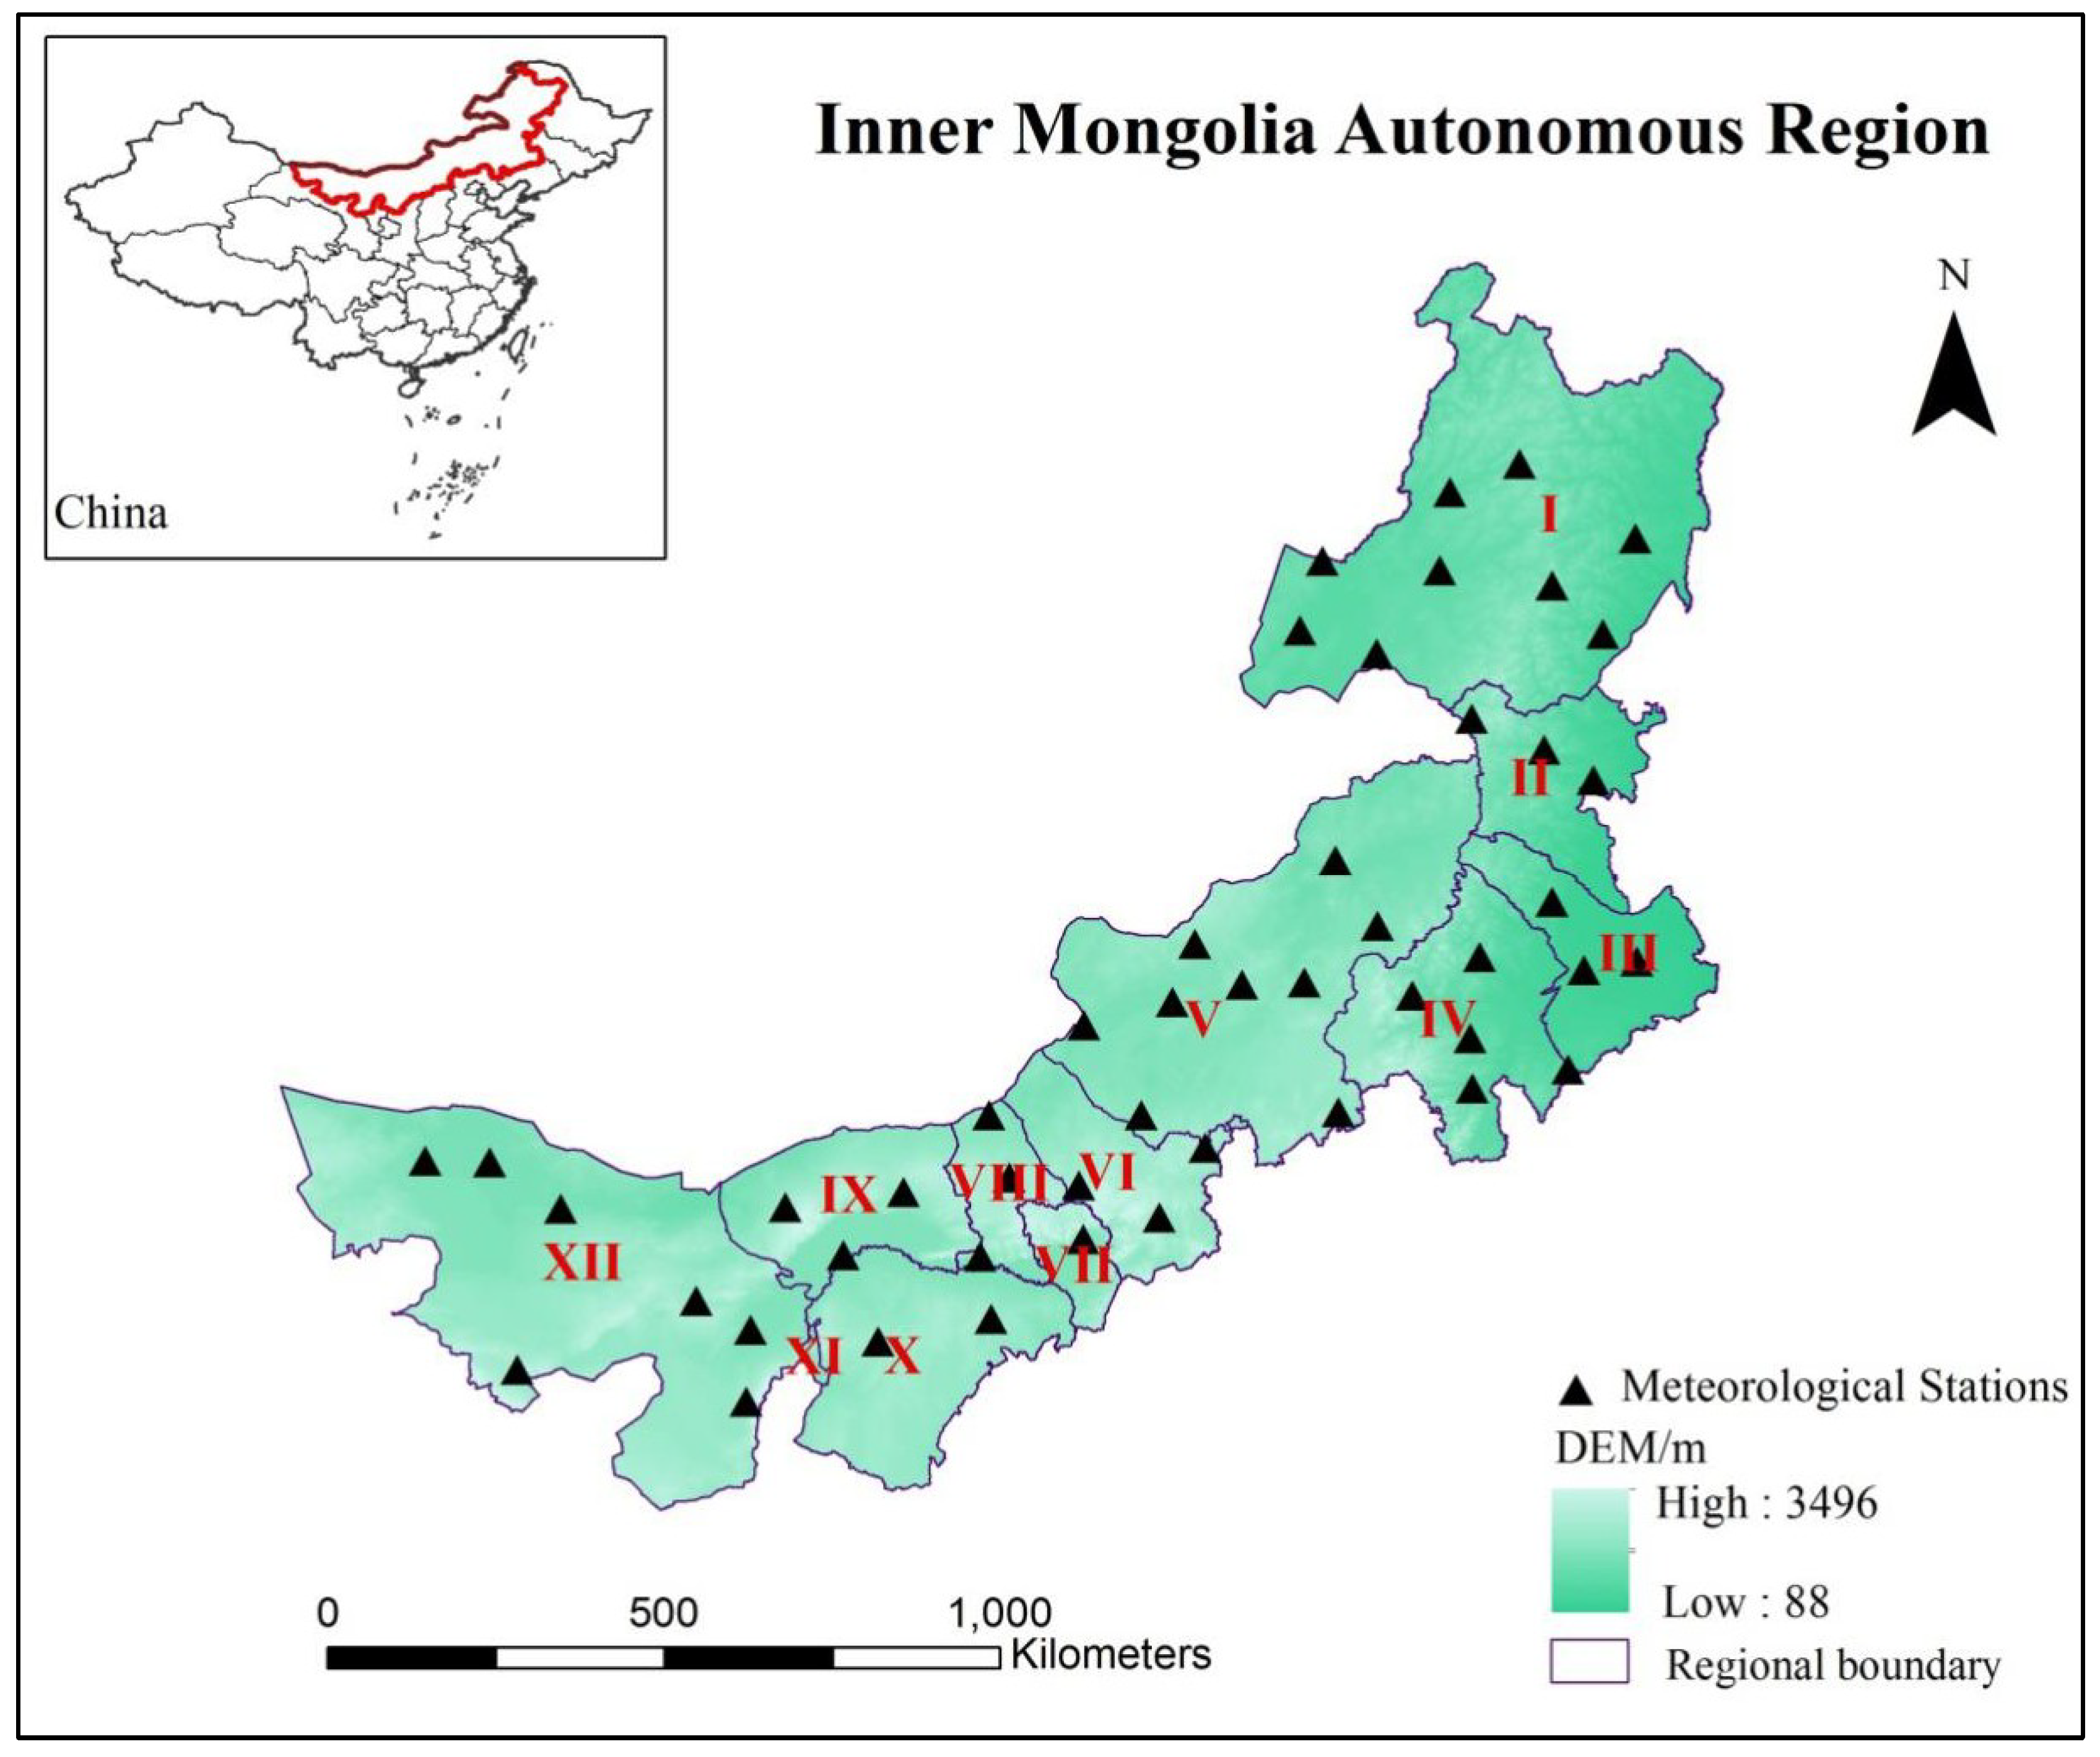
2.1. Study Area

The Inner Mongolia Autonomous Region (37°01’N to 53°02’N and 95°02’E to 123°37’E) is located in the northern border region of China (Figure 1). The Inner Mongolia grassland is the largest grassland pastoral area in China, located in the middle of the Eurasian grassland belt, which is the transition zone between the northwestern arid zone, the northeastern humid zone, and the dry farming region in North China [44]. The area consists predominantly of plains, with the elevation ranging from 532 to 1725 m, and the total area is approximately 1183000 km2. The plateau has a decreasing west-to-east gradient and is geomorphologic ally composed of mountains in the east, low rolling hills in the centre, and high plains in the west. Following this gradient, the soil types change from chernozems to calcic kastanozems and brown calcic kastanozems [45]. It belongs to a typical semi-arid temperate grassland ecosystem in the middle latitudes with annual precipitation amounts of 100–450 mm, which decreases from east to west, and annual mean temperatures of 0–8 °C, which increases from east to west. The Inner Mongolia Plateau is notable for its vegetation diversity, which includes forest, steppe, desert, and wetlands [21].

2.2. Datasets

2.2.1. GIMMS NDVI Version 3

GIMMS NDVI3g [46] is the latest version of the Global Inventory Modeling and Mapping Studies from NOAA/Advanced very high-resolution radiometer (https://ecocast.arc.nasa.gov/data/pub/gimms/3g.v1/), and it provides the NDVI time series data used in this paper. Its spatial resolution is 8 km, and its temporal resolution is 15 days (from July 1981 to December 2015). This dataset is a revised and updated extension of a previous version of the NDVI [47].
In this paper, we selected GIMMS NDVI3g data from 1982–2015 between April and October, using the Maximum Value Composite method to reduce the cloud and aerosol contamination; this resulted in 238 NDVI monthly datasets for our study area. After this, we calculated the sum of the monthly NDVI values from April to October in order to derive an annual scale NDVI dataset. In addition, we used the Fast Fourier Transform (FFT) and Complete Ensemble Empirical Mode Decomposition with Adaptive Noise (CEEMDAN) methods to extract the periodicity and trend of the NDVI data and combined them with the trend line analysis method and the Hurst index method to study and analyze the changes in the vegetation NDVI in the study area from 1982–2015.

2.2.2. Meteorological Datasets

Monthly meteorological datasets were obtained from the National Meteorological Data Sharing Service Platform (http://data.cma.cn/), including monthly mean temperature and precipitation data between 1982–2015 (April–October) for 47 meteorological stations in Inner Mongolia (Figure 1). In order for these data to match the NDVI data (i.e., at a spatial resolution of 8 km) we employed the Kriging interpolation method within the ARCGIS software; this resulted in temperature and precipitation datasets for the entire study region. The annual precipitation is the cumulative monthly precipitation value from April to October, and the annual temperature is the average value of the monthly temperatures. By using these data and utilizing the FFT and CEEMDAN methods, we were then able to extract their periodicity information and resulting trends. This, therefore, enabled us to investigate the response of the grassland vegetation to climatic factors in the study area from 1982–2015.

2.3. Methods

2.3.1. Fast Fourier Transformation

A Discrete Fourier Transform (DFT) can transform the time signal to the frequency domain, a form in which the Fourier transform is discrete in both the time and frequency domains. FFT, a quick and effective algorithm to achieve DFT and to reduce its calculation time, was proposed by Cooley and Tukey in 1965 [48]; at present, the Radix-2 FFT Algorithm and Split Radix FFT algorithm are used most often [49,50,51]. We chose the Radix-2 FFT Algorithm in this paper, and the details of this algorithm can be found in Reference [51].

2.3.2. Complete Ensemble Empirical Mode Decomposition with Adaptive Noise

CEEMDAN is based on the Empirical Mode Decomposition (EMD) method [52]. EMD is an algorithm that decomposes complex signals into a number of Intrinsic Mode Functions (IMFs) that represent different time scales of the original signal [53]. As a time domain signal analysis technique, it is not the same as the Fourier method and the discrete wavelet transform described earlier. EMD can be adapted for analyzing nonlinear and nonstationary data sets and has been broadly applied in many fields in recent years.
The principle of EMD is to decompose the signal into a group of similar Sinusoidal signals; trend signal functions, which are defined by the signal itself and named the intrinsic mode functions (IMFs); and a residue [54]. In the process of decomposing the original signal, the original time scale is gradually decreasing. In other words, the time scale in the first IMF is coarser than the original. As a result, as the order of the IMFs increases, their corresponding frequencies gradually decrease, and the residual component has the lowest frequency. EMD of one-dimensional signal x can be expressed as [55]:
x = i = 1 n c i + r k
where c is the IMF and r is a monotonic residual function.
The IMFs of CEEMDAN are denoted by I M F 1 ˜ . We define E j ( ) as the j t h modal operator generated by EMD. ω i ( n ) (i = 1, 2, ..., I) is the different realizations of white Gaussian noise with zero mean and unit variance, and ε 0 is the standard deviation of the white Gaussian noise. The CEEMDAN algorithm is described as follows [48]:
  • Calculate x ( n ) + ε 0 ω i ( n ) ;
  • Decompose the signals to obtain the first modes by EMD, calculating the first mode function I M F 1 ˜ by CEEMDAN as I M F 1 ˜ ( n ) :
    I M F 1 ˜ ( n ) = 1 I i = 1 I I M F 1 i ( n ) = I M F 1 ¯ ( n ) ;
  • Calculate the first residual as r 1 ( n ) :
    r 1 ( n ) = x ( n ) I M F 1 ˜ ( n )   ;
  • Decompose realizations r 1 ( n ) + ε 1 E 1 ( ω i ( n ) ) (i = 1, 2, ..., I) to the first EMD mode, where ε 1 is the standard deviation of the white Gaussian noise for the first stage, and the second mode is I M F 2 ˜ ( n ) :
    I M F 2 ˜ ( n ) = 1 I i = 1 I E 1 ( r 1 ( n ) + ε 1 E 1 ( ω i ( n ) ) ;
  • Compute the k t h residual (k = 2, 3, ..., K) as the r k ( n ) :
    r k ( n ) = r k 1 ( n ) I M F k ˜ ( n )   ;
  • According to formula (4), the ( k + 1 ) t h mode is I M F k + 1 ˜ ( n ) , and ε k is the standard deviation of the white Gaussian noise for the k t h stage with k = 1, 2, ..., K:
    I M F k + 1 ˜ ( n ) = 1 I i = 1 I E 1 ( r k ( n ) + ε k E k ( ω i ( n ) ) ) ;
  • Repeat Equations (5),(6) until the obtained residual is a monotonic function that cannot be further decomposed by EMD. If k is the total number of modes and r k ( n ) is the final residual, the target signal will be described as follows:
    x ( n ) = k = 1 K I M F k ˜ ( n ) + r k ( n )   .

2.3.3. Trend Line Analysis

The trend line analysis method can extract different characteristics of the vegetation changes in different periods, and it was used to find the NDVI trend for each pixel [56]. The process is described as follows:
θ s l o p = n i = 1 n i N D V I i i = 1 n i i = 1 n N D V I i n i = 1 n i 2 ( i = 1 n i ) 2 ,
where n refers to the cumulative years, N D V I i refers to the average yearly value, and θ s l o p is the slope of the trend line. θ s l o p > 0 indicates that the vegetation has a positive growth. Otherwise, it has a negative growth.

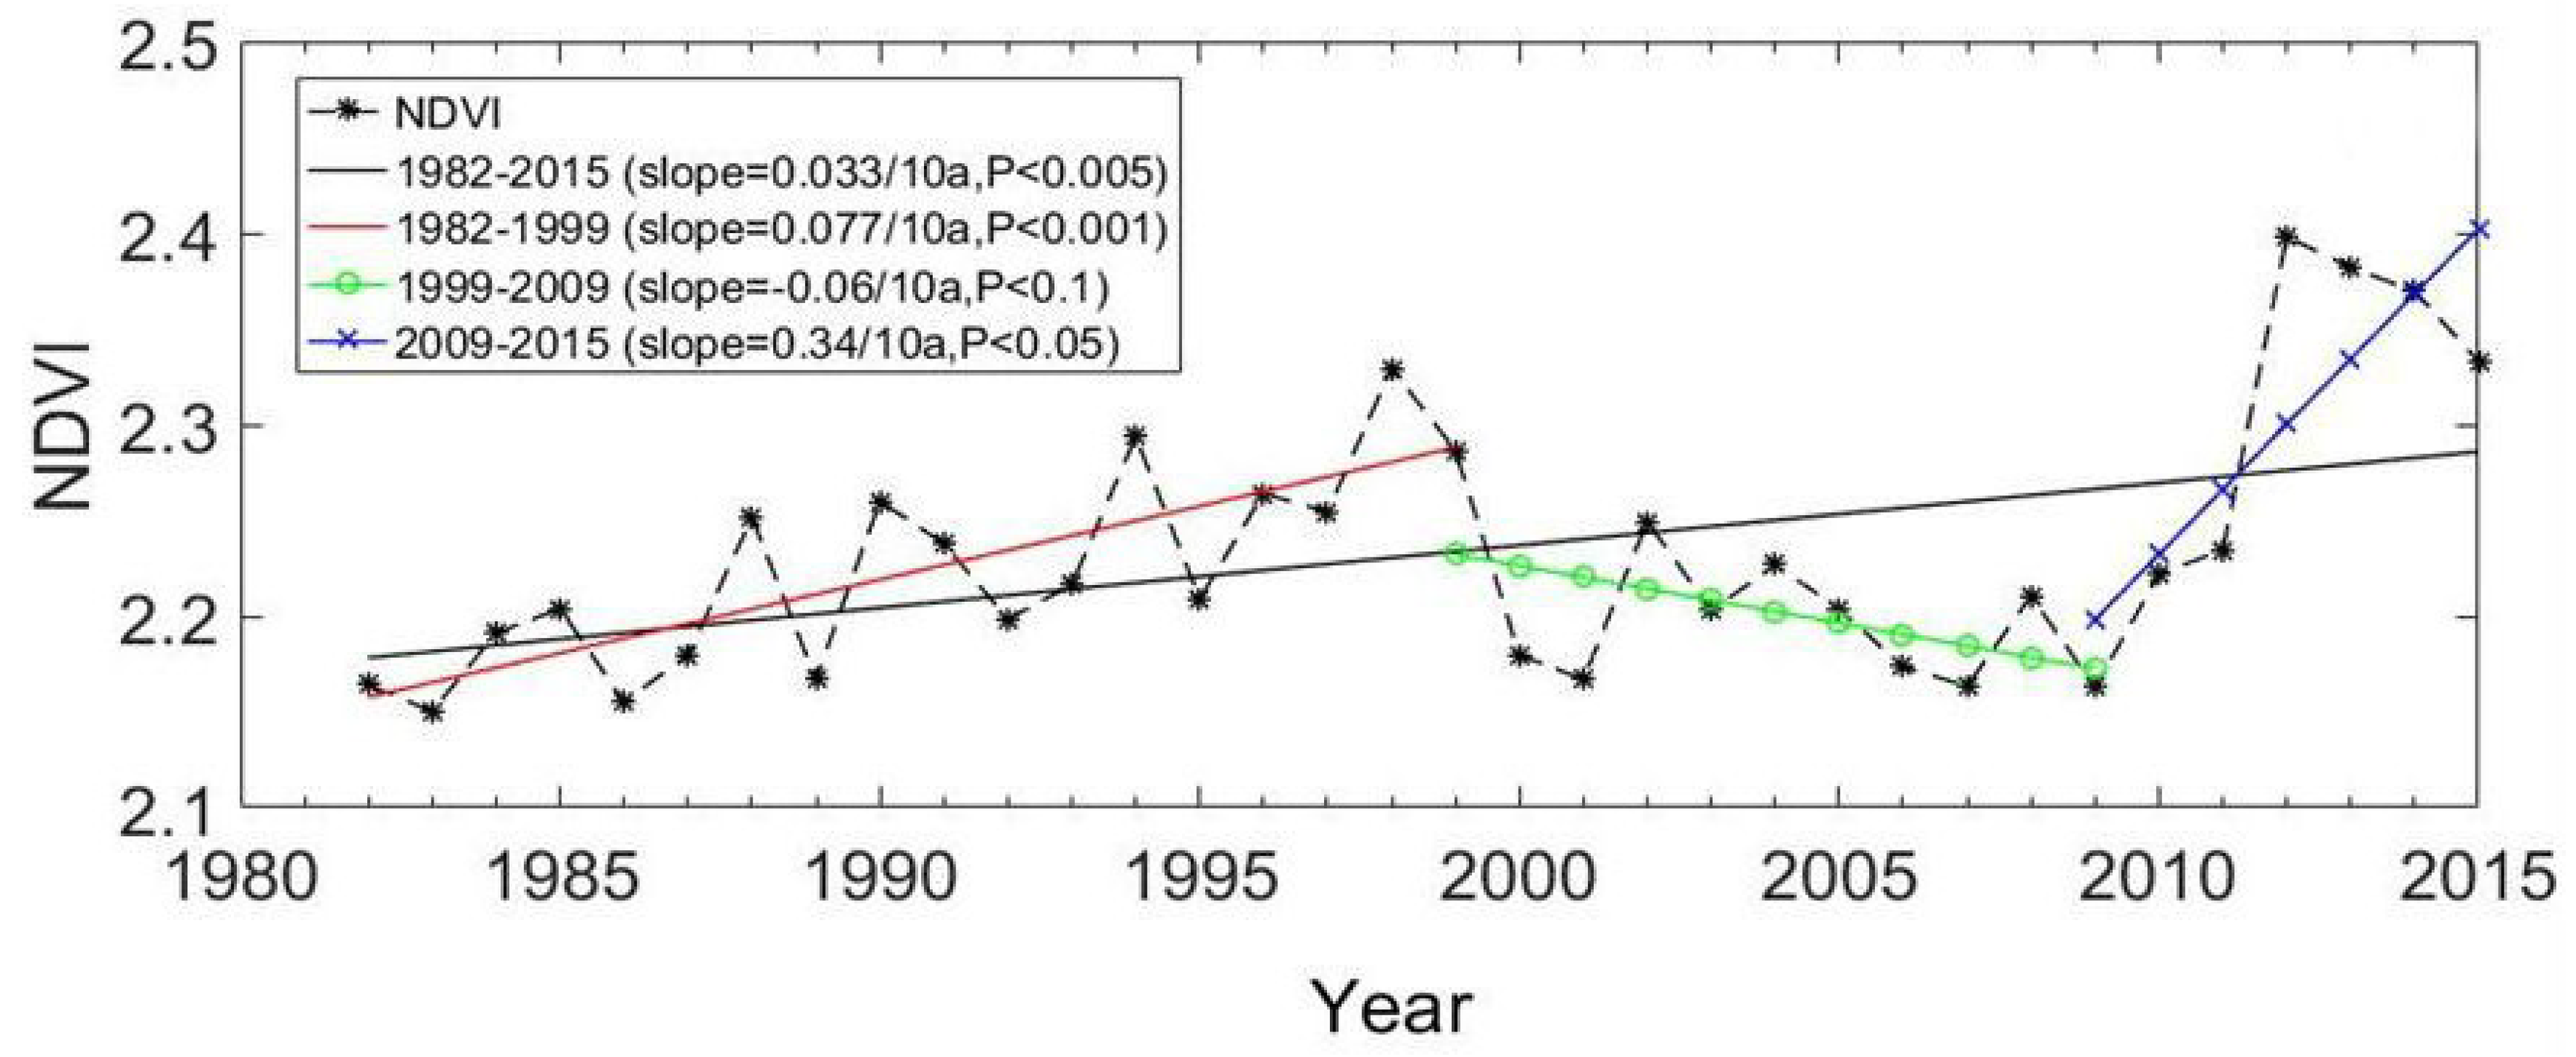
2.3.4. Piecewise Linear Regression Analysis

In mathematics, a piecewise linear function is a real-value function defined on real numbers, or a segment thereof, which the of graph is composed of straight-line sections [57]. The piecewise linear regression model analysis method is very useful in extracting the turning points of long-term sequence data changes, and it can truly reflect the changing trend in the vegetation NDVI. It has been widely used in vegetation and climate change analyses [58,59]:
y = { β 0 + β 1 + ε t β 0 + β 1 t + β 2 ( t ) + ε t > ,
where y refers to the vegetation NDVI value of a study area, t refers to the year (1982–2015), is the turning point of the time series, β 0 is the intercept, β 1 and β 1 + β 2 are the slopes before and after the turning point of the time series, respectively, and ε is the residual.

2.3.5. Hurst Index (R/S)

The Hurst exponent was proposed by Hurst (1951); it is an effective method for detecting the long-term dependence of time series, and it has been widely used in studies related to hydrology, climatology, geology, and seismology [60]. The basic principle of this exponent is described as follows:
To divide the time series { N D V I ( τ ) }   ( τ = 1 , 2 , , n ) into τ subseries X ( t ) , for each series, t = 1 , 2 , , τ :
  • Define the sequence of the time series,
    N D V I ( τ ) ¯ = 1 τ t = 1 τ N D V I ( t ) ( τ = 1 , 2 , , n )
  • Calculate the accumulated deviation,
    X ( t , τ ) = t = 1 τ ( N D V I ( t ) N D V I ( τ ) ¯ ) ( 1 t τ )
  • Create the range sequence,
    R ( τ ) = max 1 t τ X ( t , τ ) min 1 t τ X ( t , τ )   ( τ = 1 , 2 , , n )
  • Create the standard deviation sequence,
    S ( τ ) = 1 τ t = 1 τ ( N D V I ( t ) N D V I ( τ ) ¯ 2 ) ( τ = 1 , 2 , , n )
  • Acquire the Hurst exponent,
    R ( τ ) S ( τ ) = ( c τ ) H
The value of H can be obtained by applying the least squares method to fit the equation log ( R / S ) n = a + H log ( n ) , where H is the Hurst exponent.
According to previous studies [60,61], the value of the Hurst exponent ranges from 0–1. When the value is equal to 0.5, it means that the time series is an independent stochastic process without consistency; when the value is greater than 0.5, the time series is a consistent series having a positive autocorrelation, which indicates that the NDVI time series will show the same change trend in the future; and when the value is less than 0.5, it denotes that the time series is an anti-consistent series having a negative autocorrelation, which shows that the NDVI time series will present opposite characteristics in the future.

3. Result and Discussion

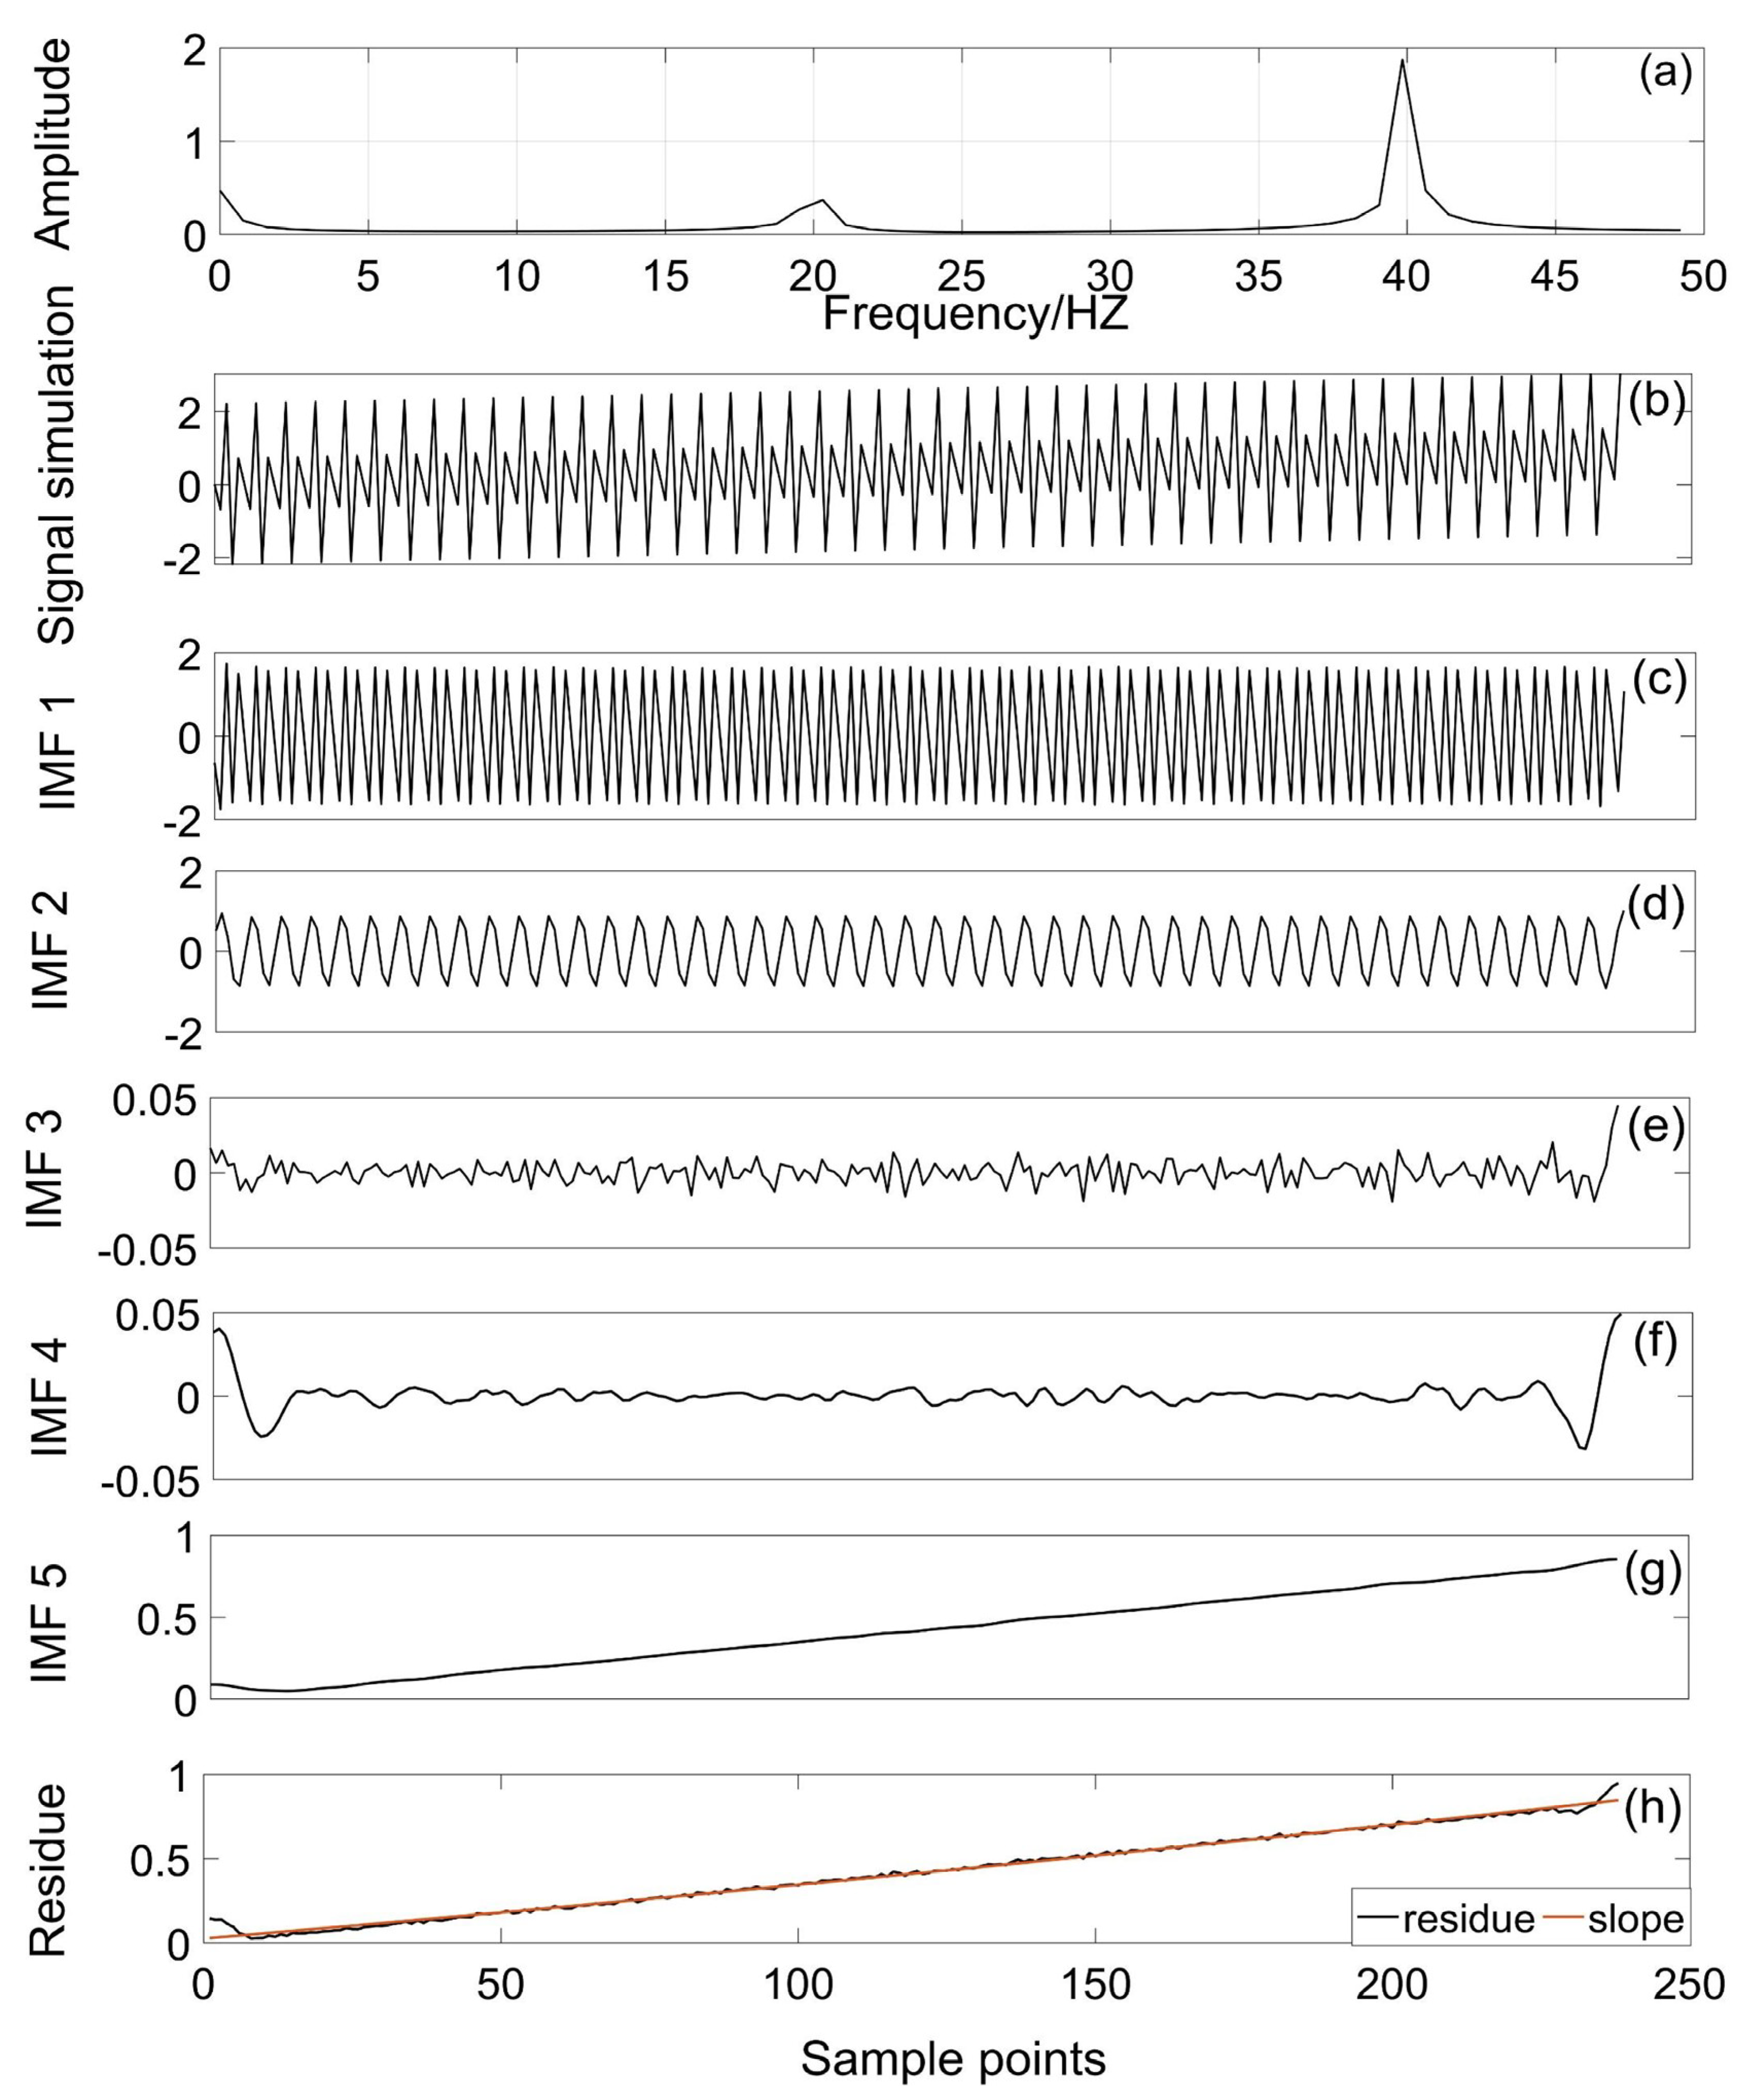
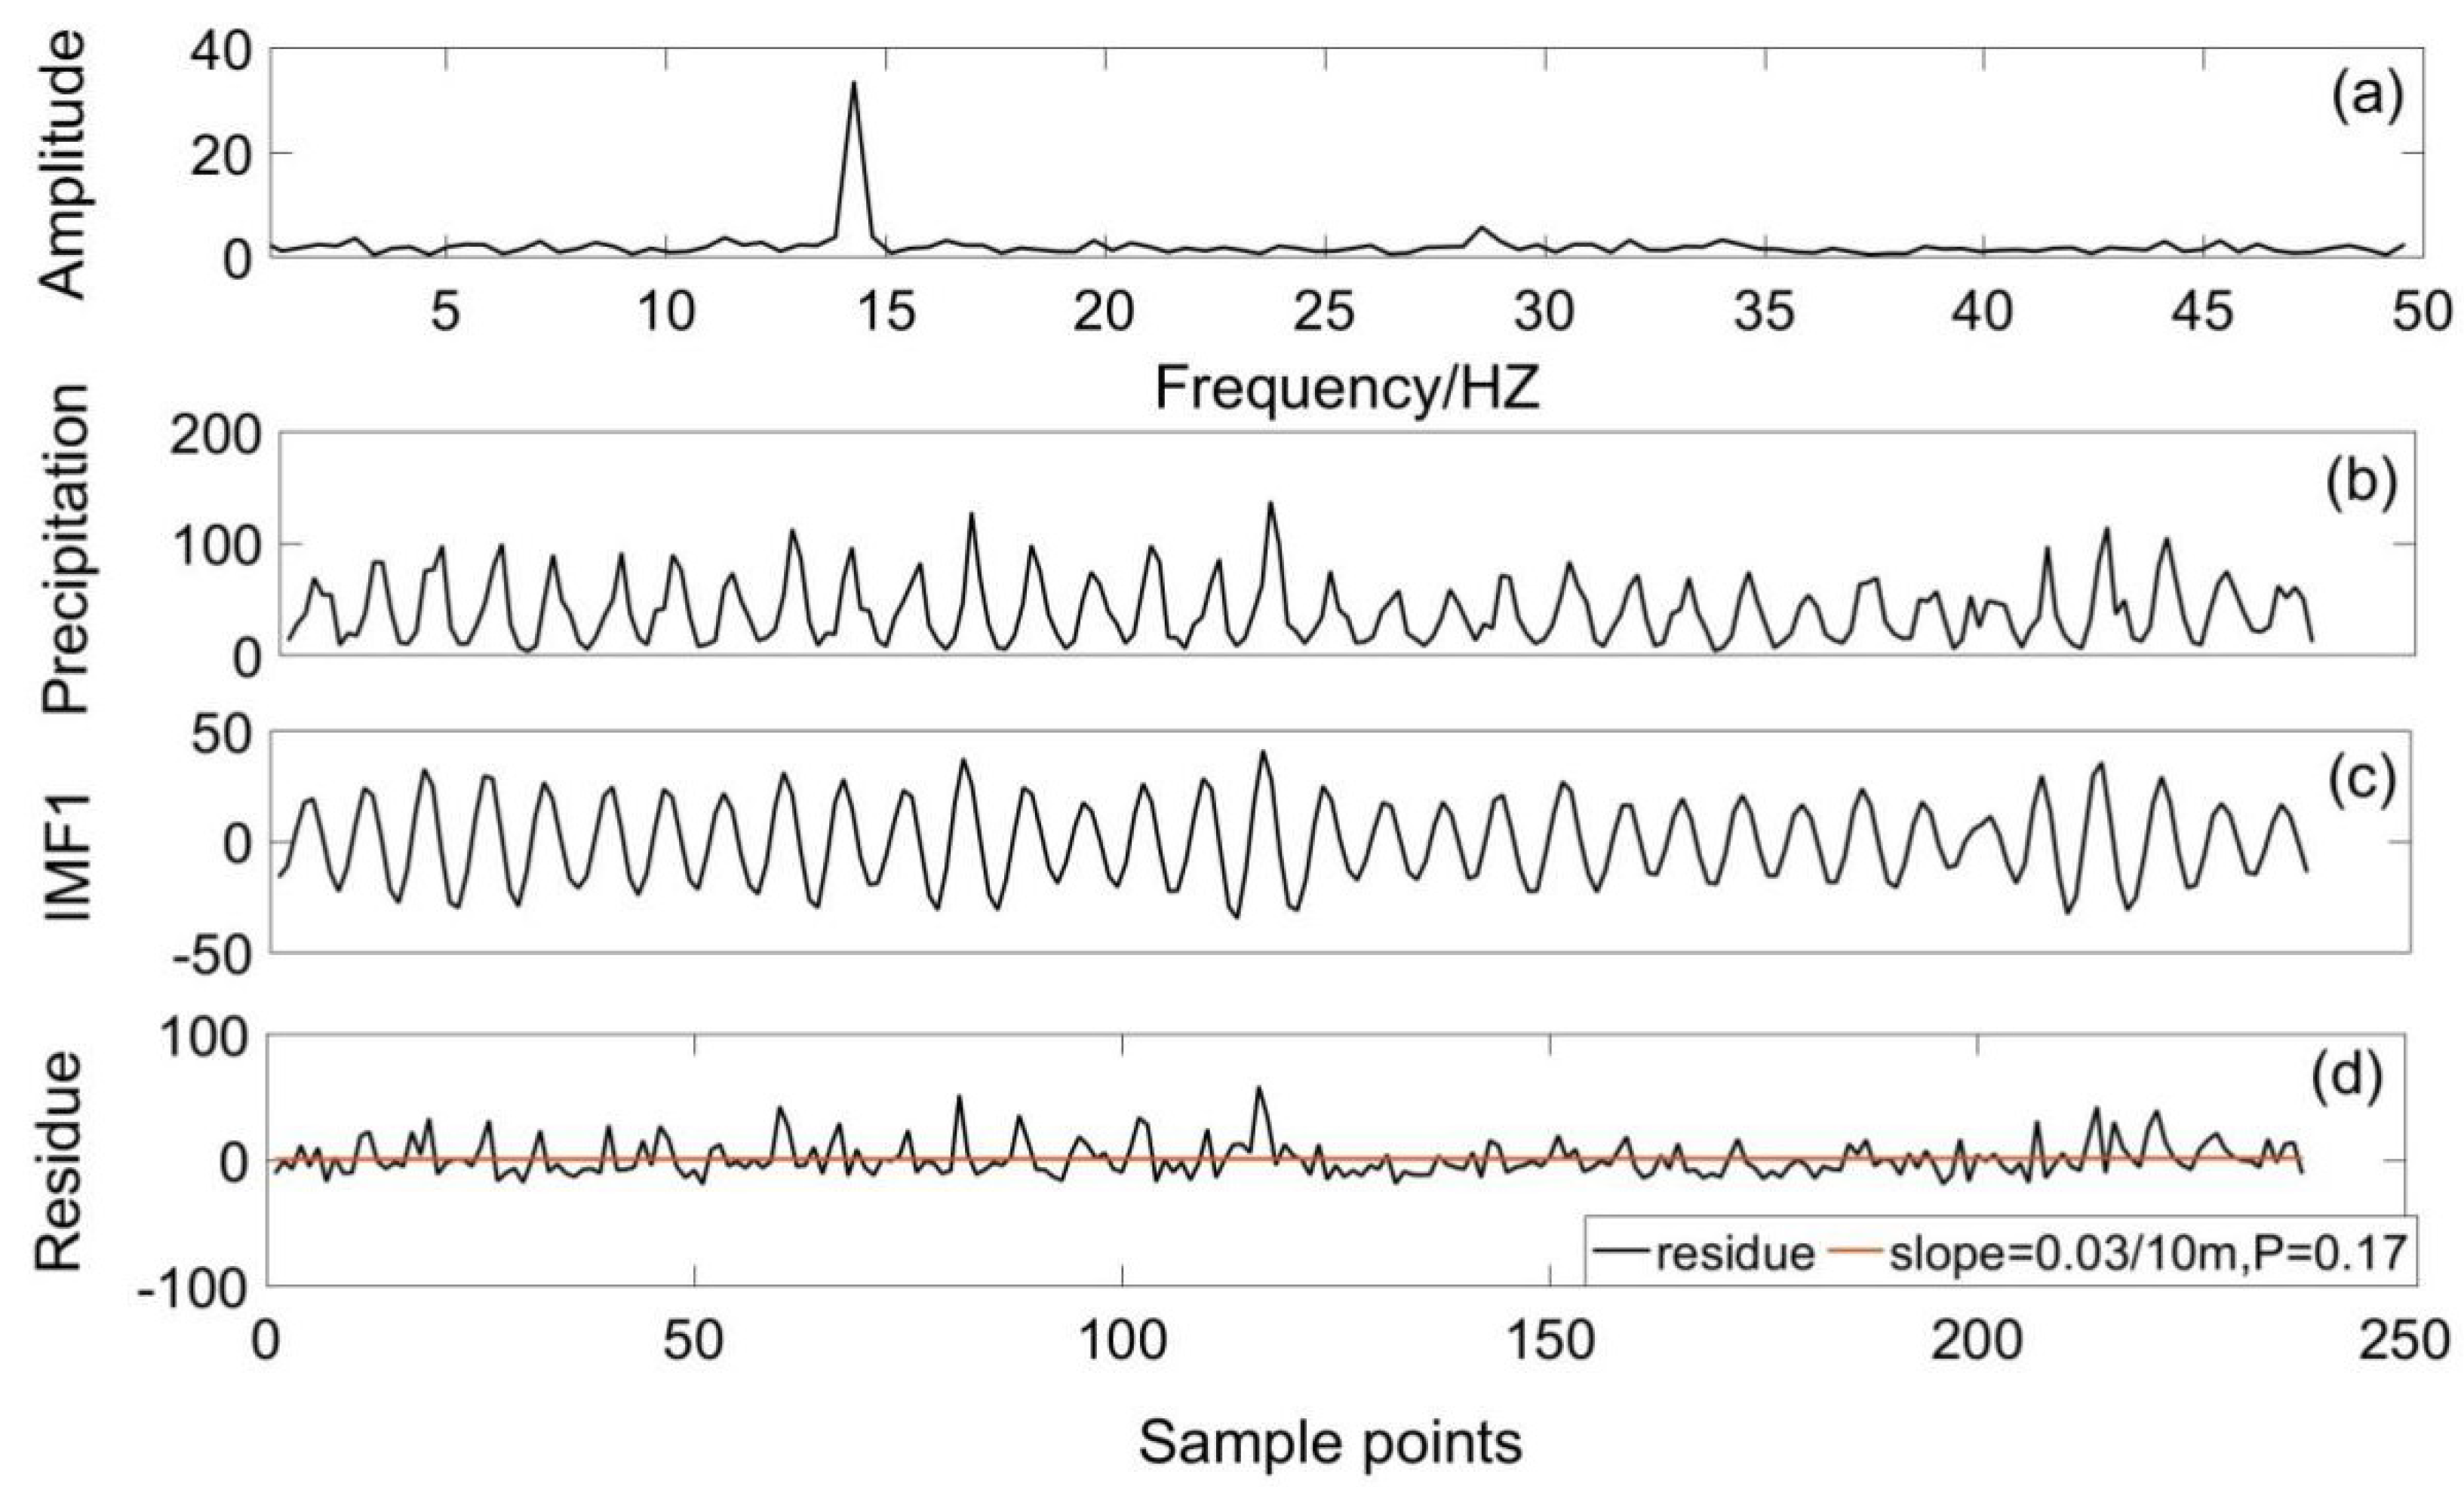
3.1. Signal Simulation

For testing the ability of the CEEMDAN decomposition, we constructed a time series signal to simulate a true time series. The signal was designed as
x = 0.5 sin ( 2 p i 20 t ) + 2 sin ( 2 p i 60 t ) + 0.35 t .
In the equation, x is superposed by two sine functions with different periods and frequencies as well as random data. The sampling frequency is 100 HZ in the FFT method. There are 238 sample points, the noise standard deviation is 0.2, and the number of realizations is 500 in the CEEMDAN algorithm.
The FFT and CEEMDAN results are shown in Figure 2. It can be seen from Figure 2a that the spectrum of the simulated signal contains a main frequency of 40 HZ and a sub-frequency of 20 HZ, which is consistent with the signal simulation data x . From Figure 2b–g, we can find that the simulated data were decomposed into five modes by CEEMDAN. IMF1 represents the high frequency; IMF2 is the sub-frequency; and IMF3, IMF4, and IMF5 are the residuals, indicating that the CEEMDAN decomposition algorithm can better extract the cycle and residual information of the simulated signal. In Figure 2h, the residual is the sum of IMF3, IMF4, and IMF5, indicating an increased tendency. The experimental results show that we can utilize the FFT and CEEMDAN algorithms to extract the NDVI and climate information.

3.2. Periodicity Analysis

The FFT method was used to acquire the frequency information about the NDVI, temperature, and precipitation time series, and it was combined with the IMF components obtained by CEEMDAN to analyze the periodicity information and the tendencies of the NDVI, temperature, and precipitation across the Inner Mongolia region.

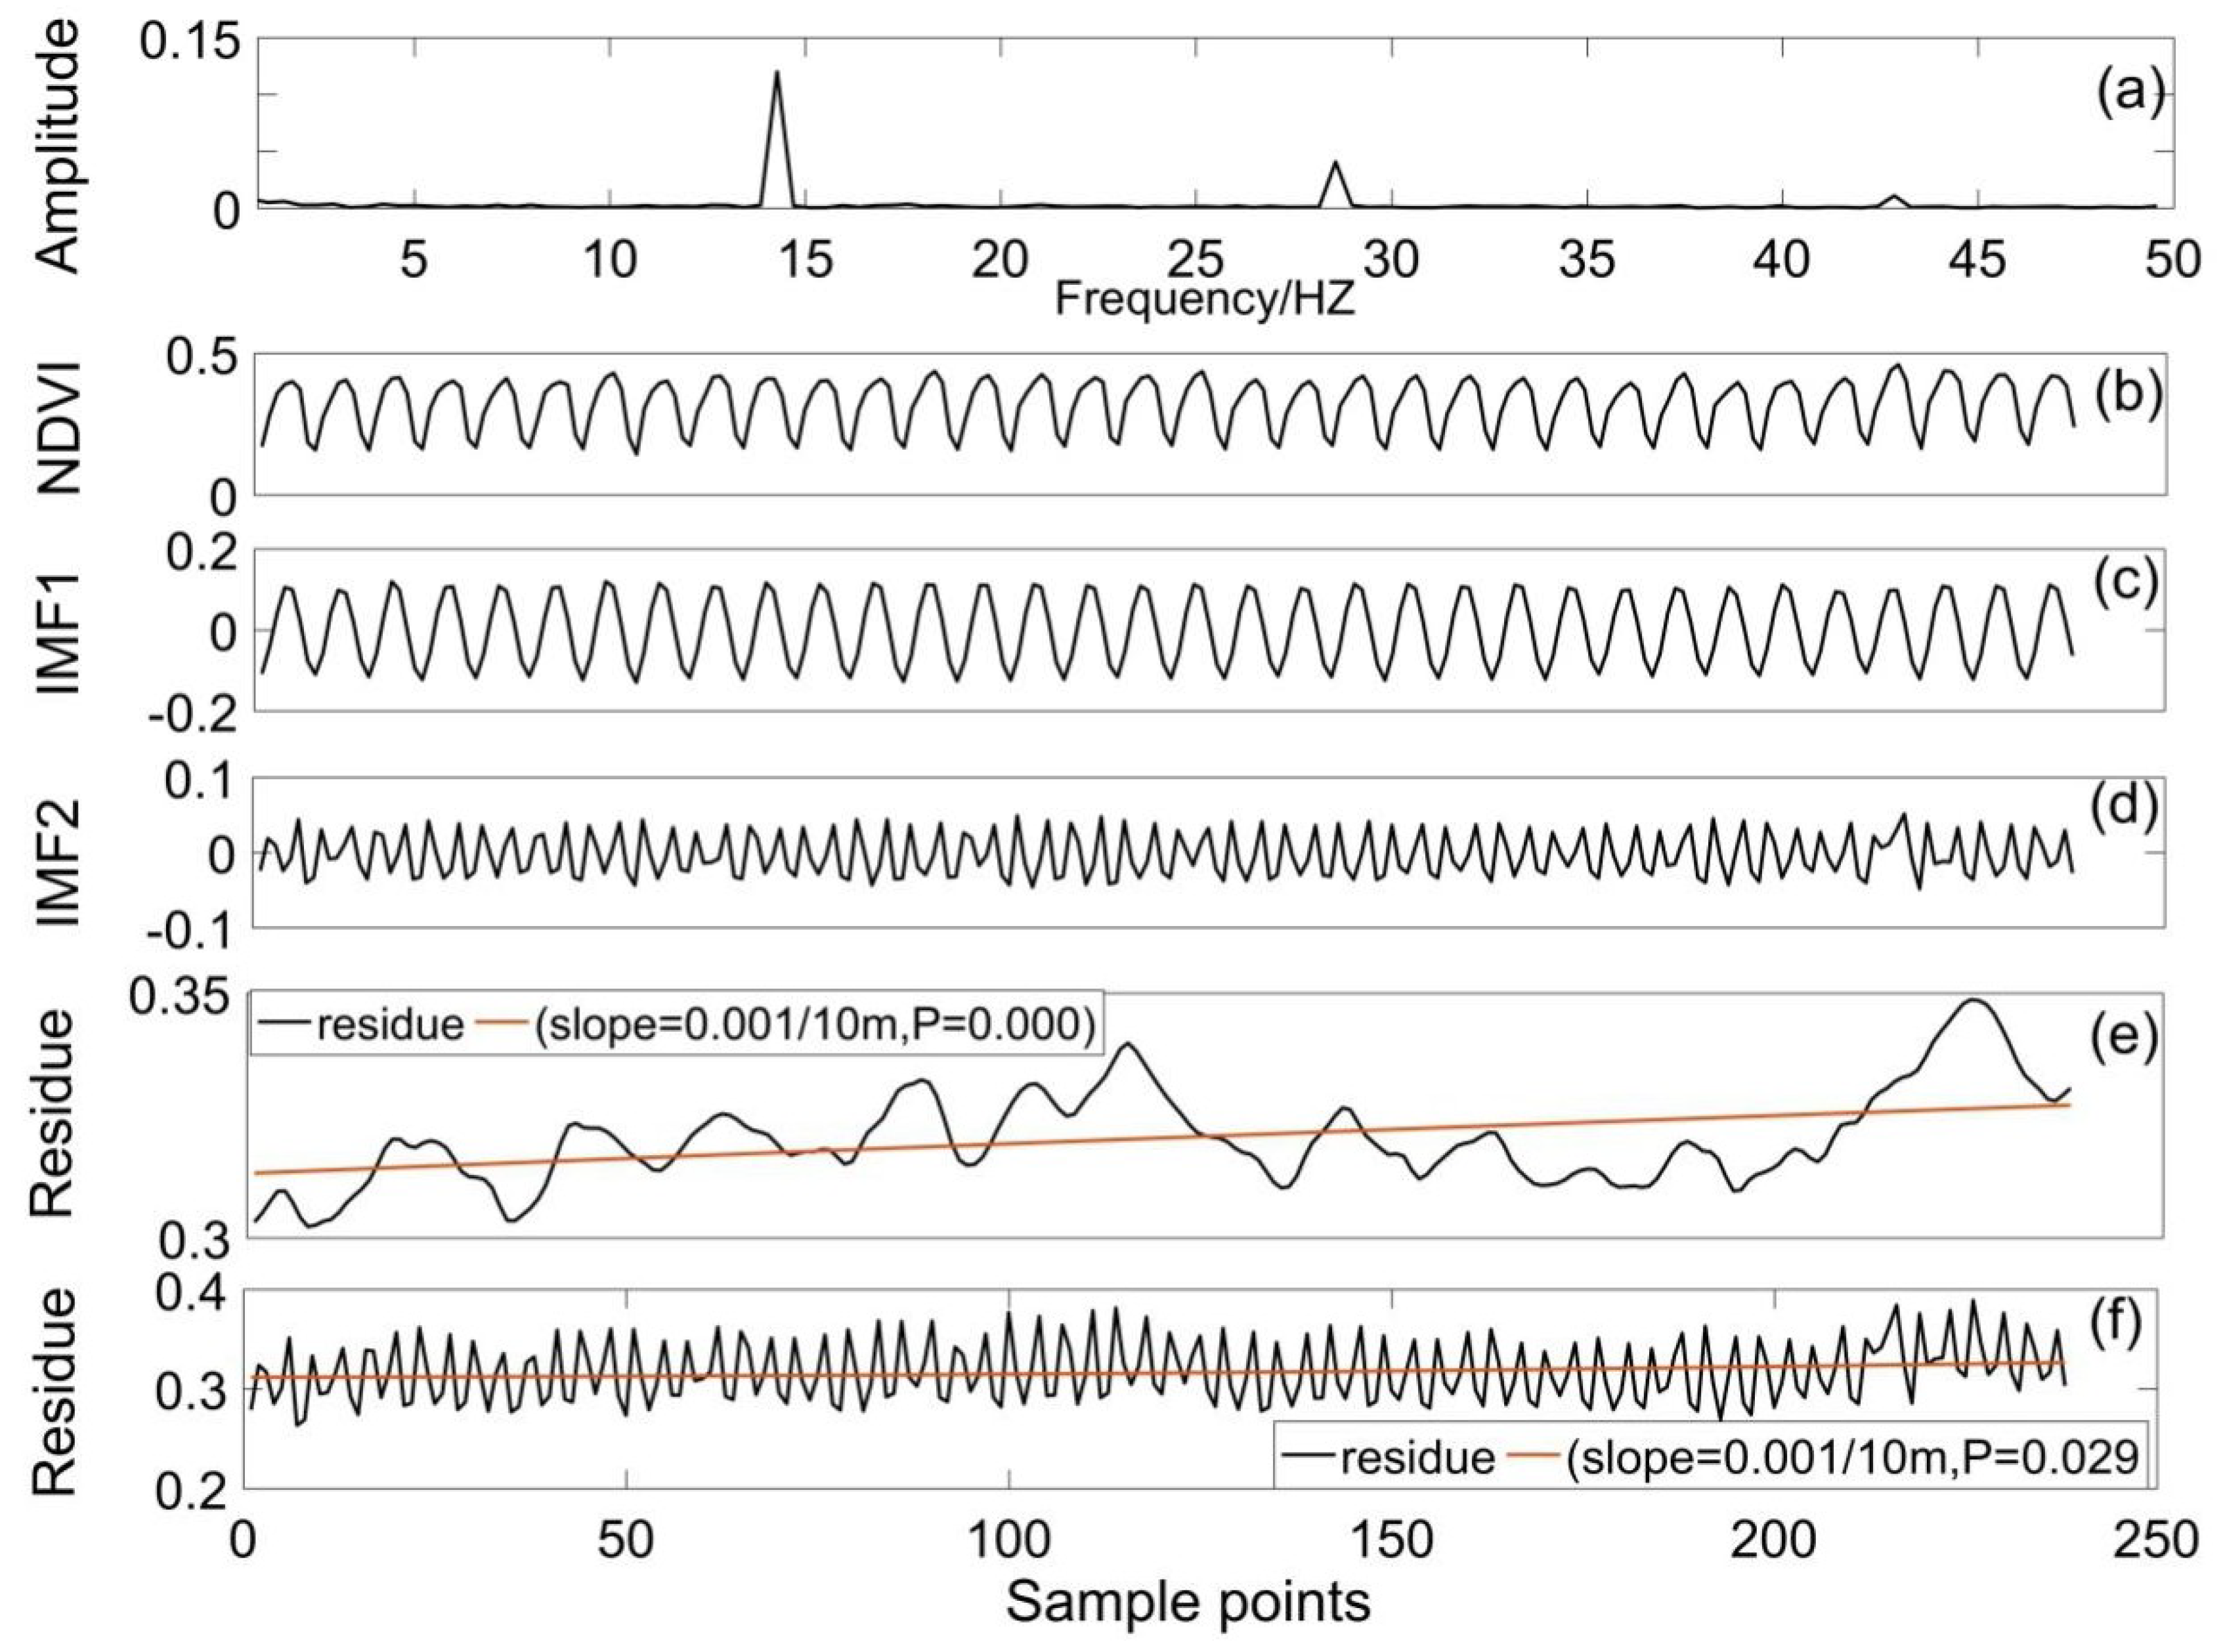
3.2.1. Periodicity Analysis of NDVI

First, the spectrum of the NDVI time series was obtained (Figure 3a). In Figure 3a, the abscissa is the NDVI frequency, and the ordinate is the amplitude. Thus, from Figure 3a, we can find that NDVI has a 14 HZ dominant frequency and a 28 HZ sub-frequency. Based on the FFT results, the NDVI time series is decomposed into two periodic components (14 HZ and 28 HZ) and one trend component by CEEMDAN. Details can be seen in Figure 3b–d.
In Figure 3b–d, IMF1 indicates that the NDVI change period is the main period, and the cycle is a year; IMF2 denotes the half-year growth cycle in Inner Mongolia. In Figure 3e, the residual component is shown, which is not influenced by the IMF1 or IMF2 periodic information, and it indicates the changing vegetation trend, which increases at a rate of 0.001/10 m (P = 0.000) as estimated by a linear regression method. Figure 3f is the result when we consider only the domain frequency (14 HZ); the NDVI value increased at a rate of 0.001/10 m (P = 0.029), which is consistent with the previous research findings by Zhang et al. and Miao et al. [14,62].
In summary, the vegetation NDVI has two change periods, the one-year period and two-year cycle, and it shows a significant and slow growth from 1982–2015 in Inner Mongolia.

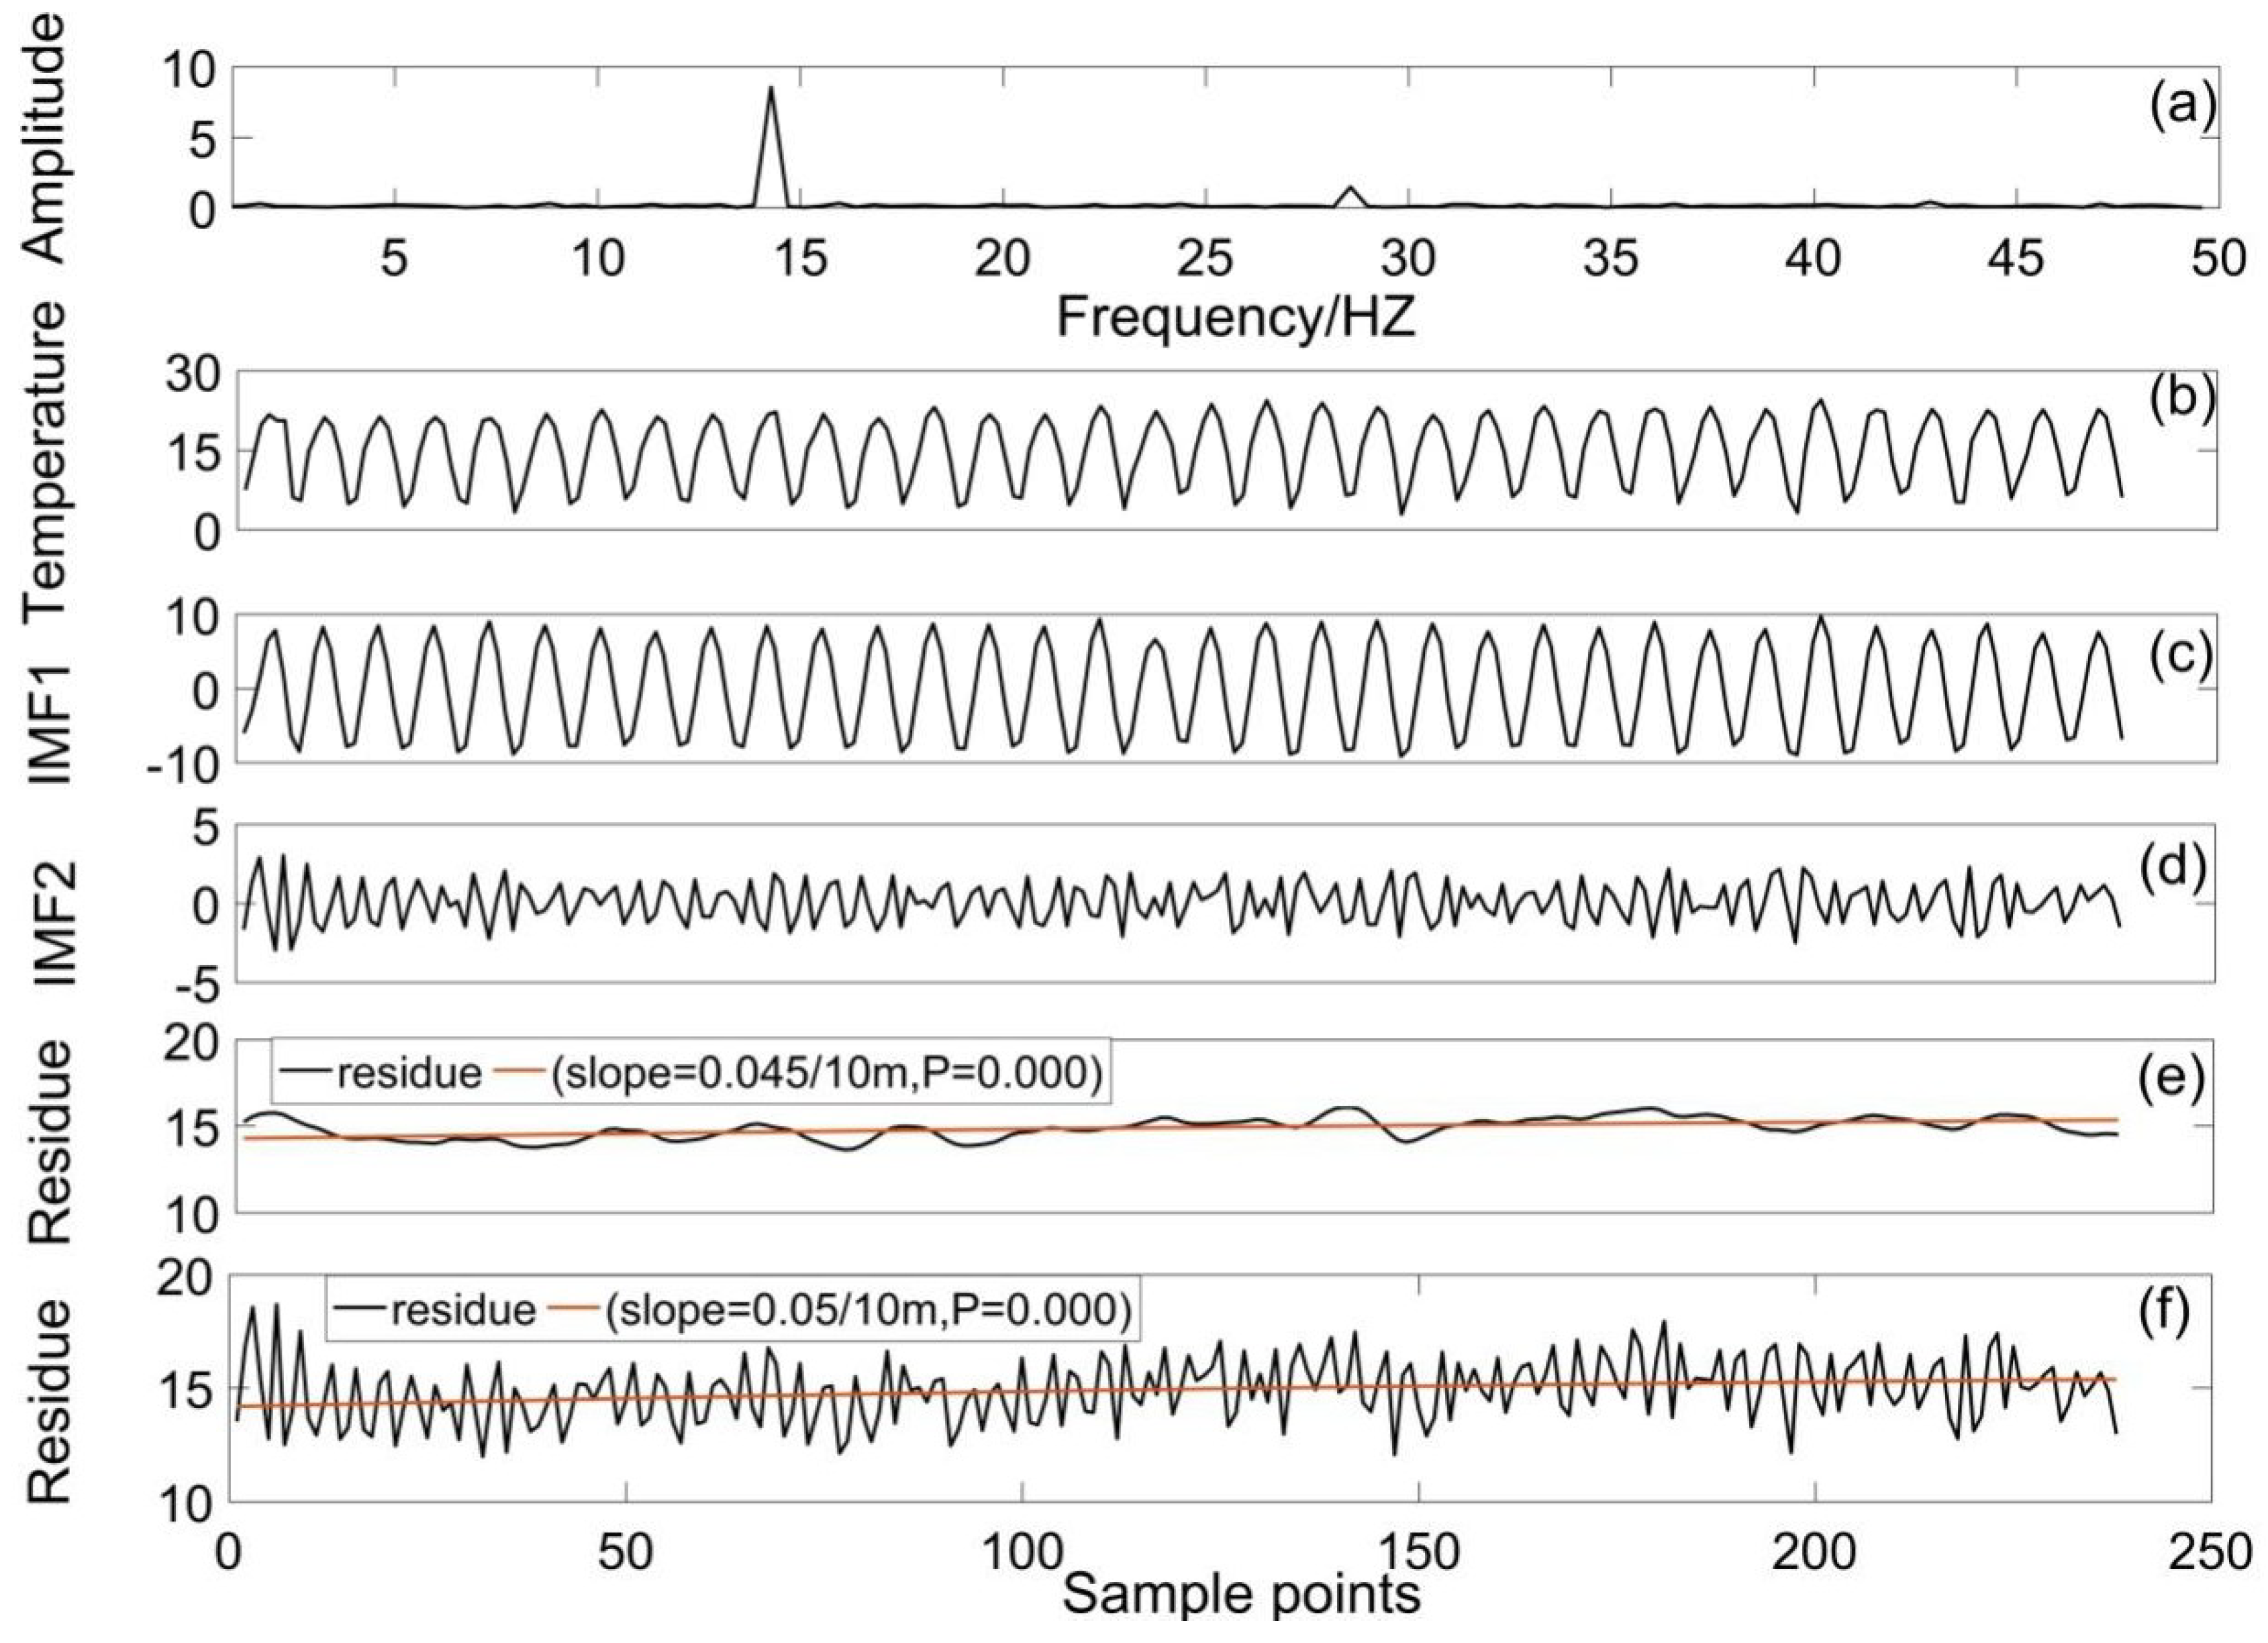
3.2.2. Periodicity Analysis of Meteorological Factors

The average temperature and precipitation values are calculated from the meteorological dataset from 47 meteorological stations in Inner Mongolia.
Figure 4a is the temperature spectrum that was established by the FFT method. From Figure 4a, we can identify two peak points, indicating that, like the NDVI dataset, temperature has two different periods. The average temperature data also indicates two main frequencies (14 HZ and 28 HZ), which represent the main frequency and sub-frequency, respectively. Figure 4c–d indicates that the temperature has two periods; IMF1 is the one-year cycle, and IMF2 denotes the half-year growth period. In Figure 4e, the residual does not include the IMF1 or IMF2 periodic information, and its linear velocity is 0.045 °C/10a (P = 0.000), denoting a significant and slow increasing trend from 1982–2015 in the study area. The linear velocity of the residual that does not include IMF1 is 0.05 ℃/10 m (P = 0.0001) (Figure 4f).
Generally, the temperature has two periods, one-year and half a year, and it increases slowly and significantly under the global warming background in Inner Mongolia; this is consistent with the NDVI changes. Compared with previous researches [63,64], the bi-periodic phenomena in the NDVI and temperature time series have been found in our study; it will further improve the effect of the correlation analysis between the NDVI and temperature.
It can be seen from Figure 5a that precipitation only has one main frequency (14 HZ), which differs from the NDVI and temperature. In Figure 5b–d, the precipitation data are decomposed into IMF components and a residual component by CEEMDAN. IMF1 indicates that precipitation has a one-year period, and the residual increased in a 0.03 mm/10a volatility (P > 0.1), indicating that precipitation increased but not significantly from 1982 to 2015.

3.3. Temporal and Spatial Variations in Vegetation

3.3.1. Interannual Variations in NDVI

In this paper, the annual NDVI value is the cumulative NDVI value of the growing season from April to October. Based on the piecewise linear regression method, we analyzed the interannual characteristics of the vegetation changes in the study region during 34 years. Figure 6 indicates that the vegetation’s linear velocity was 0.033%/10 a (P < 0.005) in Inner Mongolia, indicating a slow increasing trend from 1982–2015. These results agree with those obtained by Yang et al. [65]. This change rate is larger than the change rate in China (0.007/10 a from 1982 to 2011) [66,67], and it is also larger than the Loess Plateau (0.025/10 a, from 1982 to 2013) [66] and Tibetan Plateau (0.004/10 a from 1982 to 2012) [68].
In Figure 6, the NDVI change in our study area was mainly divided into three phases: (1) during 1982–1999, the slope value was 0.077/10 a (P < 0.001) in Inner Mongolia, with a continued and significant increasing trend; (2) from 2000–2009, the slope value was −0.06/10 a (P < 0.1) in Inner Mongolia with a significant decreasing trend; and (3) during 2010–2015, the slope value was 0.34/10 a (P < 0.05) in Inner Mongolia, with a significantly and rapidly increasing trend. Similar findings have been found by Zhao et al. and Meng et al. [69,70]. The NDVI is significantly affected by precipitation and temperature changes [69,71]. During 1982–1999, the temperature and precipitation in Inner Mongolia increased, suitable climate conditions were conducive to vegetation growth, and the NDVI value increased accordingly; from 2000 to 2009, the temperature kept high, while the precipitation decreased [62,71]. Drought occurred in Inner Mongolia grasslands, which inhibited the growth of vegetation. On the other hand, the occurrence of pests also affected the growth of vegetation [72]. As a result, the NDVI value decreased; and during 2010–2015, the precipitation increased again, drought alleviated, and the NDVI increased. In addition, the state implemented measures such as the “Grain for Green” Program which also effectively improved grassland ecological conditions [73].

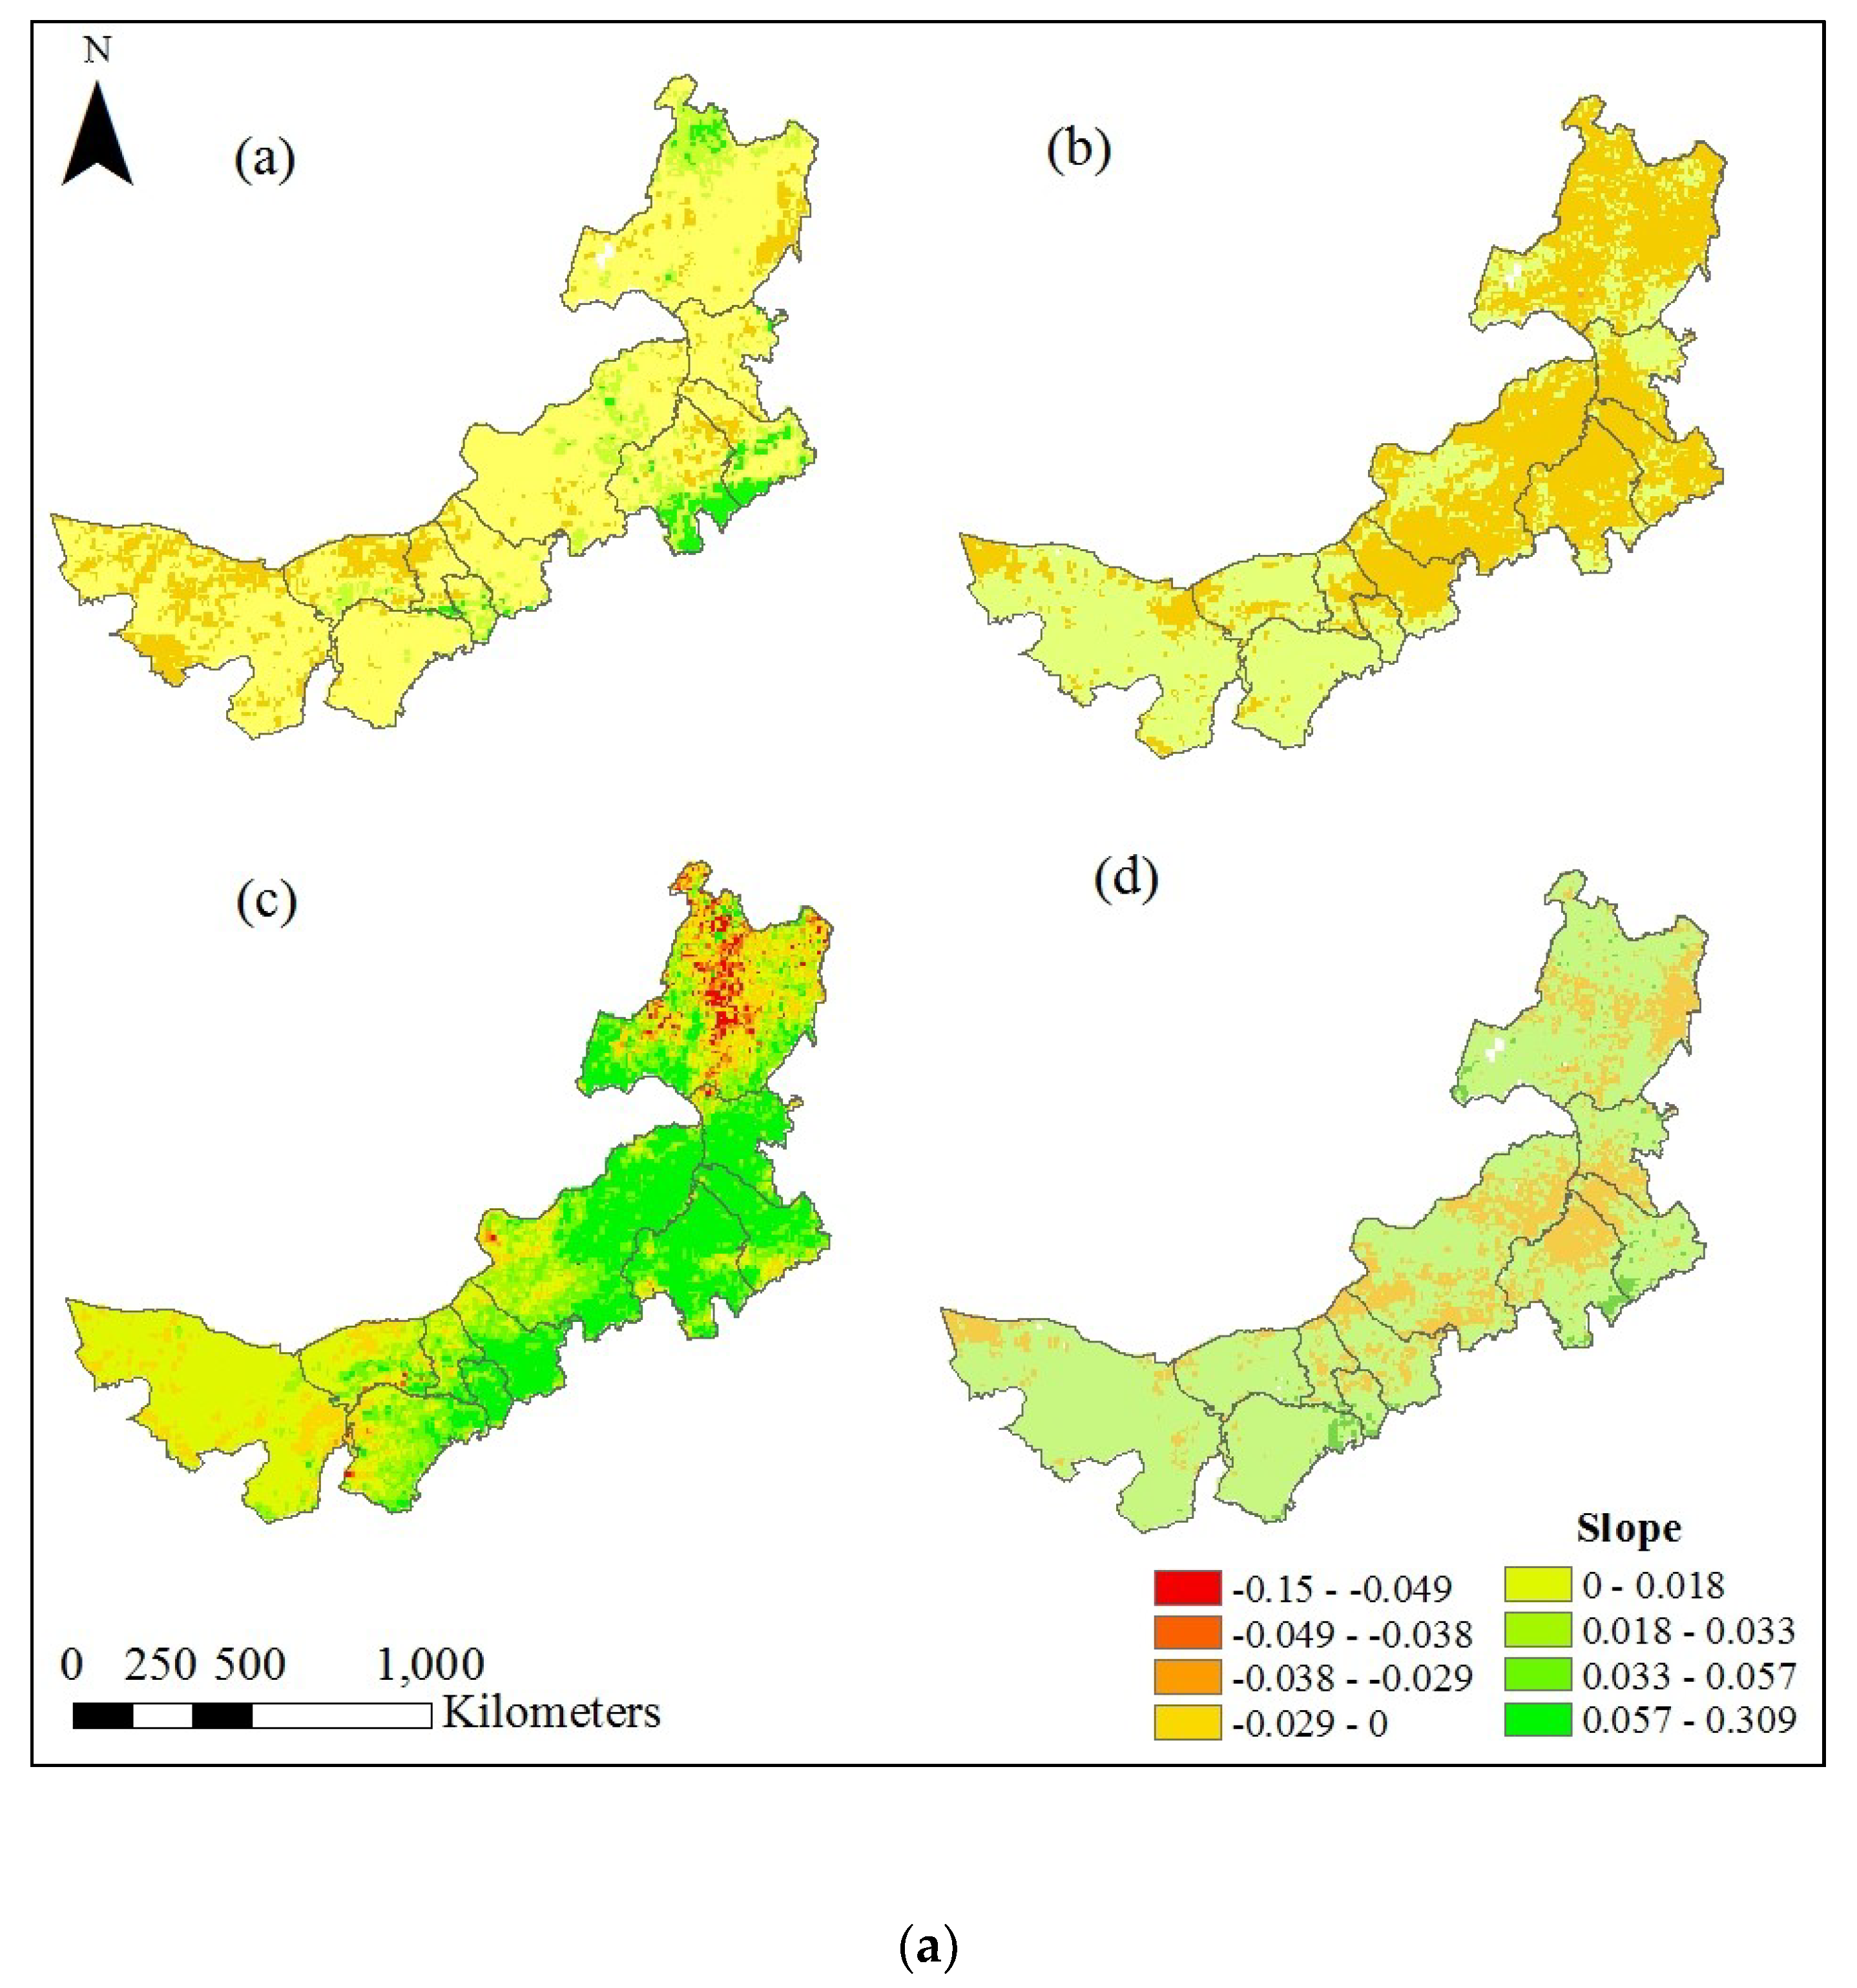
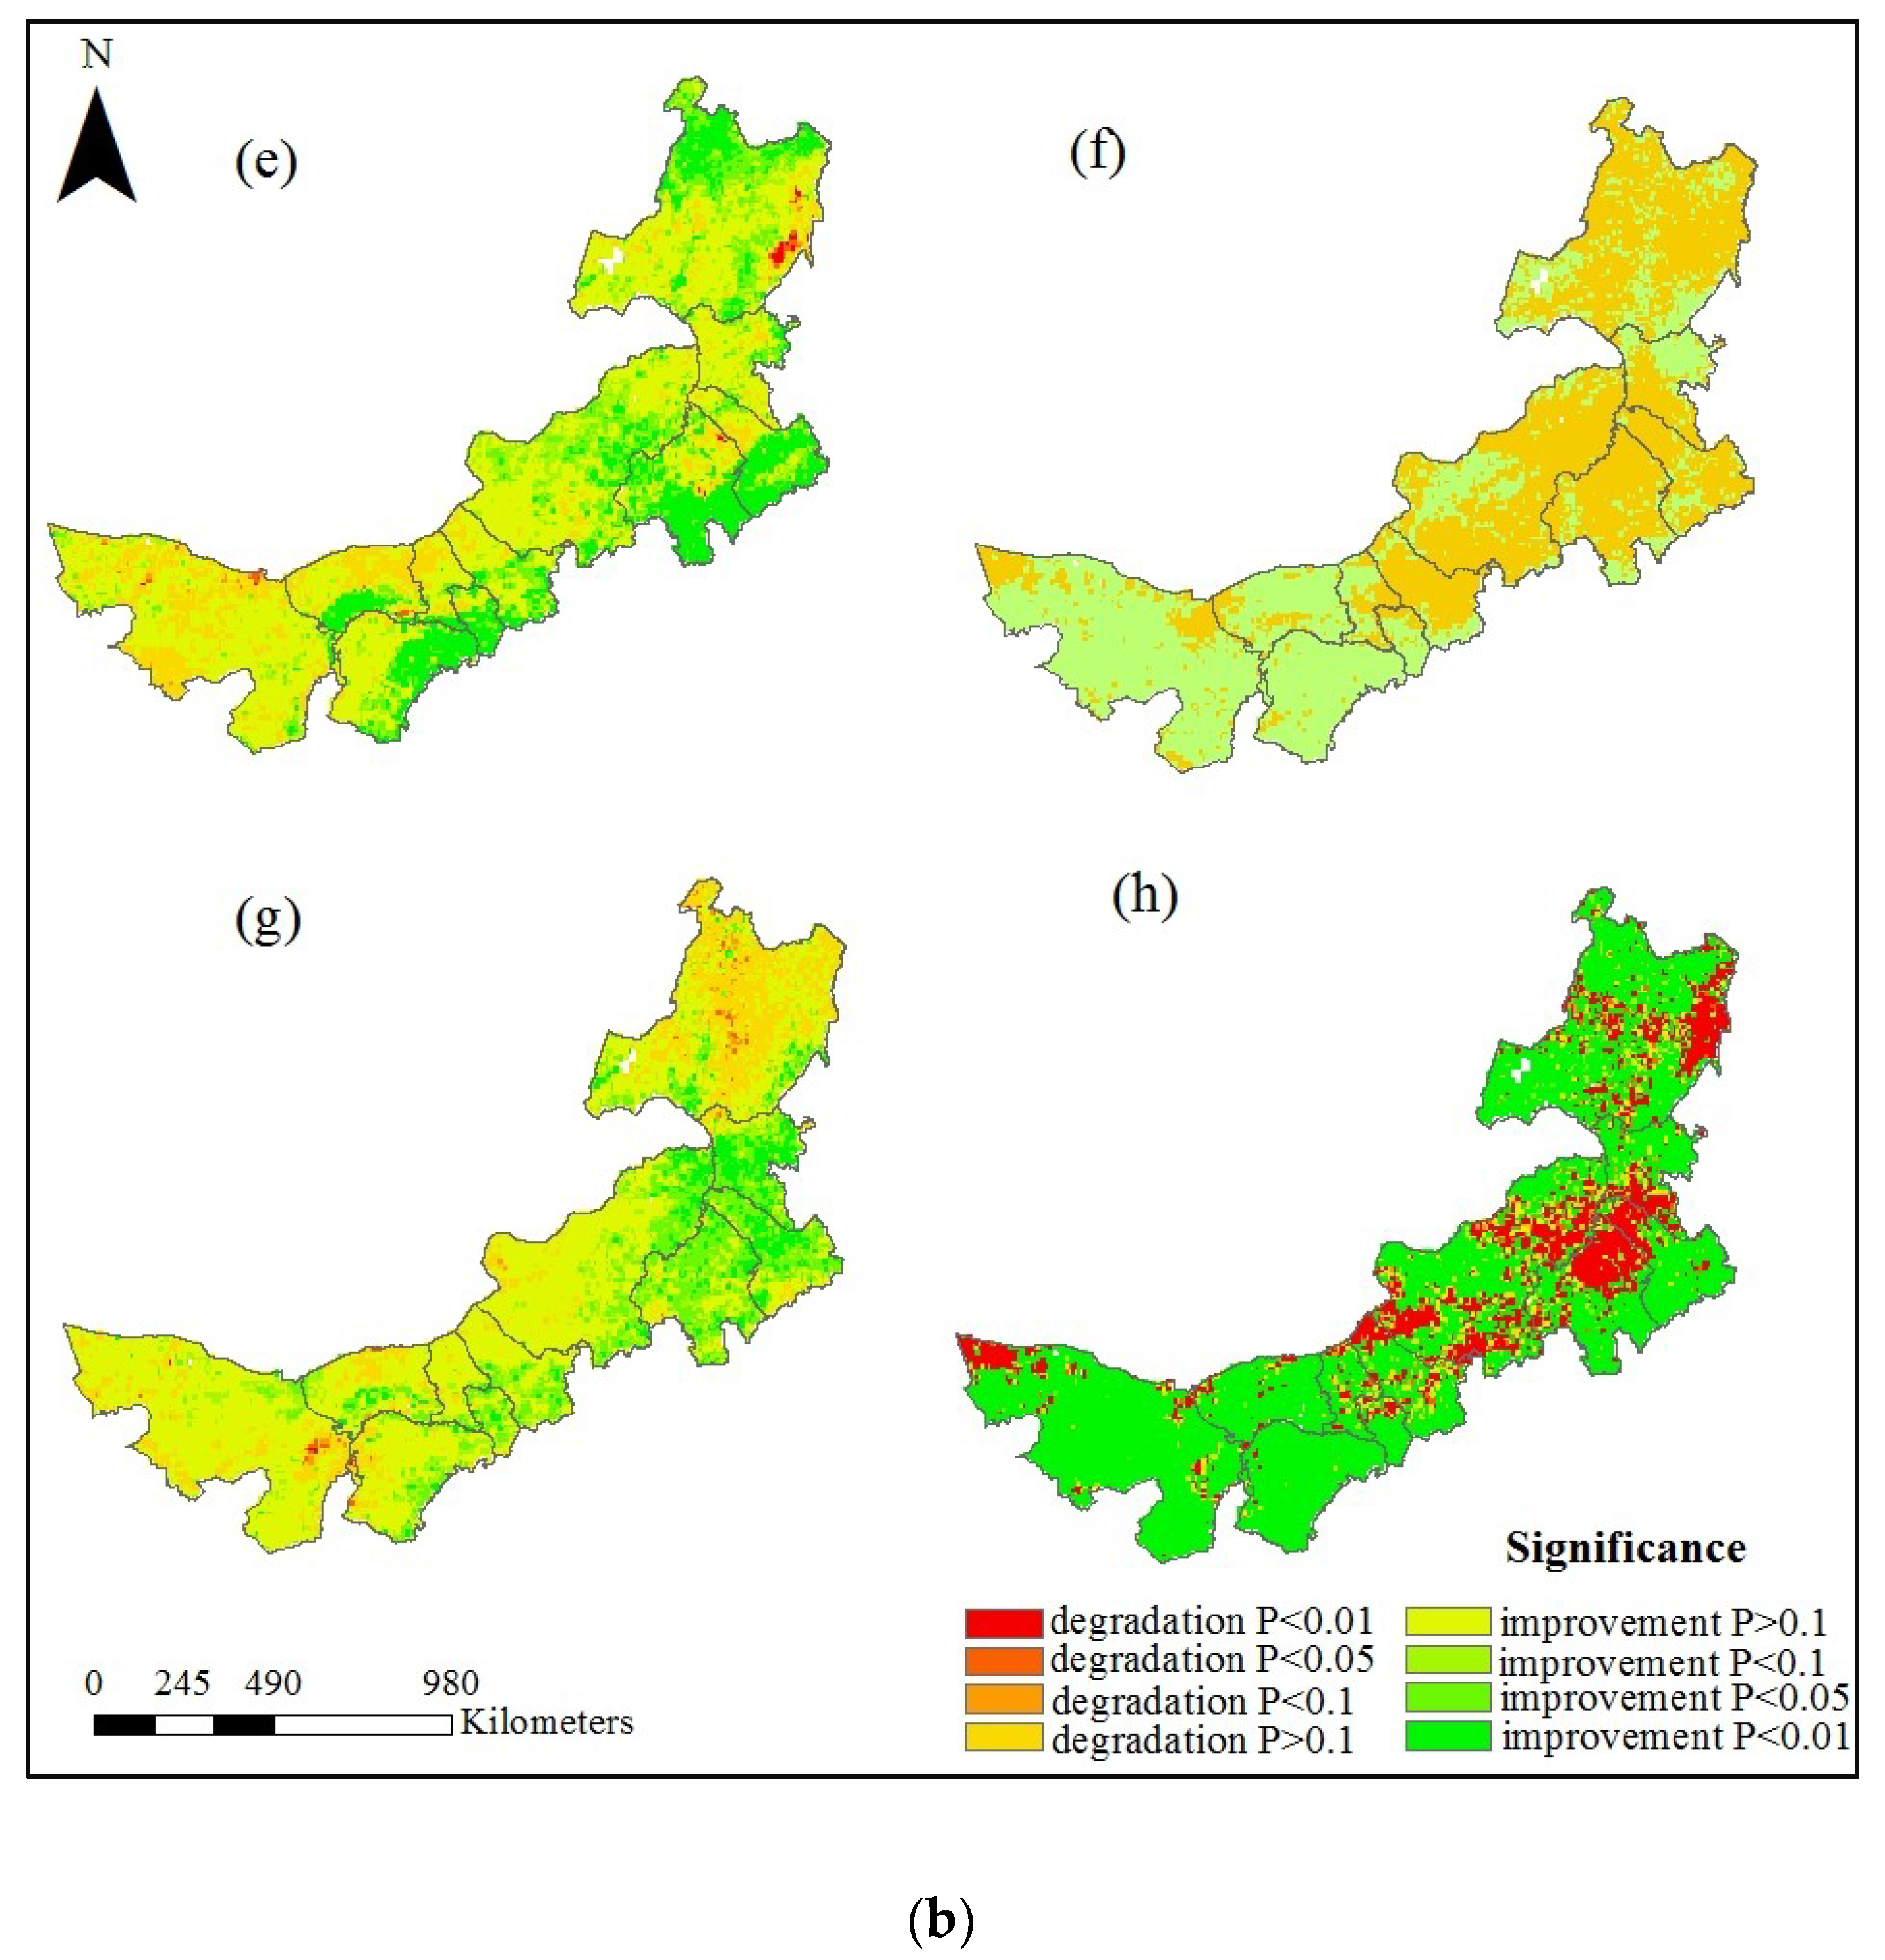
3.3.2. Spatial Characteristics of Vegetation Variations

Based on the trend line analysis method, we analyzed the vegetation change tendency and its significance in the past 34 years at the pixel scale. It can be seen from Table 1 that the area of vegetation improvement and degradation accounted for 71.2% and 22.8%, respectively, of which an extremely significant increase (P < 0.01) accounted for 70.9%, which was mainly distributed in the northern, southwestern, and southeastern regions of Inner Mongolia. Furthermore, the region with a decreasing trend is mainly distributed in the central part of Inner Mongolia (Figure 7h).
Based on the different time segments, further analysis was conducted for 1982–1999, 2000–2009, and 2010–2015. We found that the spatial patterns of the NDVI changes during the different time periods had significant differences. The area where the vegetation NDVI increased and decreased during 1982–1999 accounted for 85.5% and 14.5% of the area, respectively (Figure 7a), of which the area with no significant increase (P > 0.1) accounted for 48.2% and the area of extremely significant improvement (P < 0.01) accounted for 16.9% and was mainly distributed in the south of Chifeng and Tongliao, in the east of Ordos, in the south of Bayannur, and in the north of Hulunbuir (Figure 7e). The area in which the vegetation NDVI had no significant increase or decrease during 2000–2009 accounted for 47.2% and 52.8% of the total area, respectively (P > 0.1) (Figure 7b), of which the area with no significant improvement (P > 0.1) was mainly located in the western part of Inner Mongolia (Figure 7f). The area in which the vegetation NDVI increased and decreased during 2010–2015 accounted for 83.1% and 16.9% of the area, respectively (Figure 7c), of which the area with no significant improvement (P > 0.1) accounted for 53.0% and the area with extremely significant improvement (P < 0.01) accounted for 6.6% and was mainly distributed in the eastern part of Xilin Gol and in Xinganmeng, Tongliao, and Chifeng (Figure 7g).
Further, Figure 7a–d shows that the slope values were −0.029 to 0.057, −0.038 to 0.018, −0.156 to 0.309, and −0.049 to 0.033 in 1982–1999, 2000–2009, 2010–2015, and 1982–2015, respectively. The slope rate value is the highest in 2009–2015, indicating that the vegetation grew better during that time than in any other time segment [70].
The above analysis showed that the western area of Inner Mongolia had no significant degradation in 1982–1999 and no significant improvements in 2000–2009 and 2010–2015. The central parts of Inner Mongolia showed an improvement trend in 1982–1999, no significant degradation in 2000–2009, and a significant improvement tendency during 2010–2015. On the whole, the area with an increased NDVI was mainly distributed in the east and south of Tongliao and Chifeng, in the north of Xinganmeng, in the north and west of Hulunbir, and in the west of Inner Mongolia during 1982–2015. The regions of the decreased vegetation NDVI were in the northeast of Hulunbir, the central part of Inner Mongolia, and the northwest of Eji’naqi.

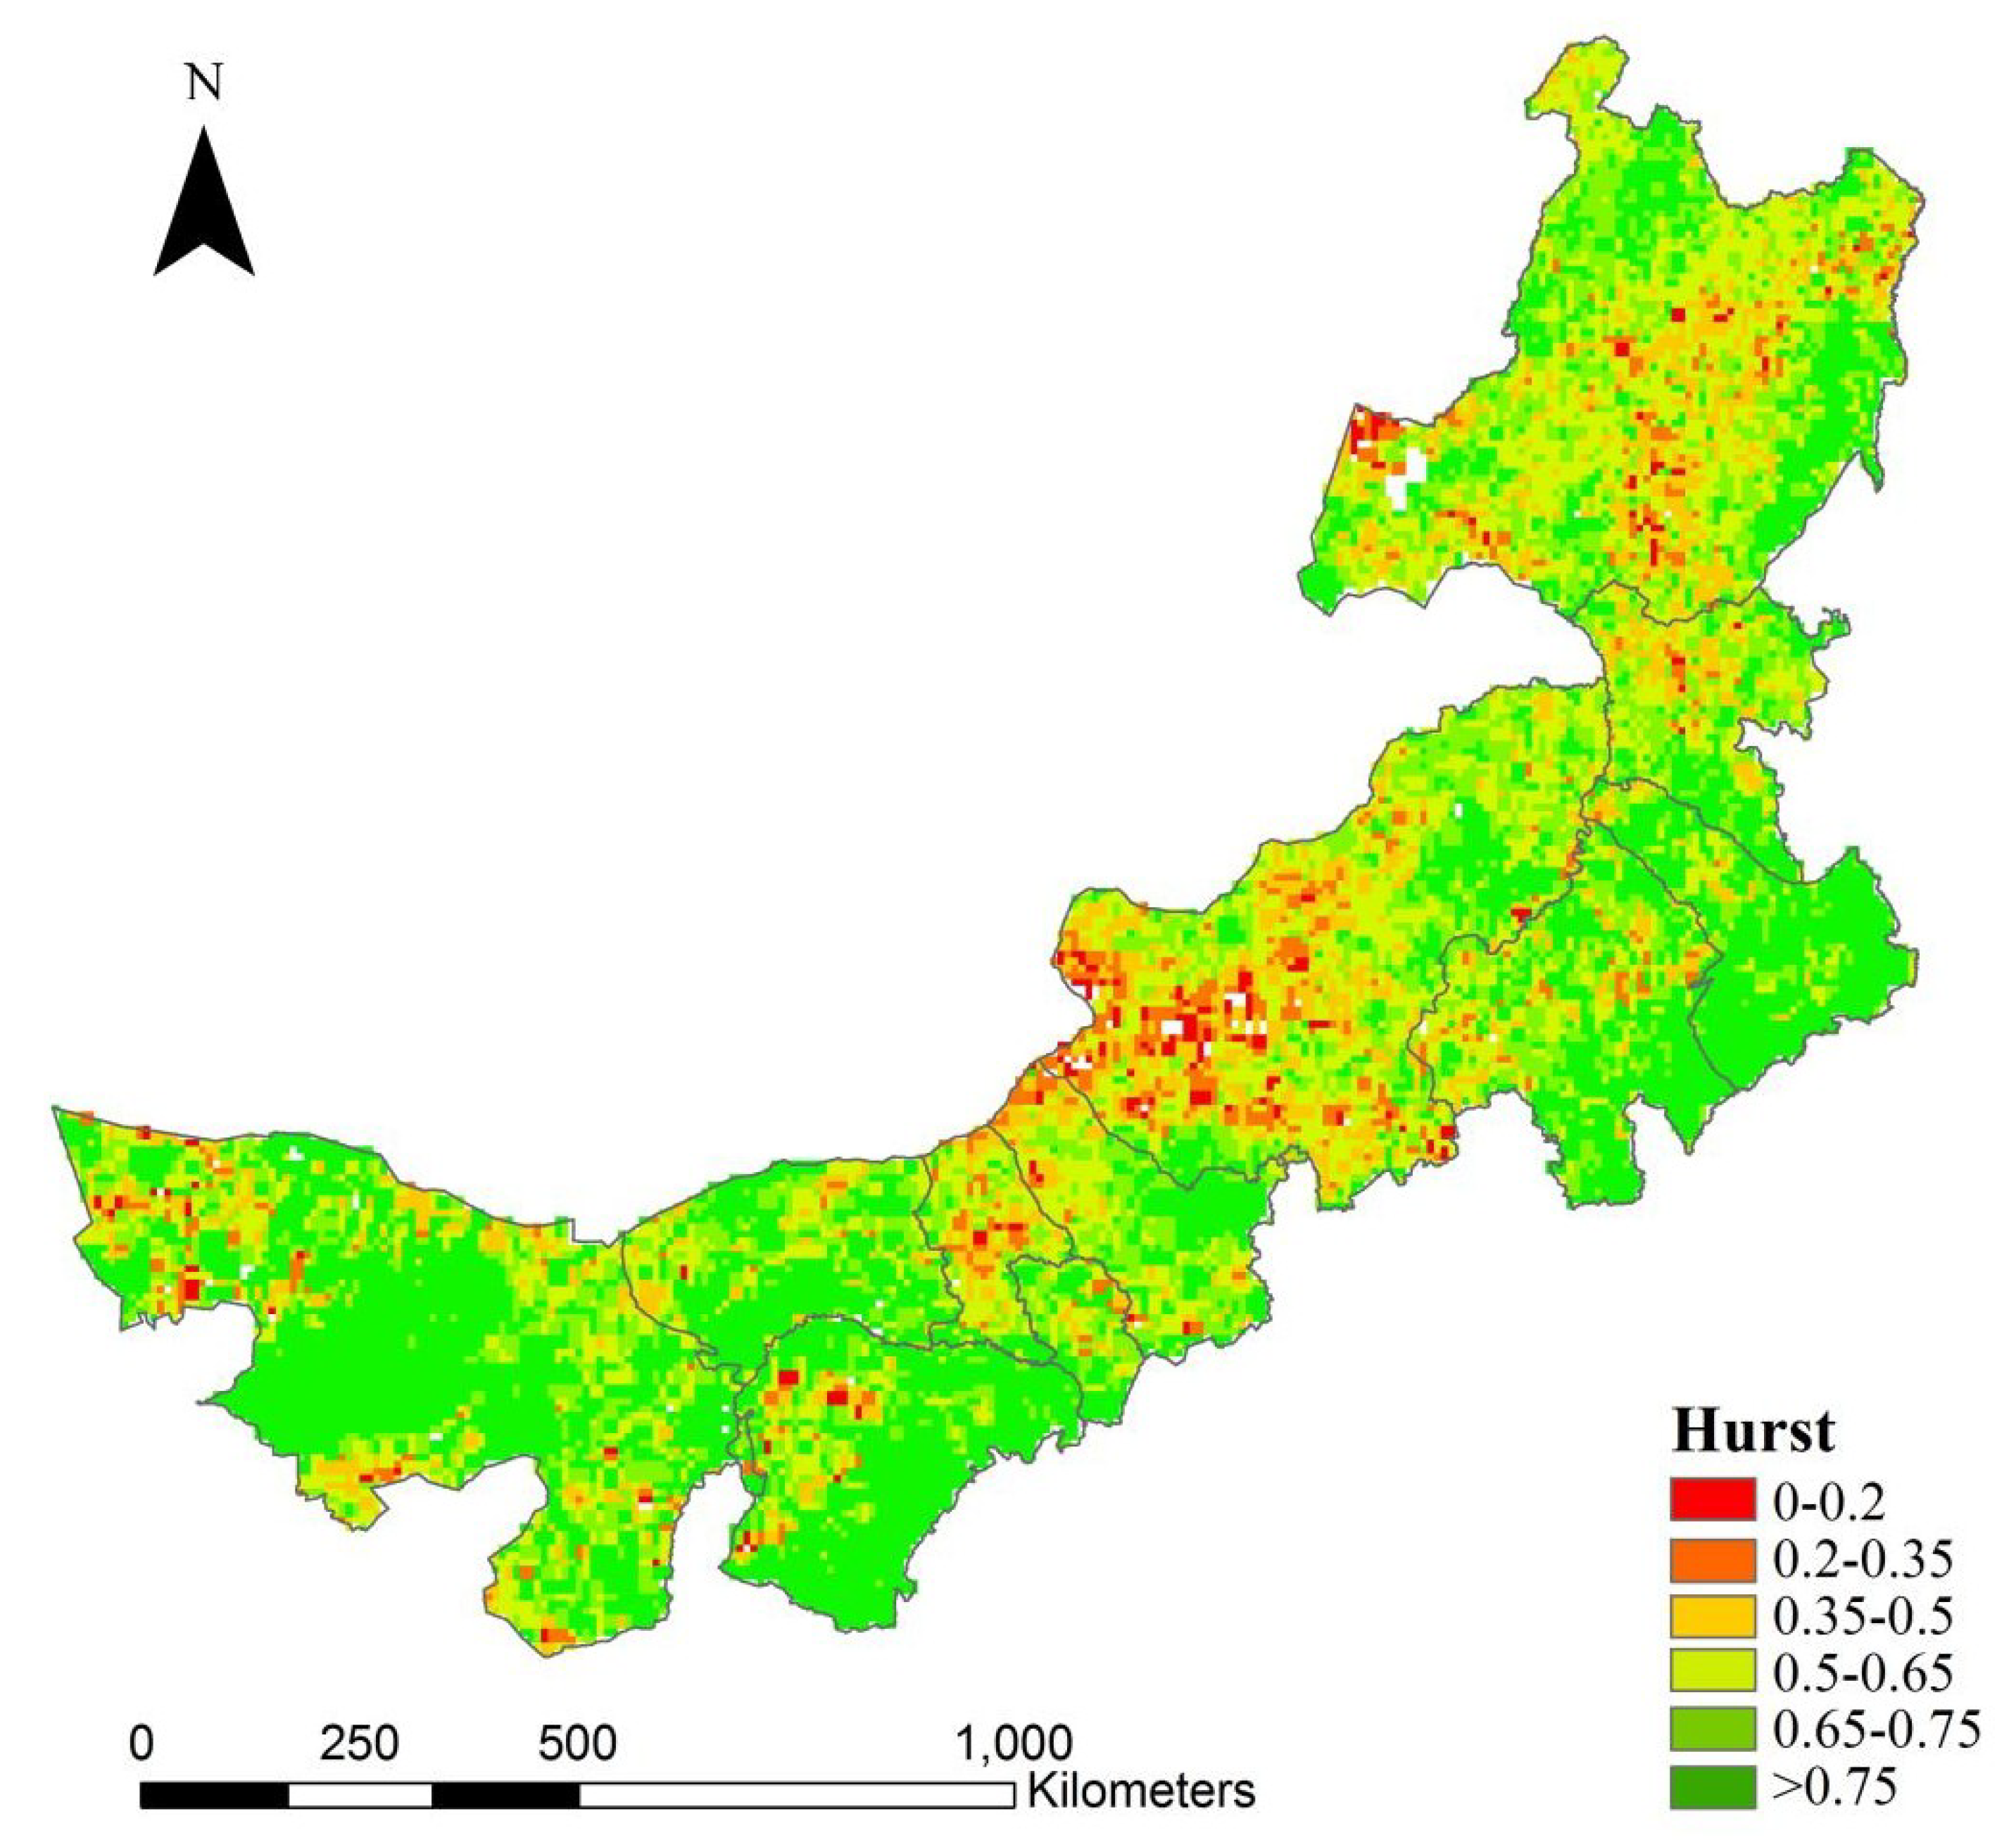
3.3.3. Continuity Characteristics of Vegetation

The Hurst exponent calculated by R/S was adopted to analyze the persistence of the variations in the NDVI during 1982–2015. The result was divided into six categories, which are described in Table 2. The continuous parts occupied 82.3% of the total pixels. The persistence of the vegetation NDVI was stronger than its anti-persistence, suggesting that the NDVI would maintain its healthy growth in most parts of the study region in the future.
Figure 8 exhibits the spatial pattern of the vegetation Hurst exponent in Inner Mongolia. In terms of its spatial distribution, the Hurst exponent was greater than 0.5 in most areas and the strongly persistent parts were mainly located in the east of Hulunbuir, Tongliao, the southeast of Chifeng, the southeast of Ordos, and Alashan Youqi. This also indicates that the vegetation NDVI will maintain a healthy growth. This result is consistent with the findings from Meng et al. [70]. However, the anti-persistence sequence was mainly distributed in the west and south of Xilin Gol and in the central region of Hulunbuir, which suggests that these areas may deteriorate further in the future, and similar finding has been found by Yang et al. [74].

3.4. The Influencing Factors Analysis

3.4.1. Correlation Analysis between Vegetation and Climate on a Monthly Scale

According to the results of Section 3.2, there have been significant cyclical changes in the NDVI, mean temperature, and precipitation sequences in the Inner Mongolia region. The NDVI and mean temperature have two similar growth periods. This result is consistent with findings from Yang et al. [65]. IMF1 is a one-year cycle and IMF2 is a half-year period, with the change trends significantly increasing slowly. However, precipitation has only a one-year period, which is similar to the NDVI IMF1, and it has an insignificant increasing tendency.
The partial correlation analysis and correlation analysis methods are employed to explore the relationship between the vegetation NDVI and climatic factors. From the partial correlation results, which can be seen in Table 3, we can find, firstly, that the partial correlation between the NDVI and temperature is higher than that with precipitation. Secondly, the partial correlation of the NDVI with the climate factors of IMF1 is higher than that based on the original data and residuals (not containing IMF1). Finally, the NDVI is positively correlated with the average temperature and precipitation, but the partial correlation coefficient between the NDVI and precipitation is −0.057 of the residual, which means that excessive rainfall is not good for vegetation growth.
From Table 3, we can find that the coefficients are 0.651 (P = 0.01) and 0.135 (P = 0.05) for IMF2 and the residual, respectively, which indicates that there is a significant positive correlation between temperature and vegetation. In contrast, the NDVI has no correlation with precipitation in IMF2 or the residual (not containing IMF1 or IMF2). The experimental results suggest that temperature and precipitation are both important factors that affect the one-year periodic vegetation growth change in Inner Mongolia [70]. Further, the half-year periodic variation in vegetation is mainly affected by temperature.

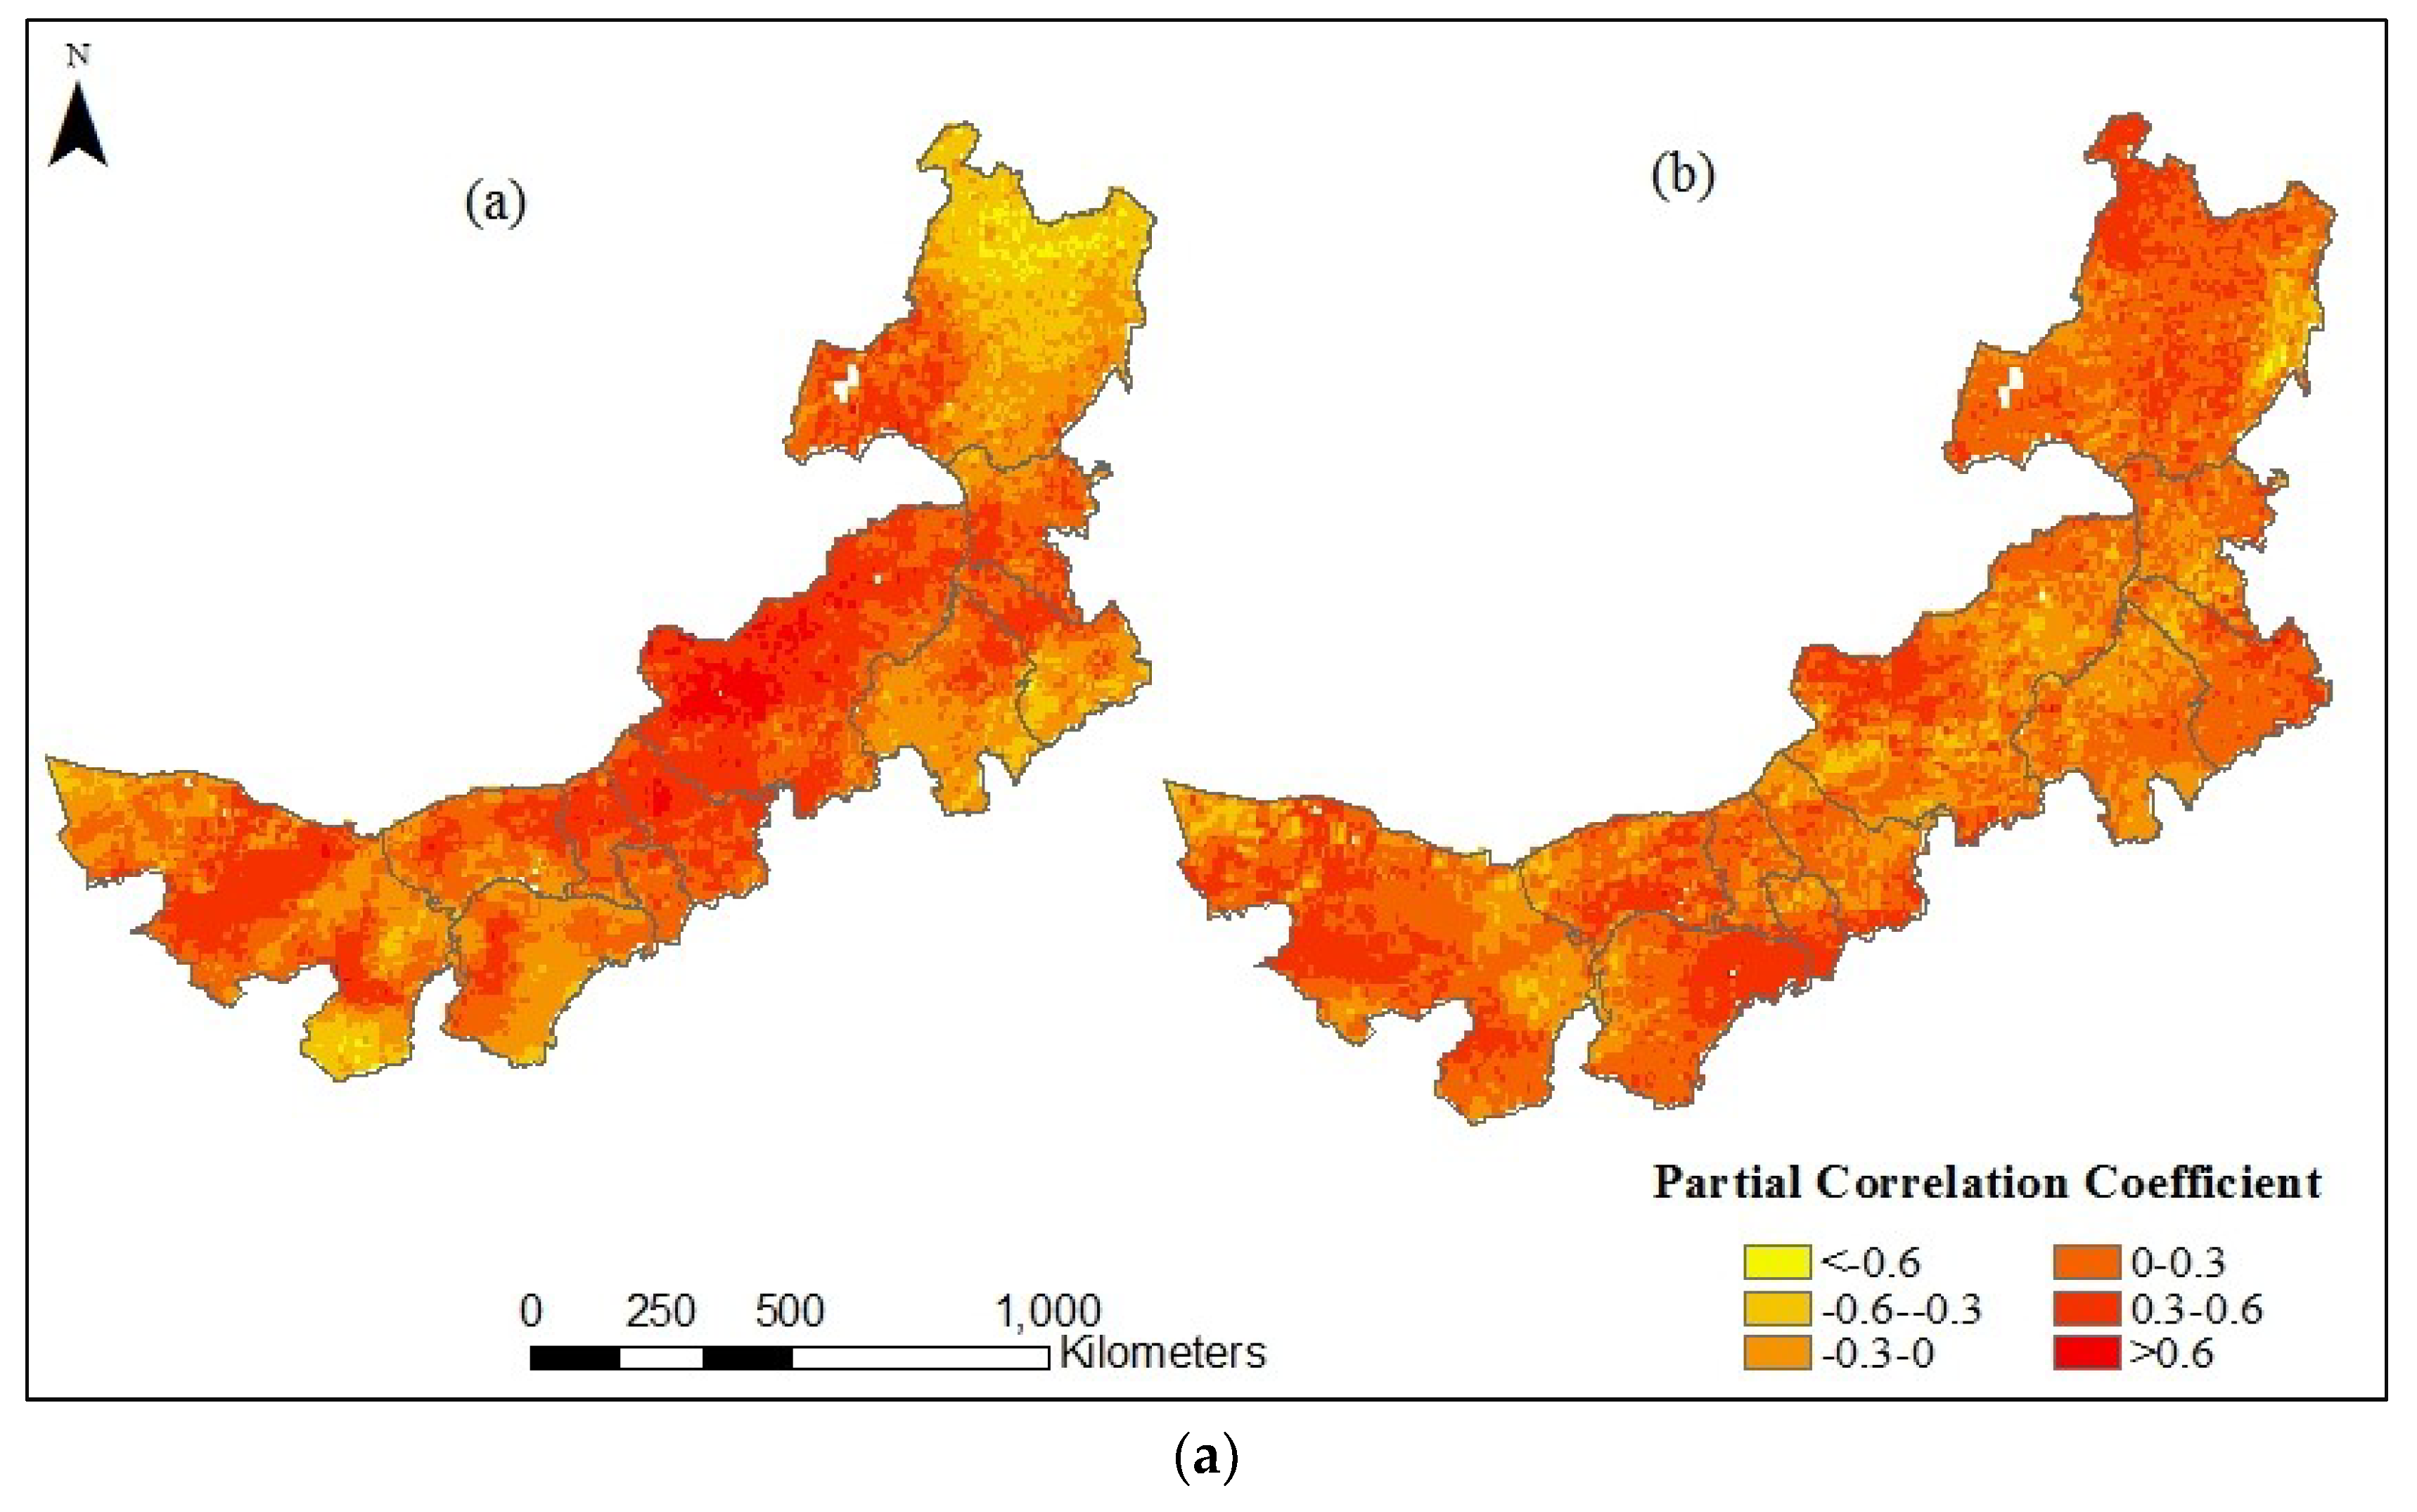
3.4.2. The Partial Correlation between NDVI and Climatic Factors based on an Annual Scale

In this paper, we defined the annual precipitation data as the sum of the monthly precipitation data and the average annual temperature as the average value of the monthly temperatures.
During 1982 to 2015, the temperature showed an increasing trend of 0.04 °C /a (−0.01–0.06 °C /a) in Inner Mongolia. Spatially, the area with an increasing trend accounted for 98.9%, and the regions in which the temperature was decreasing were mainly distributed in the southeast of Tongliao and Chifeng (Figure 9a). In the same period, the precipitation showed a slowly increasing trend (1.33 mm/a), among which the regions with decreasing and increasing trends accounted for 67.6% and 32.4%, respectively, with the increasing area mainly located in Alashan. This result is consistent with the findings from Meng et al. (which accounted for 70.0% and 30.0%, respectively) [70]. The precipitation gradually increases from the northeast to southwest of Inner Mongolia (Figure 9b) [70,75].
In order to validate the accuracy of the data and the reliability of the results, the partial correlation approach was used to detect the response of the vegetation NDVI to climatic factors. On the annual scale, the vegetation NDVI showed a good correlation with the temperature in our study period, and 70.2% of the area had a positive correlation (Figure 10a). Among that, 6.8% and 16.0% of the area passed the 0.01 and 0.05 significance tests, respectively (Figure 10c), and were mainly distributed in the central and northern regions of Hulunbuir, Abaga qi, and Sunite Zuo qi and in the east of the Ordos steppes, Wulate Qianqi, Alashan Youqi, and Eji’naqi. The NDVI is positively correlated to the area with 87.3% of the precipitation (Figure 10b), and those that pass the 0.01 and 0.05 significance tests account for differences of 46.9% and 15.1% (Figure 10d), respectively, which are mainly distributed in the west of Hulunbuir and the central and southwestern regions of Inner Mongolia.

4. Conclusions

The goal of this study was to combine the FFT algorithm and CEEMDAN method to study the cycles and residual information and to explore the relationship between the NDVI and climate time series in Inner Mongolia. We validated this combination method by applying it to the time-series GIMMS/NDVI3g data and temperature and precipitation data from 47 meteorological stations during April to October 1982–2015 in Inner Mongolia. We can draw several conclusions from this case study.
In terms of periodicity, the fluctuation period of the NDVI and temperature in the study area is one year and half a year, and the changing cycle of the NDVI and precipitation is only one year, showing that both temperature and precipitation are important factors affecting the vegetation change in the study area. In addition, due to increases in the residual component, we can determine that the vegetation maintained an increasing trend from 1982 to 2015 in the study area.
According to the annual scale, the vegetation NDVI experienced a slow and significant increasing tendency of 0.033%/10 a (P < 0.05) during 1982–2015. However, the change rate was different in different stages. The vegetation increased at 0.077%/10 a (P < 0.001) from 1982–2009, decreased at −0.06%/10 a (P < 0.1) during 1999–2009, and increased at 0.34%/10 a (P < 0.05) from 2009–2015.
Spatially, the vegetation NDVI increased in 1982–1999, decreased from 1999–2009, and increased in 2009–2015 in the northeastern part of Hulunbir in central Inner Mongolia. The NDVI showed a decreasing trend in 1982–1999 and an increasing trend from 1999–2015 in western Inner Mongolia. Overall, the area in which the vegetation significantly increased was mainly distributed in the east and south of Tongliao and Chifeng, in the north of Xing’anmeng, in the north and west of Hulunbir, and in the west of Inner Mongolia during 1982–2015.
The Hurst exponent revealed that the vegetation NDVI in most areas had a strong persistence that occupied approximately 82.3% of the region, but the remaining parts had an adverse persistence. The strong persistence areas, which are expected to prevail, are mainly located in the east of Hulunbuir, Tongliao, the southeast of Chifeng, the southeast of Ordos, and Alashan Youqi. However, the regions in the west and south of Xilin Gol and in the central region of Hulunbuir are more likely to experience vegetation degradation in the future.
Given the one-year cycle, the NDVI has a significant positive correlation with temperature and precipitation, and temperature is more important than precipitation in promoting vegetation growth. Given the half-year change period, the NDVI was only affected by temperature in the study region with which it was positively correlated (P < 0.05). The vegetation showed a good correlation with temperature based on the annual scale, and 70.2% of the area had a positive correlation, which was mainly distributed in the central and northern regions of Hulunbuir, Abaga qi, and Sunite Zuo qi and the east of the Ordos steppes, Wulate Qianqi, Alashan Youqi, and Eji’naqi. The NDVI is positively correlated with precipitation, and it is mainly distributed in the west of Hulunbuir and in the central and southwestern regions of Inner Mongolia.

Author Contributions

X.L., Z.T., and A.Z. (Anbing Zhang) performed the new model research and prepared the paper. A.Z. (Anzhou Zhao) and H.L. helped with the ground-based data and satellite remote sensing data collection and preprocessing.

Acknowledgments

This work is supported by the Key Research and Development Program of China (Grant #2017YFB0503602), by the Natural Science Foundation of Hebei Province (Grant #D2017402159/D2015402134) and the scientific research project of Hebei Provincial Department of Education (ZD2018230).

Conflicts of Interest

The authors declare no conflict of interest.

References

  1. Liu, R.; Shang, R.; Liu, Y.; Lu, X. Global evaluation of gap-filling approaches for seasonal ndvi with considering vegetation growth trajectory, protection of key point, noise resistance and curve stability. Remote Sens. Environ. 2017, 189, 164–179. [Google Scholar] [CrossRef]
  2. Peng, S.; Chen, A.; Xu, L.; Cao, C.; Fang, J.; Myneni, R.B.; Pinzon, J.E.; Tucker, C.J.; Piao, S. Recent change of vegetation growth trend in China. Environ. Res. Lett. 2011, 6, 044027. [Google Scholar] [CrossRef]
  3. Sun, W.; Song, X.; Mu, X.; Gao, P.; Wang, F.; Zhao, G. Spatiotemporal vegetation cover variations associated with climate change and ecological restoration in the Loess Plateau. Agric. For. Meteorol. 2015, 209–210, 87–99. [Google Scholar] [CrossRef]
  4. Zhao, A.; Zhang, A.; Lu, C.; Wang, D.; Wang, H.; Liu, H. Spatiotemporal variation of vegetation coverage before and after implementation of grain for green program in loess plateau, China. J. Nat. Resour. 2017, 104, 13–22. [Google Scholar] [CrossRef]
  5. Piao, S.; Wang, X.; Ciais, P.; Zhu, B.; Wang, T.; Liu, J. Changes in satellite-derived vegetation growth trend in temperate and boreal Eurasia from 1982 to 2006. Glob. Chang. Biol. 2011, 17, 3228–3239. [Google Scholar] [CrossRef]
  6. Wen, Z.; Wu, S.; Chen, J.; Lü, M. Ndvi indicated long-term interannual changes in vegetation activities and their responses to climatic and anthropogenic factors in the three gorges reservoir region, china. Sci. Total Environ. 2017, 574, 947–959. [Google Scholar] [CrossRef]
  7. De Keersmaecker, W.; Lhermitte, S.; Hill, M.; Tits, L.; Coppin, P.; Somers, B. Assessment of regional vegetation response to climate anomalies: A case study for australia using gimms ndvi time series between 1982 and 2006. Remote Sens. 2017, 9, 34. [Google Scholar] [CrossRef]
  8. Miao, C.; Yang, L.; Chen, X.; Gao, Y. The vegetation cover dynamics (1982–2006) in different erosion regions of the Yellow River Basin, China. Land Degrad. Dev. 2012, 23, 62–71. [Google Scholar] [CrossRef]
  9. Davis, C.L.; Hoffman, M.T.; Roberts, W. Long-term trends in vegetation phenology and productivity over namaqualand using the gimms avhrr ndvi3g data from 1982 to 2011. South Afr. J. Bot. 2017, 111, 76–85. [Google Scholar] [CrossRef]
  10. Ulsig, L.; Nichol, C.J.; Huemmrich, K.F.; Landis, D.R.; Middleton, E.M.; Lyapustin, A.I.; Mammarella, I.; Levula, J.; Porcar-Castell, A. Detecting inter-annual variations in the phenology of evergreen conifers using long-term modis vegetation index time series. Remote Sens. 2017, 9, 49. [Google Scholar] [CrossRef]
  11. Zhang, H.; Tang, H.; Yang, G.; Li, G.; Chen, B.; Xin, X. Changes of spatial-temporal characteristics based on MODIS NDVI data in Inner Mongolia grassland from 2000 to 2008. Trans. Chin. Soc. Agric. Eng. 2009, 25, 168–175. [Google Scholar]
  12. Sellers, P.J. Canopy reflectance, photosynthesis and transpiration. Int. J. Remote Sens. 1985, 6, 1335–1372. [Google Scholar] [CrossRef] [Green Version]
  13. Hope, A.S.; Boynton, W.L.; Stow, D.A.; Douglas, D.C. Interannual growth dynamics of vegetation in the kuparuk river watershed, alaska based on the normalized difference vegetation index. Int. J. Remote Sens. 2003, 24, 3413–3425. [Google Scholar] [CrossRef]
  14. Zhang, X.; Hu, Y.; Zhuang, D.; Qi, Y.; Ma, X. Ndvi spatial pattern and its differentiation on the mongolian plateau. J. Geogr. Sci. 2009, 19, 403–415. [Google Scholar] [CrossRef]
  15. De Beurs, K.M.; Henebry, G.M. Land surface phenology, climatic variation, and institutional change: Analyzing agricultural land cover change in Kazakhstan. Remote Sens. Environ. 2004, 89, 497–509. [Google Scholar] [CrossRef]
  16. Alcantara, C.; Kuemmerle, T.; Prishchepov, A.V.; Radeloff, V.C. Mapping abandoned agriculture with multi-temporal MODIS satellite data. Remote Sens. Environ. 2012, 124, 334–347. [Google Scholar] [CrossRef]
  17. Guo, X.; Zhang, H.; Wu, Z.; Zhao, J.; Zhang, Z. Comparison and evaluation of annual ndvi time series in china derived from the noaa avhrr ltdr and terra modis mod13c1 products. Sensors 2017, 17, 1298. [Google Scholar]
  18. Tong, S.; Zhang, J.; Bao, Y.; Lai, Q.; Lian, X.; Li, N.; Bao, Y. Analyzing vegetation dynamic trend on the mongolian plateau based on the hurst exponent and influencing factors from 1982–2013. J. Geogr. Sci. 2018, 28, 595–610. [Google Scholar] [CrossRef]
  19. Turner, B.L., II; Lambin, E.F.; Reenberg, A. From the cover land change science special feature:The emergence of land change science for global environmental change and sustainability. Proc. Natl. Acad. Sci. USA 2007, 104, 20666–20671. [Google Scholar] [CrossRef]
  20. Miao, L.; Luan, Y.; Luo, X.; Liu, Q.; John, C.M.; Reshmita, N.; He, B.; Zhu, F.; Cui, X. Analysis of the phenology in the Mongolian Plateau by inter-comparison of global vegetation datasets. Remote Sens. 2013, 5, 5193–5208. [Google Scholar] [CrossRef]
  21. Lee, R.; Yu, F.; Price, K.P.; Ellis, J.; Shi, P. Evaluating vegetation phenological patterns in Inner Mongolia using NDVI time series analysis. Int. J. Remote Sens. 2002, 23, 2505–2512. [Google Scholar] [CrossRef]
  22. Bhatt, U.S.; Walker, D.A.; Raynolds, M.K.; Bieniek, P.A.; Epstein, H.E.; Comiso, J.C.; Pinzon, J.E.; Tucker, C.J.; Steele, M.; Ermold, W. Changing seasonality of panarctic tundra vegetation in relationship to climatic variables. Environ. Res. Lett. 2017, 12, 055003. [Google Scholar] [CrossRef] [Green Version]
  23. Cao, X.J.; Gao, Q.Z.; Hasbagan, G.; Liang, Y.; Li, W.H.; Hu, G.Z. Influence of climatic factors on variation in the normalised difference vegetation index in mongolian plateau grasslands. Rangel. J. 2017, 40, 91–100. [Google Scholar] [CrossRef]
  24. Guo, L.; Wu, S.; Zhao, D.; Yin, Y.; Leng, G.; Zhang, Q. NDVI-Based Vegetation Chang in Inner Mongolia from 1982 to 2006 and Its Relationship to Climate at the Biome Scale. Adv. Meteorol. 2014. [Google Scholar] [CrossRef]
  25. Liu, B.; Henderson, M.; Zhang, Y.; Xu, M. Spatiotemporal change in China’s climatic growing season: 1955–2000. Clim. Chang. 2010, 99, 93–118. [Google Scholar] [CrossRef]
  26. Lu, N.; Wilske, B.; Ni, J.; John, R.; Chen, J. Climate change in Inner Mongolia from 1955 to 2005—Trends at regional, biome and local scales. Environ. Res. Lett. 2009, 4, 045006. [Google Scholar] [CrossRef]
  27. Gu, Z.; Duan, X.; Shi, Y.; Li, Y.; Pan, X. Spatiotemporal variation in vegetation coverage and its response to climatic factors in the red river basin, china. Ecol. Indic. 2018, 93, 54–64. [Google Scholar] [CrossRef]
  28. Sha, Z.; Bai, Y.; Xie, Y.; Yu, M.; Zhang, L. Using a hybrid fuzzy classifier (HFC) to map typical grassland vegetation in Xilin River Basin, Inner Mongolia, China. Int. J. Remote Sens. 2008, 29, 2317–2337. [Google Scholar] [CrossRef]
  29. Xie, Y.; Sha, Z. Quantitative analysis of driving factors of grassland degradation: A case study in Xilin River Basin, Inner Mongolia. The Sci. World J. 2012, 2012. [Google Scholar] [CrossRef]
  30. Bailing, M.; Li, Z.Y.; Liang, C.Z.; Wang, L.X.; Jia, C.Z.; Bao, F.X.; Chao, J. Temporal and spatial heterogeneity of drought impact on vegetation growth on the inner mongolian plateau. Rangel. J. 2018, 40, 113–128. [Google Scholar] [CrossRef]
  31. Zhang, A.; Xie, Y. Chaos Theory-Based Data-Mining Technique for Image Endmember Extraction: Laypunov Index and Correlation Dimension (L and D). IEEE Trans. Geosci. Remote Sens. 2014, 52, 1935–1947. [Google Scholar] [CrossRef]
  32. Xie, Y.; Sha, Z.; Bai, Y. Classifying historical remotely sensed imagery using a tempo-spatial feature evolution (T-SFE) model. ISPRS J. Photogramm. Remote Sens. 2010, 65, 182–190. [Google Scholar] [CrossRef]
  33. Li, S.; Xie, Y.; Brown, D.G.; Bai, Y.; Hua, J.; Judd, K. Spatial variability of the adaptation ofgrassland vegetation to climatic change in Inner Mongolia of China. Appl. Geogr. 2013, 43, 1–2. [Google Scholar] [CrossRef]
  34. Cao, X.; Gu, Z.H.; Jin, C.; Liu, J.; Shi, P.J. Analysis of human-induced steppe degradation based on remote sensing in Xilin Gole, Inner Mongolia, China. J. Plant Ecol. 2005, 30, 268–277. [Google Scholar]
  35. Hirano, A.; Batbileg, B. Identifying trends in the distribution of vegetation in mongolia in the decade after its transition to a market economy. Jpn. Agric. Res. Q. 2013, 47, 203–208. [Google Scholar] [CrossRef]
  36. Li, S.; Xie, Y. Investigating Coupled Impacts of Climate Change and Socioeconomic Transformation on Desertification by Using Multitemporal Landsat Images: A Case Study in Central Xilingol, China. IEEE Geosci. Remote Sens. Lett. 2013, 10, 1244–1248. [Google Scholar]
  37. Mu, S.; Yang, H.; Li, J.; Chen, Y.; Gang, C.; Zhou, W.; Ju, W. Spatio-temporal dynamics of vegetation coverage and its relationship with climate factors in inner mongolia, China. J. Geogr. Sci. 2013, 23, 231–246. [Google Scholar] [CrossRef]
  38. Guay, K.C.; Beck, P.S.; Berner, L.T.; Goetz, S.J.; Baccini, A.; Buermann, W. Wolfgang Buermann. Vegetation productivity patterns at high northern latitudes: A multi-sensor satellite data assessment. Glob. Chang. Biol. 2014, 20, 3147–3158. [Google Scholar] [CrossRef]
  39. Piao, S.; Mohammat, A.; Fang, J.; Cai, Q.; Feng, J. Ndvi-based increase in growth of temperate grasslands and its responses to climate changes in china. Glob. Environ. Chang. 2006, 16, 340–348. [Google Scholar] [CrossRef]
  40. Zhong, L.; Ma, Y.; Salama, M.S.; Su, Z. Assessment of vegetation dynamics and their response to variations in precipitation and temperature in the Tibetan Plateau. Clim. Chang. 2010, 103, 519. [Google Scholar] [CrossRef]
  41. Wang, J.; Rich, P.M.; Price, K.P. Temporal responses of ndvi to precipitation and temperature in the central great plains. USA Int. J. Remote Sens. 2003, 24, 20. [Google Scholar] [CrossRef]
  42. Fabricante, I.; Oesterheld, M.; Paruelo, J.M. Annual and seasonal variation of ndvi explained by current and previous precipitation across northern patagonia. J. Arid Environ. 2009, 73, 745–753. [Google Scholar] [CrossRef]
  43. Schultz, P.A.; Halpert, M.S. Global correlation of temperature, ndvi and precipitation. Adv. Space Res. 2009, 13, 277–280. [Google Scholar] [CrossRef]
  44. Li, Q.; Li, F.; Wu, L. A primary analysis on climatic change and grassland degradation in Inner Mongolia. Agric. Res. Arid Areas 2002, 20, 98–102. [Google Scholar]
  45. Han, F.; Kang, S.; Buyantuev, A.; Zhang, Q.; Niu, J.; Yu, D.; Ding, Y.; Liu, P.; Ma, W. Effects of climate change on primary production in the inner mongolia plateau, china. Int. J. Remote Sens. 2016, 37, 5551–5564. [Google Scholar] [CrossRef]
  46. Tucker, C.; Pinzon, J.; Brown, M.; Slayback, D.; Pak, E.; Mahoney, R.; Vermote, E.; Saleous, E. An extended AVHRR 8-km NDVI dataset compatible with MODIS and SPOT vegetation NDVI data. Int. J. Remote Sens. 2005, 26, 4485–4498. [Google Scholar] [CrossRef]
  47. Anyamba, A.; Small, J.L.; Tucker, C.J.; Pak, E.W. Thirty-two years of sahelian zone growing season Non-Stationary NDVI3g patterns and trends. Remote Sens. 2014, 6, 3101–3122. [Google Scholar] [CrossRef]
  48. Cooley, J.W.; Tukey, J.W. An algorithm for the machine calculation of complex fourier series. Math. Comput. 1965, 19, 297–301. [Google Scholar] [CrossRef]
  49. Guelachvili, G. Transform Spectrum; Peking University Press: Beijing, China, 1990; pp. 55–93. [Google Scholar]
  50. LÜ, N.; Chen, J.B. Fourier Optics; Science Press: Beijing, China, 1985; pp. 144–189. [Google Scholar]
  51. Pang, J.; Wen, J.; Zhao, M. The N = 2M FFT Algorithm for Decimation in Time. Opt. Precis. Eng. 1995, 480, 589–597. [Google Scholar]
  52. Torres, M.E.; Colominas, M.A.; Schlotthauer, G.; Flandrin, P. A complete ensemble empirical mode decomposition with adaptive noise. In Proceedings of the 2011 IEEE International Conference on Acoustics, Speech and Signal (ICASSP), Prague, Czech Republic, 22–27 May 2011; pp. 4144–4147. [Google Scholar]
  53. Huang, N.E.; Shen, Z.; Long, S.R.; Wu, M.C.; Shih, H.H.; Zheng, Q.; Yen, N.C.; Tung, C.C.; Liu, H.H. The empirical mode decomposition and the Hilbert spectrum for nonlinear and non-stationary time series analysis. Proc. R. Soc. Lond. A Math. Phys. Eng. Sci. 1998, 454, 903–995. [Google Scholar] [CrossRef]
  54. Rao, S.K.; Hsu, C.C.; Chan, K.K. Antenna system supporting multiple frequency bands and multiple beams. IEEE Trans. Antennas Propag. 2008, 56, 3327–3329. [Google Scholar] [CrossRef]
  55. Son, N.T.; Chen, C.F.; Chen, C.R.; Chang, L.Y.; Duc, H.N.; Nguyen, L.D. Prediction of rice crop yield using modis evi−lai data in the mekong delta, vietnam. Int. J. Remote Sens. 2013, 34, 18. [Google Scholar] [CrossRef]
  56. Wang, J.; Li, B.; Yu, W. Analysis of vegetation trend and their causes during recent 30 years in Inner Mongolia Autonomous Region. J. Arid Land Res. Environ. 2012, 26, 132–138. [Google Scholar]
  57. Stanley, W.D. Technical Analysis and Applications with Matlab; Cengage Learning: Boston, MA, USA, 2004; p. 143. ISBN 1401864813. [Google Scholar]
  58. Tom, A.R.; Miranda, P.M.A. Piecewise linear fitting and trend changing points of climate parameters. Geophys. Res. Lett. 2004, 31. [Google Scholar] [CrossRef] [Green Version]
  59. Sun, J.; Wang, X.; Chen, A.; Ma, Y.; Cui, M.; Piao, S. NDVI indicated characteristics of vegetation cover change in China’s metropolises over the last three decades. Environ. Monit. Assess. 2011, 179, 1–4. [Google Scholar] [CrossRef]
  60. Wang, G.; Zhou, K.; Sun, L.; Qin, Y.; Li, M. Study on the Vegetation Dynamic Change and R/S Analysis in the Past Ten Years in Xinjiang. Remote Sens. Technol. Appl. 2010, 25, 84–90. [Google Scholar]
  61. Yin, X.; Wang, S. Fractal Characteristics and Trend Forecast of Dust-Storms and Severe- Dust-Storms in Northern China. J. Desert Res. 2007, 27, 130–136. [Google Scholar]
  62. Miao, L.; Jiang, C.; Xue, B.; Liu, Q.; He, B.; Nath, R.; Cui, X. Vegetation dynamics and factor analysis in arid and semi-arid Inner Mongolia. Environ. Earth Sci. 2015, 73, 2343–2352. [Google Scholar] [CrossRef]
  63. Zhang, Q.Y.; Wu, S.H.; Zhao, D.S.; Dai, E.F. Responses of growing season vegetation changes to climatic factors in inner mongolia grassland. J. Nat. Resour. 2013, 28, 754–764. [Google Scholar]
  64. Chen, X.; Wang, H. Spatial and temporal variations of vegetation belts and vegetation cover degrees in inner mongolia from 1982 to 2003. Acta Geogr. Sin. 2009, 64, 84–94. [Google Scholar]
  65. Yang, Y.; Xu, J.; Hong, Y.; Lv, G. The dynamic of vegetation coverage and its response to climate factors in inner mongolia, china. Stoch. Environ. Res. Risk Assess. 2012, 26, 357–373. [Google Scholar] [CrossRef]
  66. Liu, X.F.; Zhu, X.F.; Pan, Y.Z.; Zhao, A.Z.; Li, Y.Z. Spatiotemporal changes of cold surges in Inner Mongolia between 1960 and 2012. J. Geogr. Sci. 2015, 25, 259–273. [Google Scholar] [CrossRef]
  67. Liu, Y.X.; Liu, X.F.; Hu, Y.N.; Li, S.S.; Peng, J.; Wang, Y.L. Analyzing nonlinear variations in terrestrial vegetation in China during 1982–2012. Environ. Monit. Assess 2015, 187, 722. [Google Scholar] [CrossRef] [PubMed]
  68. Du, J.Q.; Zhao, C.X.; Shu, J.M.; Jiaerheng, A.; Yuan, X.J.; Yin, J.Q.; Fang, S.F.; He, P. Spatiotemporal changes of vegetation on the Tibetan Plateau and relationship to climatic variables during multiyear periods from 1982–2012. Environ. Earth Sci. 2015, 75, 77. [Google Scholar] [CrossRef]
  69. Zhao, Y.; Zhang, X.; Wang, J.; Shen, Z. Correlation analysis between ndvi and climatic factors of grassland ecosystems in the northern tibetan plateau from 1982 to 2003. Resour. Sci. 2009, 31, 1988–1998. [Google Scholar]
  70. Meng, M.; Zheng, N. Change characteristic of ndvi and its response to climate change in inner mongolia over the past 30 years. Remote Sens. Technol. Appl. 2018, 33, 676–685. [Google Scholar]
  71. Bai, M.; Hao, R.; Xicang, L.I.; Yang, J. Variable characteristics of extreme climate events during 1961–2010 in inner mongolia. J. Arid Meteorol. 2014, 32, 189–193. [Google Scholar]
  72. Bao, Y.; Li, X.B.; Li, C. Spatial temporal distribution characteristics of temperature in Inner Mongolia during 1961–2007. J. Arid Land Resour. Environ. 2010, 24, 80–84. [Google Scholar]
  73. Zhang, L.Y.; Liu, A.J.; Xin, Q.; Liu, D.F.; Gan, W. Trend and analysis of vegetation variation of typical rangeland in inner Mongolia-A case study of typical rangeland of Xinlinguole. J. Arid Land Resour. Environ. 2006, 20, 185–190. [Google Scholar]
  74. Yang, Q.; Wang, T.; Chen, H.; Wang, Y. Characteristics of vegetation cover change in xilin gol league based on modis evi data. Trans. Chin. Soc. Agric. Eng. 2015, 31, 191–198. [Google Scholar]
  75. Zhou, X.Y. The Impacts of Climate Change and Land Use on Vegetation Cover in Mongolia Plateau; Beijing Forestry University: Beijing, China, 2014. [Google Scholar]
Figure 1. The geographic extent of Inner Mongolia and the distribution of meteorological stations therein. Note: I: Hulunbur; II: Xing’anmeng; III: Tongliao; IV: Chifeng; V: Xilin Gol; VI; Ulanchabu; VII: Hohhot; VIII: Baotou; IX: Bayannur; X: Ordos; XI:Wuhai; and XII: Alashan.
Sustainability 11 00768 g001
Figure 2. The spectrum of the simulation signal and the Intrinsic Mode Function (IMF) component results: (a) The spectrum of the simulation signal is constructed by the Fast Fourier Transform (FFT) algorithm. The abscissa represents the frequency, and the ordinate indicates the amplitude; (b) the original simulation signal; (cg) the first IMF component to the fifth; and (h) the sum of IMF3, IMF4, and IMF5, showing the entire trend of the decomposed signal.
Sustainability 11 00768 g002
Figure 3. The spectrum of the normalized difference vegetation index (NDVI) time series by FFT and the decomposed result by Complete Ensemble Empirical Mode Decomposition with Adaptive Noise (CEEMDAN) in the Inner Mongolia region from 1982–2015 (April to October): (a) The NDVI spectrum; (b) the original NDVI time series; (c) the IMF1 component; (d) the IMF2 component; (e) the residual component, which is the sum of the left-hand side components that do not contain the IMF1 or IMF2 components; and (f) the residual components that do not contain the IMF1 component.
Sustainability 11 00768 g003
Figure 4. The temperature spectrum by FFT and its decomposed result by CEEMDAN in the Inner Mongolia region: (a) the temperature spectrum; (b) the original temperature data; (c) the IMF1 component; (d) the IMF2 component; (e) the residual component, which is the sum of the left-hand side components that do not contain the IMF1 or IMF2 components; and (f) the residual component that does not contain the IMF1 component.
Sustainability 11 00768 g004
Figure 5. The spectrum of precipitation by FFT and its decomposed result by CEEMDAN in the Inner Mongolia region: (a) the precipitation spectrum; (b) the original precipitation data; (c) the IMF1 component; and (d) the residual component that does not contain the IMF1 component.
Sustainability 11 00768 g005
Figure 6. The interannual variation in the annual NDVI during three stages in the Inner Mongolia region during 1982–2015. The slope is the change rate of vegetation growth, and P represents the significance degree. The closer the P value is to 0, the more significant it is.
Sustainability 11 00768 g006
Figure 7. The trend and significance of the vegetation NDVI in Inner Mongolia during (a,e) 1982–1999, (b,f) 1999–2009, (c,g) 2009–2015, and (d,h) 1982–2015. The red color represents a significant decrease in the NDVI, and the green color represents a significant increase in the NDVI.
Sustainability 11 00768 g007aSustainability 11 00768 g007b
Figure 8. The spatial distributions of the Hurst index in the Inner Mongolia region.
Sustainability 11 00768 g008
Figure 9. The spatial distribution of the change tendency in (a) the annual mean temperature and (b) the annual cumulative precipitation in the Inner Mongolia region from 1982–2015.
Sustainability 11 00768 g009
Figure 10. The spatial distribution of the partial correlation coefficients and significance tests between (a–c) the yearly NDVI and temperature and (bd) the precipitation.
Sustainability 11 00768 g010aSustainability 11 00768 g010b
Table 1. The linear trend results of the NDVI in Inner Mongolia during 1982–2015.
Area/km2Area Percentage/%
PRank1982–19991999–20092009–20151982–20151982–19991999–20092009–20151982–2015
<0.01Extremely Significant Degradation2944/768196,5440.26%/0.07%17.24%
<0.05Significant Degradation4352/460815,6160.38%/0.40%1.37%
<0.1Weakly Significant Degradation2624/774468480.23%/0.68%0.60%
>0.1No Significant Degradation155,200601,728179,13640,64013.62%52.78%15.71%3.57%
>0.1No Significant Improvement549,952538,368604,73644,09648.24%47.22%53.03%3.87%
<0.1Weak Improvement100,416/105,40881288.81%/9.24%0.71%
<0.05Significant Improvement132,352/162,43219,39211.61%/14.24%1.70%
<0.01Extremely Significant Improvement192,064/75,584808,57616.85%/6.63%70.94%
Total1,139,9041,140,0961,140,4161,139,840100.00%100.00%100.00%100.00%
Table 2. The Hurst index trend in the Inner Mongolia region.
HRankArea/km2Area Percentage/%
<0.2Anti-persistent strong160641.41%
0.2~0.35Anti-persistent stronger501764.42%
0.35~0.5Anti-persistent weakness13510411.90%
0.5~0.65Persistent weakness26790423.58%
0.65~0.75Persistent stronger23744020.91%
>0.75Persistent strong42905637.78%
Total1135744100.00%
Table 3. The partial correlation and correlation coefficient among the NDVI, temperature, and precipitation in Inner Mongolia. The partial correlation is based on three aspects: (1) the original data; (2) the IMF1 component; and (3) the residual that does not contain the IMF1 component. The correlation is based on two aspects: (1) the IMF2 component and (2) the residual that does not contain IMF1 or IMF2.
Partial Correlation CoefficientCorrelation Coefficient
NDVIOriginal dataIMF1Residual (no IMF1)IMF2Residual (no IMF1 or IMF2)
Temperature0.8940.920.5820.651 **0.135 *
Precipitation0.5260.672−0.057//
Note: (* and **) means significant at P = 0.05 and 0.01, respectively, in the correlation analysis.

