Risk-Perception Formation Considering Tangible and Non-Tangible Aspects of Cycling: A Flemish Case Study


Abstract
1. Introduction
2. Literature Review
3. Materials and Methods
4. Results
5. Discussion
6. Conclusions
Author Contributions
Funding
Acknowledgments
Conflicts of Interest
Abbreviations
| EU | European Union |
| TDMs | transportation development measures |
| w. r. t. | With respect to |
| VRUs | vulnerable road users |
Appendix A

| Investigated Variables under Different Age—Group Categories | Total | 18–25 | 25–40 | 40–65 | ||||
|---|---|---|---|---|---|---|---|---|
| Frequency | Percentage | Frequency | Percentage | Frequency | Percentage | Frequency | Percentage | |
| Socio-demographics | ||||||||
| Gender | ||||||||
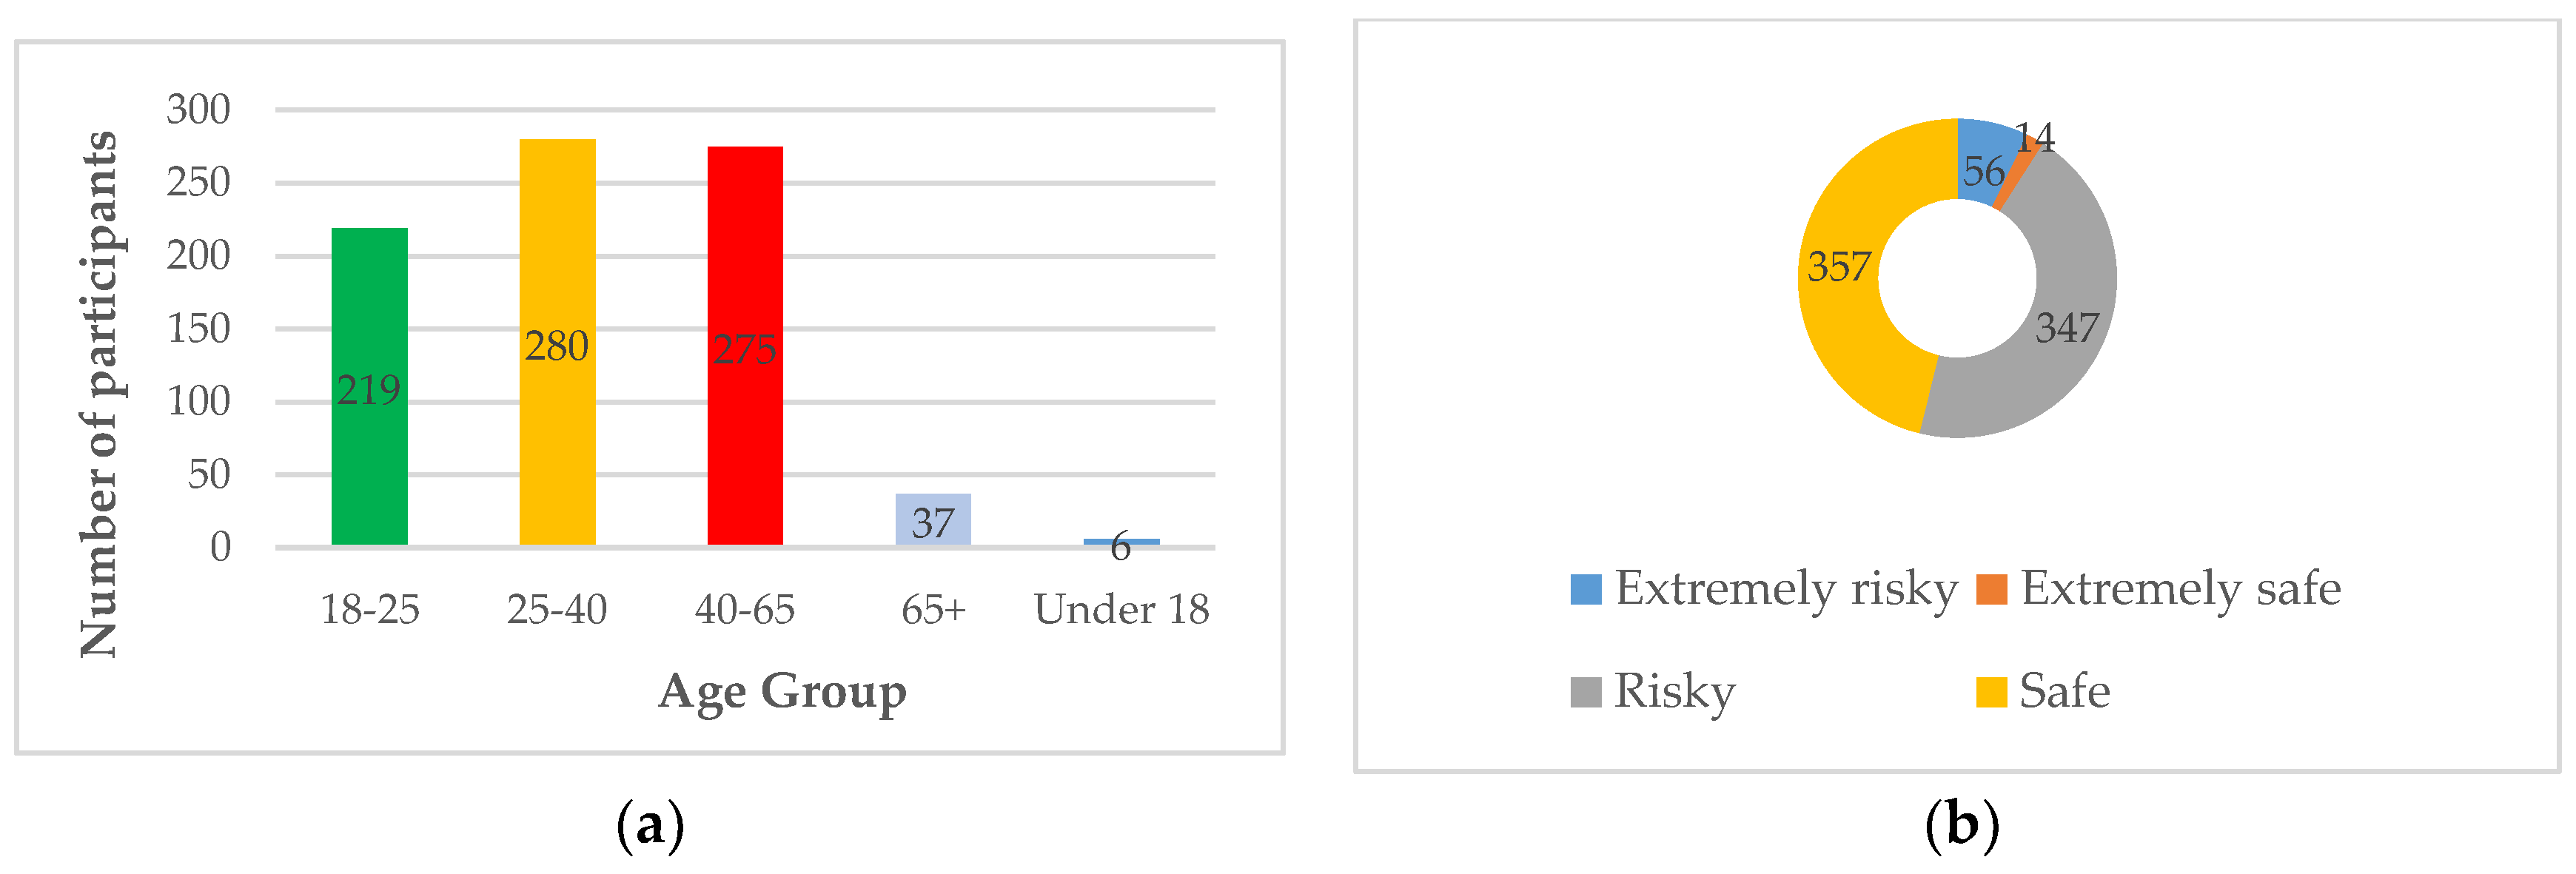
| Female | 434 | 56 | 129 | 59 | 141 | 50 | 164 | 60 |
| Male | 335 | 43 | 90 | 41 | 135 | 48 | 110 | 40 |
| Prefer not to reveal | 5 | 0.6 | 4 | 1.4 | 1 | 0.4 | ||
| Education | ||||||||
| Bachelors | 284 | 37 | 82 | 0.4 | 84 | 30 | 118 | 43 |
| High school diploma, i.e., ASO, BSO, TSO, KSO | 139 | 18 | 86 | 0.4 | 18 | 6.4 | 35 | |
| Masters or higher | 316 | 41 | 43 | 0.2 | 168 | 60 | 105 | 38 |
| Other | 16 | 2.1 | 3 | 0 | 6 | 2.1 | 7 | 2.5 |
| PhD | 1 | 0.1 | 0 | 1 | 0.4 | 0 | ||
| Technical Diploma | 18 | 2.3 | 5 | 0 | 3 | 1.1 | 10 | 3.6 |
| Distance | ||||||||
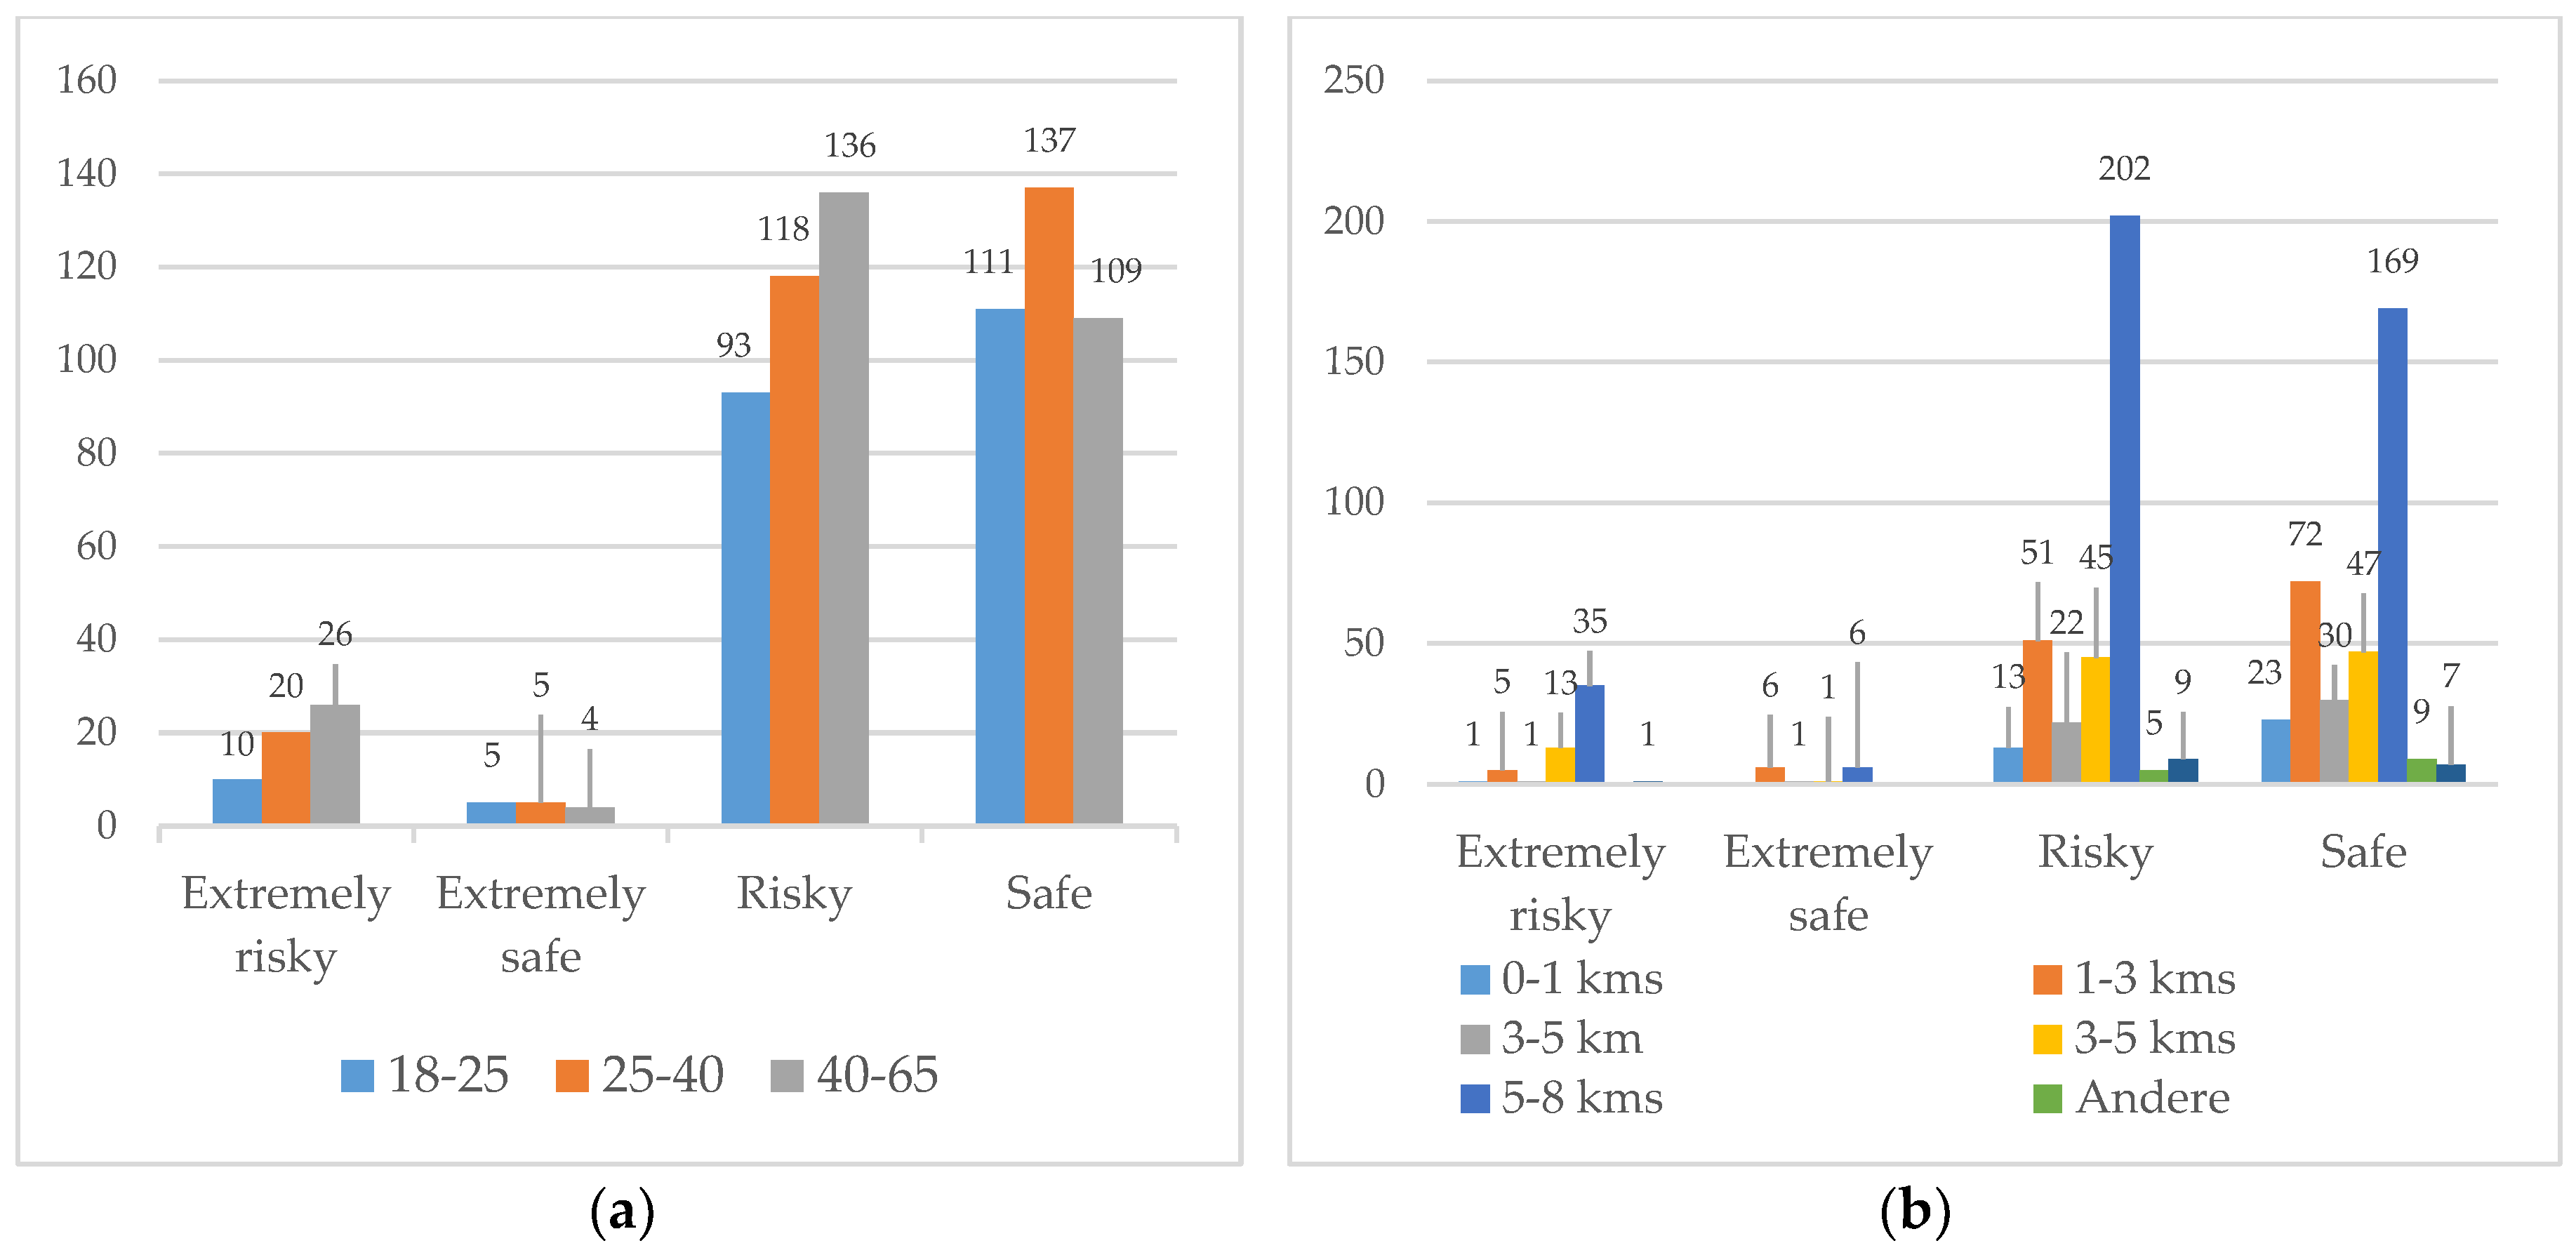
| 0–1 km | 37 | 4.8 | 23 | 11 | 9 | 3.2 | 5 | 1.8 |
| 1–3 km | 134 | 17 | 63 | 29 | 43 | 15 | 28 | 10 |
| 3–5 km | 160 | 21 | 14 | 6.4 | 31 | 11 | 9 | 3.3 |
| 5–8 km | 412 | 53 | 31 | 14 | 34 | 12 | 41 | 15 |
| Other | 14 | 1.8 | 82 | 37 | 149 | 53 | 181 | 66 |
| More than 8 km | 17 | 2.2 | 1 | 0.5 | 5 | 1.8 | 8 | 2.9 |
| Attitudes toward specific stimuli | ||||||||
| Motivation for bicycle use | ||||||||
| All of the above | 2 | 0.3 | 0 | 2 | 0.7 | 0 | ||
| Better accessibility and no parking worries | 325 | 42 | 86 | 0.4 | 125 | 45 | 114 | 41 |
| Cheaper than public transport/car | 94 | 12 | 42 | 0.2 | 31 | 11 | 21 | 7.6 |
| Good for the environment, cheap, healthy, no queuing | 7 | 0.9 | 2 | 0 | 4 | 1.4 | 1 | 0.4 |
| Incentives offered by employer/school | 40 | 5.2 | 3 | 0 | 19 | 6.8 | 18 | 6.5 |
| It’s healthy | 5 | 0.6 | 1 | 0 | 4 | 1.4 | 0 | |
| Lesser congestion or long queuing | 110 | 14 | 31 | 0.1 | 39 | 14 | 40 | 15 |
| Other | 186 | 24 | 53 | 0.2 | 52 | 19 | 81 | 29 |
| quicker than public transport, autonomy | 5 | 0.6 | 1 | 0 | 4 | 1.4 | 0 | |
| Attitudes toward problems related cycling | ||||||||
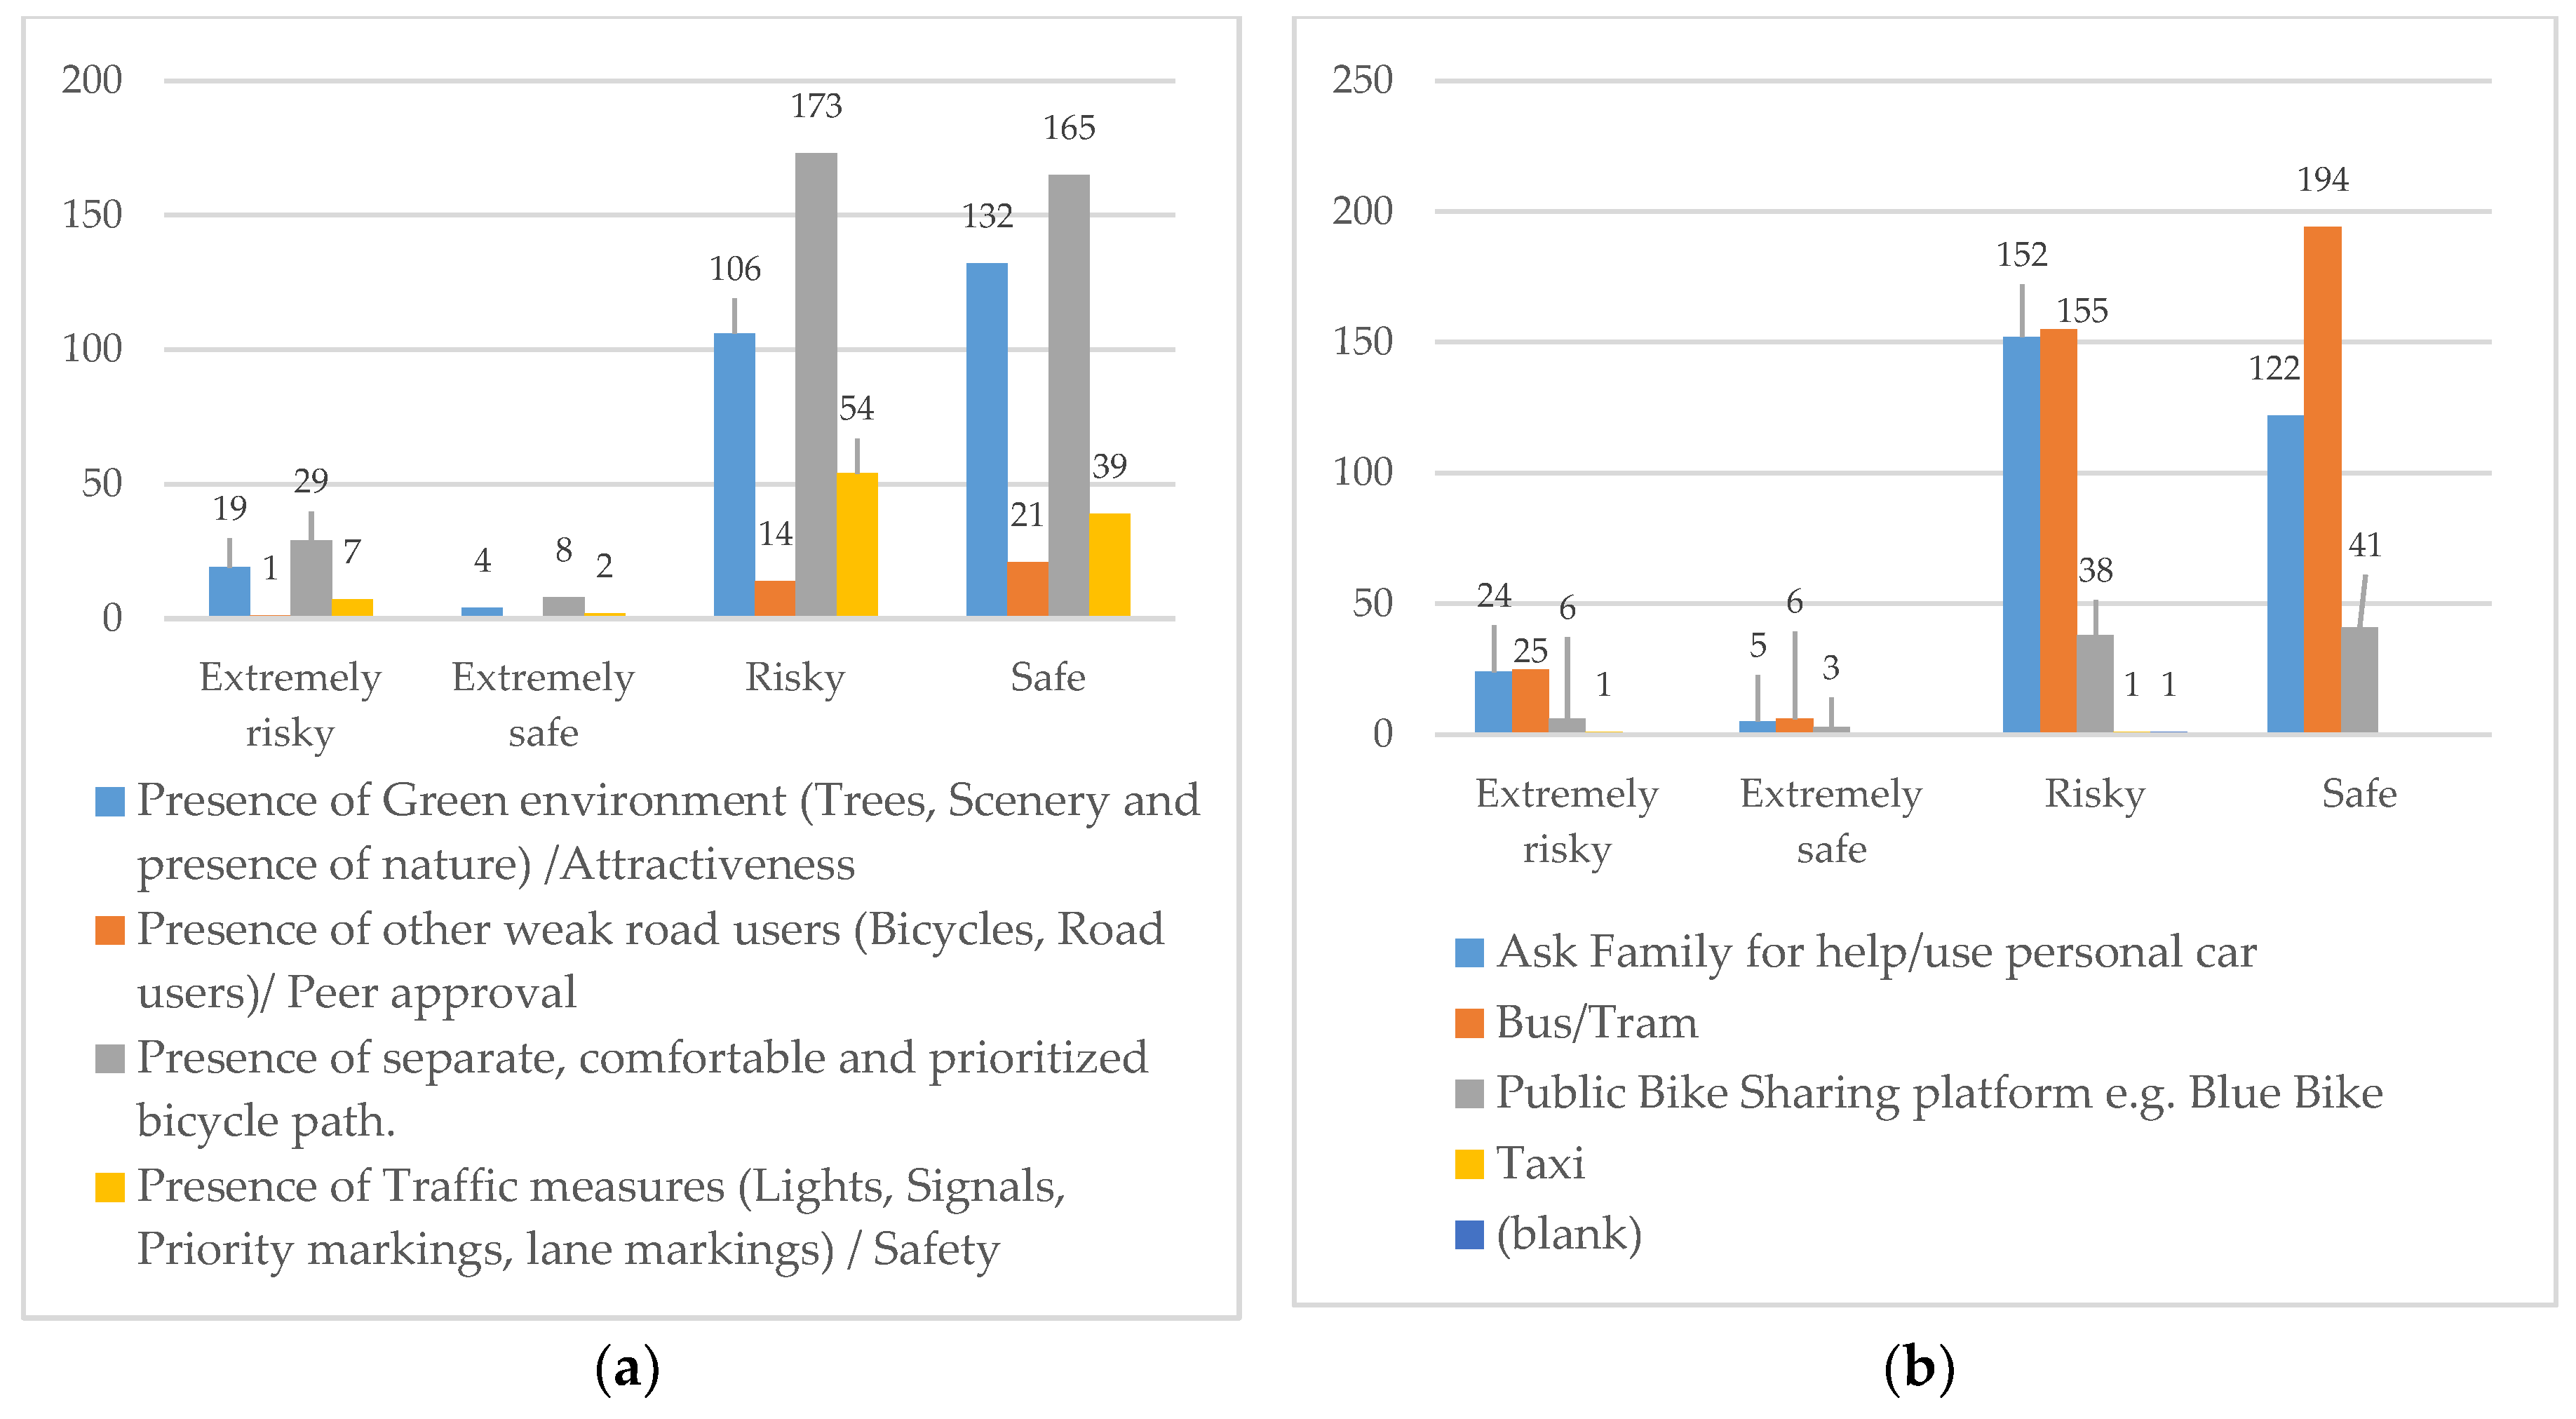
| Ask Family for help/use personal car | 303 | 39 | 145 | 0.2 | 69 | 25 | 89 | 32 |
| Bus/Tram | 380 | 49 | 133 | 0.6 | 153 | 55 | 94 | 34 |
| Public Bike Sharing platform, e.g., Blue Bike | 88 | 11 | 17 | 0.1 | 38 | 14 | 33 | 12 |
| Taxi | 2 | 0.3 | 0 | 0 | 2 | 0.7 | ||
| Attitude toward new mobility regulations | ||||||||
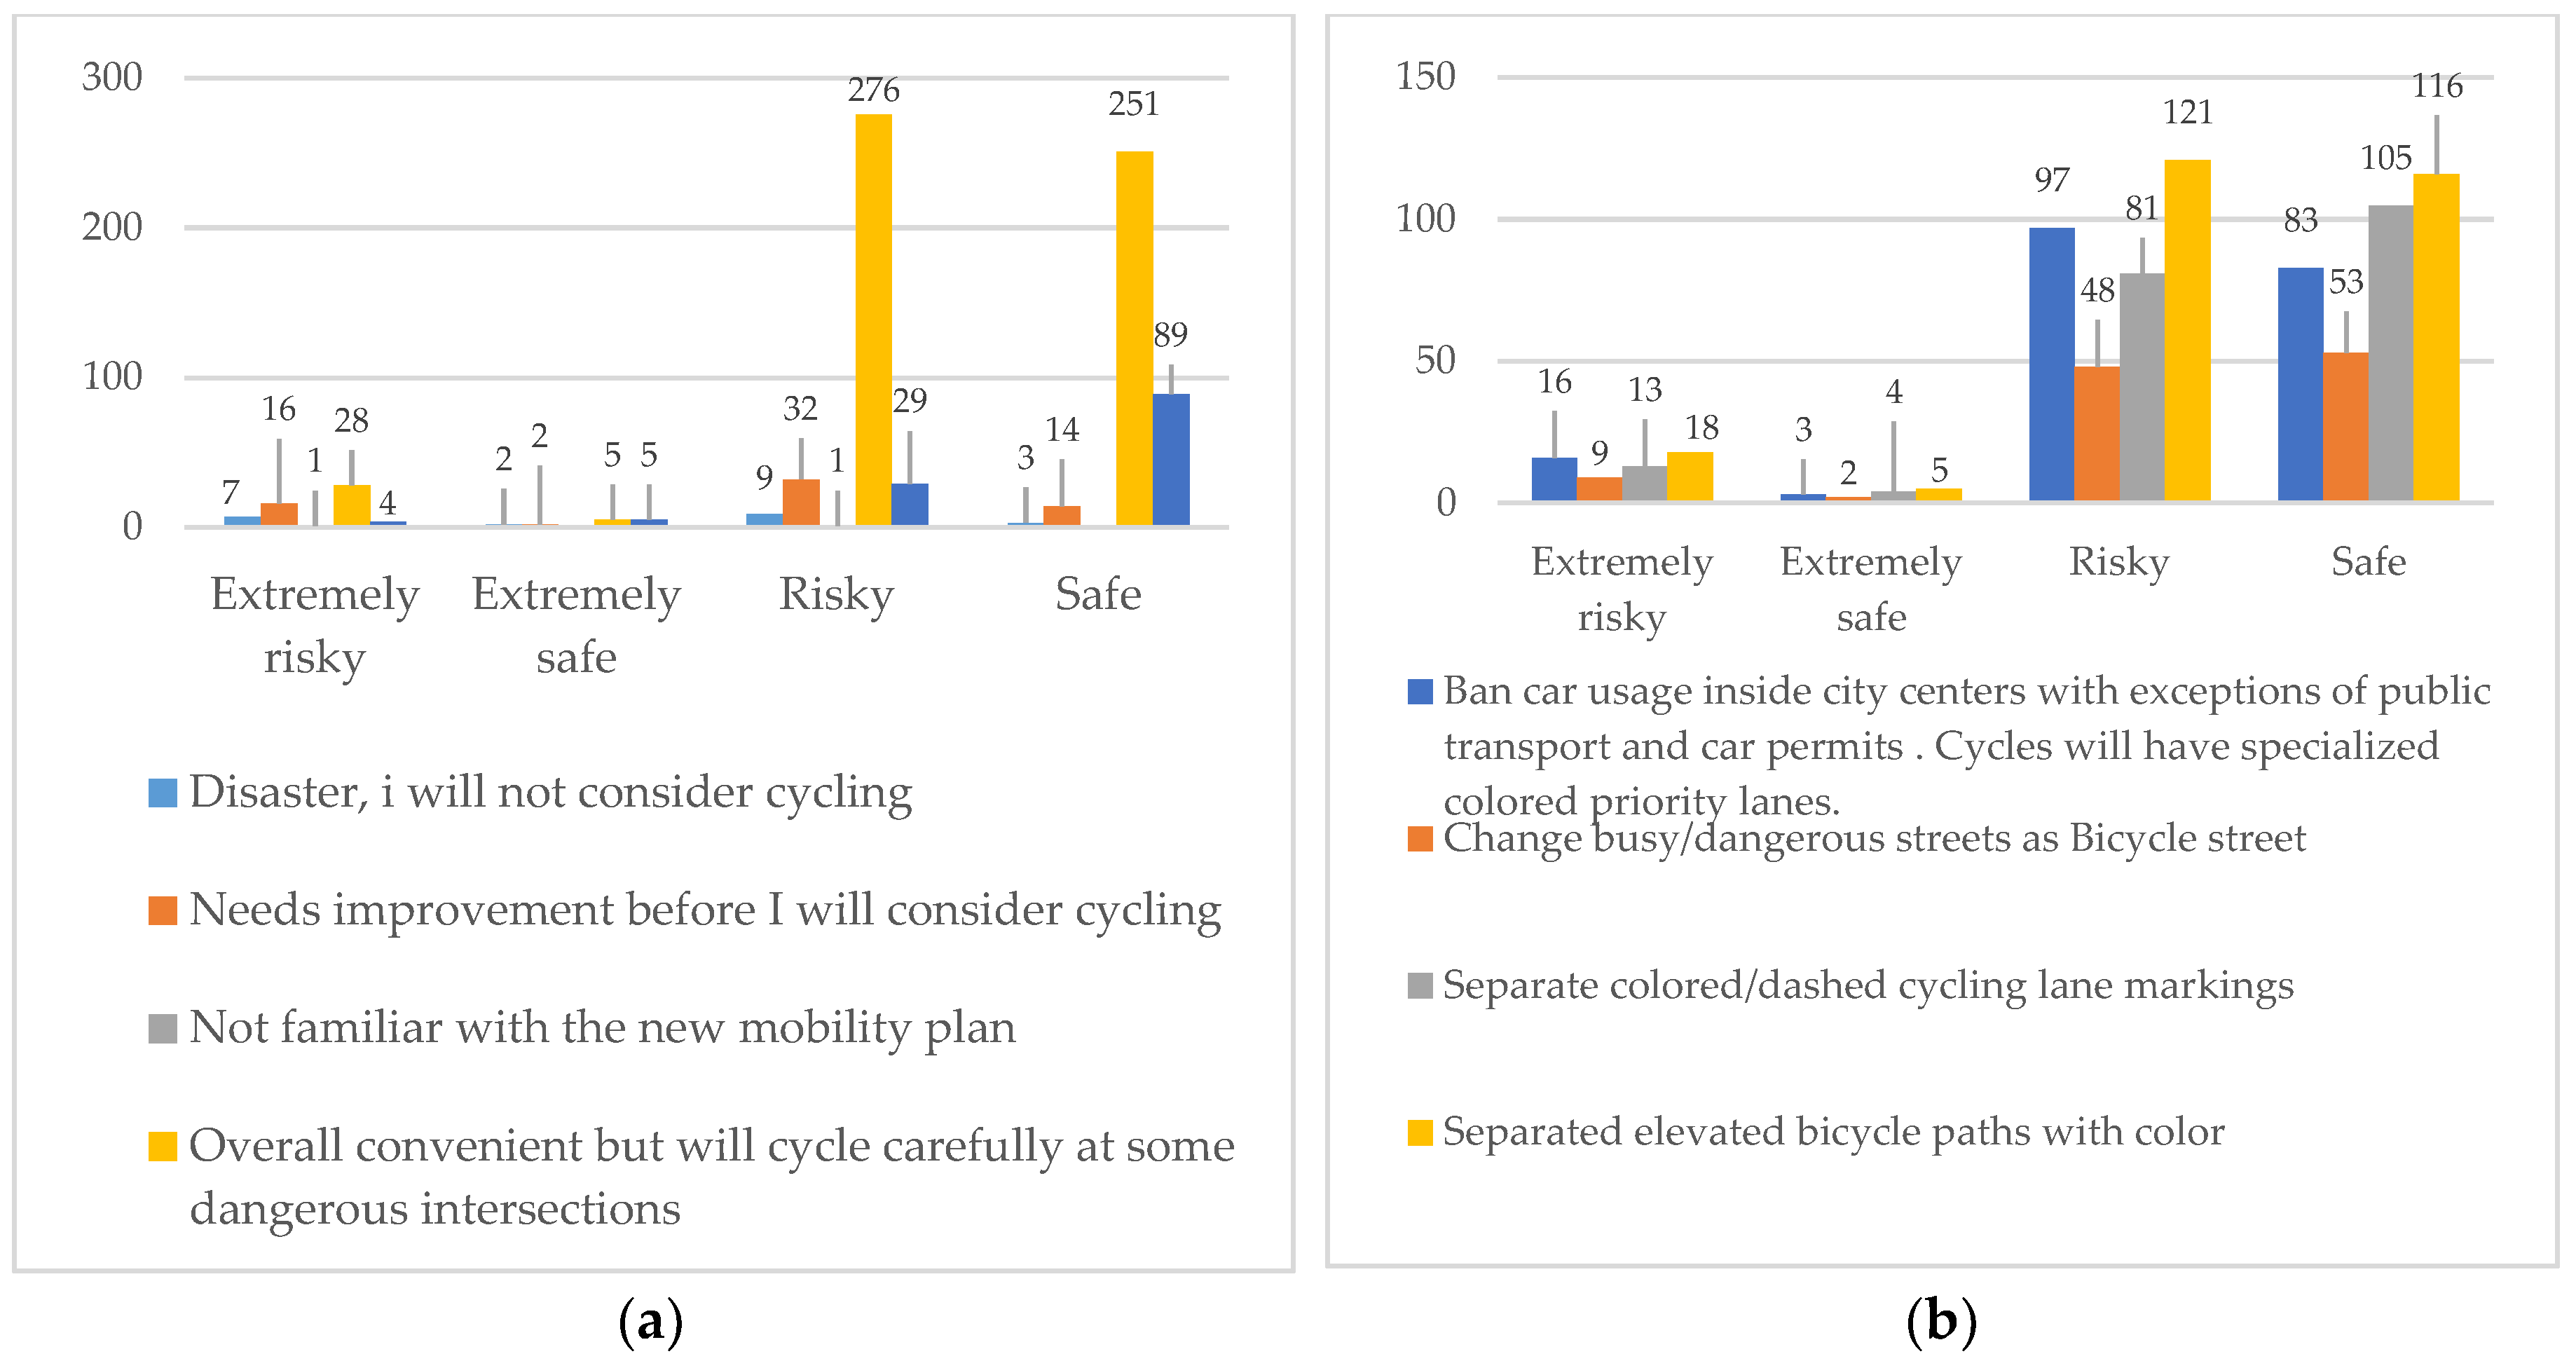
| Disaster, I will not consider cycling | 21 | 2.7 | 5 | 0 | 9 | 3.2 | 7 | 2.5 |
| Needs improvement before I will consider cycling | 64 | 8.3 | 10 | 0 | 28 | 10 | 26 | 9.5 |
| Not familiar with the new mobility plan | 2 | 0.3 | 0 | 0 | 2 | 0.7 | 0 | 0 |
| Overall convenient but will cycle carefully at some dangerous intersections | 560 | 72 | 159 | 0.7 | 189 | 68 | 212 | 77 |
| Safe and will cycle every day | 127 | 16 | 45 | 0.2 | 52 | 19 | 30 | 11 |
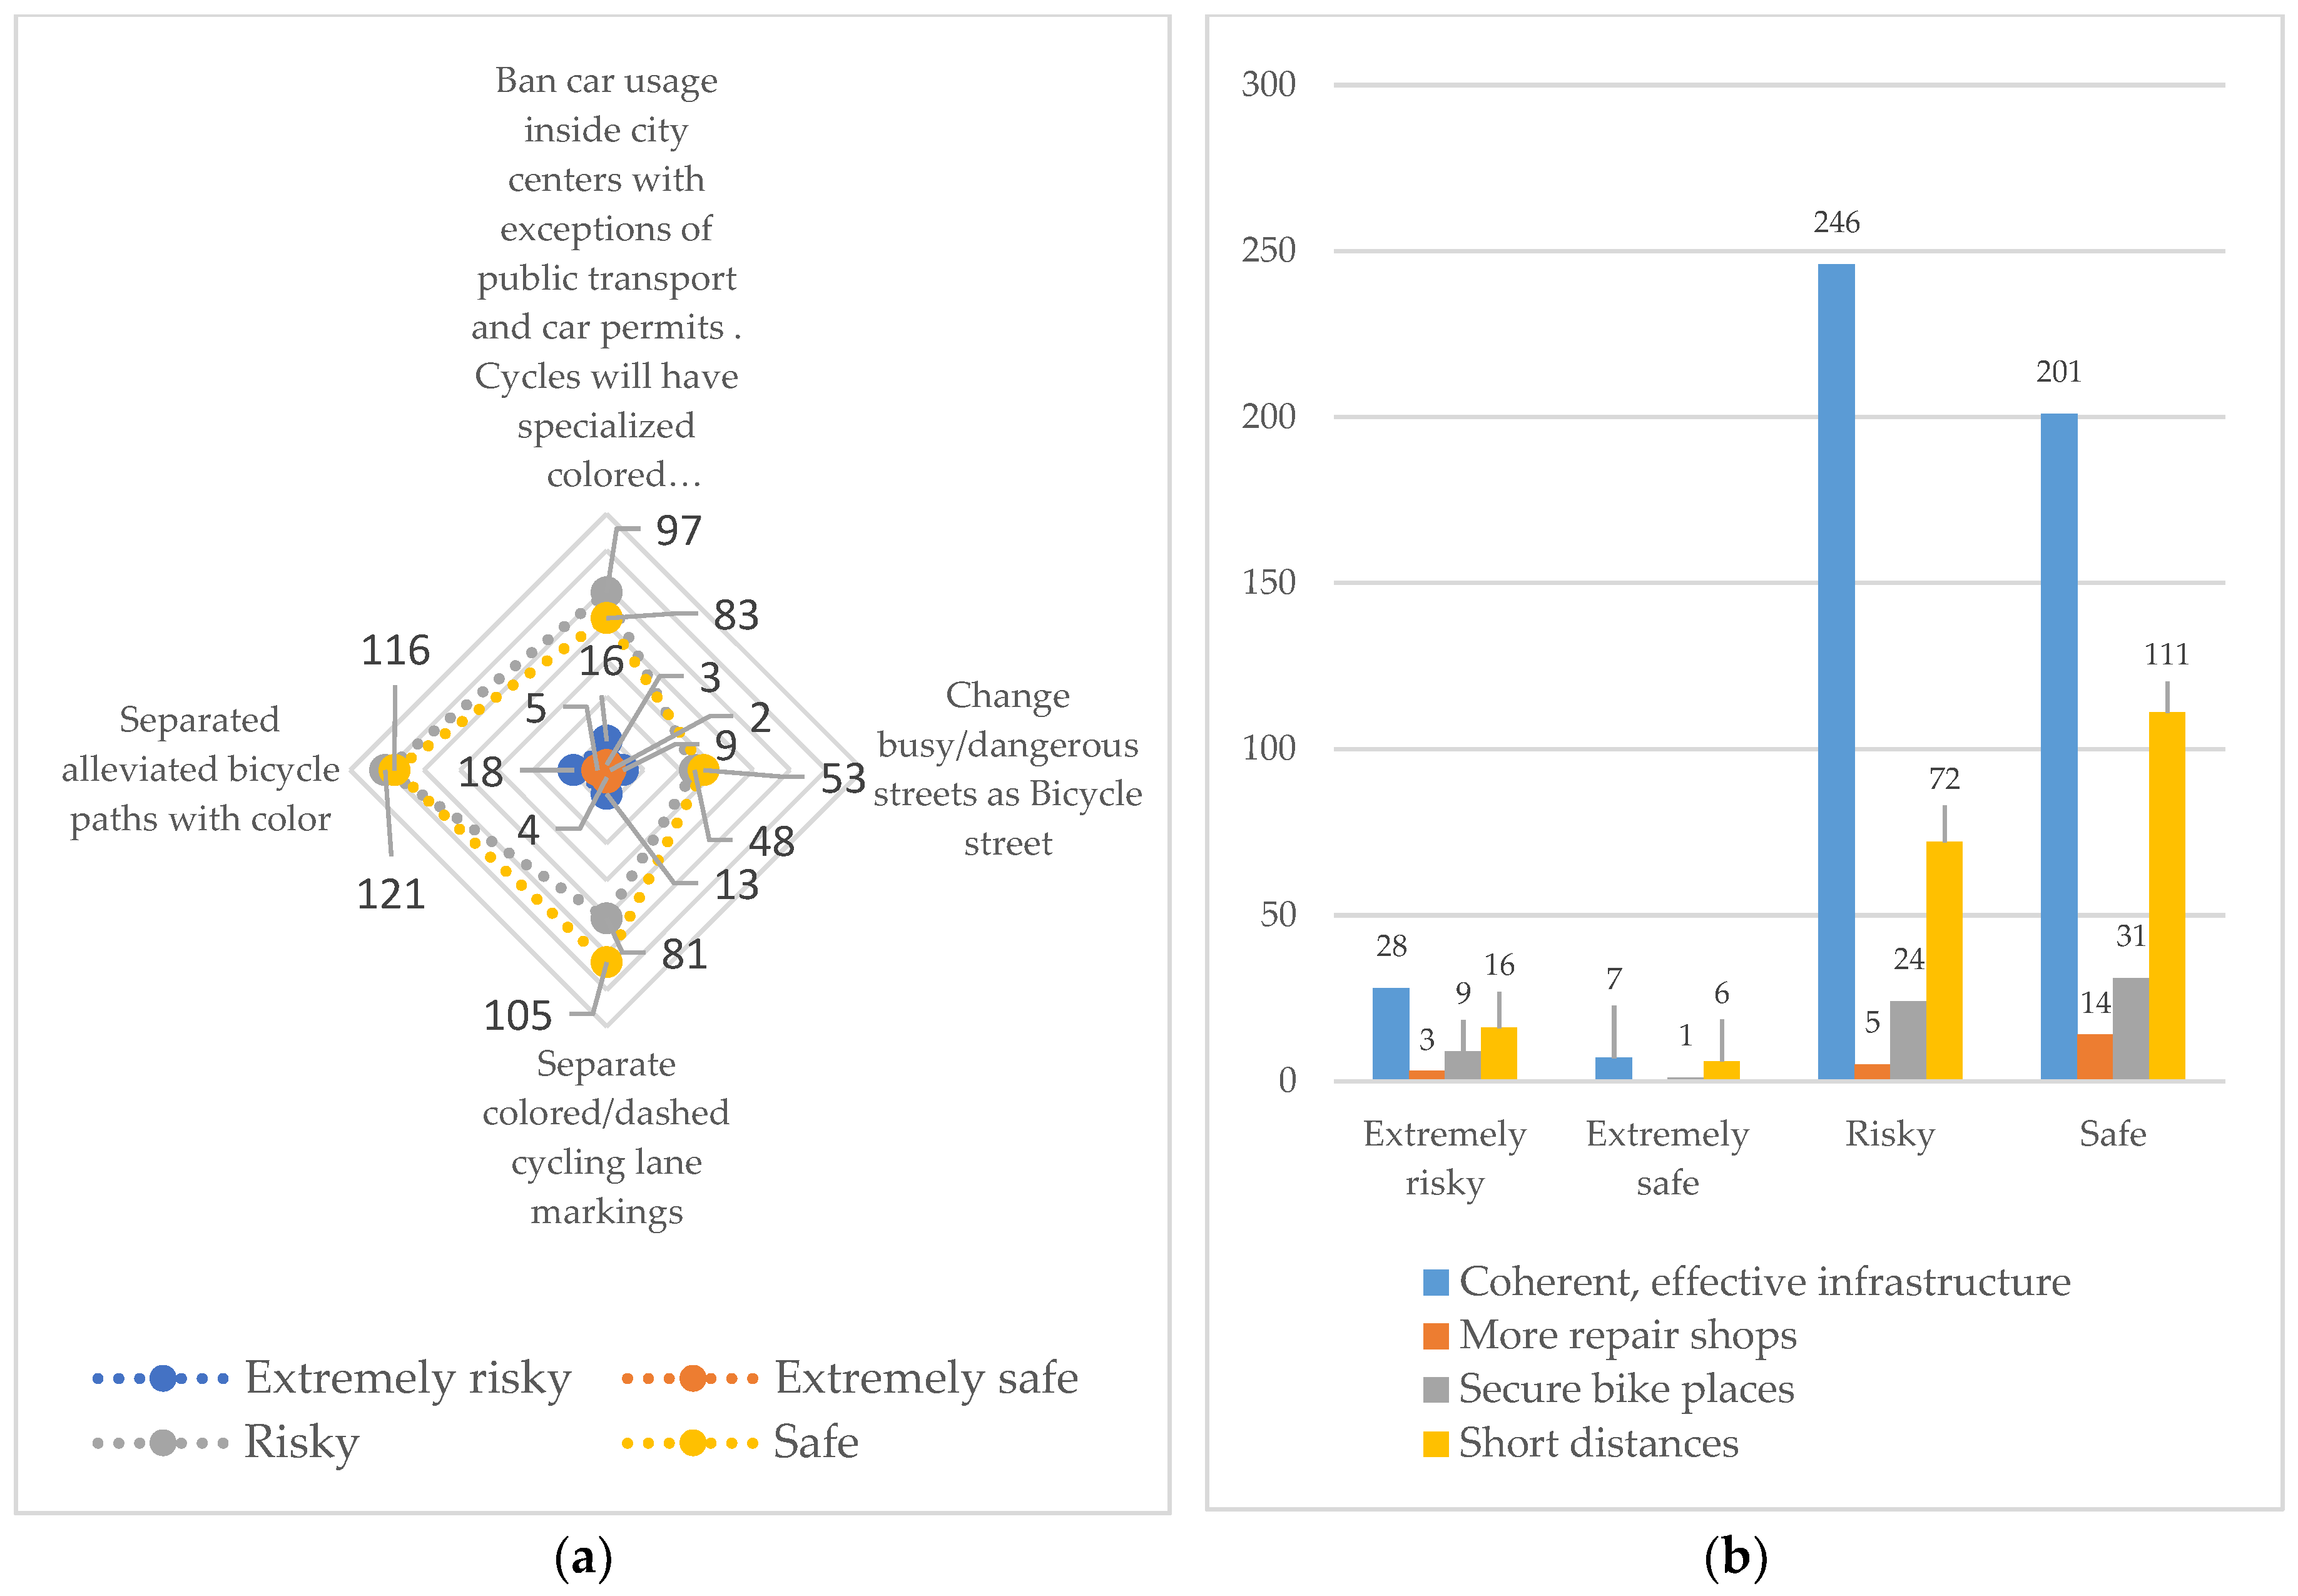
| Suggestions for improving safety at intersections | ||||||||
| Ban car usage inside city centers with exceptions of public transport and car permits. Cyclists will have specialized colored priority lanes. | 199 | 26 | 43 | 0.2 | 84 | 30 | 72 | 26 |
| Change busy/dangerous streets as Bicycle street | 112 | 14 | 32 | 0.1 | 39 | 14 | 41 | 15 |
| Separate colored/dashed cycling lane markings | 203 | 26 | 69 | 0.3 | 67 | 24 | 67 | 24 |
| Separated alleviated bicycle paths with color | 260 | 34 | 75 | 0.3 | 90 | 32 | 95 | 35 |
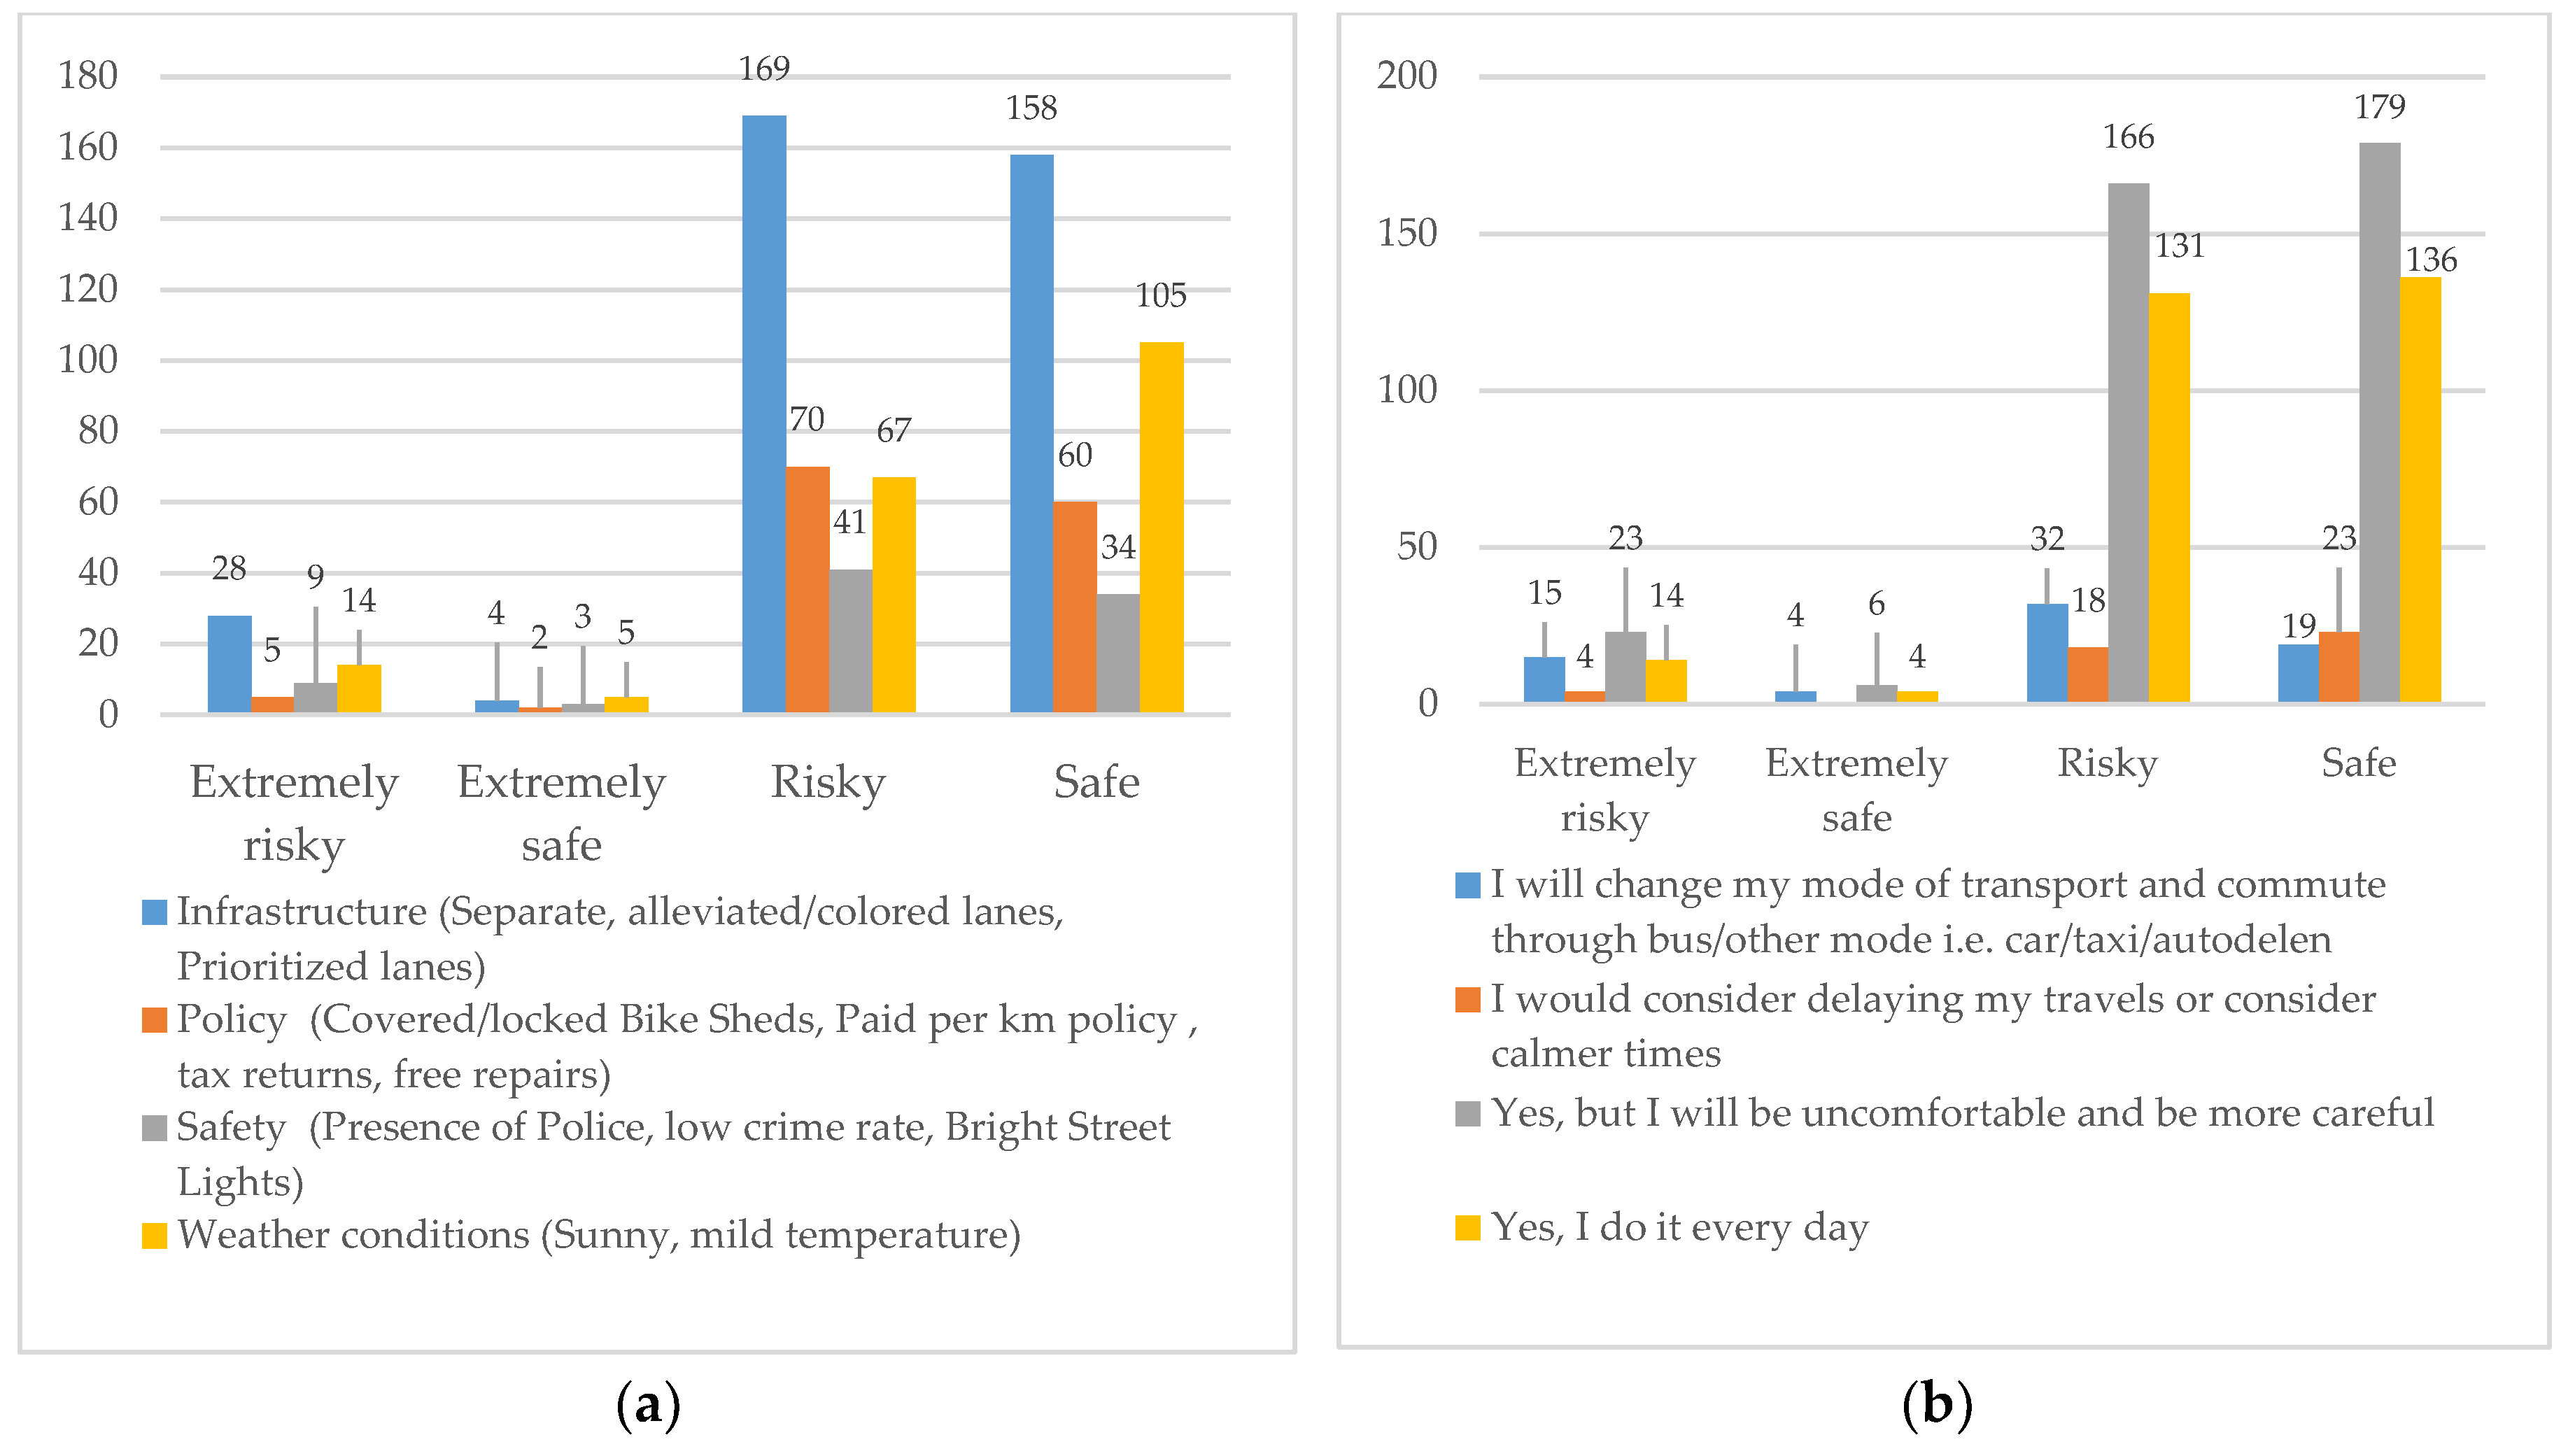
| Perception importance of safety during busy periods | ||||||||
| I will change my mode of transport and commute through bus/other mode, i.e., car/taxi/car sharing | 70 | 9 | 16 | 0.1 | 27 | 9.6 | 27 | 9,8 |
| I would consider delaying my travels or consider calmer times | 45 | 5.8 | 9 | 0 | 14 | 5 | 22 | 8 |
| Yes, but I will be uncomfortable and be more careful | 374 | 48 | 114 | 0.5 | 134 | 48 | 126 | 46 |
| Yes, I do it every day | 285 | 37 | 80 | 0.4 | 105 | 38 | 100 | 36 |
| Risk perception | ||||||||
| An important factor for modal shift to bicycle use | ||||||||
| Policy (covered/locked bike sheds, paid per km policy, tax returns, free repairs) | 137 | 18 | 46 | 0.2 | 39 | 14 | 52 | 19 |
| Safety (presence of police, low crime rate, bright street lights) | 87 | 11 | 42 | 0.2 | 31 | 11 | 14 | 5.1 |
| Weather conditions (sunny, mild temperature) | 191 | 25 | 59 | 0.3 | 64 | 23 | 68 | 25 |
| Current perception of safety | ||||||||
| Extremely risky | 56 | 7.2 | 10 | 4.6 | 20 | 7.1 | 26 | 9,5 |
| Extremely safe | 14 | 1.8 | 5 | 2.3 | 5 | 1.8 | 4 | 1,5 |
| Risky | 347 | 45 | 93 | 42 | 118 | 42 | 136 | 49 |
| Safe | 357 | 46 | 111 | 51 | 137 | 49 | 109 | 40 |
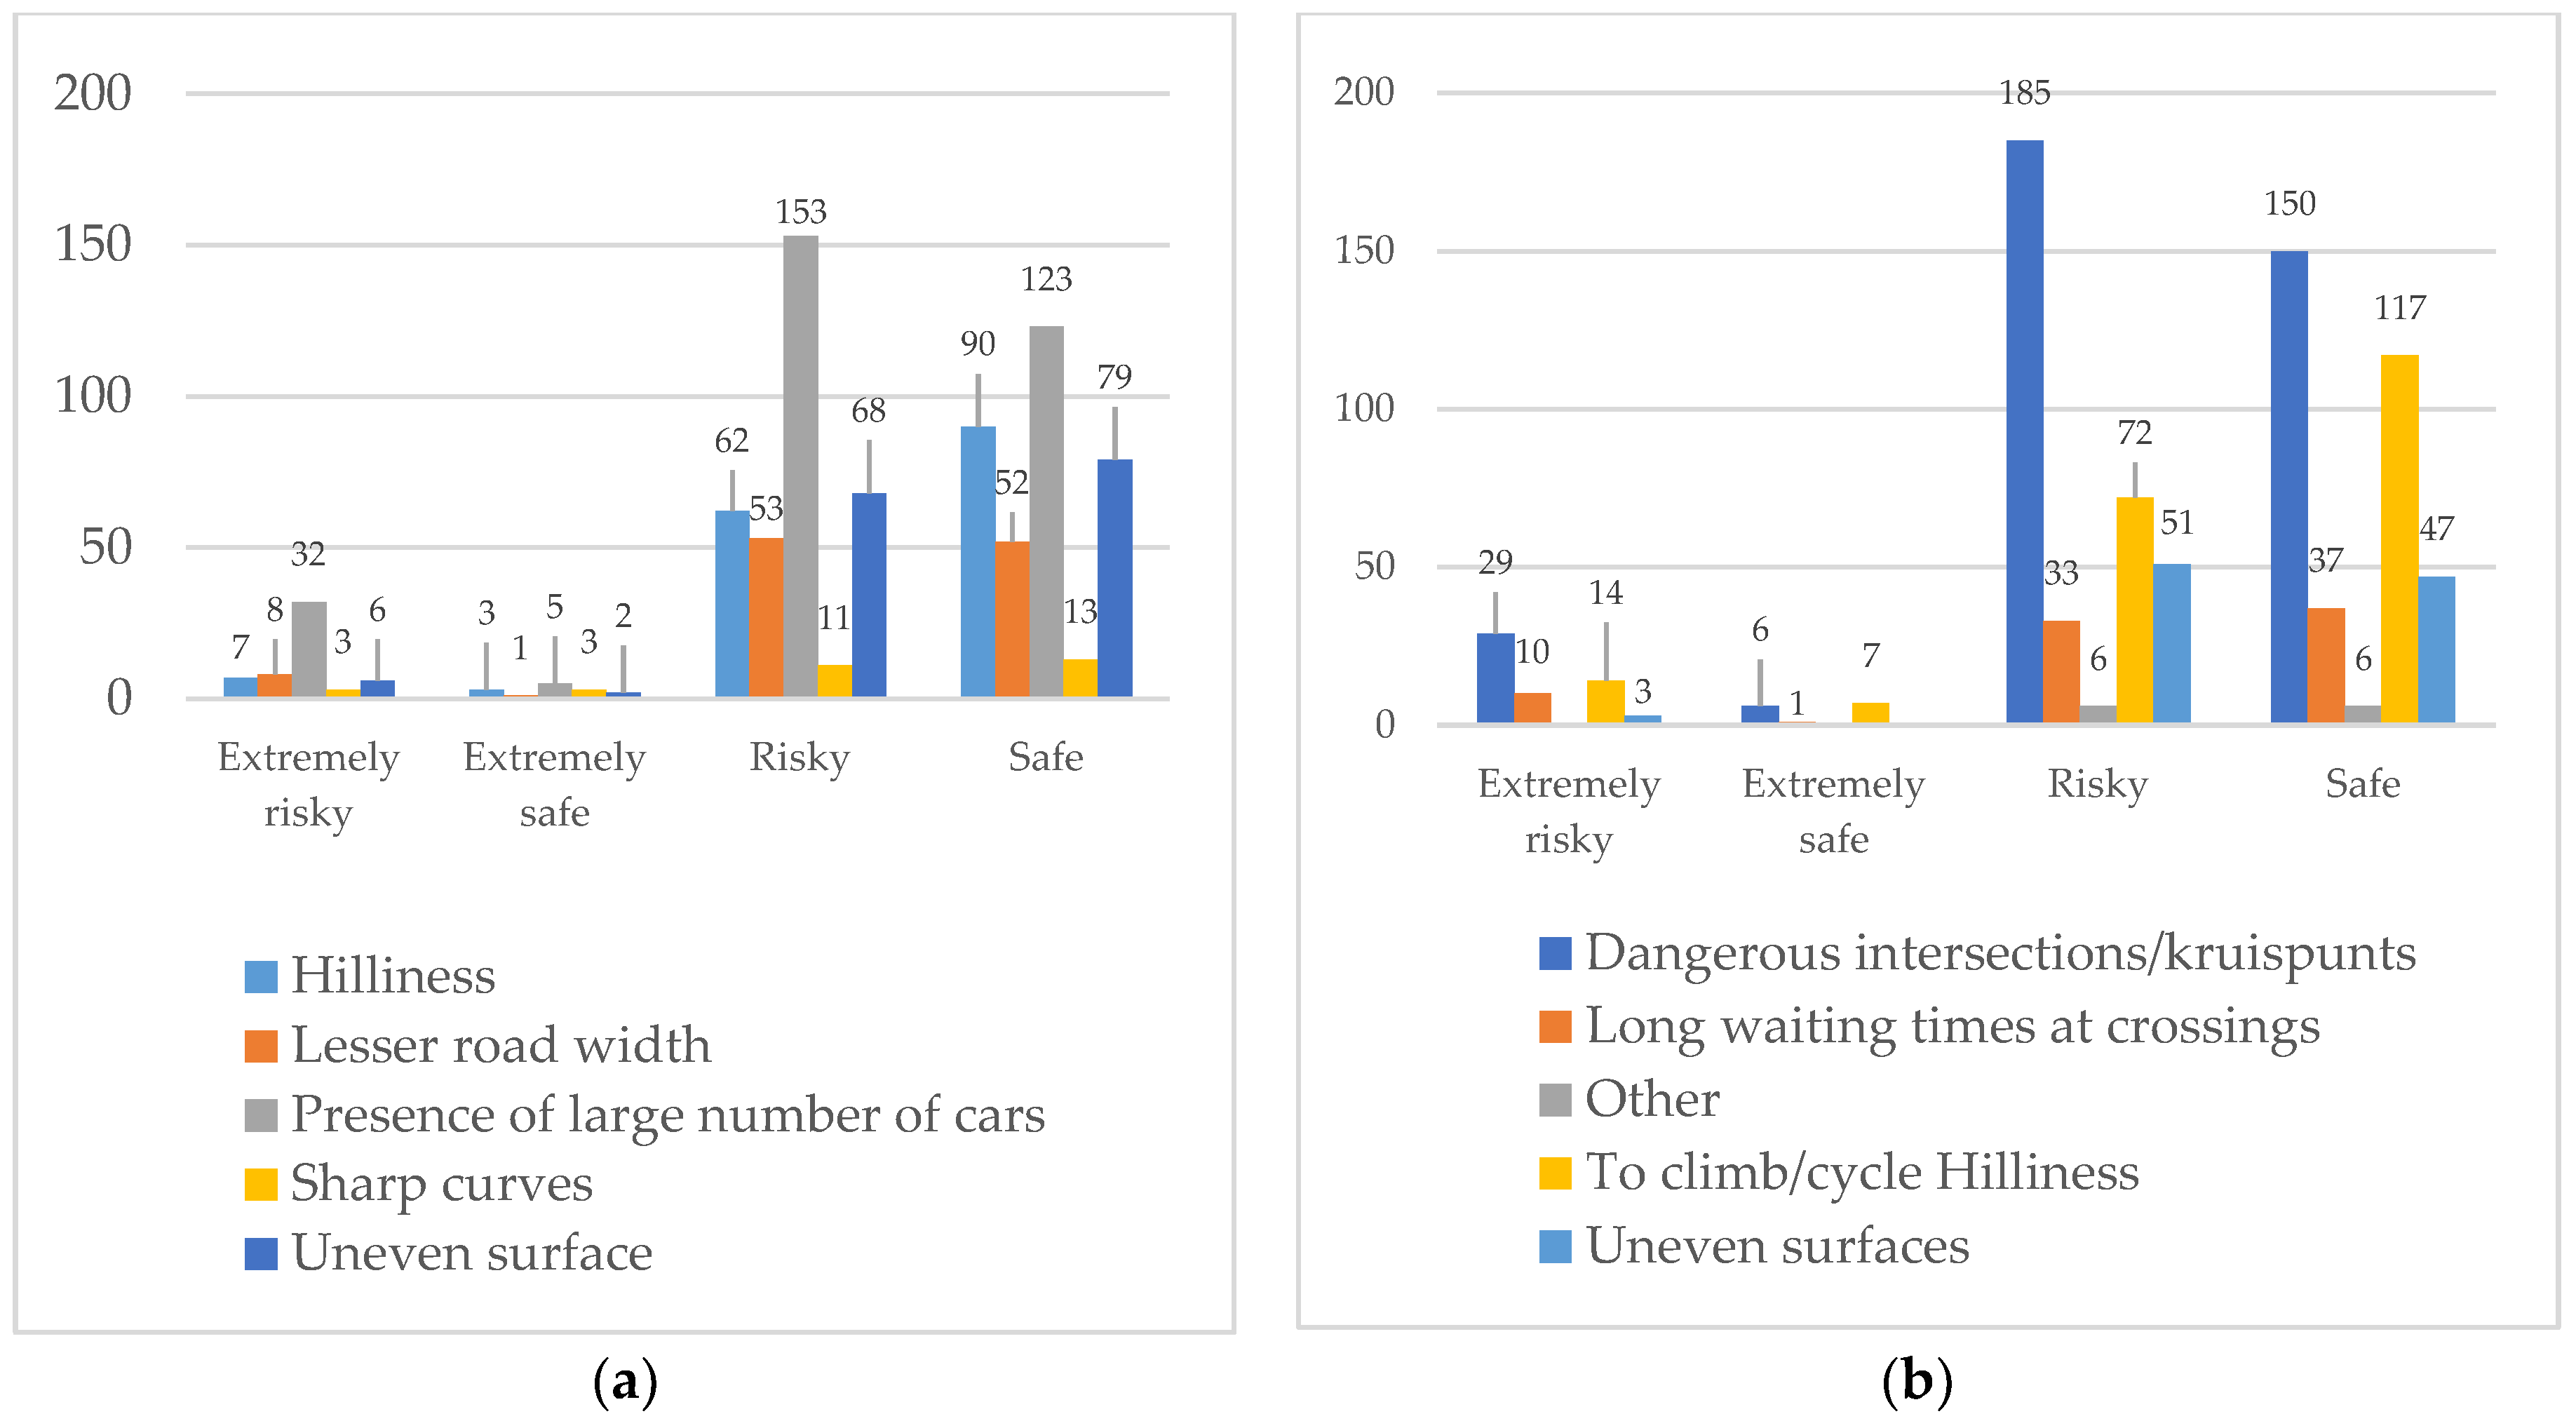
| Obstacles in cycling | ||||||||
| Dangerous intersections | 370 | 48 | 87 | 40 | 134 | 48 | 149 | 54 |
| Long waiting times at crossings | 81 | 10 | 27 | 12 | 30 | 11 | 24 | 8.7 |
| Other | 12 | 1.6 | 1 | 0.5 | 6 | 2.1 | 5 | 1.8 |
| To climb/cycle Hilliness | 210 | 27 | 80 | 37 | 77 | 28 | 53 | 19 |
| Infrastructural attributes | ||||||||
| Infrastructural factors effecting bicycling | ||||||||
| Hilliness | 162 | 21 | 64 | 29 | 62 | 22 | 36 | 13 |
| Lesser road width | 114 | 15 | 31 | 14 | 43 | 15 | 40 | 15 |
| Presence of large number of cars | 313 | 40 | 78 | 36 | 108 | 39 | 127 | 46 |
| Sharp curves | 30 | 3.9 | 6 | 2.7 | 16 | 5.7 | 8 | 2.9 |
| Uneven surface | 155 | 20 | 40 | 18 | 51 | 18 | 64 | 23 |
| Preferred bicycle surface | ||||||||
| Asphalt | 641 | 83 | 170 | 78 | 236 | 84 | 235 | 85 |
| Concrete | 79 | 10 | 28 | 13 | 27 | 9.6 | 24 | 8.7 |
| Earthen surface | 32 | 4.1 | 10 | 4,.6 | 10 | 3.6 | 12 | 4.4 |
| Stones | 22 | 2.8 | 11 | 5 | 7 | 2.5 | 4 | 1.5 |
| Perceived behavioral factors for cycling | ||||||||
| Coherent, effective infrastructure | 482 | 62 | 98 | 45 | 182 | 65 | 202 | 73 |
| More repair shops | 22 | 2.8 | 9 | 4.1 | 7 | 2.5 | 6 | 2.2 |
| Secure bike places | 65 | 8.4 | 15 | 6.8 | 30 | 11 | 20 | 7.3 |
| Short distances | 205 | 26 | 97 | 44 | 61 | 22 | 47 | 17 |
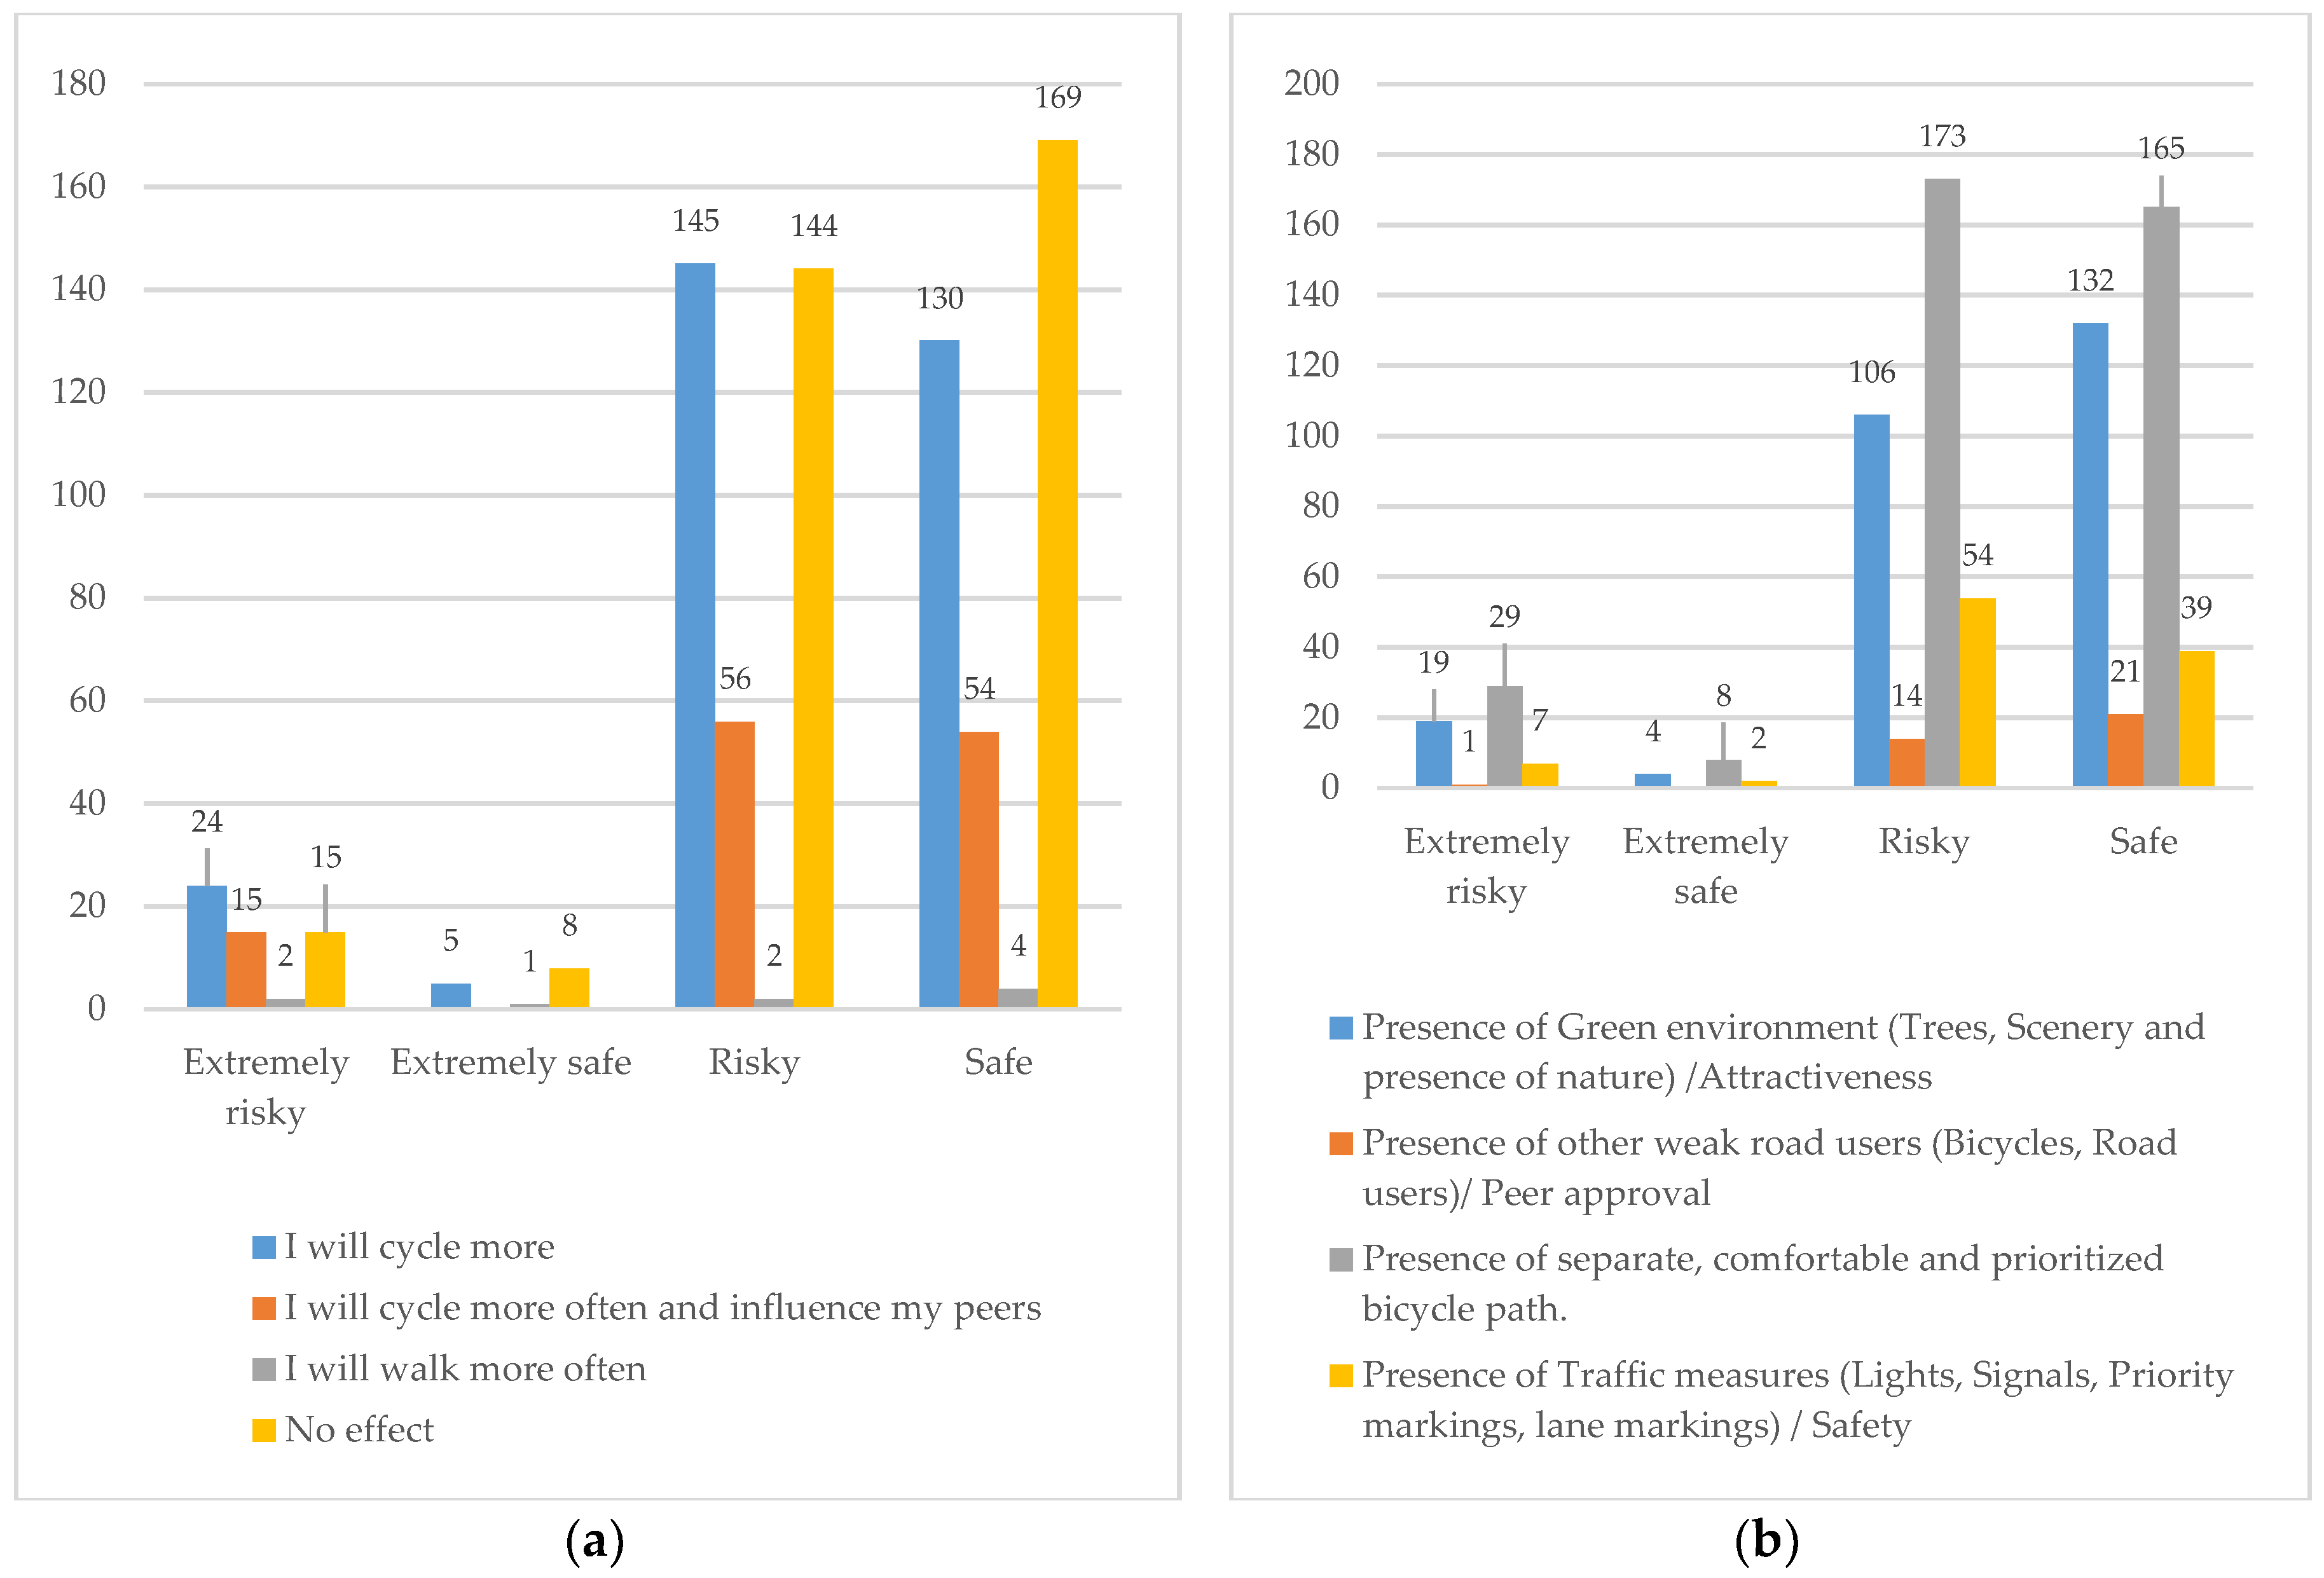
| Delineated colored bicycle paths | ||||||||
| I will cycle more | 304 | 39 | 98 | 45 | 111 | 40 | 95 | 35 |
| I will cycle more often and influence my peers | 125 | 16 | 29 | 13 | 48 | 17 | 48 | 17 |
| I will walk more often | 9 | 1.2 | 5 | 2.3 | 3 | 1.1 | 1 | 0.4 |
| No effect | 336 | 43 | 87 | 40 | 118 | 42 | 131 | 48 |
| Perceived behavioral infrastructure | ||||||||
| Presence of green environment (trees, scenery, and presence of nature)/attractiveness | 261 | 34 | 77 | 35 | 98 | 35 | 86 | 31 |
| Presence of other weak road users (bicycles, road users)/Peer approval | 36 | 4.7 | 13 | 5.9 | 12 | 4.3 | 11 | 4 |
| Presence of separate, comfortable and prioritized bicycle path. | 375 | 48 | 94 | 43 | 139 | 50 | 142 | 52 |
| Presence of traffic measures (lights, signals, priority markings, and lane markings)/Safety | 102 | 13 | 35 | 16 | 31 | 11 | 36 | 13 |
References
- Koornstra, M.J. Risk-adaptation theory. Transp. Res. Part F Traffic Psychol. Behav. 2009, 12, 77–90. [Google Scholar] [CrossRef]
- Jensen, S.U. Pedestrian and bicyclist level of service on roadway segments. Transp. Res. Rec. 2007, 2031, 43–51. [Google Scholar] [CrossRef]
- Aldred, R.; Crosweller, S. Investigating the rates and impacts of near misses and related incidents among UK cyclists. J. Transp. Health 2015, 2, 379–393. [Google Scholar] [CrossRef]
- Jacobsen, P.L. Safety in numbers: More walkers and bicyclists, safer walking and bicycling. Inj. Prev. 2015, 21, 271–275. [Google Scholar] [CrossRef]
- WILDE, G.J.; Murdoch, P.A. Incentive systems for accident-free and violation-free driving in the general population. Ergonomics 1982, 25, 879–890. [Google Scholar] [CrossRef]
- Ajzen, I. The theory of planned behaviour. Organizational Behaviour and Human Decision Processes, 50, 179-211. De Young 1991, 50, 509–526. [Google Scholar]
- Windsor, T.D. Behavioral approach and behavioral inhibition as moderators of the association between negative life events and perceived control in midlife. Personal. Individ. Differ. 2008, 44, 1080–1092. [Google Scholar] [CrossRef]
- Kaplan, S.; Wrzesinska, D.K.; Prato, C.G. Transportation Research Board 98th Annual Meeting. In Proceedings of the Psychosocial Benefits and Mood Improvement from Habitual Bicycle Use, Washington, DC, USA, 13–17 January 2019. [Google Scholar]
- Puchades, V.M. The role of perceived competence and risk perception in cycling near misses. Saf. Sci. 2018, 105, 167–177. [Google Scholar] [CrossRef]
- Pucher, J.; Dill, J.; Handy, S.J.P.M. Infrastructure, programs, and policies to increase bicycling: An international review. Prev. Med. 2010, 50, S106–S125. [Google Scholar] [CrossRef]
- Rode, P. Accessibility in Cities: Transport and Urban Form. In Disrupting Mobility: Impacts of Sharing Economy and Innovative Transportation on Cities; Meyer, G., Shaheen, S., Eds.; Springer International Publishing: Cham, Switzerland, 2017; pp. 239–273. [Google Scholar]
- Steg, L. Factors influencing the acceptability and effectiveness of transport pricing. In Acceptability of Transport Pricing Strategies; Pergamon Press: Oxford, UK, 2003; pp. 187–202. Available online: https://doi.org/10.1108/9781786359506-012 (accessed on 25 February 2018).
- Reutter, O.J.E.B. The ‘YOU-move. nrw’campaign–New partnerships for youth-oriented and environmentally friendly mobility management Oscar Reutter. Editor. Board 2004, 10, 15–21. [Google Scholar]
- Noland, R.B.; Ishaque, M.M. Smart bicycles in an urban area: Evaluation of a pilot scheme in London. J. Public Transp. 2006, 9, 5. [Google Scholar] [CrossRef]
- Rybarczyk, G.; Gallagher, L. Measuring the potential for bicycling and walking at a metropolitan commuter university. J. Transp. Geogr. 2014, 39, 1–10. [Google Scholar] [CrossRef]
- Gårder, P.; Leden, L.; Thedéen, T. Safety implications of bicycle paths at signalized intersections. Accid. Anal. Prev. 1994, 26, 429–439. [Google Scholar]
- Madsen, T.K.O.; Lahrmann, H. Comparison of five bicycle facility designs in signalized intersections using traffic conflict studies. Transp. Res. Part F Traffic Psychol. Behav. 2017, 46, 438–450. [Google Scholar] [CrossRef]
- Ul-Abdin, Z. Ride Quality for Bicycle Paths under Different Pavement Conditions. In Proceedings of the International Conference on Transportation and Development, Pittsburg, CA, USA, 15–18 July 2018. [Google Scholar]
- Cantisani, G.; Moretti, L.; De Andrade Barbosa, Y. Safety Problems in Urban Cycling Mobility: A Quantitative Risk Analysis at Urban Intersections. Safety 2019, 5, 6. [Google Scholar] [CrossRef]
- Pucher, J.; Buehler, R. Safer Cycling Through Improved Infrastructure. Am. J. Public Health Assoc. 2016, 106, 2089–2091. Available online: https://ajph.aphapublications.org/doi/10.2105/AJPH.2016.303507 (accessed on 10 December 2018). [CrossRef]
- Sammer, G. A General 30 km/H Speed Limit in the City: A Model Project in Graz, Austria; Wiley & Sons Ltd.: Chichester, UK, 1997; pp. 385–390. [Google Scholar]
- Bakogiannis, E. Developing a sustainable mobility plan in Piraeus with special emphasis on cycling. J. Traffic Transp. Eng. 2016, 4, 61–74. [Google Scholar]
- Sanders, R.L. Perceived traffic risk for cyclists: The impact of near miss and collision experiences. Accid. Anal. Prev. 2015, 75, 26–34. [Google Scholar] [CrossRef]
- Shokoohi, R.; Nikitas, A. Urban growth, and transportation in Kuala Lumpur: Can cycling be incorporated into Kuala Lumpur’s transportation system? Case Stud. Transp. Policy 2017, 5, 615–626. [Google Scholar] [CrossRef]
- Useche, S.A. Healthy but risky: A descriptive study on cyclists’ encouraging and discouraging factors for using bicycles, habits and safety outcomes. Transp. Res. Part F Traffic Psychol. Behav. 2019, 62, 587–598. [Google Scholar] [CrossRef]
- Willis, D.P.; Manaugh, K.; El-Geneidy, A. Cycling under influence: Summarizing the influence of perceptions, attitudes, habits, and social environments on cycling for transportation. Int. J. Sustain. Transp. 2015, 9, 565–579. [Google Scholar] [CrossRef]
- Gössling, S. Effects of perceived traffic risks, noise, and exhaust smells on bicyclist behaviour: An economic evaluation. Sustainability 2019, 11, 408. [Google Scholar] [CrossRef]
- Deery, H.A. Hazard and risk perception among young novice drivers. J. Saf. Res. 1999, 30, 225–236. [Google Scholar] [CrossRef]
- Strauss, J.; Miranda-Moreno, L.F.; Morency, P. Cyclist activity and injury risk analysis at signalized intersections: A Bayesian modelling approach. Accid. Anal. Prev. 2013, 59, 9–17. [Google Scholar] [CrossRef] [PubMed]
- Kummeneje, A.M.; Ryeng, E.O.; Rundmo, T. Seasonal variation in risk perception and travel behaviour among cyclists in a Norwegian urban area. Accid. Anal. Prev. 2019, 124, 40–49. [Google Scholar] [CrossRef] [PubMed]
- Prati, G. The Role of Perceived Competence and Risk Perception in Cycling Near Misses. PsyArXiv: Web. 5 April 2019. Available online: https://psyarxiv.com/wy64s/ (accessed on 10 July 2019).
- Yao, L.; Wu, C. Traffic safety for electric bike riders in China: Attitudes, risk perception, and aberrant riding behaviors. Transp. Res. Rec. 2012, 2314, 49–56. [Google Scholar] [CrossRef]
- Ulleberg, P.; Rundmo, T. Personality, attitudes and risk perception as predictors of risky driving behaviour among young drivers. Saf. Sci. 2003, 41, 427–443. [Google Scholar] [CrossRef]
- Şimşekoğlu, Ö.; Nordfjærn, T.; Rundmo, T. Traffic risk perception, road safety attitudes, and behaviors among road users: A comparison of Turkey and Norway. J. Risk Res. 2012, 15, 787–800. [Google Scholar] [CrossRef]
- Nordfjærn, T.; Jørgensen, S.; Rundmo, T. A cross-cultural comparison of road traffic risk perceptions, attitudes towards traffic safety and driver behaviour. J. Risk Res. 2011, 14, 657–684. [Google Scholar] [CrossRef]
- Nordfjærn, T.; Rundmo, T. Perceptions of traffic risk in an industrialised and a developing country. Transp. Res. Part F Traffic Psychol. Behav. 2009, 12, 91–98. [Google Scholar] [CrossRef]
- Heinen, E.; Maat, K.; Van Wee, B. The role of attitudes toward characteristics of bicycle commuting on the choice to cycle to work over various distances. Transp. Res. Part D Trans Environ. 2011, 16, 102–109. [Google Scholar] [CrossRef]
- Dufour, D. PRESTO Cycling Policy Guide-General Framework. Intell. Energy-Eur; PRESTO: Brussels, Belgium, February 2010. [Google Scholar]
- Groot, R.D. Design Manual for Bicycle Traffic. National Academy of Sciences. 2007. Available online: https://trid.trb.org/view/1153223 (accessed on 23 February 2019).
- Thomas, B.; DeRobertis, M. The safety of urban cycle tracks: A review of the literature. Accid. Anal. Prev. 2013, 52, 219–227. [Google Scholar] [CrossRef] [PubMed]
- Akar, G.; Clifton, K.J. Influence of individual perceptions and bicycle infrastructure on decision to bike. Transp. Res. Rec. 2009, 2140, 165–172. [Google Scholar] [CrossRef]
- Dill, J.; McNeil, N. Four types of cyclists? Examination of typology for better understanding of bicycling behavior and potential. Transp. Res. Rec. 2013, 2387, 129–138. [Google Scholar] [CrossRef]
- Townsend, E. The European Union’s Role in Promoting the Safety of Cycling: Proposals for a Safety Component in a Future EU Cycling Strategy; National Academy of Sciences: Brussels, Belgium, 2016. [Google Scholar]
- Fishman, E.; Schepers, P.; Kamphuis, C.B.M. Dutch cycling: Quantifying the health and related economic benefits. Am. J. Public Health 2015, 105, e13–e15. [Google Scholar] [CrossRef]
- DiGioia, J. Safety impacts of bicycle infrastructure: A critical review. J. Saf. Res. 2017, 61, 105–119. [Google Scholar] [CrossRef]
- Saad, M. Bicycle Safety Analysis at Intersections from Crowdsourced Data. Transp. Res. Rec. 2019, 2673, 0361198119836764. [Google Scholar] [CrossRef]
- Ul-Abdin, Z. Analytical geometric design of bicycle paths. In Proceedings of the Institution of Civil Engineers-Transport; Thomas Telford Ltd.: London, UK, 4 June 2018; pp. 1–19. Available online: https://www.icevirtuallibrary.com/doi/10.1680/jtran.17.00162 (accessed on 8 August 2018).
- Dill, J. Bicycling for transportation and health: The role of infrastructure. J. Public Health Policy 2009, 30, S95–S110. [Google Scholar] [CrossRef]
- Visschers, V.H.; Siegrist, M. Differences in Risk Perception between Hazards and between Individuals. Psychological Perspectives on Risk and Risk Analysis; Springer: Cham, Switzerland, 2018; pp. 63–80. [Google Scholar]


| Influencing Factors for Cycling | Features Explained According to Category |
|---|---|
| Suggestions for improvement | Separate paths dashed lanes [10], change to bicycle street, ban entry for a car. |
| Factors implicating motivation | Accessibility [11], cost, congestion, or stimulus [10]. |
| Cognitive factors for choice adoption | Infrastructure, safety, policy [12] or weather. |
| Alternate to bicycle usage | Public transport [13], bicycle-sharing program [14], taxi or peer help [15] |
| Perceived safety levels new TDMs | Safe, disaster, needs improvement, convenient but needs improvement. |
| Hindrance toward usage | Dangerous intersections [16,17], uneven surfaces [18], waiting time, hilliness. |
| Critical features for infrastructure | Sharp curves, uneven surface, Presence of cars, lesser road width or hilliness [19]. |
| Prioritized factors for usage | Distance, infrastructure [20], security or repair facilities. |
| Comparative critical cognitive factors | Safety in numbers, green environment, traffic calming measures, or prioritized bicycle path. |
| Impact of TDMs | Dashed colored separate trails, Bicycle street, or ban car entry [21]. |
| Investigated Variables with χ2 Test | Pearson Chi-Square Value | df | p-Value | Cramer’s V Value |
|---|---|---|---|---|
| Age | 10.506 | 6 | 0.105 | 0.802 |
| Distance | 24.747 | 15 | 0.053 | 0.103 |
| Motivation bicycle use | 26.895 | 24 | 0.309 | 0.108 |
| Attitudes toward problems related cycling | 15.305 | 9 | 0.083 | 0.081 |
| Attitude toward new mobility regulations | 119.174 | 12 | 0.002 | 0.227 |
| Suggestions for improving safety at intersections | 5.085 | 9 | 0.827 | 0.047 |
| Important factor for modal shift to bicycle usage | 17.235 | 9 | 0.045 | 0.086 |
| Perception during busy period | 35.914 | 9 | 0.000 | 0.124 |
| Infrastructural factors effecting bicycling | 30.881 | 12 | 0.002 | 0.115 |
| Obstacles in cycling | 26.818 | 12 | 0.008 | 0.107 |
| Perceived behavioral factors for cycling | 26.957 | 9 | 0.001 | 0.108 |
| Delineated colored bicycle paths | 21.811 | 9 | 0.009 | 0.168 |
| Perceived behavioral infrastructure | 9.115 | 9 | 0.427 | 0.063 |
| Investigated Variables | Kruskal–Wallis H | df | p-Value |
|---|---|---|---|
| Age | 9.483 | 3 | 0.024 |
| Distance | 11.492 | 3 | 0.009 |
| Motivation bicycle use | 1.037 | 3 | 0.792 |
| Attitudes toward problems related cycling | 5.333 | 3 | 0.149 |
| Attitude toward new mobility regulations | 72.730 | 3 | 0.000 |
| Suggestions for improving safety at intersections | 0.603 | 3 | 0.896 |
| Important factor for modal shift to bicycle usage | 6.839 | 3 | 0.077 |
| Perception during busy period | 13.675 | 3 | 0.003 |
| Infrastructural factors effecting bicycling | 1.467 | 3 | 0.69 |
| Obstacles in cycling | 8.285 | 3 | 0.04 |
| Perceived behavioral factors for cycling | 18.802 | 3 | 0 |
| Delineated colored bicycle paths | 6.303 | 3 | 0.098 |
| Perceived behavioral infrastructure | 6.225 | 3 | 0.101 |
© 2019 by the authors. Licensee MDPI, Basel, Switzerland. This article is an open access article distributed under the terms and conditions of the Creative Commons Attribution (CC BY) license (http://creativecommons.org/licenses/by/4.0/).
Share and Cite
Ul-Abdin, Z.; De Winne, P.; De Backer, H. Risk-Perception Formation Considering Tangible and Non-Tangible Aspects of Cycling: A Flemish Case Study. Sustainability 2019, 11, 6474. https://doi.org/10.3390/su11226474
Ul-Abdin Z, De Winne P, De Backer H. Risk-Perception Formation Considering Tangible and Non-Tangible Aspects of Cycling: A Flemish Case Study. Sustainability. 2019; 11(22):6474. https://doi.org/10.3390/su11226474
Chicago/Turabian StyleUl-Abdin, Zain, Pieter De Winne, and Hans De Backer. 2019. "Risk-Perception Formation Considering Tangible and Non-Tangible Aspects of Cycling: A Flemish Case Study" Sustainability 11, no. 22: 6474. https://doi.org/10.3390/su11226474
APA StyleUl-Abdin, Z., De Winne, P., & De Backer, H. (2019). Risk-Perception Formation Considering Tangible and Non-Tangible Aspects of Cycling: A Flemish Case Study. Sustainability, 11(22), 6474. https://doi.org/10.3390/su11226474