Abstract
An important basis to achieve a sustainable balance between water availability and demand is effectively identifying the factors affecting water resource security and evaluating the effectiveness of existing water resource management measures. To reasonably evaluate water resource security in Guizhou Province, this study combined the water resource security features, selected the indicator system based on the Press–Status–Effect–Response (PSER) framework, and used Technique for Order Preference by Similarity to an Ideal Solution (TOPSIS) and grey correlation analysis for the province from 2001 to 2015. This allowed us to identify the main driving factors affecting water resource security. The results showed that: (1) Water resource security in Guizhou Province showed an overall trend of improvement from 2001 to 2015 and reached a maximum index of 0.57 in 2015. This amelioration in water security was mainly due to the continuous improvement of the response and effect subgroup as a result of improvements in its existing subgroup factors (policies), such as water consumption per unit of gross domestic product (GDP), the proportion of water conservancy investment, and the proportion of the tertiary industry. Increased water stress due to rapid economic development, such as water supply for the reservoir, and the instability of the status subgroup, were the main factors negatively affecting water resource security. (2) Reduction of water consumption per USD of industrial value added, the control force of water and soil erosion being strengthened, and investment in water resources being increased, are the key factors for achieving water resource security in Guizhou during this period of rapid social and economic development. This indicates that the existing water resource management measures have been improving water resource security. The management measures need to be further improved in the future to protect water resource.
1. Introduction
Water is a basic resource, essential for the stability of ecological environment and the stable development of the social economy [1,2]. With the rapid development of human society and the economy, and the rapid growth of population, water resource security issues, such as rapid increases in the demand for water resources, and shortages and pollution of water resources, have become increasingly prominent and a global focus [3]. In the study of water security, water resource security is the most important theme [4]. The study of water resource security mainly includes: the scope of water security [5,6], water security measurement [7,8], water resource security assessment [9,10] and water resource management [11,12]. Of these, water resource security assessment is the key content of water resource security research. The water resource system is closely related to the social and economic systems, and is the foundation of sustainable development of the social and economic systems. For example, water scarcity often arises from deep-seated socioeconomic issues such as food security [13]. Water scarcity has triggered a series of socioeconomic problems: approximately 800 million people worldwide lack access to clean, fresh water and two billion people lack safe water [14]. Therefore, water resource security assessment as the foundation of water resource management has become the focus of over the world research.
At present, the study of water resource security assessment mainly focuses on arid climate areas in traditional understanding, while there are relatively few achievements in humid climate areas. The study of water resource security assessment is mainly through the establishment of evaluation indicators [10,15]. From the perspective of water security assessment, research is mainly focused on the balance of supply and demand of water resources [16,17], water resource carrying capacity in regions [18,19], and the water footprint of regional water security assessment [20,21]. The selection of water resource security evaluation indicators focuses on regional socioeconomic development, population growth, water resource quality, and other aspects, with a particular emphasis on water resource security state evaluation. Unfortunately, insufficient attention has been paid to human-related policy responses in water resource security assessment studies, leading to insufficient direct effects of relevant research results on improving regional water resource security, and even having a negative impact on water resource security. Water security in the 21st century needs to better connect science with policy, innovative, and cross-sectoral initiatives, adaptive management, and multi-central governance models that involve all stakeholders [3]. Water security issues will shift “beyond infrastructure” to more effective water management key strategies, including governance and social learning [22]. According to the traditional understanding, water resource security problems are mainly in arid and semi-arid areas. However, serious and more complicated water resource security problems exist in karst areas in southwest China, which are in a subtropical humid climate area. Water resource security is not only directly related to the rapid development of a regional social economy, but also affected by the special karst hydrogeological environment. At the same time, the geological environment factors have “amplified response” to unreasonable human behaviors in karst areas in southwest China, such as water resource pollution. There are significant differences between water resource security and water resource management in karst areas of southwest China, and arid and semi-arid areas. Therefore, it is of great significance to clarify the characteristics of water resource management in karst areas of southwest China as well as other karst areas in the world.
Guizhou is in the core of the karst area in southwest China, which is one of the three major distributed areas of karst in the world. In recent years, social and economic development has been rapid, with average annual gross domestic product (GDP) growth of 11.8% from 2001 to 2015, and water shortages and other problems have emerged. Therefore, this article selects Guizhou Province as a research case; carries out the study of water resource security evaluation; discusses the evolution of water resource security, its main influencing factors and its mechanism against the background of the rapid development of the special hydrogeological environment and social economy in karst in southwest China; and further evaluates the efficiency of human response measures. It has important practical value for improving water resource management. It is of great reference value to further understand water resource security in the karst region of southwest China and other karst regions in the world.
This paper is organized into six parts. Section 1 comprises the above introduction. Section 2 presents the study area, and Section 3 introduces the materials and methods. Section 4 presents the results, Section 5 presents the discussion, and finally, the conclusions and recommendations are provided in Section 6.
2. Study Area
Guizhou Province is in the hinterland of China’s southwest (24°~30° N, 103°~110° E), and has a subtropical humid monsoon climate with abundant rainfall. The average annual rainfall from 2001 to 2015 was 1096.69 mm/year and drainage density was 0.563 km/km2. Guizhou is the district where the degree of relief is large; 61.7% is mountainous land, 30.8% is covered in hills, and 7.5% is covered by flatlands situated between the mountains. The area of Guizhou Province is 176 thousand square kilometers, and the total population of the province is 35.28 million. Due to the flat area is small and scattered, the population density of the actual residence is much larger than the average population density of Guizhou Province [23]. The proportions of forest land, grassland, water area, agricultural land and other land were 51.7%, 16.18%, 1.95%, 28.77% and 1.4%, respectively, in 2014 [23]. Moreover, the exploitation and utilization of water resources is difficult because the development of karst landforms is extensive (61.9%), and the forest coverage rate is low. At the same time, the strong karstification has formed a large number of above-ground karst landforms, such as dissolved furrows and dissolved gaps, and underground karst landforms, such as karst caves. Above-ground and underground karst landforms form a double-layer water storage structure, which leads to rapid ground water and surface water exchange, and in which the water culvert capacity is weak. However, due to insufficient investment in water conservancy, which leads to a small number of water conservancy facilities such as reservoirs, abundant precipitation cannot be effectively stored and used, resulting in “engineering” water shortage. Study area location in China and the existing water sources can be seen in Figure 1.
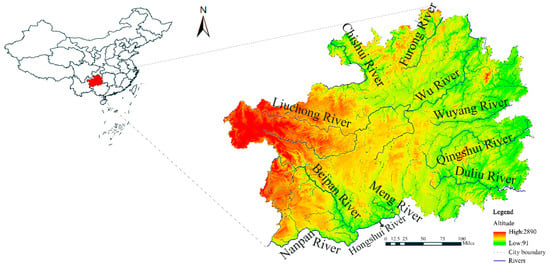
Figure 1.
Study area location in China.
The average annual GDP growth rate was 12.5% from 2011 to 2015, and the GDP reached USD 168.615 billion (USD/CNY exchange rate 2015) in 2015. There are new opportunities for economic development in Guizhou Province due to the advancement of urbanization, industrialization, and agricultural modernization; the development of cultural tourism; and integration into the “Belt and Road” initiative and the Yangtze River Economic Belt. The amount of water required has increased substantially with the continuous growth of the economy. It is estimated that the demand for water in the province will reach 15.94 billion m3 in 2020, while the water supply capacity of the province’s water conservancy projects was expected to be only 11 billion m3 in 2015, with a per capita water supply of 264 m3 (only 58% of the national average). In addition, the engineering water shortage remains serious [24].
3. Materials and Methods
3.1. Materials
The data were obtained mainly from the following sources: The Guizhou Statistical Yearbook (2002–2016) published by the Guizhou Province Statistics Bureau [25]; the Water Resources Bulletin of Guizhou Province (2001–2015) published by the Guizhou Water Resource Bureau [26]; the Environmental Statistics Bulletin of Guizhou Province (2001–2015) published by the Guizhou Environmental Protection Bureau [27]; and the Statistical Communique of Guizhou’s National Economic and Social Development (2001–2015) published by the Guizhou Province Statistics Bureau [28].
3.2. Methods
The water resource system is an open multi-factor comprehensive system with many aspects, including resources, ecology, and the social economy. It is a grey system because the information for each factor is uncertain and incomplete [29,30]. Water resource security should select appropriate research methods based on regional resources, the ecology, socioeconomic data, and other characteristics. The PSER model was used because it includes four subgroups—pressure, status, effect, and response—from which the corresponding index system which can cover regional resources, the ecology, socioeconomic data, and other characteristics is constructed. This was combined with the Technique for Order Preference by Similarity to an Ideal Solution (TOPSIS) [31] and the grey relational comprehensive model to evaluate water resource security changes in Guizhou Province from 2001 to 2015 and to clarify the main influencing factors.
3.2.1. Construction of PSER Theoretical Framework
The press-status-response (PSR) model was jointly proposed by the United Nations Environment Program (UNEP) and Organization for Economic Co-operation and Development (OECD) [32]. It has been widely used in the field of environmental issues [33,34]. In the assessment of water resource security, the PSR model fairly reflects the interaction between human beings and the environment, but poorly portrays the effect of human responses to environmental pressure [35]. A special double-layer water storage structure exists in the southwest karst area, which leads to rapid ground water and surface water exchange. The karst water resource system is highly sensitive and vulnerable because of its special hydrological environment [36]. Thus, karst water systems vary significantly because of factors such as stress and human response activities. Therefore, it is of great value to clarify the effect of human response activities and other factors on water resource systems for timely adjustment of water resource management measures in karst areas.
The water resource system is a dynamic balance system. The regional natural environment is the foundation of the water resource system. Against a background in which external interference is minimal or absent, the status of the water resource system basically reflects the natural status of the water resource system. When the water resource system is subject to strong external interference, such as human activities, the status of the water resource system will change and show a certain response to the external interference. For example, river water pollution caused by discharge of pollutants affects human welfare, so humans will respond to river water pollution to improve the environment. In the process of increasing influence of human activities, the dynamic equilibrium status of water resources continues to change. When the influence exceeds the resilience threshold of the water resource system, the dynamic equilibrium will be broken, and a new equilibrium status will be formed in the system [37]. This framework provides an analysis tool to eliminate the adverse impact of human activities on water resources and improve water resource management measures because it better describes the water system in a process of dynamic change affected by human activities; specifically, it clearly considers what has happened (pressure), what has changed (status), what is the effect (effect), and the logic of human response (response) (Figure 2).
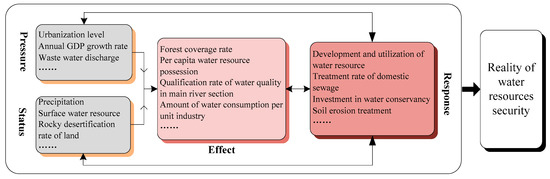
Figure 2.
PSER theoretical framework.
Thus, we expanded the PSR model to the PSER model to incorporate the effects of human activities on water resources, and divided the water resource system into four subgroups: pressure, status, effect, and response. PSER is widely used in research such as environmental assessment [38]. The pressure indicators characterize the load caused by human activities on the water resource system, such as wastewater discharge, population density, and amount of fertilizer used on arable land. The status indicators characterize the condition of water resource systems in terms of water supply quality, quantity and capacity, and include the rocky desertification rate of land, water supply for engineering, and ecological water consumption. The effect indicators characterize the implementation effects of management policies and measures at the present stage, such as forest coverage rate, supply for underground water, and per capita water resource possession. The response indicators characterize active regulation of human pressure, status and management of the water resource system, and include the treatment rate of domestic sewage, investment in water conservancy, and soil erosion treatment.
More influential factors that can reflect the contradiction between supply and demand of water resources, the quality of the water environment, and socioeconomic influences were determined after full consideration of the impact of natural, social, economic, and policy factors on water resource security in Guizhou. For reference, research has been studied of water resource security assessment in southwest karst areas [24,39,40]. According to the PSER framework, a multi-level water resource security evaluation indicator system is then established by further refining the four pressure, status, effect, and response subgroups and selecting the appropriate indicators (Table 1). In the selection of indicators, based on the limited availability of data, we focused on the indicators that can reflect the contradiction between water supply and demand, the quality of the water environment, and the degree of social and economic factors that have a great impact on the water resource system and can represent human response.

Table 1.
Evaluation indicator system of water resource security in Guizhou Province.
3.2.2. Date Standardization
The evaluation data include the water resource security status of Guizhou Province, including m evaluation indicators over n years. The raw data matrix is as follows:
The influence of the different dimensions between the indicators was eliminated and the original matrix was standardized yielding the matrix Y: .
The positive indicator (the higher the indicator value, the more positive the impact on water resource security) standardized formula is:
The negative indicator (the lower the indicator value, the more negative the impact on water resource security) standardized formula is:
where Xij is the survey original value, is the survey minimum value, and is the survey maximum value, and i, j represent the value of the ith indicator in the jth year.
3.2.3. Determination of the Value Weight
The entropy weight method was used to determine the value weight according to the data, while avoiding the possible influence of subjective factors [30,39]. The accuracy was relatively high, and the evaluation results were relatively stable, allowing for a better explanation of the results.
The entropy value of the jth value is ej:
The weight of the j value is wj:
3.2.4. Calculation of Grey Relational Index
Grey relational analysis accurately reflects the index of association and order for the index of a subgroup, and the evaluation process is relatively stable [41,42]. The TOPSIS model calculates the distance between the evaluation object and the optimal decision-making scheme to analyze the index of connection between water resource security and the optimal status [43,44]. This algorithm includes the following steps:
(1) Determination of the best and worst data vectors as the reference sequence. In addition to the worst values of P1 and the optimal values of R7 being decided by the National Eco-city Construction Standard, the optimal values of S9 were decided by Environmental Protection Regulations in Guizhou province, and the optimal values of E5 and R3 were decided by the Opinions on the Implementation of the Most Stringent Water Resources Management System in Guizhou province. The remaining best and worst values of the indexes depend on the real-life context of Guizhou Province.
The determination of fuzziness indicators was based on the standard value range, referring to the optimal and worst values for the evaluation period (Table 1). The matrix composed of the optimal and worst-case vectors and matrix Y was standardized again using the range method to obtain matrix . After standardization, it was transformed into a positive indicator. The optimal and worst-case reference sets are as follows:
The optimal reference set:
The worst reference set:
(2) Calculation of the grey correlation coefficient.
The grey correlation coefficients with optimal and worst reference sets are as follows:
Grey correlation coefficient with optimal reference set:
Grey correlation coefficient with worst reference set:
where and are respectively the two-level minimum differences and two-level maximum differences between the evaluation object and the optimal reference set; and are respectively the two-level minimum differences and two-level maximum differences for the evaluation object and the worst reference set; and is the resolution coefficient, and is an independent constant depending on the value the researcher needs to determine the value. The value is uncertain, such that 0 < < 1. The smaller the value of , the stronger the resolution of the calculation result, and generally = 0.5 [45]. Therefore, the value of in the article is 0.5.
(3) Calculation of relatedness. The comprehensive grey correlations of water resource security with optimal and worst-case reference sets are as follows:
In the above formulae, and denote the index of grey correlation between each index and the optimal and worst reference sets; , .
3.2.5. Calculation of Water Resource Security
The relative closeness of the grey relation between water resource security and the optimal reference set of the evaluation time series is T. A larger T shows that it is closer to the optimal reference set, and thus indicates that the situation is better. In this paper, the T value is used to indicate the water resource security.
4. Results
Results indicate a strong interannual variability in water security, but overall (from 2001 to 2015) the water security index presented an increased trend (Figure 3a) in Guizhou. Within the studied period, the water security index decreased from 2001 to 2005 and water resource security continuously improved from 2006 to 2015 (Figure 3). From the perspective of the various subgroups of water resource security, the effect and response subgroups of water resource security continued to improve, while the pressure subgroup continued to increase and the status subgroup was also in a status of fluctuation and instability from 2001 to 2015. Other results are as follows:
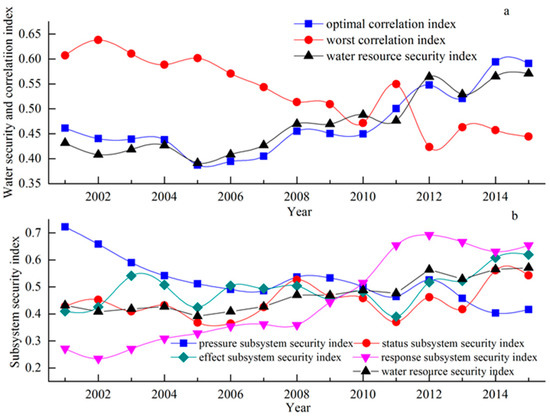
Figure 3.
Water resource security index and grey correlation index in Guizhou from 2001–2015. Note: (a,b) is the numbering of Figure 3.
(1) Water resource pressure subgroup. From 2001 to 2015, the security of the water pressure subgroup showed a fluctuating decline (Figure 3b), indicating that the pressure on water resource security continued to increase. From the highest index of 0.72 in 2001 to the minimum index of 0.4 in 2014, a decrease of 44.17%, the downward trend is striking.
(2) Water resource status subgroup. The status of water resources from 2001 to 2015 showed a clearly fluctuating trend (Figure 3b). From 2001 to 2006, the volatility declined from 0.43 to a minimum of 0.36; from 2006 to 2008, it rose to 0.53; from 2008 to 2011, it decreased to 0.37; and from 2011 to 2015, it rose to 0.54 again. Thus, a fluctuating trend was apparent.
(3) Water resource effect subgroup. From 2001 to 2015, the overall effect of the subgroup on water security increased in volatility (Figure 3b). From 2001 to 2011, increased within a little scale. From 2011 to 2015, the value of index jumped, rising from 0.3899 to 0.6193.
(4) Water resource response subgroup. In the 2001–2015 period, the security value of the response subgroup showed a trend of increasing volatility (Figure 3b). From 2001 to 2012, the fluctuation trend increased from its lowest value of 0.2715 in 2002 to a maximum value of 0.69 in 2012, an increase of 154.92%. A trend of weak growth was observed between 2012 and 2015.
5. Discussion
5.1. Analysis of Changes in Water Resource Pressure Subgroup
The pressure on water resource security in Guizhou Province increased from 2001 to 2015. According to the pressure subgroup indicators (Figure 4a), the indicators that increased include wastewater discharge (P4), economic density (P5), annual average GDP growth rate (P7), fertilizer used on arable land (P6), and per capita income (P8). Economic density increased from 64.3 thousand/km2 to 59.62 million/km2 between 2001 and 2015, an increase of nine times. Moreover, the average annual GDP growth rate increased from 8.8% to 10.7% during the same period, reaching its highest point at 15% in 2011, and between 2003 and 2015 it was maintained at more than 10%. Economic development increases the demand for water resources, impacts water quality and poses marked pressure on resource security [7,46]. The pollution of water resources caused by a continuous increase in farmland fertilizer use and wastewater emissions constitutes the main environmental pressure on water resource security (Figure 4a) [47]. In the 2001–2015 period, the amount of fertilizer used in cultivated land rose from 39.71 kg/hm2·year to 58.86 kg/hm2·year, an increase of 48.22%. The increase in consumption levels and changes in consumption type caused by socioeconomic development has led to the continuously increasing impact of domestic sewage and other factors on water resources [37]. In general, the sustained increase in economic development and pressures of social living standards in the pressure subgroup increased the pressure on water resource security.
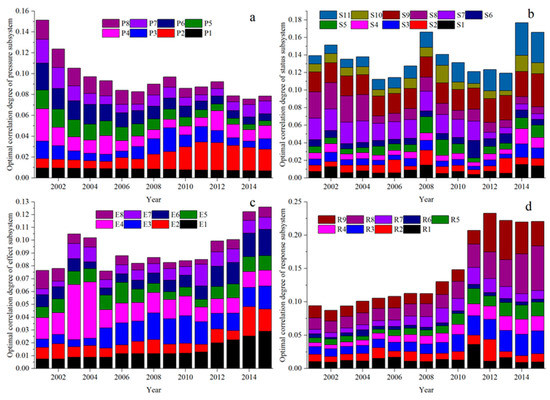
Figure 4.
The optimal correlation of subgroup indicators in Guizhou from 2001–2015. Note: (a–d) is the numbering of Figure 4.
5.2. Analysis of the Changes in the Water Resource Status Subgroup
The status of water resources from 2001 to 2015 showed a clear fluctuating trend (Figure 3b). According to the pressure status indicators (Figure 4b), except for the continuous improvement of the rocky land desertification indicators, other indicators have shown significant fluctuations, which has led to fluctuations in the status subgroup. The continuous improvement of rocky land desertification is mainly due to the sustained promotion of ecological restoration [48]. Precipitation fluctuation and land cover change have a conclusive effect on land surface runoff and the regional water resource [49]. The fluctuations in surface water resource (S3), groundwater resource (S4), and surface runoff coefficient (S10) are affected by precipitation fluctuations and surface cover changes. Findings in relation to water supply and use are as follows.
(1) Water supply. The water storage capacity of large and medium-sized reservoirs per capita (S11) showed continuous improvement, with S11 rising from 68.99 m3/person to 867.13 m3/person, an increase of 12 times, from 2001 to 2015. The construction and improvement of large and medium water conservancy infrastructure facilities of the water conservancy project in central Guizhou increased the water supply.
(2) Water use. The optimal correlation index of agricultural water (S6) fluctuated, and the optimal correlation index of urban public (S7) and ecological environment (S8) consumption of water decreased, indicating that water consumption by agriculture was decreasing, while ecological restoration and urban public demand for water recourses was increasing. With the development of the economy, the scale of traditional industries such as agriculture has reduced, and the efficiency of water resource use has increased [50,51], but together with a sharp increase in industrial water demand. The implementation of the Guizhou ecological province strategy also caused a distinct increase in ecological water consumption [52].
In general, the status subgroup showed volatility, which was a result of the precipitation fluctuations and the special “bivariate” hydrogeological environment of the surface and underground areas, and was mainly affected by precipitation.
5.3. Analysis of Changes in the Water Resource Effect Subgroup
The improvement of the effect subgroup was unstable from 2001 to 2015. The change in the optimal relevance value of the effect subgroup index (Figure 4c) shows that the forest coverage rate (E1) continued to improve with an increase of 19.17% from 2001 to 2015. The increase of forest coverage effectively reduced soil erosion and improved water conservation in the region [53,54]. The continuous reduction per added value of industry (E6) dropped by 68.78% from 2001 to 2015, a significant decrease, and the efficiency of water resource use continued to increase.
The marked increase in the use efficiency of industrial water resources also offsets the increase in demand for water resources caused by industrial growth [55]. The total amount of industrial water consumption in the 2011–2015 period showed a slow decline. The water quality (R5) of the main river section from 2001 to 2015 showed a staggered fluctuation; the qualified rate rose from 69% to 92.3% from 2001 to 2006, decreased to 50% from 2006 to 2011, and presented an upward trend from 2011 to 2015, reaching 81.4% in 2015. The changes in water quality for major river sections were mainly affected by economic development and surveillance of the water environment; that is to say, water quality was influenced by regional development [56]. From 2006 to 2011, after the implementation of the Guizhou industrial development strategy, pollution increased. As a result, green development was encouraged in the 2011–2015 period and by the development of ecological civilization. “Big data” and other low-pollution industries were emphasized. More attention was given to sewage treatment, supervision of environmental water quality, and urban living wastewater treatment, which resulted in improved water quality.
As a whole, the improvement of the effect subgroup was mainly due to factors such as the increased rate in forest coverage, the reduction in water consumption per added value of industry, and the transformation of the industrial structure.
5.4. Analysis of Changes in the Water Resource Response Subgroup
The water resource security response subgroup has been successful in improving the water resource security. From the perspective of the response subgroup indicators (Figure 4d):
- (1)
- Water conservancy investment (R8) and soil erosion management (R9) contributed significantly to water resource security (the rising trend in optimal correlation index is apparent): the investment in water conservancy construction and soil erosion control increased; the investment in water conservancy infrastructure construction was USD 3.08 billion in 2015; and, the total area of water and soil erosion in the 2001–2015 period covered 11,700 km2, accounting for 6.64% of the total land area of the province. Previous studies have shown that continuous investment in resources significantly improved the water resource security [37].
- (2)
- The improvement of industrial production technology and basic water conservancy facilities significantly improved the use efficiency of water resources [57]. The water consumption per unit of GDP (R4) and the water consumption for irrigation per unit farmland (R5) significantly decreased, indicating that the use efficiency of water resource increased significantly. The tertiary industry has a relatively low consumption of water resources [58]. The significant increase in the proportion of the tertiary industry (R7) has further reduced water consumption per unit of GDP.
- (3)
- Regarding sewage treatment, the domestic sewage treatment rate (R3) increased significantly, reaching 90% in 2015; the per unit of GDP pollutant reduction rate (R2) did not change much from 2001 to 2013 and continued to increase from 2013 to 2015.
Guizhou Province has advocated green development, and continued to strengthen emission-reduction measures, eliminate obsolete production capacity, and improve production processes, which have all significantly increased the emission-reduction rate per unit of GDP from pollutants [56,59].
The response subgroup has significantly improved water resource security. There is still much room for improvement in such influential factors as investment in water conservancy, area control of soil erosion, sewage treatment rate, and pollutant reduction rate per unit of GDP. It is necessary to strengthen guidance in policy and further increase the effectiveness of response measures to achieve and maintain a high standard of water security [7].
6. Conclusions
This study based on the PSER conceptual model, applied the entropy weight and TOPSIS-grey correlation model to evaluate water resource security in Guizhou Province from 2001 to 2015. The following main conclusions were drawn:
- (1)
- In the 2001–2015 period, the security of the water resource in Guizhou improved. The sustainable improvements in the effect and the response subgroups were the main influencing factors for water resource security improvement. Specifically, the most significant factors included the forest coverage rate, the water consumption per USD of industrial added value, the proportion of the tertiary industry, the investment in water conservancy, and the management of water and soil erosion. The increased pressure on water resource security and the instability of water resource security are the main factors negatively impacting water resource security, which has been largely due to the use of chemical fertilizers, economic density, annual average GDP growth rate, waste water discharge, and surface runoff.
- (2)
- The water resource subgroup indicators show that the reduction in waste water discharge, the use of chemical fertilizers, the improvement of domestic sewage treatment, the reduction in pollutants per unit of GDP, and the water quality of the main river will greatly improve water resource security, and thus they need to be further strengthened. Within the scope of the water resource carrying capacity, an increase in the underground water supply, a reduction in water consumption per unit industrial added value, strengthened soil erosion management, and improved desertification treatment and higher forest coverage rates have greatly contributed to improved water security. In addition, industrial restructuring, investment in water conservancy, construction of large and medium-sized reservoirs, and other water conservancy facilities have contributed to promoting the security of water resources.
Overall, the water resource security assessment based on the PSER model can objectively reflect the source of pressure on the water resource security system, the efficiency of existing response measures in decreasing water resource system stress, and the effect of natural factors such as precipitation on water resource security. It has important scientific reference value for the government to perfect water resource management with the most economical and effective measures under the constraint of limited resources. However, the assessment of water resource security presented in this article did not consider the cyclical process of water resource in the natural–social binary system, i.e., natural water-use facilities–actual economic and social ecological environment and other actual water departments–actual consumption or infiltration and emissions return to nature. In the future, the cyclical process of water resource in nature–society systems need to be further considered to provide support for developing better water resource management measures.
Author Contributions
The study was designed by F.Z. (Feng Zhou), W.S., F.Z. (Fengtai Zhang) The data from yearbooks and professional websites are retrieved by F.Z. (Feng Zhou). F.Z. (Feng Zhou) wrote the manuscript. W.S. and F.Z. (Fengtai Zhang) provided important ideas and suggestions.
Acknowledgments
This research was funded by [the National Key Research and Development Program during the 13th Five-Year Plan Period of China] [No. 2016YFC0502601]; [Science and Technology Fund of Guizhou Province, China] [[2015]2001]; [the National Key Research and Development Program during the 13th Five-Year Plan Period of China] [No.2016YFC0400708]; [Humanities and Social Sciences Fund of the Ministry of Education of China] [19YJCZH241].
Conflicts of Interest
The authors declare no conflict of interest.
References
- Ren, C.F.; Guo, P.; Li, M.; Li, R.H. An innovative method for water resources carrying capacity research–metabolic theory of regional water resources. J. Environ. Manag. 2016, 167, 139–146. [Google Scholar] [CrossRef] [PubMed]
- Birendra, K.; Schultz, B.; Prasad, K. Water management to meet present and future food demand. Irrig. Drain. 2011, 60, 348–359. [Google Scholar]
- Bogardi, J.J.; Dudgeon, D.; Lawford, R.; Flinkerbusch, E.; Meyn, A.; Pahl-Wostl, C.; Vielhauer, K.; Vörösmarty, C. Water security for a planet under pressure: Interconnected challenges of a changing world call for sustainable solutions. Curr. Opin. Environ. Sustain. 2012, 4, 35–43. [Google Scholar] [CrossRef]
- Bakker, K. Water Security: Research challenges and opportunities. Science 2012, 337, 914–915. [Google Scholar] [CrossRef]
- Romero-Lankao, P.; Gnatz, D.M. Conceptualizing urban water security in an urbanizing world. Curr. Opin. Environ. Sustain. 2016, 21, 45–51. [Google Scholar] [CrossRef]
- Malekian, A.; Hayati, D.; Aarts, N. Conceptualizations of water security in the agricultural sector: Perceptions, practices, and paradigms. J. Hydrol. 2017, 544, 224–232. [Google Scholar] [CrossRef]
- Gu, S.; Jenkins, A.; Gao, S.-J.; Lu, Y.; Li, H.; Li, Y.; Ferrier, R.C.; Bailey, M.; Wang, Y.; Zhang, Y.; et al. Ensuring water resource security in China; the need for advances in evidence-based policy to support sustainable management. Environ. Sci. Policy 2017, 75, 65–69. [Google Scholar] [CrossRef]
- Gain, A.K.; Giupponi, C.; Wada, Y. Measuring global water security towards sustainable development goals. Environ. Res. Lett. 2016, 11, 124015. [Google Scholar] [CrossRef]
- Lu, S.; Bao, H.; Pan, H. Urban water security evaluation based on similarity measure model of Vague sets. Int. J. Hydrogen Energy 2016, 41, 15944–15950. [Google Scholar] [CrossRef]
- Veettil, A.V.; Mishra, A.K. Water security assessment using blue and green water footprint concepts. J. Hydrol. 2016, 542, 589–602. [Google Scholar] [CrossRef]
- Al-Saidi, M. Conflicts and security in integrated water resources management. Environ. Sci. Policy 2017, 73, 38–44. [Google Scholar] [CrossRef]
- Butler, C.; Adamowski, J. Empowering marginalized communities in water resources management: Addressing inequitable practices in Participanty Model Building. J. Environ. Manag. 2015, 153, 153–162. [Google Scholar] [CrossRef] [PubMed]
- Lu, Y.; Song, S.; Wang, R.; Liu, Z.; Meng, J.; Sweetman, A.J.; Jenkins, A.; Ferrier, R.C.; Li, H.; Luo, W.; et al. Impacts of soil and water pollution on food safety and health risks in China. Environ. Int. 2015, 77, 5–15. [Google Scholar] [CrossRef] [PubMed]
- Gosling, S.N.; Arnell, N.W. A global assessment of the impact of climate change on water scarcity. Clim. Chang. 2013, 134, 371–385. [Google Scholar] [CrossRef]
- Sun, F.; Staddon, C.; Chen, M. Developing and applying water security metrics in China: Experience and challenges. Curr. Opin. Environ. Sustain. 2016, 21, 29–36. [Google Scholar] [CrossRef]
- Gerlak, A.K.; House-Peters, L.; Varady, R.G.; Albrecht, T.; Zúñiga-Terán, A.; Grenade, R.R.; Cook, C.; Scott, C.A. Water security: A review of place-based research. Environ. Sci. Policy 2018, 82, 79–89. [Google Scholar] [CrossRef]
- Cosgrove, W.J.; Loucks, D.P. Water management: Current and future challenges and research directions. Water Resour. Res. 2015, 51, 4823–4839. [Google Scholar] [CrossRef]
- Cambrainha, G.M.; Fontana, M.E. A multi-criteria decision making approach to balance water supply demand strategies in water supply systems. Production 2018, 28, e20170062. [Google Scholar] [CrossRef]
- Zhang, Z.; Lu, W.X.; Zhao, Y.; Song, W.B. Development tendency analysis and evaluation of the water ecological carrying capacity in the Siping area of Jilin Province in China based on system dynamics and analytic hierarchy process. Ecol. Model. 2014, 275, 9–21. [Google Scholar] [CrossRef]
- Gheewala, S.H.; Silalertruksa, T.; Nilsalab, P.; Mungkung, R.; Perret, S.R.; Chaiyawannakarn, N. Water footprint and impact of water consumption for food, feed, fuel crops production in Thailand. Water 2014, 6, 1698–1718. [Google Scholar] [CrossRef]
- Chouchane, H.; Hoekstra, A.Y.; Krol, M.S.; Mekonnen, M.M. The water footprint of Tunisia from an economic perspective. Ecol. Indic. 2015, 52, 311–319. [Google Scholar] [CrossRef]
- Garrick, D.; Hall, J.W. Water security and society: Risks, metrics, and pathways. Annu. Rev. Environ. Resour. 2014, 39, 611–639. [Google Scholar] [CrossRef]
- An, H.F. The analysis of land use structure in guizhou dynamic evolution. Environ. Res. Monit. 2016, 29, 51–53. [Google Scholar]
- Wang, Z.M.; Yang, G.L.; Hu, L.B. Relationship between the carbonate facies and the karst groundwater water-bearing conditions in Guizhou. Hydrogeol. Eng. Geol. 2016, 43, 6–11. [Google Scholar]
- Guizhou Province Statistics Bureau. Guizhou Statistical Yearbook; China Statistics Press: Beijing, China, 2002–2016.
- Guizhou Water Resource Bureau. Water Resources Bulletin of Guizhou Province; Guizhou Water Resource Bureau: Guizhou, China, 2001–2015.
- Guizhou Environmental Protection Bureau. Environmental Statistics Bulletin of Guizhou Province; Guizhou Water Resource Bureau: Guizhou, China, 2001–2015.
- Guizhou Province Statistics Bureau. Statistical Communique of Guizhou’s National Economic and Social Development; Guizhou Water Resource Bureau: Guizhou, China, 2001–2015.
- Yasser, M.; Jahangir, K.; Mohmmad, A. Earth dam site selection using the analytic hierarchy process (AHP): A case study in the west of Iran. Arab. J. Geosci. 2013, 6, 3417–3426. [Google Scholar] [CrossRef]
- Wang, R.; Chen, X.W.; Chen, Y. Comparison of assessment methods for regional water resources sustainable use. J. Nat. Resour. 2015, 30, 1943–1955. [Google Scholar]
- Nie, R.; Tian, Z.; Wang, J.; Zhang, H.; Wang, T. Water security sustainability evaluation: Applying a multistage decision support framework in industrial region. J. Clean. Prod. 2018, 196, 1681–1704. [Google Scholar] [CrossRef]
- OECD. OECD Environmental Indicators: Development, Measurement and Use; Reference Paper; OECD: Paris, France, 2003; p. 50. [Google Scholar]
- Chaves, H.M.L.; Alipaz, S. An Integrated Indicator Based on Basin Hydrology, Environment, Life, and Policy: The Watershed Sustainability Index. Water Resour. Manag. 2006, 21, 883–895. [Google Scholar] [CrossRef]
- Pissourios, I.A. An interdisciplinary study on indicators: A comparative review of quality-of-life, macroeconomic, environmental, welfare and sustainability indicators. Ecol. Indic. 2013, 34, 420–427. [Google Scholar] [CrossRef]
- Liu, N.; Liu, C.; Xia, Y.; Da, B. Examining the coordination between urbanization and eco-environment using coupling and spatial analyses: A case study in China. Ecol. Indic. 2018, 93, 1163–1175. [Google Scholar] [CrossRef]
- Dirnböck, T.; Kobler, J.; Kraus, D.; Grote, R.; Kiese, R. Impacts of management and climate change on nitrate leaching in a forested karst area. J. Environ. Manag. 2016, 165, 243–252. [Google Scholar] [CrossRef] [PubMed]
- Ashfaq, M.Y.; Al-Ghouti, M.A.; Qiblawey, H.; Zouari, N.; Rodrigues, D.F.; Hu, Y. Use of DPSIR Framework to Analyze Water Resources in Qatar and Overview of Reverse Osmosis as an Environment Friendly Technology. Environ. Prog. Sustain. Energy 2019, 38, 1–13. [Google Scholar] [CrossRef]
- Liang, L.; Zai, B.; Duan, L.Q. Theory and methodology for the construction of agricultural environmental quality evaluation system based on household production behavior: Based on the PSER model. J. Henan Univ. 2017, 47, 505–513. [Google Scholar]
- Zhang, J.Y.; Wang, L.C. Assessment of water resource security in Chongqing City of China: What has been done and what remains to be done? Nat. Hazards 2015, 75, 2751–2772. [Google Scholar] [CrossRef]
- Yang, Z.H.; Zhou, Q.W.; Guo, Y.; Su, W.C.; Zhang, F.T. Dynamic assessment of water resources security in karst area based on SPA-MC model-a case study of Guiyang city. China Environ. Sci. 2017, 37, 1589–1600. [Google Scholar]
- Wang, W.; Chau, K.; Xu, D.; Chen, X. Improving forecasting accuracy of annual runoff time series using ARIMA based on EEMD decomposition. Water Resour. Manag. 2015, 29, 2655–2675. [Google Scholar] [CrossRef]
- Feng, Y.Q.; Li, X.M.; Li, X.W. Comprehensive evaluation method for the railway safety based on the entropy method and the grey relation analysis. J. Saf. Environ. 2014, 14, 73–79. [Google Scholar]
- Xia, Q.Y.; Wu, Q.Z. A technique of order preference by similarity to ideal solution for hybrid multiple attribute decision making problems. J. Syst. Eng. 2004, 19, 630–634. [Google Scholar]
- Onu, U.P.; Xie, Q.; Xu, L. A fuzzy TOPSIS model framework for ranking sustainable water supply alternatives. Water Resour. Manag. 2017, 31, 2579–2593. [Google Scholar] [CrossRef]
- Chi, J.J.; Chen, B. Application of TOPSIS-based grey correlation analysis in integrated water resource security evaluation. Bull. Soil Water Conserv. 2009, 29, 155–159. [Google Scholar]
- Tao, T.; Xin, K. A Sustainable plan for China’s drinking water. Nature 2014, 511, 527–528. [Google Scholar] [CrossRef] [PubMed]
- Van Puijenbroek, P.J.T.M.; Beusen, A.H.W.; Bouwman, A.F. Global nitrogen and phosphorus in urban waste water based on the Shared Socioeconomic pathways. J. Environ. Manag. 2019, 231, 446–456. [Google Scholar] [CrossRef] [PubMed]
- Zhang, J.Y.; Dai, M.H.; Wang, L.C.; Zeng, C.F.; Su, W.C. The challenge and future of rocky desertification control in karst areas in southwest China. Solid Earth 2016, 7, 83–91. [Google Scholar] [CrossRef]
- Wang, D.; Shen, Y.; Huang, J.; Li, Y. Rock outcrops redistribute water to nearby soil patches in karst landscapes. Environ. Sci. Pollut. Res. 2016, 23, 8610–8616. [Google Scholar] [CrossRef] [PubMed]
- Kang, S.; Hao, X.; Du, T.; Tong, L.; Su, X.; Lu, H.; Li, X.; Huo, Z.; Li, S.; Ding, R. Improving agricultural water productivity to ensure food security in China under changing environment: From research to practice. Agric. Water Manag. 2017, 179, 5–17. [Google Scholar] [CrossRef]
- Delorit, J.D.; Block, P. Promoting competitive water resource use efficiency at the water-market scale: An intercooperative demand equilibrium-based approach to water trading. Water Resour. Res. 2018, 54, 5394–5421. [Google Scholar] [CrossRef]
- Pahl-Wostl, C.; Knüppe, K. Water security and environmental water needs: The role of the ecosystem services concept and transformation of governance systems. Handb. Water Secur. 2017, 14, 226–238. [Google Scholar]
- Tong, X.; Brandt, M.; Yue, Y.; Horion, S.; Wang, K.; Keersmaecker, W.D.; Tian, F.; Schurgers, G.; Xiao, X.; Luo, Y.; et al. Increased vegetation growth and carbon stock in China karst via ecological engineering. Nat. Sustain. 2018, 1, 44–50. [Google Scholar] [CrossRef]
- Balthazar, V.; Vanacker, V.; Molina, A.; Lambin, E.F. Impacts of forest cover change on ecosystem services in high Andean mountains. Ecol. Indic. 2015, 48, 63–75. [Google Scholar] [CrossRef]
- Levidow, L.; Lindgaard-Jørgensen, P.; Nilsson, Å.; Skenhall, S.A.; Assimacopoulos, D. Process eco-innovation: Assessing meso-level eco-efficiency in industrial water-service systems. J. Clean. Prod. 2016, 110, 54–65. [Google Scholar] [CrossRef]
- Wang, Y.; Bian, Y.; Xu, H. Water use efficiency and related pollutants’ abatement costs of regional industrial systems in China: A slacks-based measure approach. J. Clean. Prod. 2015, 101, 301–310. [Google Scholar] [CrossRef]
- Qin, Y.; Curmi, E.; Kopec, G.M.; Allwood, J.M.; Richards, K.S. China’s energy-water nexus–assessment of the energy sector’s compliance with the “3 Red Lines” industrial water policy. Energy Policy 2015, 82, 131–143. [Google Scholar] [CrossRef]
- Li, Y.; Zhang, Z.; Shi, M. What should be the future industrial structure of the Beijing-Tianjin-Hebei city region under water resource constraint? An inter-city input-output analysis. J. Clean. Prod. 2019, 239, 118117. [Google Scholar] [CrossRef]
- Alvarez, P.J.J.; Chan, C.K.; Elimelech, M.; Halas, N.J.; Villagrán, D. Emerging opportunities for nanotechnology to enhance water security. Nat. Nanotechnol. 2018, 13, 634–641. [Google Scholar] [CrossRef] [PubMed]
© 2019 by the authors. Licensee MDPI, Basel, Switzerland. This article is an open access article distributed under the terms and conditions of the Creative Commons Attribution (CC BY) license (http://creativecommons.org/licenses/by/4.0/).