Human Activity Intensity Assessment by Remote Sensing in the Water Source Area of the Middle Route of the South-to-North Water Diversion Project in China


Abstract
1. Introduction
2. Materials and Methods
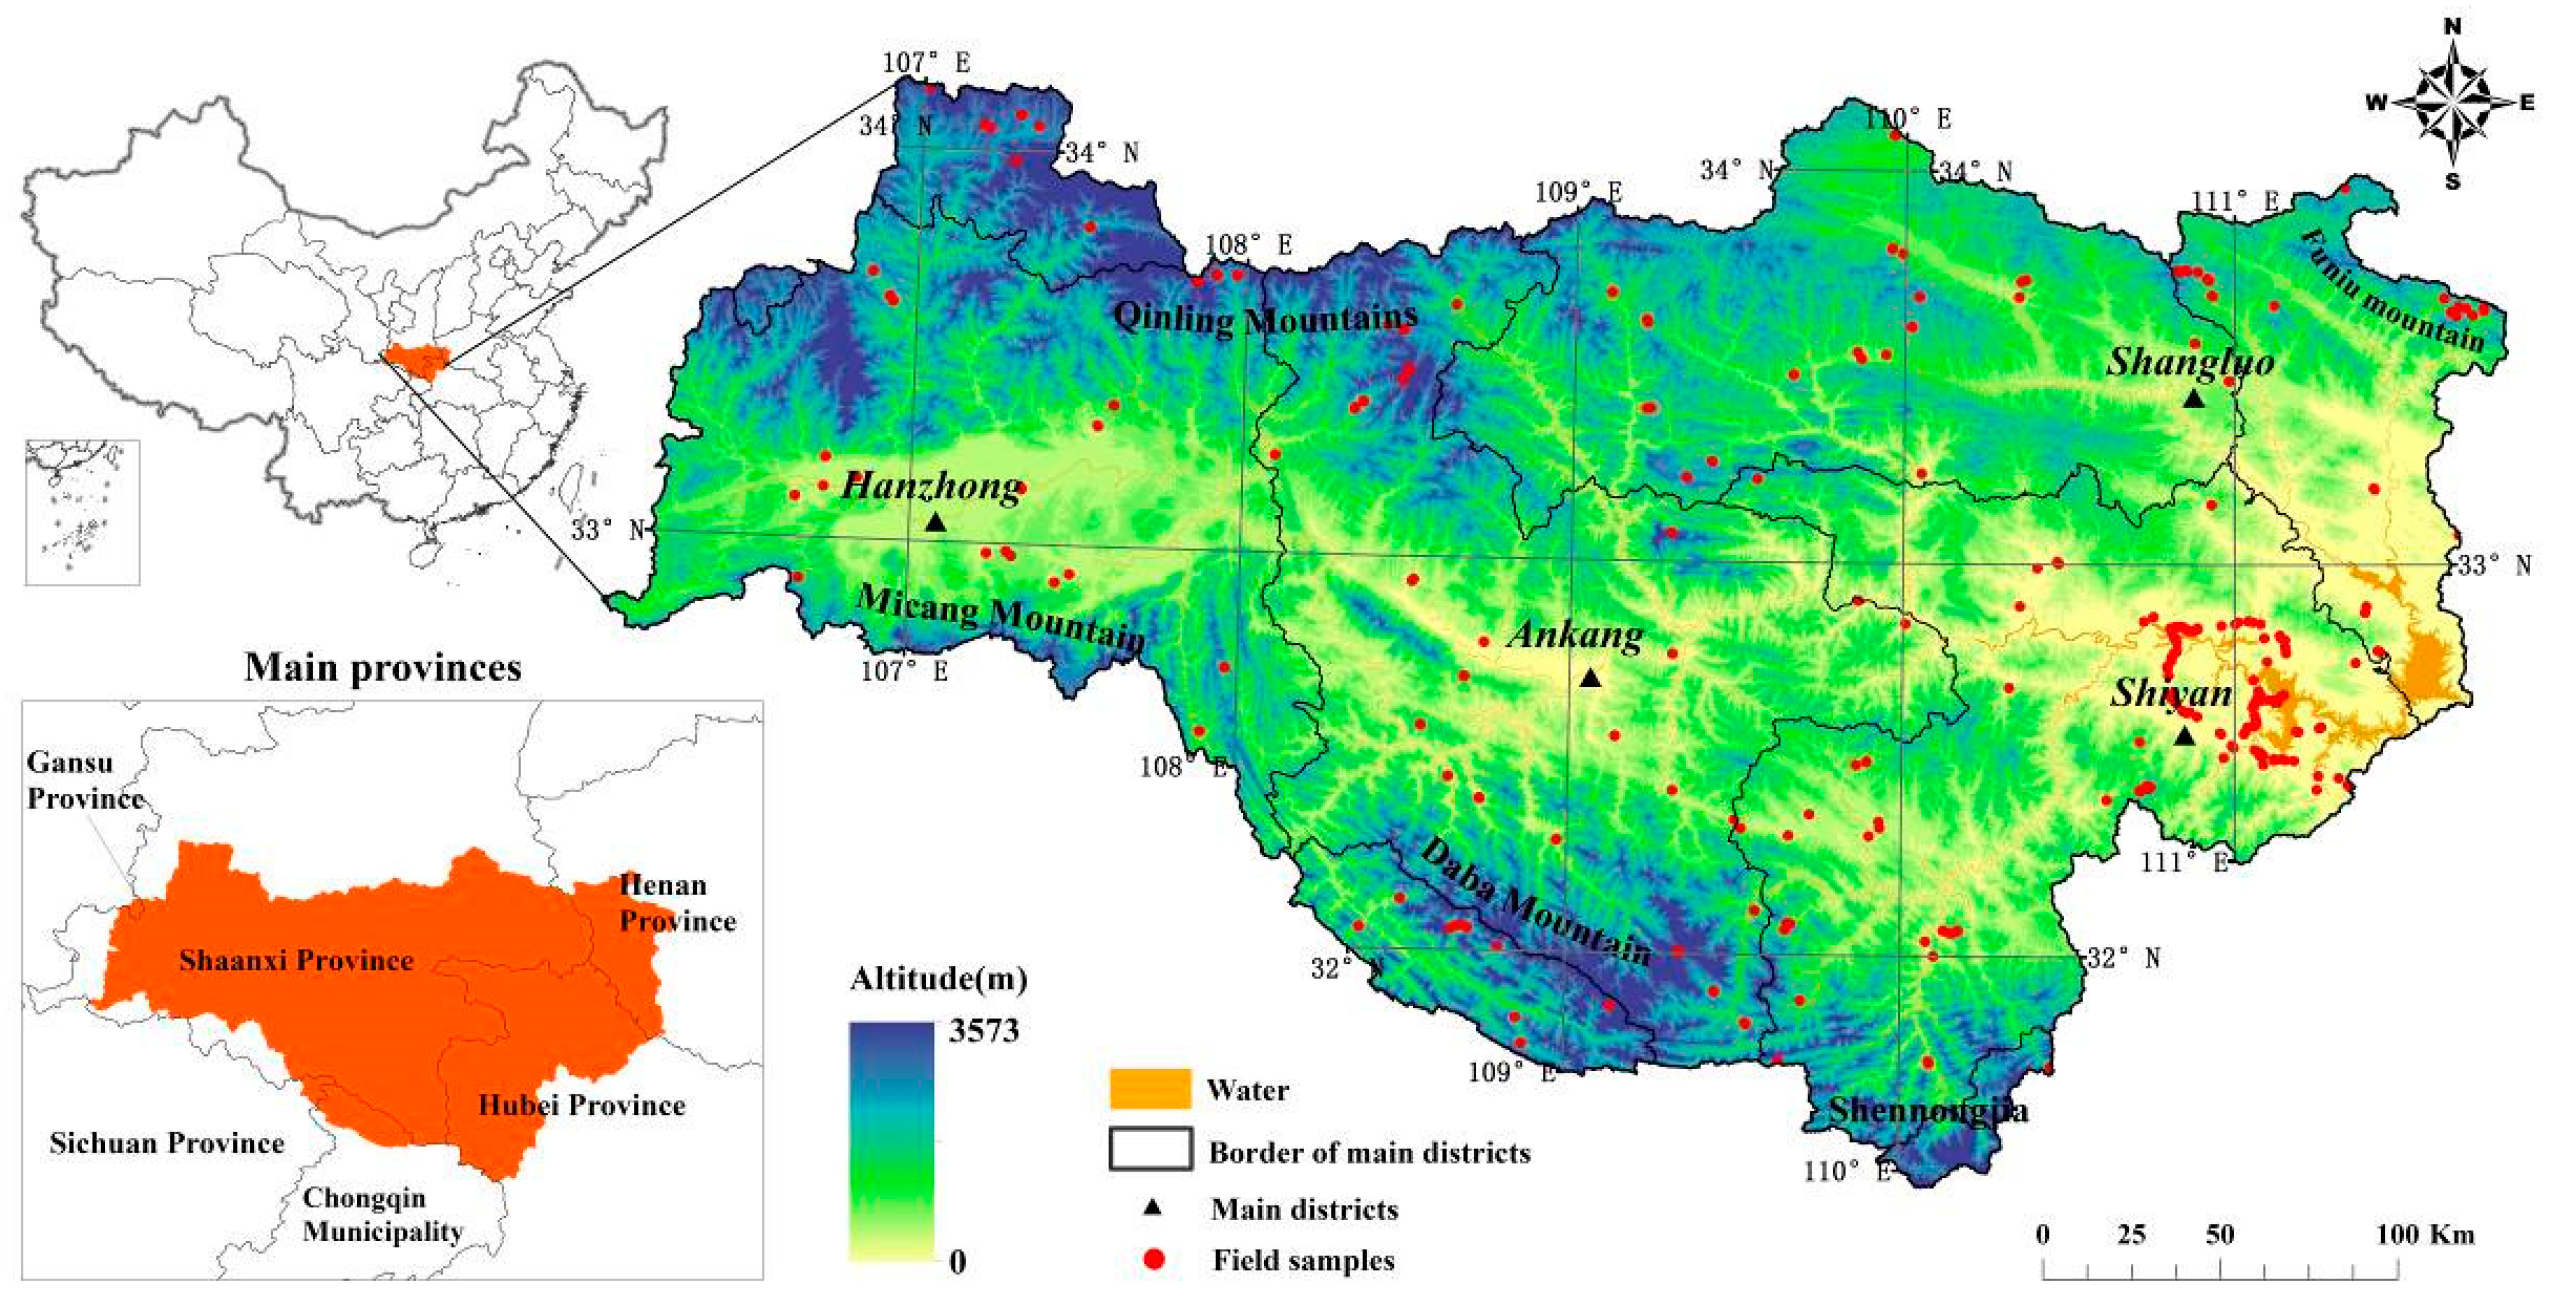
2.1. Study Area
2.2. Land Cover Classification
2.3. Quantification of Human Activity Intensity
2.4. Spatial and Statistical Analysis Methods
3. Results
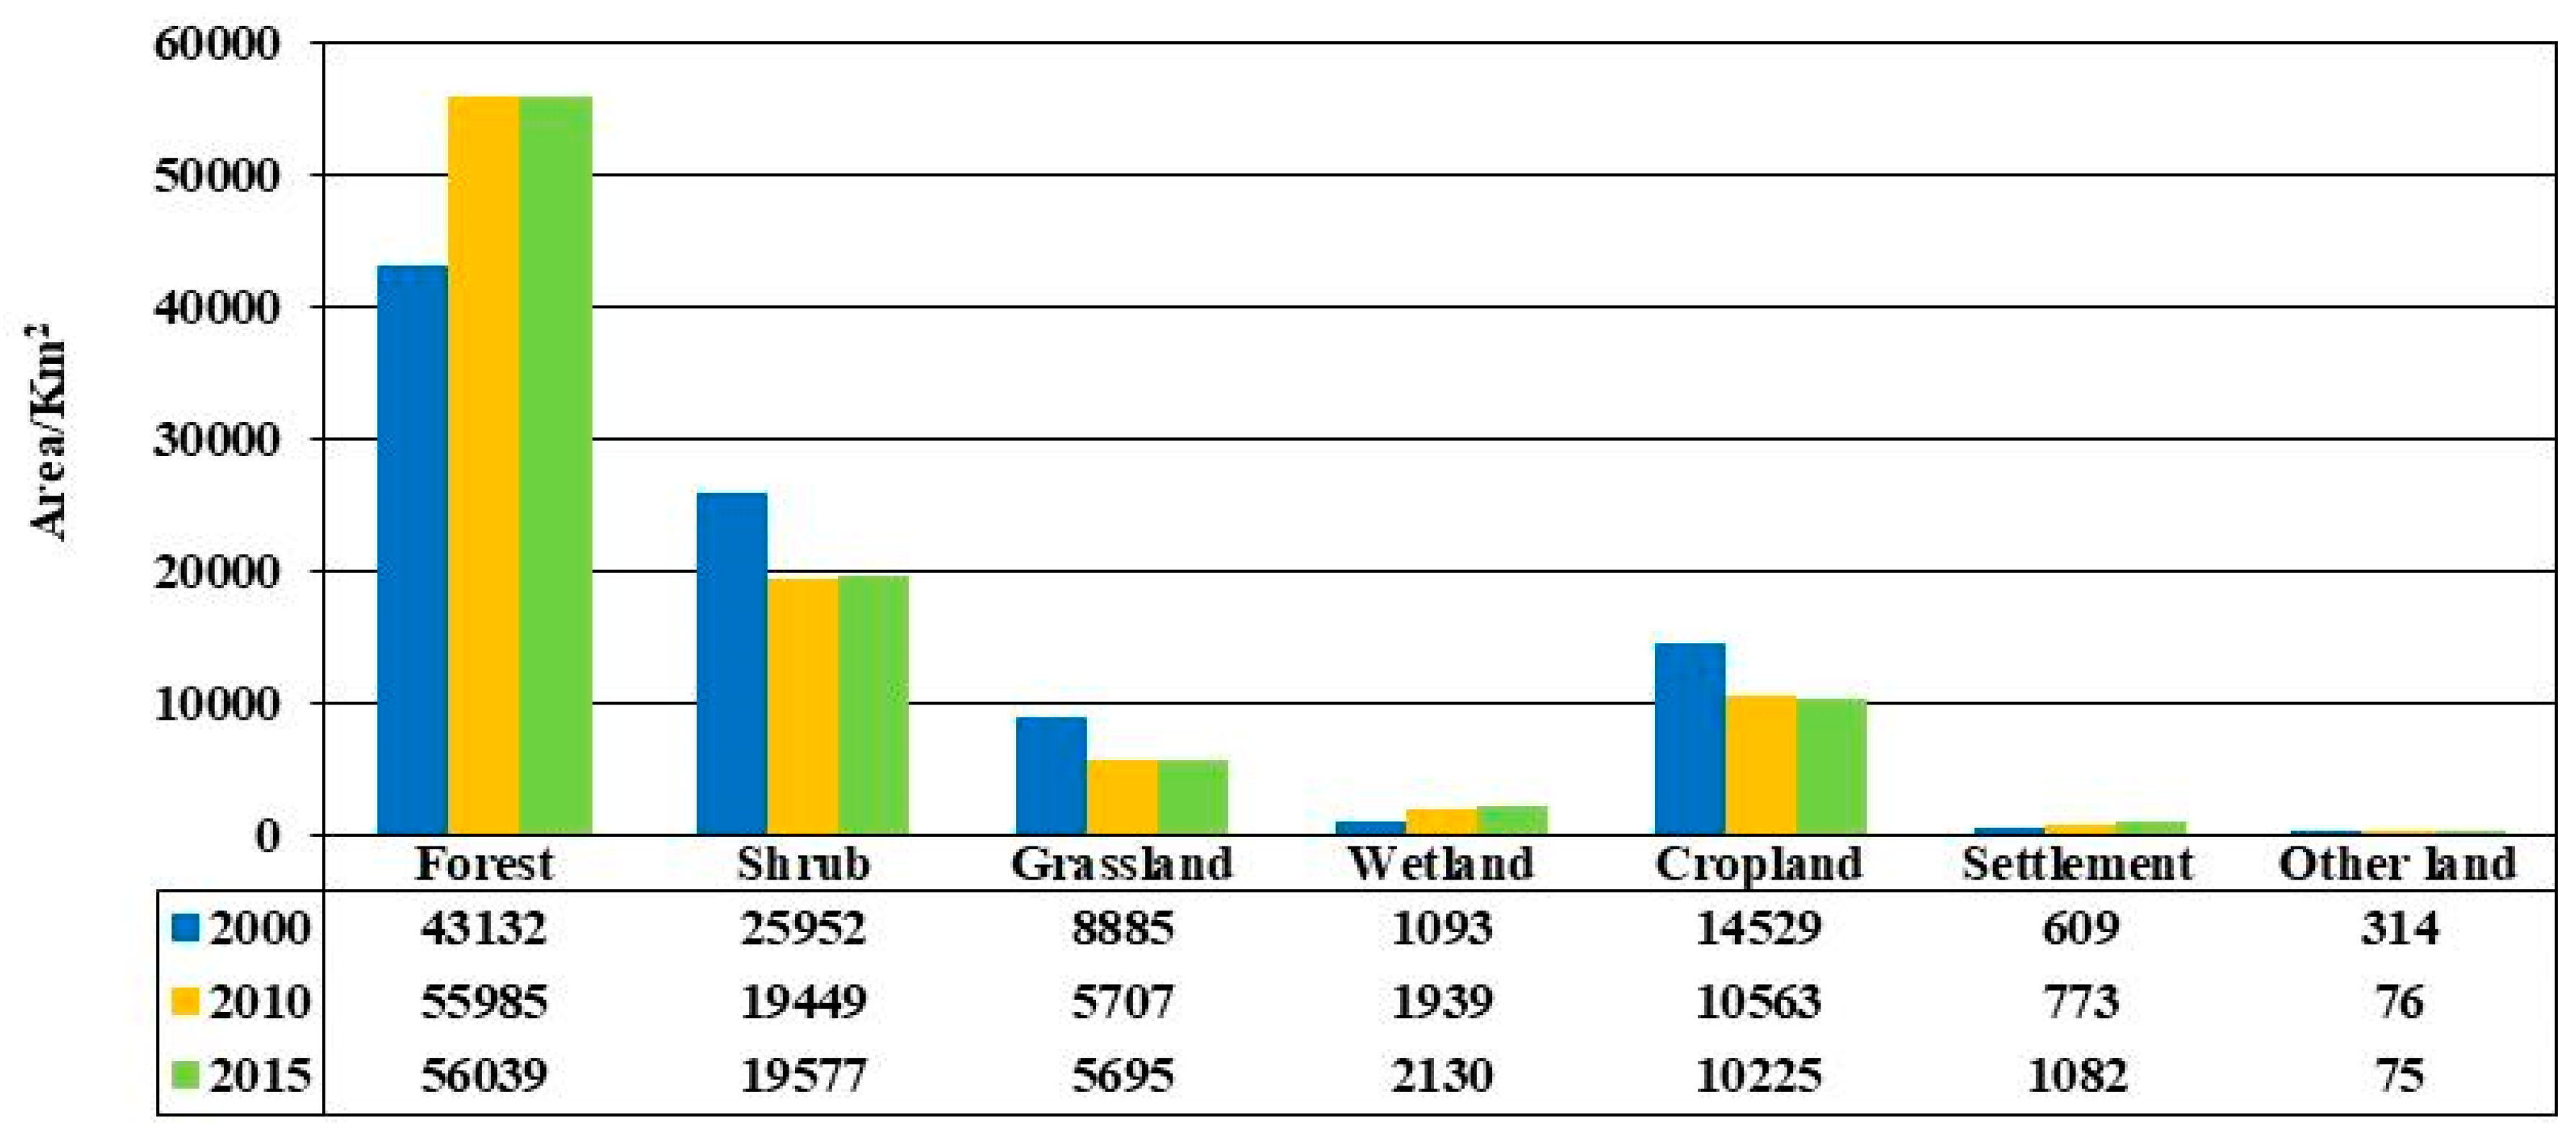
3.1. Land Cover
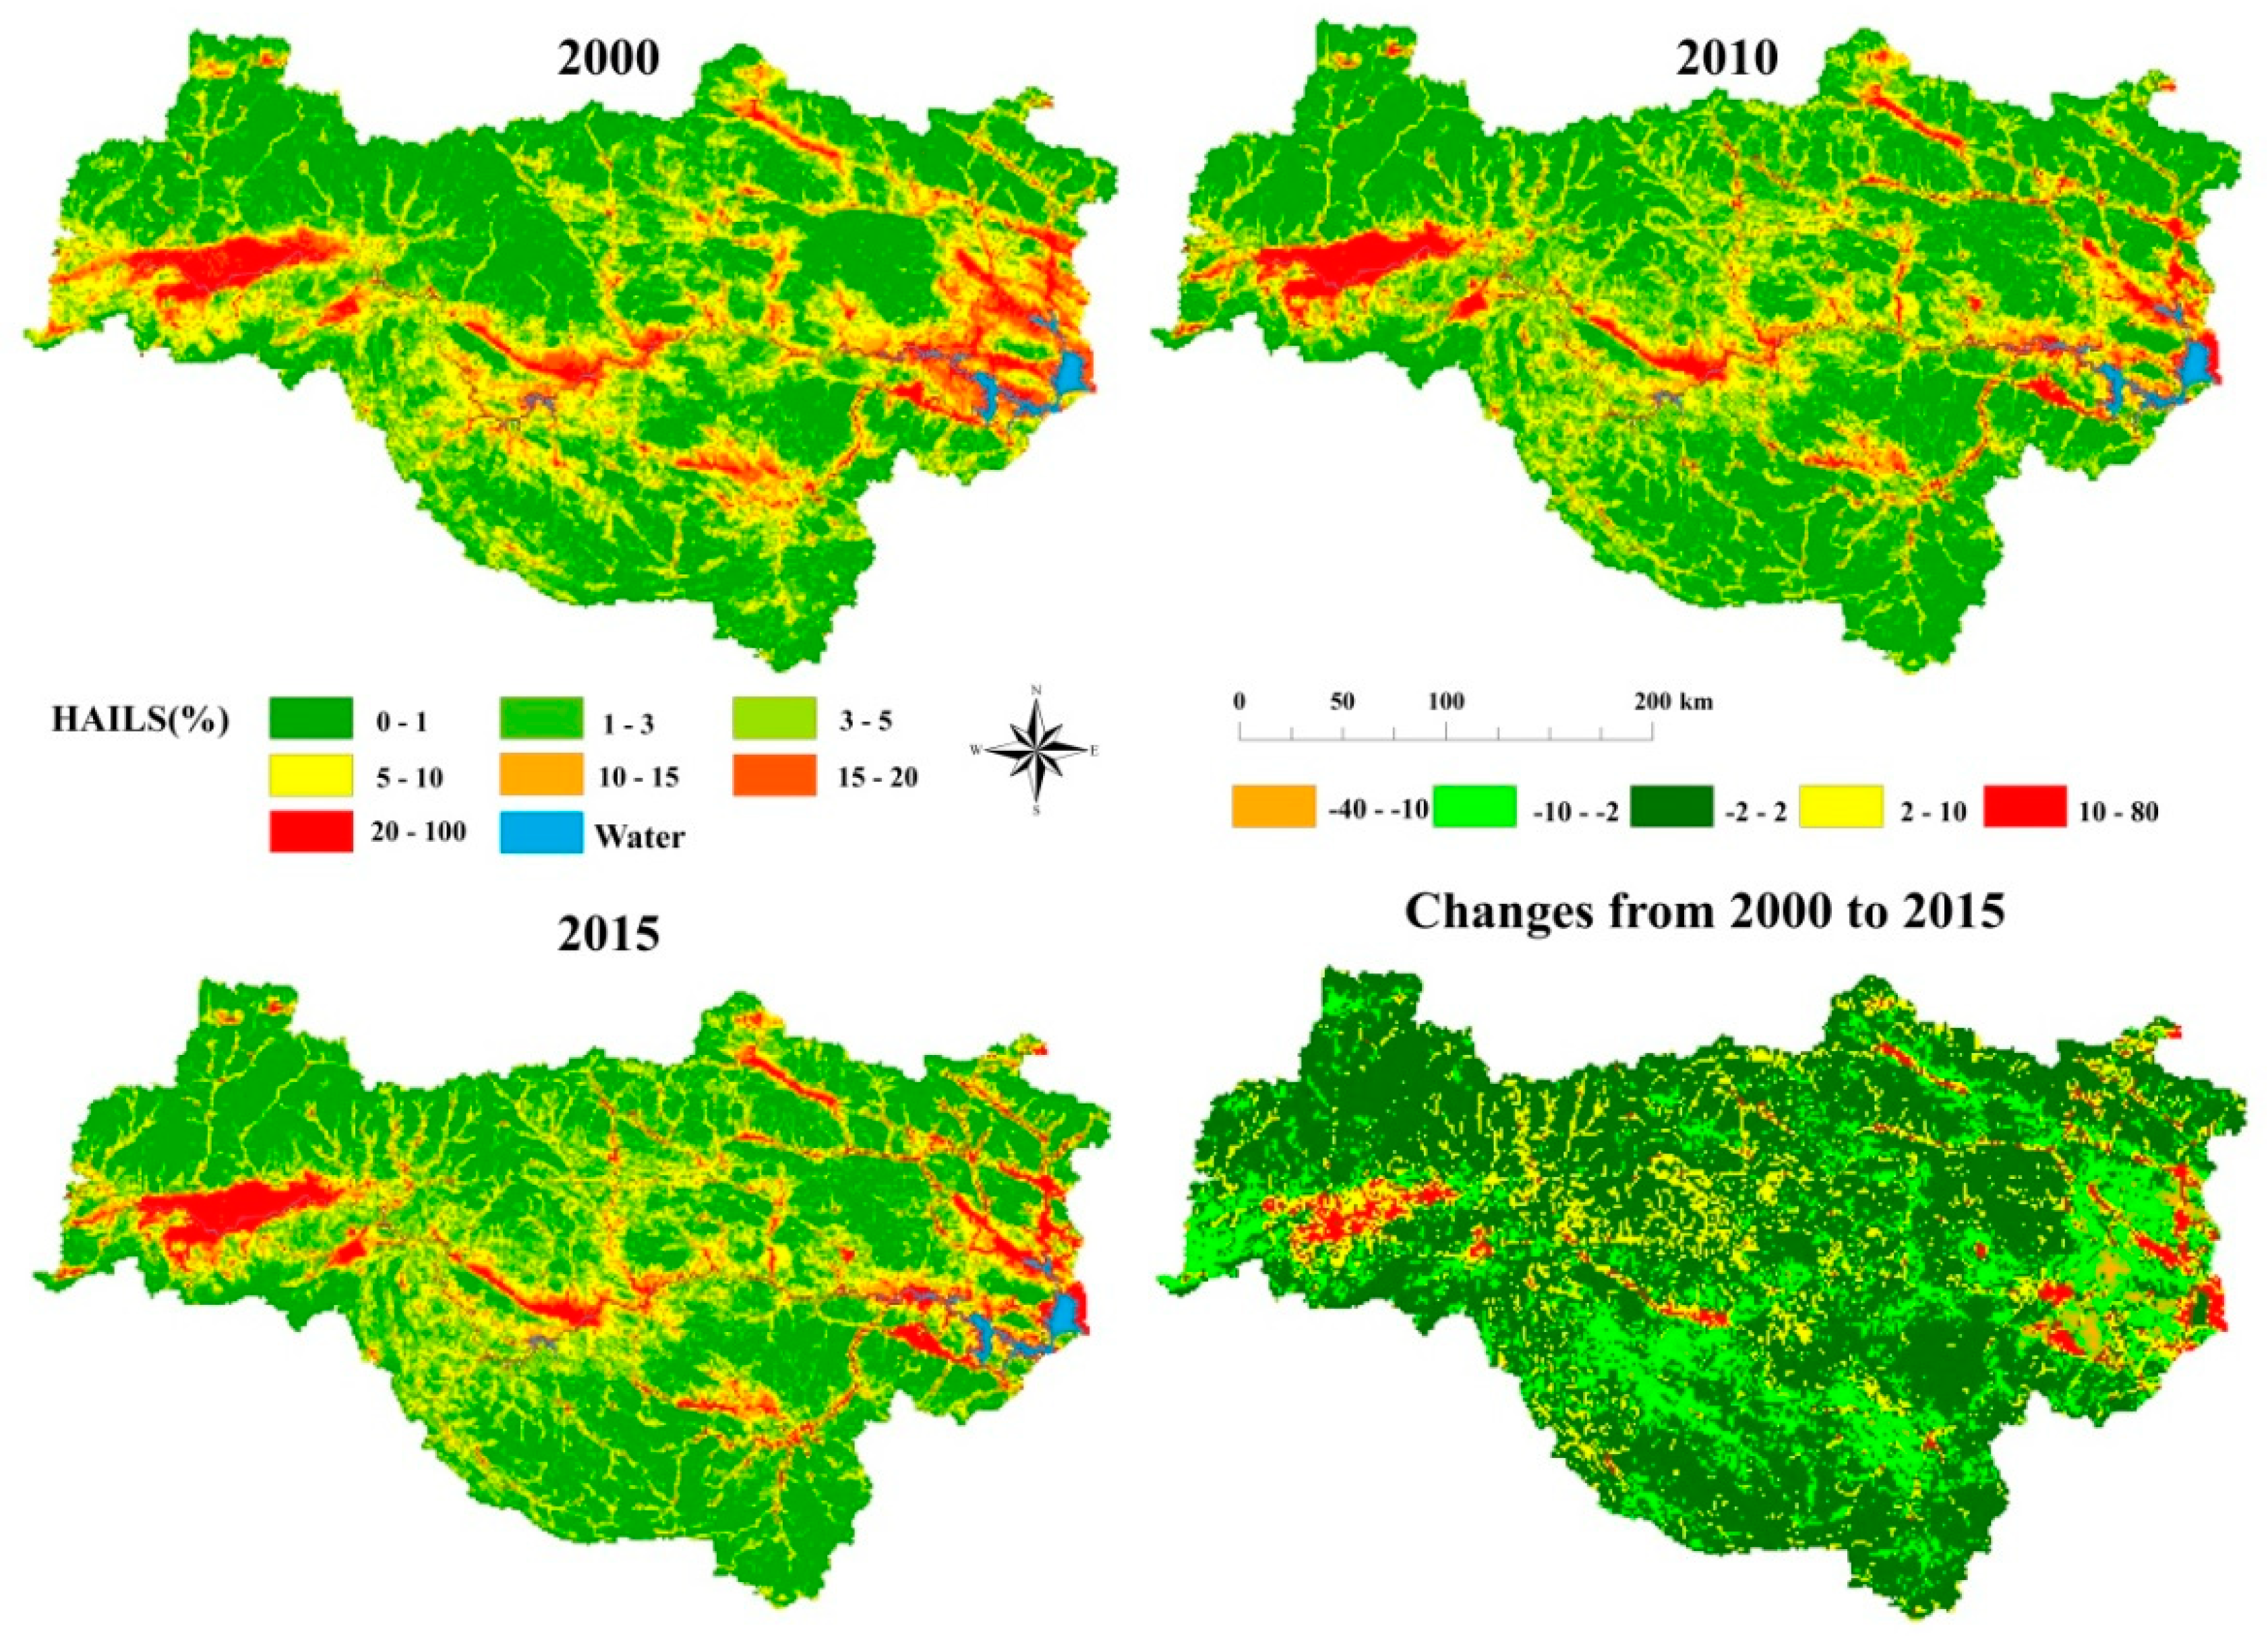
3.2. Spatial Pattern of HAILS
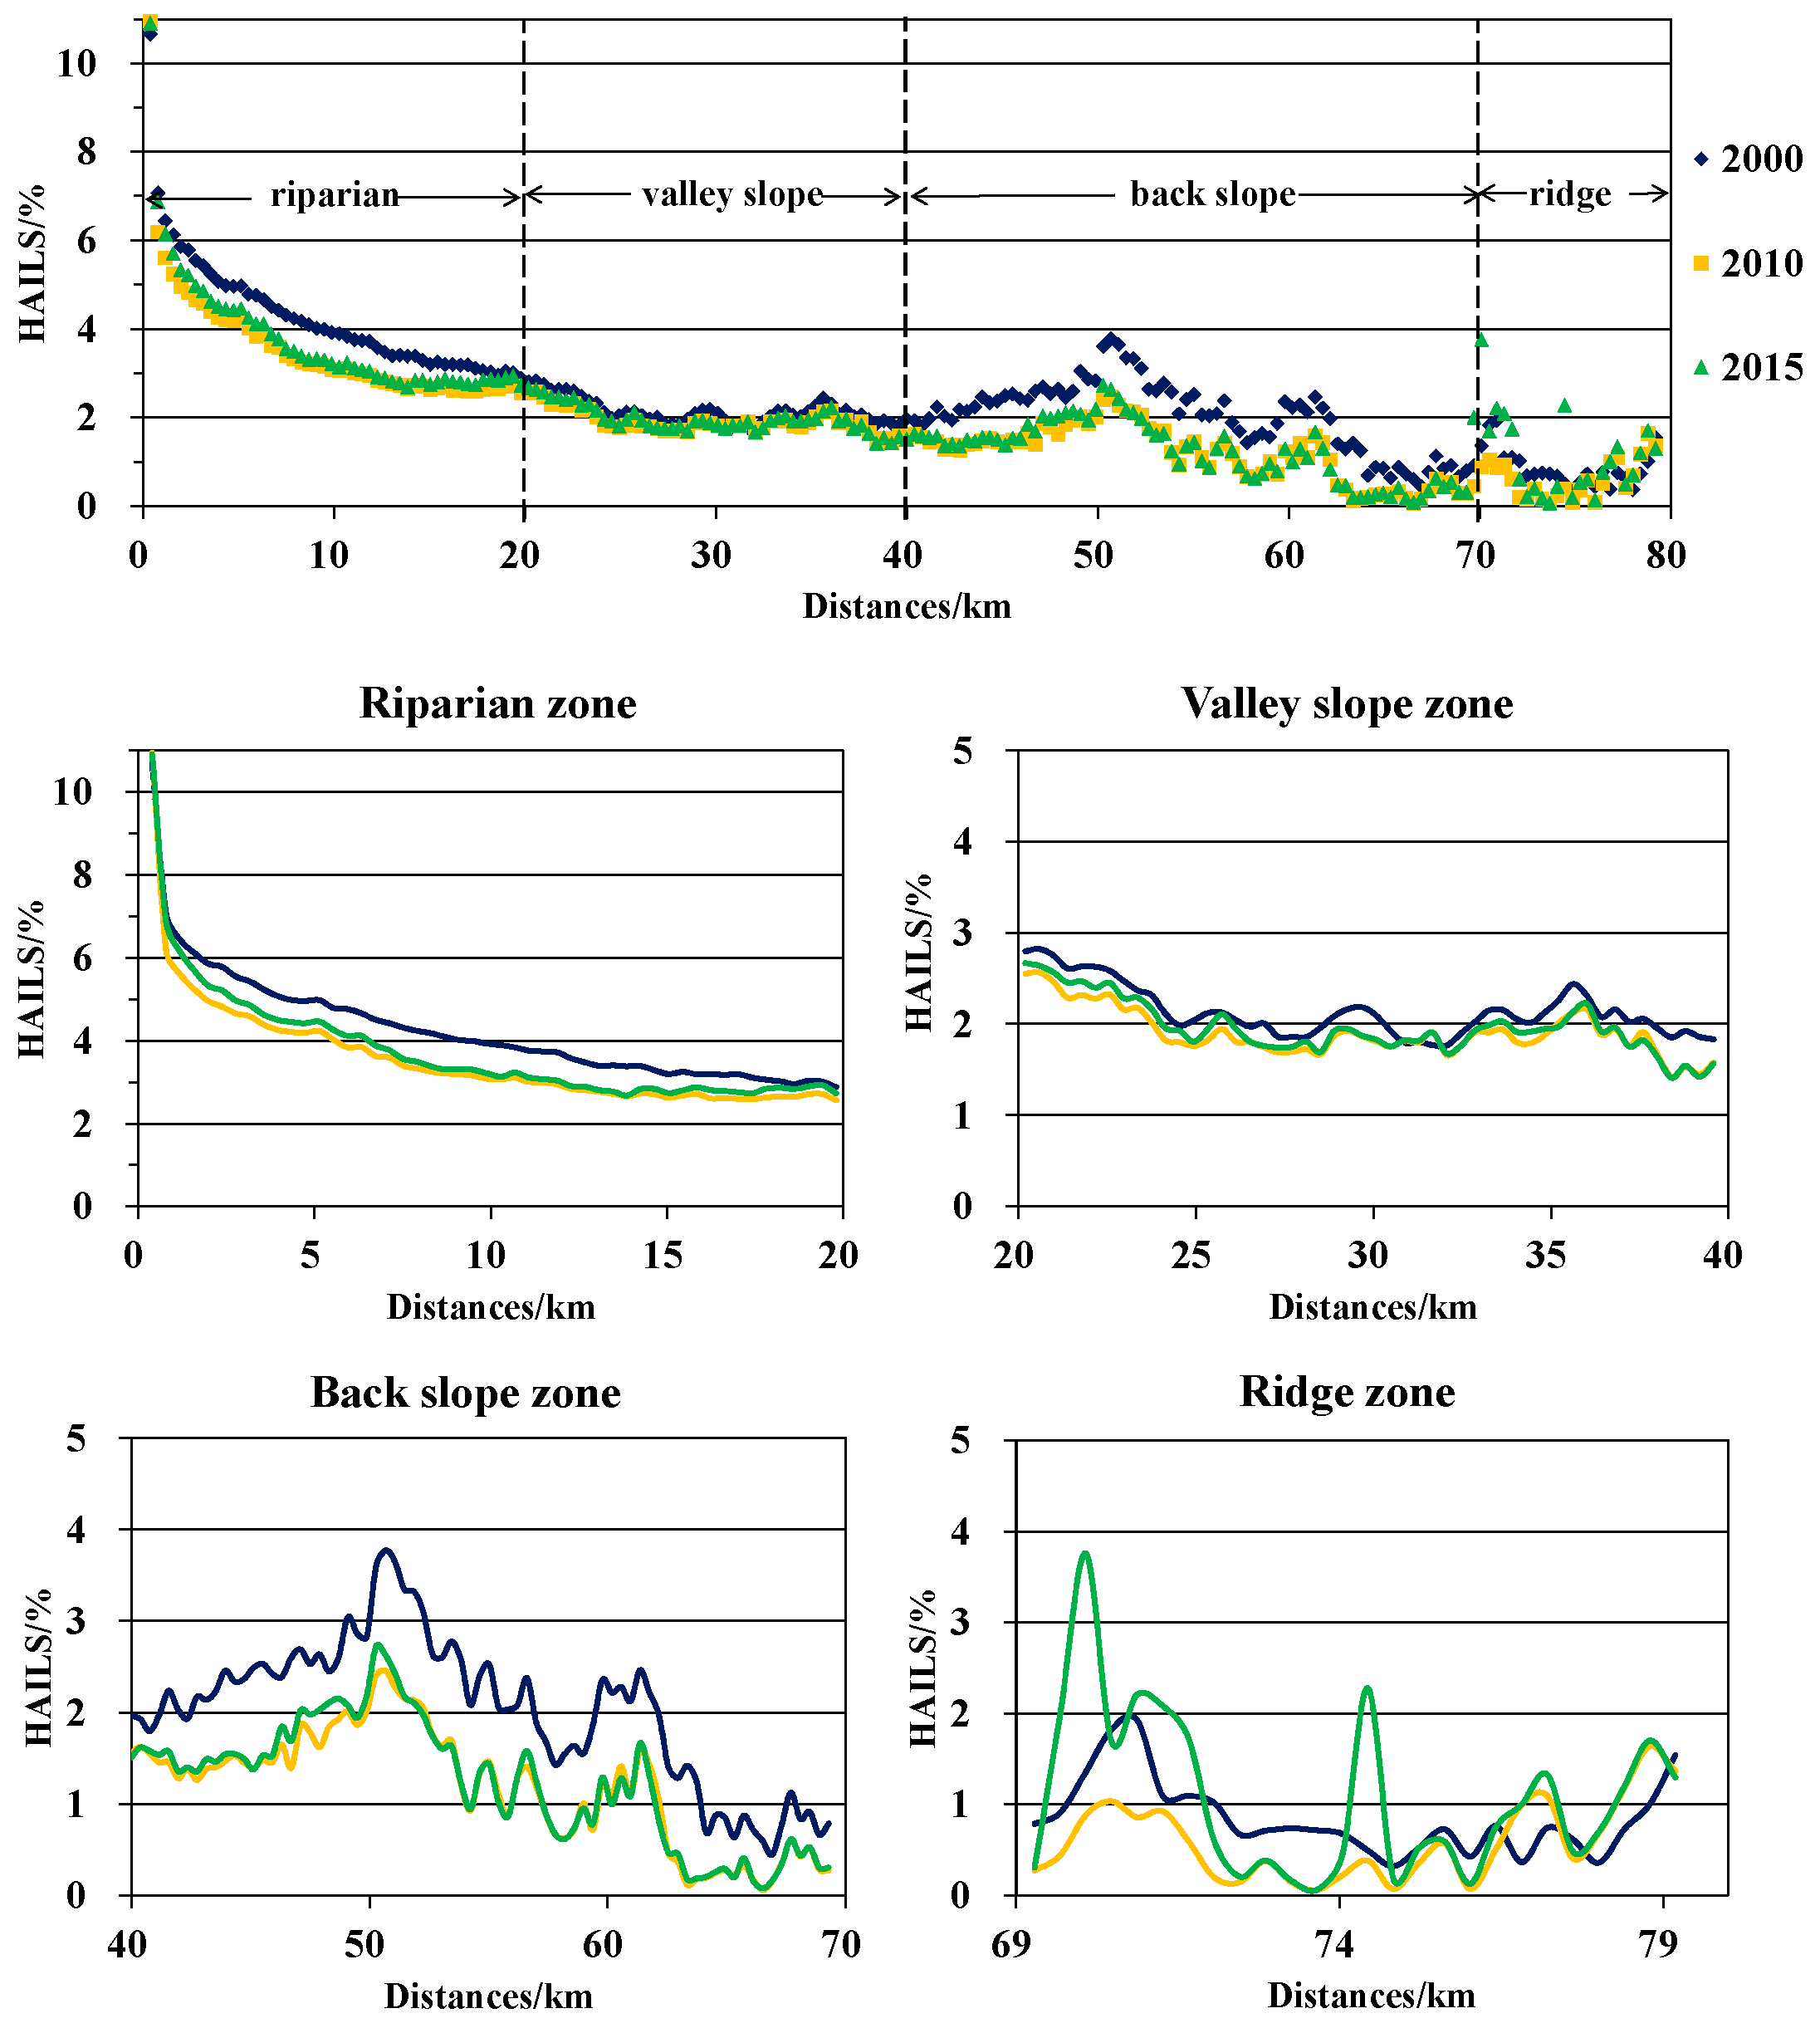
3.3. HAILS Variation among Flow-Length Belts
3.4. Relationship between the HAILS and Human Activity
4. Discussion
4.1. Effectiveness of HAILS
4.2. Impacts of Human Activity
5. Conclusions
Author Contributions
Funding
Acknowledgments
Conflicts of Interest
References
- De Groot, R.S.; Wilson, M.A.; Boumans, R.M.J. A typology for the classification, description and valuation of ecosystem functions, goods and services. Ecol. Econ. 2002, 41, 393–408. [Google Scholar] [CrossRef]
- Faber, J.H.; Van Wensem, J. Elaborations on the use of the ecosystem services concept for application in ecological risk assessment for soils. Sci. Total Environ. 2012, 415, 3–8. [Google Scholar] [CrossRef] [PubMed]
- Klein Goldewijk, K.; Ramankutty, N. Land cover change over the last three centuries due to human activities: The availability of new global data sets. GeoJournal 2004, 61, 335–344. [Google Scholar] [CrossRef]
- Ouyang, Z.; Zheng, H.; Polasky, S.; Liu, J.; Xu, W.; Wang, Q.; Zhang, L.; Xiao, Y.; Rao, E.; Jiang, L.; et al. Improvements in ecosystem services from investments in natural capital. Science 2016, 352, 1455–1459. [Google Scholar] [CrossRef] [PubMed]
- Seaquist, J.W.; Hickler, T.; Eklundh, L.; Ardö, J.; Heumann, B.W. Disentangling the effects of climate and people on Sahel vegetation dynamics. Biogeosciences 2009, 6, 469–477. [Google Scholar] [CrossRef]
- Vitousek, P.M.; Lubchenco, J.; Melillo, J.M.; Mooney, H.A. Human domination of earth’s ecosystems. Science 1997, 277, 494–499. [Google Scholar] [CrossRef]
- Wessels, K.J.; Prince, S.D.; Frost, P.E.; Van Zyl, D. Assessing the effects of human-induced land degradation in the former homelands of northern South Africa with a 1 km AVHRR NDVI time-series. Remote Sens. Environ. 2004, 91, 47–67. [Google Scholar] [CrossRef]
- Gleckler, P.J.; Santer, B.D.; Domingues, C.M.; Pierce, D.W.; Barnett, T.P.; Church, J.A.; Taylor, K.E.; AchutaRao, K.M.; Boyer, T.P.; Ishii, M.; et al. Human-induced global ocean warming on multidecadal timescales. Nat. Clim. Chang. 2012, 2, 524–529. [Google Scholar] [CrossRef]
- Zhao, C.; Shao, N.; Yang, S.; Ren, H.; Ge, Y.; Zhang, Z.; Feng, P.; Liu, W. Quantitative assessment of the effects of human activities on phytoplankton communities in lakes and reservoirs. Sci. Total Environ. 2019, 665, 213–225. [Google Scholar] [CrossRef]
- Mouri, G. Assessment of land cover relocation incorporating the effects of human activity in typical urban and rural catchments for the design of management policies. Environ. Sci. Policy 2015, 50, 74–87. [Google Scholar] [CrossRef]
- Syvitski, J.P.M.; Kettner, A.J.; Overeem, I.; Hutton, E.W.H.; Hannon, M.T.; Brakenridge, G.R.; Day, J.; Vörösmarty, C.; Saito, Y.; Giosan, L.; et al. Sinking deltas due to human activities. Nat. Geosci. 2009, 2, 681–686. [Google Scholar] [CrossRef]
- Cao, Z.; Duan, H.; Feng, L.; Ma, R.; Xue, K. Climate- and human-induced changes in suspended particulate matter over Lake Hongze on short and long timescales. Remote Sens. Environ. 2017, 192, 98–113. [Google Scholar] [CrossRef]
- Valipour, M. Land use policy and agricultural water management of the previous half of century in Africa. Appl. Water Sci. 2015, 367–395. [Google Scholar] [CrossRef]
- Mariano, D.A.; dos Santos, C.A.C.; Wardlowa, B.D.; Anderson, M.C.; Schiltmeyer, A.V.; Tadesse, T.; Svoboda, M.D. Use of remote sensing indicators to assess effects of drought and human-induced land degradation on ecosystem health in Northeastern Brazil. Remote Sens. Environ. 2018, 213, 129–143. [Google Scholar] [CrossRef]
- Wang, T.; Sun, J.; Han, H.; Yan, C. The relative role of climate change and human activities in the desertification process in Yulin region of northwest China. Environ. Monit. Assess. 2011, 184, 7165–7173. [Google Scholar] [CrossRef]
- Song, W.; Deng, X. Land-use/land-cover change and ecosystem service provision in China. Sci. Total Environ. 2017, 576, 705–719. [Google Scholar] [CrossRef]
- Zhang, Y.; Zhang, C.; Wang, Z.; Chen, Y.; Gang, C.; An, R.; Li, J. Vegetation dynamics and its driving forces from climate change and human activities in the Three-River Source Region, China from 1982 to 2012. Sci. Total Environ. 2016, 563–564, 210–220. [Google Scholar] [CrossRef]
- Zang, Z.; Zou, X.; Song, Q.; Yao, Y. Analysis of the spatiotemporal correlation between vegetation pattern and human activity intensity in Yancheng coastal wetland, China. Anthr. Coasts 2019, 2, 87–100. [Google Scholar] [CrossRef]
- Gao, Z.J.; Wu, C.L. Quantitative Assessment of Urban Human Activity Intensity Based on GIS-A Case Study of the Pearl River Delta. In Proceedings of the International Conference on Geoinformatics, Beijing, China, 18 June 2010. [Google Scholar]
- Liu, S.H.; Prieler, S.; Li, X.B. Spatial patterns of urban land use growth in Beijing. J. Geogr. Sci. 2002, 12, 266–274. [Google Scholar] [CrossRef]
- Zhang, G.Y.; Wang, Z. Quantitative assessment of human activity intensity in the Heihe catchment. Adv. Earth Sci. 2004, 19, 386–390. [Google Scholar] [CrossRef]
- Wang, J.Z.; Zhang, G.H.; Nie, Z.L.; Yan, M.J. Quantitative assessment of human activity intensity in Hutuohe catchment. J. Arid Land Resour. Environ. 2009, 23, 41–44. [Google Scholar] [CrossRef]
- Dai, Z.X.; Guldmann, J.M.; Hu, Y.F. Spatial regression models of park and land-use impacts on the urban heat island in central Beijing. Sci. Total Environ. 2018, 626, 1136–1147. [Google Scholar] [CrossRef] [PubMed]
- Brown, M.T.; Vivas, M.B. Landscape development intensity index. Environ. Monit. Assess. 2005, 101, 289–309. [Google Scholar] [CrossRef] [PubMed]
- Terra, T.N.; Dos Santos, R.F. Measuring cumulative effects in a fragmented landscape. Ecol. Model. 2012, 228, 89–95. [Google Scholar] [CrossRef]
- Xu, Y.; Xiaoyi, S.; Tang, Q. Human activity intensity of land surface: Concept, method and application in China. J. Geogr. Sci. 2015, 70, 1068–1079. [Google Scholar] [CrossRef]
- Dong, Z.; Yan, Y.; Duan, J.; Fu, X.; Zhou, Q.; Huang, X.; Zhu, X.; Zhao, J. Computing payment for ecosystem services in watersheds: An analysis of the Middle Route Project of South-to-North Water Diversion in China. J. Environ. Sci. 2011, 23, 2005–2012. [Google Scholar] [CrossRef]
- Li, S.; Li, J.; Zhang, Q. Water quality assessment in the rivers along the water conveyance system of the Middle Route of the South to North Water Transfer Project (China) using multivariate statistical techniques and receptor modeling. J. Hazard. Mater. 2011, 195, 306–317. [Google Scholar] [CrossRef]
- Li, S.; Gu, S.; Tan, X.; Zhang, Q. Water quality in the upper Han River basin, China: The impacts of land use/land cover in riparian buffer zone. J. Hazard. Mater. 2009, 165, 317–324. [Google Scholar] [CrossRef]
- Li, W.; Zeng, Y.; Zhang, L.; Yin, K.; Yuan, C.; Wu, B. The spatial pattern of landcover in the drawdown area of Danjiangkou reservoir. Remote Sens. Land Resour. 2011, 91, 108–114. [Google Scholar] [CrossRef]
- Zhou, Z.; Zeng, Y.; Zhang, L.; Du, X.; Wu, B. Remote Sensing monitoring and analysis of fractional vegetation cover in the Water Source Area of the Middle Route of Projects to Divert Water from South to North. Remote Sens. Land Resour. 2012, 92, 70–76. [Google Scholar] [CrossRef]
- Chen, H.C.; Du, P. Potential ecological benefits of the Middle Route for the South-North Water Diversion Project. Tsinghua Sci. Technol. 2008, 13, 715–719. [Google Scholar] [CrossRef]
- Duan, Z.; Zhang, L.; Li, L. The extreme precipitation change characteristics of the source area of the middle route of South-North Water Transfer Project. Procedia Eng. 2012, 28, 569–573. [Google Scholar] [CrossRef]
- Li, S.; Cheng, X.; Xu, Z.; Han, H.; Zhang, Q. Spatial and temporal patterns of the water quality in the Danjiangkou reservoir, China. Hydrol. Sci. J. 2009, 54, 124–134. [Google Scholar] [CrossRef]
- Wang, L.; Ma, C. A study on the environmental geology of the Middle Route Project of the South-North water transfer. Eng. Geol. 1999, 51, 153–165. [Google Scholar] [CrossRef]
- Ren, Z.Y.; Zhang, Y.F.; Li, J. The value of vegetation ecosystem services: A case of Qinling-Daba Mountains. J. Geogr. Sci. 2003, 13, 195–200. [Google Scholar] [CrossRef]
- Lu, Q.; Xu, B.; Liang, F.; Gao, Z.; Ning, J. Influences of the Grain-for-Green project on grain security in southern China. Ecol. Indic. 2013, 34, 616–622. [Google Scholar] [CrossRef]
- Zhou, D.; Zhao, S.; Zhu, C. The grain for green project induced land cover change in the Loess Plateau: A case study with Ansai County, Shanxi Province, China. Ecol. Indic. 2012, 23, 88–94. [Google Scholar] [CrossRef]
- Shen, Y.Q.; Liao, X.C.; Yin, R.S. Measuring the socioeconomic impacts of China’s Natural Forest Protection Program. Environ. Dev. Econ. 2006, 11, 769–788. [Google Scholar] [CrossRef]
- Ren, G.-P.; Young, S.S.; Wang, L.; Wang, W.; Long, Y.; Wu, R.; Li, J.; Zhu, J.; Yu, D.W. Effectiveness of China’s National Forest Protection Program and nature reserves. Conserv. Biol. 2015, 29, 1368–1377. [Google Scholar] [CrossRef]
- Yu, P.; Yang, T.; Wu, C. Impact of climate change on water resources in southern Taiwan. J. Hydrol. 2002, 260, 161–175. [Google Scholar] [CrossRef]
- Zhang, Q. The South-to-North Water Transfer Project of China: Environmental implications and monitoring strategy. J. Am. Water Resour. Assoc. 2009, 45, 1238–1247. [Google Scholar] [CrossRef]
- Richter, R. Correction of satellite imagery over mountainous terrain. Appl. Opt. 1998, 37, 4004. [Google Scholar] [CrossRef] [PubMed]
- Zhang, L.; Li, X.; Yuan, Q.; Liu, Y. Object-based approach to national land cover mapping using HJ satellite imagery. J. Appl. Remote Sens. 2014, 8, 83686. [Google Scholar] [CrossRef]
- Wu, B.; Qian, J.; Zeng, Y.; Zhang, L.; Yan, C.; Wang, Z.; Li, A.; Ma, R.; Yu, X.; Huang, J.; et al. Land Cover Atlas of the People’s Republic of China (1:1,000,000), 1st ed.; Sinomaps Press: Beijing, China, 2017; pp. 254–261. [Google Scholar]
- Sim, J.; Wright, C.C. The kappa statistic in reliability studies: Use, interpretation, and sample size requirements. Phys. Ther. 2005, 85, 257–268. [Google Scholar] [CrossRef] [PubMed]
- Hickey, R. Slope angle and slope length solutions for GIS. Cartography 2000, 29, 1–8. [Google Scholar] [CrossRef]
- Li, Y.; Li, H.; Liu, Z.; Miao, C. Spatial Assessment of Cancer Incidences and the Risks of Industrial Wastewater Emission in China. Sustainability 2016, 8, 480. [Google Scholar] [CrossRef]
- Li, H.; Li, Y.; Lee, M.-K.; Liu, Z.; Miao, C. Spatiotemporal Analysis of Heavy Metal Water Pollution in Transitional China. Sustainability 2015, 7, 9067–9087. [Google Scholar] [CrossRef]
- Jang, D.; Lim, D.; Chae, G.; Yoo, J. A novel algorithm based on the coefficient of determination of linear regression fitting to automatically find the optimum angle for miniaturized surface plasmon resonance measurement. Sens. Actuators B Chem. 2014, 199, 488–492. [Google Scholar] [CrossRef]
- Usevich, K.; Markovsky, I. Adjusted least squares fitting of algebraic hypersurfaces. Linear Algebra Appl. 2016, 502, 243–274. [Google Scholar] [CrossRef]
- Chatterjee, S.; Hadi, A.S. Regression Analysis by Example; John Wiley & Sons: New York, NY, USA, 2013. [Google Scholar]
- Curt, H.S. The influence of secondary production on industry definition in the extended vertical market model. Strateg. Manag. J. 1992, 13, 171–187. Available online: https://www.jstor.org/stable/2486383 (accessed on 12 October 2019).
- Zhu, G.; Xiao, Y.; Wan, C. The study of indicator framework of Cleaner Production in the tertiary industry. Appl. Mech. Mater. 2013, 295–298, 759–762. [Google Scholar] [CrossRef]
- Xie, W.J.; Gu, G.F.; Zhou, W.X. On the growth of primary industry and population of China’s counties. Phys. A Stat. Mech. Appl. 2010, 389, 3876–3882. [Google Scholar] [CrossRef]
- Mancini, L.; Marcheggiani, S.; Puccinelli, C.; Lacchetti, I.; Carere, M. Global environmental changes and the impact on ecosystems and human health. Energy Environ. Innov. 2017, 3, 98–104. [Google Scholar] [CrossRef]
- Anderson, D.M.; Glibert, P.M.; Burkholder, J.M. Harmful algal blooms and eutrophication: Nutrient sources, composition, and consequences. Estuaries 2002, 25, 704–726. [Google Scholar] [CrossRef]
- Davraza, A.; Senerb, E.; Sener, S. Evaluation of climate and human effects on the hydrology and water quality of Burdur Lake, Turkey. J. Afr. Earth Sci. 2019, 158, 103569. [Google Scholar] [CrossRef]
- Tian, Y.; Jiang, Y.; Liu, Q.; Dong, M.; Xu, D.; Liu, Y.; Xu, X. Using a water quality index to assess the water quality of the upper and middle streams of the Luanhe River, northern China. Sci. Total Environ. 2019, 667, 142–151. [Google Scholar] [CrossRef]
- Du, Y.; Tang, R.; Dang, X.; Hu, Y.; Zhu, S.; Meng, M. Evaluation for the water quality of drinking water source of Shiyan urban area in Hubei province. Environ. Prot. 2016, 22, 34–37. [Google Scholar]
- Li, S.; Zhang, Q. Assessing the Water Quality in the Water Source Area of the Middle Route of the South to North Water Transfer Project (Danjiangkou Reservoir) Using A Water Quality Index Method. Res. Environ. Sci. 2008, 22, 61–68. [Google Scholar] [CrossRef]
- Shi, J.; Yin, Y.; Wang, M.; Deng, L.; Huang, J.; Chen, H.; Du, Z.; Zhang, Y.; Li, Y. Water Quality Analysis of Danjiang Reservoir before and after Running of the Mid-line Project of South to North Water Diversion. J. Hunan Univ. Sci. Technol. 2018, 33, 103–109. [Google Scholar] [CrossRef]
- Gao, W.; Zeng, Y.; Zhao, D.; Wu, B.; Ren, Z. Land cover changes and drivers in the water source area of the Middle Route of the South-to-North Water Diversion Project in China from 2000 to 2015. Chin. Geogr. Sci. in press.
- Salvettia, R.; Acutisb, M.; Azzellinoa, A.; Carpani, M.; Giupponi, C.; Parati, P.; Vale, M.; Vismara, R. Modelling the point and non-point nitrogen loads to the Venice Lagoon (Italy): The application of water quality models to the Dese-Zero basin. Desalination 2008, 226, 81–88. [Google Scholar] [CrossRef]
- Chi, W.F.; Zhao, Y.Y.; Kuang, W.H.; He, H.L. Impacts of anthropogenic land use/cover changes on soil wind erosion in China. Sci. Total Environ. 2019, 668, 204–215. [Google Scholar] [CrossRef] [PubMed]
- Zhang, Q.; Xu, Z.; Shen, Z.; Li, S.; Wang, S. The Han River watershed management initiative for the South-to-North Water Transfer Project (Middle Route) of China. Environ. Monit. Assess. 2009, 148, 369–377. [Google Scholar] [CrossRef] [PubMed]
- Johnson, D.G. Provincial migration in China in the 1990s. China Econ. Rev. 2003, 14, 22–31. [Google Scholar] [CrossRef]
- Wang, Y.; Guo, S.; Yang, G.; Hong, X.; Hu, T. Optimal early refill rules for Danjiangkou Reservoir. Water Sci. Eng. 2014, 7, 403–419. [Google Scholar] [CrossRef]
- Feng, Q.; Chen, J. Sustainable Development of Natural Forest Protection Project Area. J. Beijing For. Univ. 2009, 8, 28–31. [Google Scholar] [CrossRef]
- Lü, Y.; Zhang, L.; Feng, X.; Zeng, Y.; Fu, B.; Yao, X.; Li, J.; Wu, B. Recent ecological transitions in China: Greening, browning, and influential factors. Sci. Rep. 2015, 5, 8732. [Google Scholar] [CrossRef]
- Zhang, Y. Distribution and evaluation of ecoloogical tourism resources in Shangluo City. Acta Agric. Jiangxi 2011, 23, 165–166. [Google Scholar]


| Level I Class | Criteria | CI |
|---|---|---|
| Forest | natural/semi natural vegetation and artificial vegetation, H1 = 3–30 m, C1 > 20% | 0 |
| Shrub | natural/semi natural vegetation and artificial vegetation, H = 0.3–5 m, C > 20% | 0 |
| Grassland | natural/semi natural vegetation and artificial vegetation, H = 0.03–3 m, C > 4%, water saturation in soil, K1 > 0.9 | 0.067 |
| Wetland | natural/artificial water, stationary/flowing | 0.6 |
| Cropland | artificial vegetation, soil disturbance, crop, harvested | 0.2 |
| Settlement | artificial bare surface, settlement, production and services, linear feature, Mining field | 1 |
| Other land | Non vegetation, bare rock and soil, C <4% | 0 |
| Types | 2000 | 2010 | 2015 | ||||||
|---|---|---|---|---|---|---|---|---|---|
| Samples | UA (%) | PA (%) | Samples | UA (%) | PA (%) | Samples | UA (%) | PA (%) | |
| Forest | 367 | 94.6 | 92.0 | 168 | 90.5 | 91.0 | 36 | 88.9 | 88.9 |
| Shrub | 211 | 83.4 | 85.4 | 94 | 83.0 | 83.0 | 15 | 73.3 | 73.3 |
| Grassland | 169 | 87.6 | 85.5 | 53 | 81.1 | 78.2 | 14 | 71.4 | 76.9 |
| Wetlands | 244 | 94.3 | 89.8 | 113 | 90.3 | 93.6 | 9 | 88.9 | 88.9 |
| Cropland | 277 | 89.9 | 92.6 | 27 | 88.9 | 80.0 | 11 | 81.8 | 81.8 |
| Settlements | 588 | 90.1 | 93.3 | 41 | 85.4 | 87.5 | 30 | 93.3 | 90.3 |
| Other land | 254 | 82.7 | 80.5 | 12 | 75.0 | 69.2 | 7 | 71.4 | 71.4 |
| K | 87.5 | 83.8 | 80.7 | ||||||
| Overall accuracy (%) | 89.6 | 87.2 | 84.4 | ||||||
| HAILS | <2% | 2%–10% | 10%–20% | >20% | ||||
|---|---|---|---|---|---|---|---|---|
| Mean (%) | Area (km2) | Mean (%) | Area (km2) | Mean (%) | Area (km2) | Mean (%) | Area (km2) | |
| 2000 | 0.6 | 45,291.6 | 4.9 | 34,000.0 | 14.4 | 10,875.6 | 29.1 | 4353.5 |
| 2010 | 0.5 | 50,362.6 | 4.7 | 32,233.3 | 13.9 | 6988.9 | 34.4 | 4928.8 |
| 2015 | 0.5 | 50,599.0 | 4.7 | 31,071.9 | 13.9 | 7110.5 | 36.1 | 5696.3 |
| HAILS | Population Density | Agricultural Population | Urban Population | GDP | Primary Industry | Secondary Industry | Tertiary Industry |
|---|---|---|---|---|---|---|---|
| Pearson correlation coefficients | 0.937 *** | 0.850 *** | 0.584 *** | 0.765 *** | 0.820 *** | 0.761 *** | 0.619 *** |
| Multiple regression model coefficients | 0.673 *** | 0.061 ** | 0.024 * | −0.348 * | 0.188 * | 0.363 *** | 0.126 |
| VIF | 4.801 | 7.436 | 4.671 | 18.411 | 8.023 | 6.078 | 3.130 |
| Mean HAILS (%) | <2% | 2%–10% | 10%–20% | >20% |
|---|---|---|---|---|
| 2000 | 0.8 | 5.1 | 14.4 | 29.1 |
| 2010 | 0.5 | 4.9 | 13.8 | 36.5 |
© 2019 by the authors. Licensee MDPI, Basel, Switzerland. This article is an open access article distributed under the terms and conditions of the Creative Commons Attribution (CC BY) license (http://creativecommons.org/licenses/by/4.0/).
Share and Cite
Gao, W.; Zeng, Y.; Liu, Y.; Wu, B. Human Activity Intensity Assessment by Remote Sensing in the Water Source Area of the Middle Route of the South-to-North Water Diversion Project in China. Sustainability 2019, 11, 5670. https://doi.org/10.3390/su11205670
Gao W, Zeng Y, Liu Y, Wu B. Human Activity Intensity Assessment by Remote Sensing in the Water Source Area of the Middle Route of the South-to-North Water Diversion Project in China. Sustainability. 2019; 11(20):5670. https://doi.org/10.3390/su11205670
Chicago/Turabian StyleGao, Wenwen, Yuan Zeng, Yu Liu, and Bingfang Wu. 2019. "Human Activity Intensity Assessment by Remote Sensing in the Water Source Area of the Middle Route of the South-to-North Water Diversion Project in China" Sustainability 11, no. 20: 5670. https://doi.org/10.3390/su11205670
APA StyleGao, W., Zeng, Y., Liu, Y., & Wu, B. (2019). Human Activity Intensity Assessment by Remote Sensing in the Water Source Area of the Middle Route of the South-to-North Water Diversion Project in China. Sustainability, 11(20), 5670. https://doi.org/10.3390/su11205670