Abstract
Primary care centers are establishments with elevated social relevance and high operational energy consumption. In Chile, there more than 628 family healthcare centers (CESFAM) have been built in the last two decades and with plans for hundreds more in the next few years. We revised the architecture, construction management and energy performance of five CESFAM centers to determine possible instances of overall improvement. Staff was interviewed, and state documents reviewed, which allowed the conceptualization of the architectonic and energy structure of the centers, as well as the process of implementation. At the same time, energy simulations were done for each one of the centers, controlling for different climates, construction solutions and orientations. Our study revealed that strategies employed by the primary healthcare centers in Chile have aided a progressive implementation of establishments with elevated costs and materialization times, as well as neglect for climatic conditions. These energy evaluations show relevant and consistent impacts of the architectural form and material conditions, especially in southern zones, demonstrating the need to work with shared knowledge resources such as BIM. There is a clear necessity to define technological, morphological and construction strategies specific to each climate zone in order to achieve energetically efficient and intelligent healthcare establishments.
1. Introduction
Since the Ata Alma Declaration [1], it is internationally recognized that primary care is an integral part of the healthcare system, recognizing its effectiveness and possible adaptation in a wide variety of political, social, cultural and economic contexts. In countries such as Spain, primary healthcare teams are in charge of the comprehensive care from each basic health zone, providing care for matters such as prevention, assistance or rehabilitation [2]. In the United Kingdom, Primary Care Trusts have assumed the responsibility of planning and developing primary care and community services by geographic area [3]. In countries such as the United States, Canada, Norway and Belgium, primary care centers have a population base, but, contrarily to Spain or the United Kingdom, primary care is divided among groups of individuals instead of geographic areas [4]. In Mexico, Costa Rica, Colombia, Venezuela, Ecuador, Argentina, Australia and Israel, this model is also used, given its effectiveness, sustainability and higher levels of satisfaction by the population [5,6].
According to Montero et al. [7], since 1993, Chile has transformed its healthcare centers into Family Healthcare Centers with different local populations in charge, implementing innovative administrative, financial and infrastructural techniques. As a consequence, more than 628 primary healthcare centers have been constructed in the last decades, of which 170 are emergency healthcare centers (SAPU in Spanish), 142 rural medical stations, 44 Mental Health Clinics (COSAM in Spanish), 20 high-resolution services (SAR) and 252 Family Healthcare Centers (CESFAMs) [8]. These CESFAM centers are the central element of Chilean healthcare services, resolving 80% of the population’s healthcare needs [9].
The Pan American Health Organization [1] recognizes healthcare infrastructure as an instrument to access healthcare, conditioned by social and physical environments, and stemming from the interaction between human, financial and legal resources. However, the healthcare sector does not always have sufficient resources, and decision makers must not only consider the health and wellbeing of those who occupy the buildings but also the economic impact of different interventions, thus obligating them to efficiently use resources [10].
In the case of primary healthcare centers, and particularly CESFAMs in Chile, a large part of their resources go towards design and construction of the buildings [11]. Their design is based on a compact configuration emulating the “container” hospital type [12], considering variables such as population size, socioeconomic conditions, accessibility, natural geographic limits, policy and administration, municipal ordinance, traffic, terrain geometry and medical architectural program (MAP) [13]. The combination of these variables results in a characteristic type of architecture, with very narrow limits and where the notorious functional performance of the building prevails. Thus, the architectural typologies do not differentiate much throughout the territory, varying with the natural, social and cultural environments in which they are inserted. In consequence, a health care center is understood as a programmed object and/or a machine with high operative consumption that looks to satisfy its own functional, spatial and technological needs.
Primary healthcare centers generally have elevated energy consumption in order to satisfy heating, cooling, lighting and electrical demands necessary to maintain an accepted comfort level [14,15]. It is important to notice that the five primary healthcare centers considered as case studies in this research were not monitored because at the moment of conducting the research they were either in the middle of a bidding process or were recently built. However, other public buildings located close to the case studies have been monitored, showing behaviors similar to those presented in international studies. For example, in Scotland, energy consumption in medium-scale health care centers is around 56 kWh/m2/yr [16]. In Barcelona, a study on the municipal health service comprising of 972 installations, found that energy consumption in small heath care centers varied between 36.8 kWh/m2/yr and 265.5 kWh/m2/yr, with an average of 95 kWh/m2/yr [17]. In Australia, simulated and actual energy behavior studied for three medium-sized “Community Healthcare” centers with areas between 1.000 and 4.000 m2, varied from 167 to 306 kWh/m2/yr, due to the intensity of use and thermal comfort of some of the locations [18].
Similarly, the Advanced Energy Design Guide for Small Hospitals and Healthcare Facilities [19] gives recommendations for efficient design and operation, with the objective of reducing up to 30% energy consumption over the standard established by the ANSI/ASHRAE/IESNA 90.1-2013 code [13]. This is the Smart Building concept, which is characterized by monitoring of the general performance of the building throughout its lifecycle. The Smart Building centralizes data for energy performance supervision and control, and is integrated in some cases in shared knowledge methodologies such as Building Information Modeling (BIM) [20].
Certainly, the energy behavior of these buildings is strongly influenced by the following design variables: architectural envelope (thermal insulation, air tightness, solar protection, among others), architecture (orientation, location, metric, shape, enclosure surface/volume ratio, form factor) or a lower percentage of glazed area in the facades can be considered in the architectural designs to reduce thermal losses and improve internal performance, as shown by several international studies [21,22,23] Also, increasing the area of windows facing the side of the solar path can be an efficient measure to increase the passive uptake of energy and guide the volumes towards a greater solar radiation. This would reduce the differences with the environment and the internal energy demands [24,25] as well as human factors influencing performance [26,27], which are adjusted to the climatic demands of each place. From this point of view, energy performance aimed at reducing energy demand requires custom designs that do not necessarily match with functionality. In the case of the CESFAMs, it is important to analyze their energy performance, given that today’s standards require buildings that are not only functional, but that have an energy performance that is socially acceptable. This means that health care centers in Chile must have optimal minimum energy demands and be able to generate and administer their own energy [28].
Therefore, the objective of our research is to characterize the architecture, investment process and energy performance of CESFAM buildings in different climate zones of Chile, in order to identify design criteria and comprehensive measures that allow the compatibility of functional and energetic demands.
2. Materials and Methods
A review was carried out of the Chilean Ministry of Health’s national list containing 252 recognized primary care centers, and a sample was selected consisting of five projects currently in the public bidding process for construction. Architectural plans, energy efficiency reports and technical specifications were revised, and interviews were carried out with staff. The following information for each facility was obtained: annual population attended, geographic location, medical architecture program (MAP), architectural functionality, facility dimensions, built surface area, materials and passive and active strategies. The shape conditions were based on literature such as Olgyay [21]. Conceptualization about the project cycle and investment process was carried out through interviews with employees and revisions of the methodologies of preparation, evaluation and prioritization of primary care projects in the health care sector [29].
A Posteriori, limit values were defined for energy efficiency and environmental comfort based on policies and standards such as the “Standardized Terms of Reference” [30], called TDRe and corresponding to three levels of construction (base, improved and optimized). In addition, shape factor was regarded based on general recommendations of energy efficiency [31] and alternatives of PV feed based on suggestions for renewable sources in order to utilize the Net Zero Energy Building (NZEB) method for producing buildings, which can meet energy demands through green energy [23,25]. The Chilean standard NCh1079-2008 [32] is titled: “Architecture and Construction—Climatic Housing Zoning for Chile.” This standard defines nine climate zones, and for this study, the following six were chosen: 2ND; Desert North—corresponding to the cities of Calama, Baquedano and Catalina, desert climate with no rain, heat, clear atmosphere with strong solar radiation, cold nights, strong daily temperature fluctuations, dry environment, almost null vegetation and strong winds. 4CL; Central Costal—Viña del Mar, Valparaíso, San Antonio and Constitución cities: marine climate zone, short winters of four to six months, temperate climate, mainly southwest winds, saline soils and environment. 5CI; Central Interior—Santiago, Rancagua and Chillán cities: Mediterranean climate, temperate temperatures, winters from four to six months, rains and freezing increasing towards the south, intense insolation in summer, especially towards the north; winds from the southeast. 6SL; Costal South—Concepción, Arauco, Valdivia and Puerto Montt cities: rainy marine climate, long winters, strong easterly winds, robust vegetation. 7SI: Southern Interior—Los Angeles, Temuco and Osorno cities: rainy, cold climate with frequent precipitation, short summers from four to six months with moderate insolation, wet soil and environment, southern and southeasterly winds. 8SE; Extreme South—Castro, Aysen and Punta Arenas cities: Cold very rainy region, strong marine climate, strong winds, almost permanently cloudy, very short summers, very wet soil and environment, freezing and snow in high areas as well as solar radiation in summer.
Taking into account the aforementioned information, simulations were carried out in EnergyPlus, linking variables such as volumetry, orientation, geographical location, solar control, hours of operation, sensible and latent loads, temperature ranges, air tightness and construction quality with improved and optimized variations for each scenario (insulation and airtightness increase of 30% and 60%, compared to the base scenario).
3. Architectural Characterization
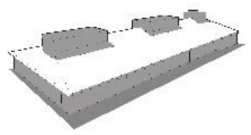
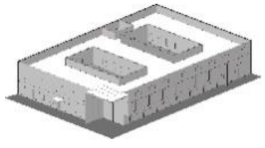
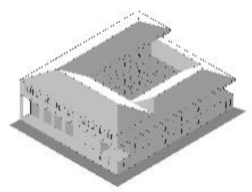
According to the literature, primary care centers can be structured by differentiating the areas, subareas and dependencies which are specified in the functional program, giving a response in terms of square meters for a certain number of users [33,34]. In the CESFAMs, the medical architecture program (MAP) services from 5000 to 30,000 users and involves areas of clinical care, technical support, administration and general services, among others (Figure 1). These facilities are public and private spaces that must comply with normative requirements regarding usable floor area, finishing, installations and equipment. Table 1 describes the principal architectural and construction characteristics of each case evaluated.
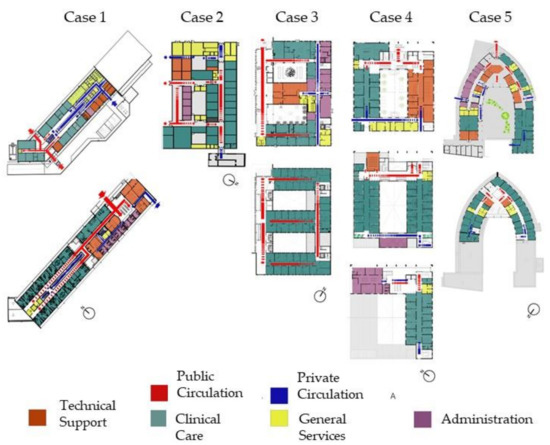
Figure 1.
Spatial zoning for the case studies from the medical architecture program (MAP).

Table 1.
Architectural and construction characterization of the case studies.
3.1. Clinical Care
Spaces for patient care are comprised of cubicles for specialized medical assistance and open care spaces for general assistance, constituted by the following facilities: multipurpose clinic, gynecological clinic, dental clinic, medical statistics orientation service (SOME in Spanish), waiting room, clinical group work room, psychological clinic, acute respiratory infections clinic (IRA), acute respiratory illness clinic (ERA), sampling room, podiatry clinic, vaccination clinic, healing and treatment clinic, ultrasound clinic, reception area, digital dental x-ray room, control rooms, minor surgery and operating rooms.
3.2. Technical Support
Technical support corresponds to units that provide healthcare support services to the CESFAM, such as the pharmacy, sterilization and the National Complementary Feeding Program (PNAC). The facilities that they include are: pharmacy offices, pharmacist clinic, pharmacy storage, PNAC office and storage, waiting rooms, clean areas and dirty areas.
3.3. Administration
Spaces designated as “Administration” include management and administrative units within the CESFAM facility; personnel units and SOME. The pertaining facilities are: management office, management secretariat, administrative sub-manager’s office, administrative storage, cafeteria, dressing rooms, SOME management office, scheduling office, technical office, Information, Complaints and Suggestions Office (OIRS), equipment room, IT rooms and meeting rooms for professionals.
3.4. General Services
General services correspond to all interior and exterior facilities and areas that provide services for the establishment. These areas include: maintenance facilities, general storage, solid waste disposal facilities, electrical control room, facilities for security, transportation and maintenance workers, boiler and heating rooms, space for clinical gases and ambulance parking.
3.5. Public and Private Circulation
Public and private circulation areas correspond to 50% of the total area occupied by enclosures and walls. Their objective is to vertically and horizontally communicate the different facilities through the use of corridors, ramps and elevators.
4. Project Cycle and Investment Process
Every investment initiative follows a trajectory that materializes in a physical structure or implementation of a determined action. This trajectory, called a project cycle or investment process (Figure 2), involves time and costs that allow the execution of each one of the development stages (Table 2). In the case of primary health care, and especially for the CESFAMs, when the objective is centered on the production of goods, infrastructure projects are generally associated to coverage of the system.
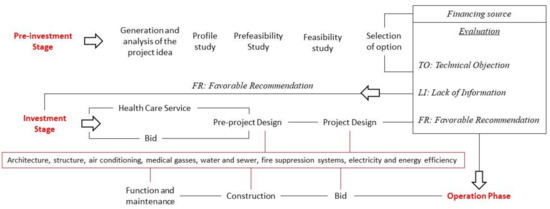
Figure 2.
Project cycle’s conceptualization and investment process for implementation of a CESFAM.
Table 2.
Costs and times associated with project stage and investment process of a CESFAM.
4.1. Pre-Investment Stage
Selection of an alternative that will transform into a project and the decision about the suitability of implementation require certain steps. The level of complexity reached by studies within pre-investment is associated to the level of advance in which it is found.
4.1.1. Generation and Analysis of the Project Idea
In this phase, which results from a preliminary diagnostic, or in some cases, a community petition, an unsolved need or problem is detected, along with possible beneficiaries-users, geographic location and the objectives that the project aims to reach. Afterwards, possible solutions are generated.
4.1.2. Profile Study
In this phase, additional information is incorporated and improved from the previous phase. Elaboration of the profile includes a preliminary analysis on technical aspects, the market, costs and benefits as well as evaluation on the same level. It is important to note that in this profile stage, a large decrease in uncertainty is achieved at a low price. Therefore, the preparation of good project profiles is of utmost importance given that expensive studies can be avoided for nonviable projects.
4.1.3. Prefeasibility and Feasibility Study
This study details information from the profile and additional data are incorporated that permits discarding of some alternatives, and the perfection of others. With the mix of the preselected alternatives, technical and economic evaluations are carried out, arriving at one selection and later doing prefeasibility and feasibility studies.
4.1.4. Financing Source
This type of project is financed by the GORE (Regional Government) or the Ministry of Health (MINSAL) with regional funds in order to contract technical assistance, administrative costs and/or land purchase.
4.1.5. Pre-Investment Evaluation
Once the pre-investment phase is concluded, the Ministry of Social Development (MIDESO) does an evaluation to determine what state the proposal is in, where TO: Technical Objection, LI: Lack of information, FR: Favorable recommendation.
If the proposal complies with the favorable recommendation, it will continue to the investment phase, development of the pre-project and the architectural project.
4.2. Investment Stage
This phase is the starting point for the physical implementation of the project, according to estimations carried out in the pre-investment stage. Implementation of the pre-project or project can be sent to public tender or directly implemented by the healthcare service.
4.2.1. Design Elaboration (Pre-Project and Project)
The final proposal must be incorporated into the Medical Architecture Program, elaborated according to the results obtained, projected demand of variables and facilities required for the project. Then, the design is transformed into a pre-project and later, a detailed architecture project which should clearly include information about the new surfaces to be constructed, whether referring to new or existing facilities. In this stage, the pre-project and project are developed on a level of architecture plans, engineering studies and specialties such as: architecture, structure, air conditioning, medical gasses, water and sewer, fire suppression systems, electricity and energy efficiency.
4.2.2. Investment Evaluation
Once the investment stage is concluded, the Ministry of Social Development (MIDESO) carries out an evaluation similar to the pre-investment. Upon compliance with a favorable recommendation, the project will move to the operation phase. Project execution must be carried out by a third party through public tender and supervised by the municipality or public healthcare service. Finally, the comptroller approves the project and the funds for construction of the establishment.
4.3. Operation Phase
In this phase the benefits estimated in the pre-investment start to materialize. In some cases, the operation phase initiates with a start-up stage before reaching a steady state.
4.3.1. Public Tender Process for Construction—Tender Terms of Reference
With the documents approved by a competent authority and including the administrative and technical terms of reference, a public tender is published, calling all interested parties of submit their bids according to the terms of reference. From these bidders, the most convenient will be selected [26].
4.3.2. Tender Adjudication (Bid)
Through an administrative act, the competent authority will select one or more bidders and contract their services in compliance with the Law Number 19.866, “Acquisition Law.”
4.3.3. Construction
In this stage, construction is started on the establishment, based on the technical specifications outlined in the pre-project and project stages.
4.3.4. Operation: Function and Maintenance
Provision of services stage, managed by the public healthcare service or municipality, where Time: 30 years—useful life; Annual cost of operation: $3,000,000–4,000,000 USD, Annual maintenance cost: $40,000–60,000 USD.
5. Energy Characterization
The evaluated cases have limits on environmental comfort and energy efficiency, which are indicated in Table 3 and Table 4. On a general level, the passive strategies applied to these establishments are limited and repetitive throughout the climatic zones. Some of the principal strategies used are: cross-ventilation, unidirectional ventilation, lateral and overhead natural lighting, thermal resistivity and enclosure air tightness, solar control by means of slats, lattices, cantilevers and/or glazing filters. The percentage of façade openings is in most cases an architectural result more than it is a criterion of energy efficiency and environmental comfort.
Table 3.
Values of Environmental comfort, occupation and energy efficiency for representative CESFAM facilities.
Table 4.
Limit values of thermal transmittance and air tightness for the base, improved and optimized scenarios.
On an active system level, the acclimatization strategies such as Sanitary Hot Water (ACS), ventilation and illumination respond to such variables as: geographic location, demand necessities, technological efficiency, commercial availability, acquisition cost and available energy resources. Strategies range from heat pump chillers, thermal power plants, split units, cassette or presentation-type air-cooled heat pumps, factory-integrated condensate pumps, high-temperature heat pumps supported by solar thermal panels, to natural gas boilers that generate hot water and service fan coils of hot air. Understanding these establishments as airtight buildings, in the majority of the facilities, mechanical extractors and injectors are used by means of diffusers and grilles for ventilation. Interior and exterior lighting strategies are based on the use of compact fluorescent lamps and/or LEDs.
6. Energy Evaluation
With the information obtained from the architectural and energetic characterization, dynamic simulations were made of energy performance in EnergyPlus for different cases, orientations, constructions and geographic locations, as described in Table 5, Table 6, Table 7, Table 8, Table 9 and Table 10 and Figure 3, Figure 4, Figure 5, Figure 6 and Figure 7.
6.1. Case 1
Location: Algarrobo, Región de Valparaíso, Chile (Latitude: −33.36; Longitude: −71.67)
Climate zone: 4CI—Centro Interior.
Compact form: Form factor of 0.47.
Percentage of openings: 30%.
Table 5.
Energy demand for Case 1 according to geographic location, orientation and construction quality.
Table 5.
Energy demand for Case 1 according to geographic location, orientation and construction quality.
| Case Studies and City | Orientation | Without TDRe kWh/m2/yr | TDRe IMPROVED kWh/m2/yr | TDRe OPTIMIZED kWh/m2/yr |
|---|---|---|---|---|
| Case 1 CALAMA | North | 57.08 | 34.16 | 26.76 |
| East | 56.50 | 34.60 | 34.80 | |
| South | 57.17 | 36.90 | 34.24 | |
| West | 56.09 | 34.56 | 34.84 | |
| Case 1 SANTIAGO | North | 118.52 | 40.47 | 22.20 |
| East | 111.80 | 36.79 | 31.37 | |
| South | 118.56 | 40.72 | 30.27 | |
| West | 112.13 | 37.09 | 31.37 | |
| Case 1 VALPARAISO | North | 108.47 | 46.50 | 33.90 |
| East | 102.91 | 43.02 | 33.49 | |
| South | 108.52 | 46.58 | 33.90 | |
| West | 103.16 | 42.67 | 33.51 | |
| Case 1 CONCEPCIÓN | North | 110.35 | 37.17 | 26.92 |
| East | 100.87 | 31.45 | 25.39 | |
| South | 110.58 | 37.58 | 26.96 | |
| West | 101.39 | 31.70 | 25.39 | |
| Case 1 TEMUCO | North | 139.96 | 41.03 | 23.41 |
| East | 125.97 | 36.92 | 23.81 | |
| South | 140.43 | 41.54 | 23.59 | |
| West | 128.59 | 36.46 | 23.81 | |
| Case 1 PUNTA ARENAS | North | 201.40 | 51.35 | 30.06 |
| East | 178.54 | 40.98 | 25.59 | |
| South | 201.10 | 52.33 | 30.27 | |
| West | 174.42 | 41.13 | 25.30 |
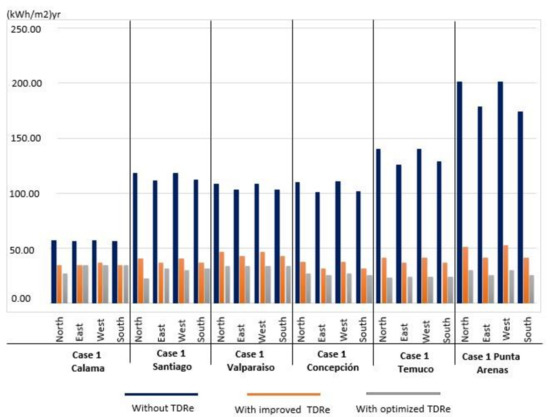
Figure 3.
Energy demand for Case 1.
6.2. Case 2
Location: Curepto, Región del Maule, Chile (Latitude: −35.09; Longitude: −72.02).
Climate zone: 4CL—Central Coast.
Compact form: Form factor of 0.51.
Percentage of openings: 13%.
Table 6.
Energy demand for Case 2 according to geographic location, orientation and construction quality.
Table 6.
Energy demand for Case 2 according to geographic location, orientation and construction quality.
| Case Study and City | Orientation | Without TDRe kWh/m2/yr | TDRe IMPROVED kWh/m2/yr | TDRe OPTIMIZED kWh/m2/yr |
|---|---|---|---|---|
| Case 2 CALAMA | North | 83.22 | 64.24 | 41.91 |
| East | 81.10 | 58.28 | 37.98 | |
| South | 81.49 | 61.20 | 39.74 | |
| West | 80.00 | 58.44 | 38.99 | |
| Case 2 SANTIAGO | North | 187.13 | 67.92 | 37.66 |
| East | 193.55 | 59.86 | 34.03 | |
| South | 196.40 | 65.09 | 35.87 | |
| West | 192.01 | 60.05 | 34.10 | |
| Case 2 VALPARAISO | North | 167.62 | 74.75 | 43.79 |
| East | 173.24 | 67.84 | 38.42 | |
| South | 174.39 | 72.74 | 42.32 | |
| West | 171.60 | 68.37 | 39.75 | |
| Case 2 CONCEPCIÓN | North | 201.51 | 71.31 | 39.84 |
| East | 208.54 | 63.04 | 36.06 | |
| South | 208.98 | 68.26 | 37.74 | |
| West | 206.63 | 63.30 | 36.09 | |
| Case 2 TEMUCO | North | 260.24 | 71.00 | 34.20 |
| East | 270.41 | 63.99 | 35.11 | |
| South | 275.99 | 73.23 | 36.20 | |
| West | 268.34 | 64.89 | 35.06 | |
| Case 2 PUNTA ARENAS | North | 451.52 | 105.79 | 63.75 |
| East | 430.23 | 90.37 | 52.09 | |
| South | 445.59 | 97.24 | 57.30 | |
| West | 428.66 | 93.76 | 54.51 |
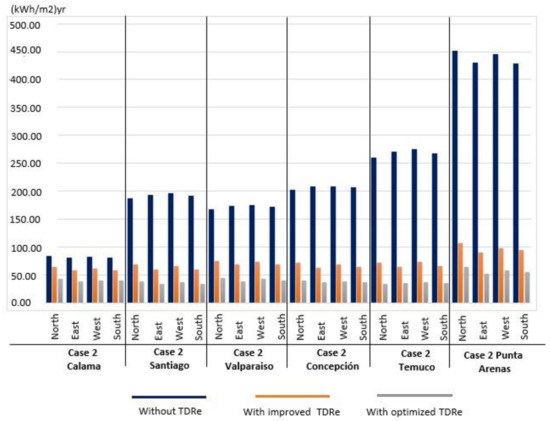
Figure 4.
Energy demand for Case 2.
6.3. Case 3
Location: Santiago, Región Metropolitana, Chile (Latitude: −33.46; Longitude: −70.64).
Climate zone: 5CI—Central Interior.
Compact form: Form factor of 0.39.
Percentage of openings: 35%.
Table 7.
Energy demand for Case 3 according to geographic location, orientation and construction quality.
Table 7.
Energy demand for Case 3 according to geographic location, orientation and construction quality.
| Case Study and City | Orientation | Without TDRe kWh/m2/yr | TDRe IMPROVED kWh/m2/yr | TDRe OPTIMIZED kWh/m2/yr |
|---|---|---|---|---|
| Case 3 CALAMA | North | 104.14 | 80.85 | 67.10 |
| East | 101.81 | 78.81 | 66.18 | |
| South | 104.15 | 81.22 | 67.68 | |
| West | 104.20 | 80.77 | 67.26 | |
| Case 3 SANTIAGO | North | 212.27 | 94.58 | 67.82 |
| East | 209.44 | 92.36 | 66.19 | |
| South | 210.07 | 93.18 | 65.73 | |
| West | 211.01 | 93.68 | 66.08 | |
| Case 3 VALPARAISO | North | 192.84 | 100.23 | 73.01 |
| East | 190.16 | 97.70 | 71.12 | |
| South | 190.32 | 98.36 | 71.40 | |
| West | 190.79 | 98.53 | 71.23 | |
| Case 3 CONCEPCIÓN | North | 223.57 | 94.60 | 60.22 |
| East | 221.90 | 93.35 | 59.96 | |
| South | 222.78 | 94.09 | 60.18 | |
| West | 224.75 | 95.25 | 60.65 | |
| Case 3 TEMUCO | North | 291.10 | 102.87 | 61.90 |
| East | 288.93 | 101.57 | 60.85 | |
| South | 289.71 | 103.20 | 61.21 | |
| West | 291.86 | 104.09 | 61.65 | |
| Case 3 PUNTA ARENAS | North | 494.04 | 170.60 | 92.20 |
| East | 494.75 | 171.98 | 95.12 | |
| South | 492.58 | 170.57 | 93.91 | |
| West | 497.61 | 173.66 | 96.66 |
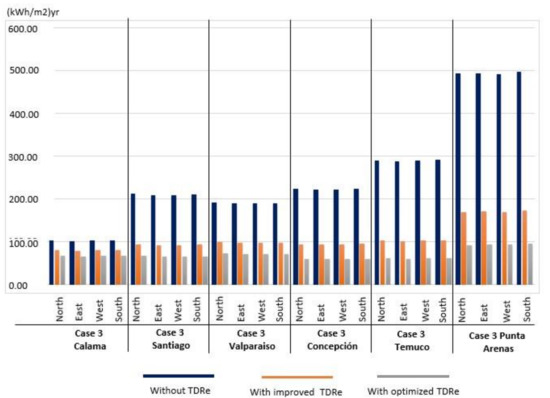
Figure 5.
Energy demand for Case 3.
6.4. Case 4
Location: Concepción, Región del Bío Bío, Chile (Latitude: −36.82; Longitude: −73.04).
Climate zone: 6SL—Coastal South
Compact form: Form factor of 0.36.
Percentage of openings: 12%.
Table 8.
Energy demand for Case 4 according to geographic location, orientation and construction quality.
Table 8.
Energy demand for Case 4 according to geographic location, orientation and construction quality.
| Case Study and City | Orientation | Without TDRe kWh/m2/yr | TDRe IMPROVED kWh/m2/yr | TDRe OPTIMIZED kWh/m2/yr |
|---|---|---|---|---|
| Case 4 CALAMA | North | 41.08 | 32.88 | 26.72 |
| East | 42.16 | 33.21 | 26.79 | |
| South | 40.78 | 32.65 | 26.72 | |
| West | 41.94 | 33.03 | 26.82 | |
| Case 4 SANTIAGO | North | 78.68 | 32.00 | 27.81 |
| East | 78.70 | 33.53 | 28.28 | |
| South | 78.57 | 33.91 | 27.81 | |
| West | 79.87 | 33.66 | 28.29 | |
| Case 4 VALPARAISO | North | 71.55 | 36.30 | 29.84 |
| East | 71.38 | 36.48 | 30.47 | |
| South | 71.56 | 36.39 | 29.84 | |
| West | 72.58 | 36.73 | 30.38 | |
| Case 4 CONCEPCIÓN | North | 82.64 | 32.81 | 23.74 |
| East | 83.12 | 32.57 | 24.16 | |
| South | 82.25 | 32.62 | 23.74 | |
| West | 84.27 | 32.15 | 24.11 | |
| Case 4 TEMUCO | North | 103.22 | 34.26 | 23.96 |
| East | 104.12 | 33.53 | 23.98 | |
| South | 102.48 | 34.34 | 23.96 | |
| West | 105.01 | 34.58 | 23.89 | |
| Case 4 PUNTA ARENAS | North | 153.17 | 45.26 | 29.31 |
| East | 154.34 | 45.06 | 29.95 | |
| South | 150.40 | 44.99 | 29.31 | |
| West | 153.60 | 44.93 | 29.47 |
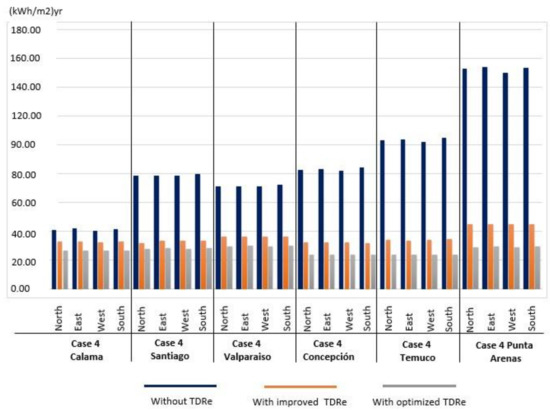
Figure 6.
Energy demand for Case 4.
6.5. Case 5
Location: Dalcahue, Región de los lagos, Chile (Latitude: −42.37; Longitude: −73.65).
Climate zone: 8 SE—Extreme south.
Compact form: Form factor of 0.44.
Percentage of openings: 16%.
Table 9.
Energy demand for Case 5 according to geographic location, orientation and construction quality.
Table 9.
Energy demand for Case 5 according to geographic location, orientation and construction quality.
| Case Study and City | Orientation | Without TDRe kWh/m2/yr | TDRe IMPROVED kWh/m2/yr | TDRe OPTIMIZED kWh/m2/yr |
|---|---|---|---|---|
| Case 5 CALAMA | North | 52.42 | 33.57 | 30.35 |
| East | 52.00 | 32.61 | 30.43 | |
| South | 52.46 | 33.47 | 30.27 | |
| West | 51.86 | 32.25 | 30.40 | |
| Case 5 SANTIAGO | North | 105.15 | 33.62 | 26.12 |
| East | 103.63 | 33.15 | 25.61 | |
| South | 107.46 | 34.13 | 26.10 | |
| West | 103.91 | 32.95 | 25.69 | |
| Case 5 VALPARAISO | North | 97.07 | 39.70 | 29.56 |
| East | 95.75 | 38.56 | 28.96 | |
| South | 98.94 | 39.85 | 29.42 | |
| West | 95.97 | 38.44 | 28.88 | |
| Case 5 CONCEPCIÓN | North | 97.98 | 30.90 | 23.24 |
| East | 95.48 | 29.97 | 22.32 | |
| South | 100.52 | 31.59 | 23.05 | |
| West | 95.67 | 29.76 | 22.14 | |
| Case 5 TEMUCO | North | 125.85 | 34.53 | 20.31 |
| East | 118.23 | 32.60 | 19.93 | |
| South | 125.81 | 34.42 | 20.21 | |
| West | 118.66 | 32.38 | 19.94 | |
| Case 5 PUNTA ARENAS | North | 168.90 | 38.60 | 24.03 |
| East | 162.41 | 35.02 | 20.90 | |
| South | 178.69 | 38.34 | 24.10 | |
| West | 163.59 | 34.34 | 20.84 |
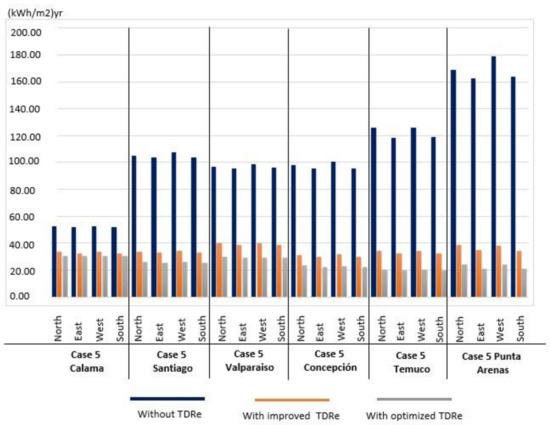
Figure 7.
Energy demand for Case 5.
Table 10.
Form coefficients, energy demand and reduction percentages according to geographic location and construction improvements.
Table 10.
Form coefficients, energy demand and reduction percentages according to geographic location and construction improvements.
| Case 1 | Case 2 | Case 3 | Case 4 | Case 5 | |
|---|---|---|---|---|---|
| Built Surface Area | 1.970 m2 | 1.146 m2 | 2.687 m2 | 3.789 m2 | 2.346 m2 |
| Form Factor– FF (enclosure surface area/volume) | 0.47 | 0.51 | 0.39 | 0.36 | 0.44 |
| Relative geometric efficiency (RGE) (Envelope surface area/built surface area) | 1.05 | 1.37 | 1.62 | 2.39 | 1.73 |
| Factor of Enclosure surface area per occupation surface area (Enclosure surface area/occupation surface area) | 1.28 | 1.47 | 1.05 | 1.47 | 1.04 |
| % Windows (Fenestration) | 30 | 13 | 35 | 12 | 16 |
| Demand without TDRe [kWh/m2]/Calama/North Orientation | 57.08 | 83.22 | 104.14 | 41.08 | 52.42 |
| % reduction TDRe IMPROVED | 40% | 24% | 23% | 23% | 36% |
| % reduction TDRe OPTIMIZED | 53% | 50% | 35% | 35% | 40% |
| Demand without TDRe [kWh/m2]/Santiago/North Orientation | 118.52 | 187.13 | 212.27 | 78.68 | 105.15 |
| % reduction TDRe IMPROVED | 64% | 65% | 55% | 57% | 68% |
| % reduction TDRe OPTIMIZED | 80% | 80% | 68% | 65% | 74% |
| Demand without TDRe [kWh/m2]/Concepción/North Orientation | 110.35 | 201.51 | 223.57 | 82.64 | 97.98 |
| % reduction TDRe IMPROVED | 63% | 65% | 57% | 61% | 68% |
| % reduction TDRe OPTIMIZED | 74% | 81% | 72% | 72% | 76% |
| Demand without TDRe [kWh/m2]/Punta Arenas/North Orientation | 201.4 | 451.52 | 494.04 | 153.17 | 168.9 |
| % reduction TDRe IMPROVED | 71% | 75% | 65% | 70% | 76% |
| % reduction TDRe OPTIMIZED | 83% | 85% | 82% | 81% | 85% |
| % reduction in different climates considering TDRe OPTIMIZED and Punta Arenas as a base location | |||||
| % reduction compared to Concepción | 8% | 9% | 15% | 0% | 0% |
| % reduction compared to Santiago | 15% | 5% | 15% | 0% | 0% |
| % reduction compared to Calama | 33% | 39% | 53% | 28% | 14% |
7. Results
For the analyzed establishments, energy performance was variable and close to international references [16,17,18]. When evaluating orientation, construction quality and location, a scarce incidence of solar layout, was a factor less than 5% of all cases, due to the homogeneous proportion of glazing in all of the facades. There was also a noticeable influence of material conditions in all of the climates and typologies studied, evidencing a progressive reduction of the demand from 60% to 40%. This reduction is dependent on the increase of the thermal resistivity of the envelope and a substantial decrease of up to 85% in the energy requirements according to locations of higher latitude for all establishments and construction quality.
The results show that the energy demand for an acceptable comfort of the different cases analyzed varies in the northern zone (from low latitude with warmer climate) from 40 to 100 kWh/m2, up to the austral zone (high latitude, with colder climate) from 150 to 500 kWh/m2. That entails a climatic influence over three times in the performance and in particular considers the lower demands in the case with the lower form factor (0.36) and one of the highest demands in the establishment of the greater form factor (0.51). On the other hand, the best performance is the case with greater relative geometrical efficiency (2.39) and less glazing surface (12%), and the worst performance is the case with lower relative geometrical efficiency (1.39) and greater glazing (35%). This facilitates concluding a consistent incidence of the architectural form (specifically of the lower relationship of the surrounding area with the built area, and the lower proportion of glazing), while reducing the energy demand for adequate interior comfort. It is also noted that the construction improvements of insulation and hermeticity were a persistent contribution in all cases and climates, leading to a 20% to 80% of decrease in demand. Therefore, a combination of geometric and material aspects in the architectural design of the establishments (health care centers in this study) can contribute significantly to their environmental behavior.
8. Discussion and Conclusions
These establishments, developed from 1993 onward with a focus on family health care, are programmatically and functionally similar, but are typologically diverse throughout the Chilean territory. Their sizes range from 1000 to 3500 m2, varying according to the population served (5000 to 19,999 to 20,000 to 30,000 users), lot geometry and organization of facilities. These characteristics have led to buildings with one, two or three floors with similar passive and active design strategies. Design is also characterized by an elongated, rectangular, square, and on occasions, curved volumetric composition with a distinct form factor and elevated energy consumption. At the same time, the planning process considers diverse financial and technical instances that assure the pertinence and efficiency of the establishment, considering long term implementation.
Our energy evaluation showed consistent differences in morphological attributes, construction and geographic latitude, showing volumetries with different form factors and with higher energy demands in southern regions. At the same time, for this type of establishment, better insulated and sealed envelopes express a progressive reduction of energy requirements in all examples and climate conditions. This shows a relevant contribution to the environmental quality of these primary health care facilities, making investments in energy efficiency significantly more profitable in geographic regions in the south. Likewise, collaborative work methodologies such as BIM and other technological strategies allow the management, optimization and reduction of energy consumption throughout their lifecycle. We conclude that public building programs, especially in countries such as Chile with large geographic diversity, should consider differences in the climatic environment and technological strategies within collaborative design methodologies. This will better orient design and use of economic resources, providing services with adequate environmental quality, energy performance and social profitability.
Author Contributions
Conceptualization, A.B. and C.R.; Funding acquisition, E.F.; Investigation, E.F., A.N., R.G. and A.B.; Methodology, A.N., A.B. and C.R.; Software, A.N.; Supervision, E.F. and R.G.; Validation, C.R.; Writing—original draft, A.N.; Writing—review & editing, E.F., R.G., A.B. and C.R.
Funding
Fondo Nacional de Desarrollo Científico y Tecnológico: 1171108.
Acknowledgments
This study was partially supported by the Comisión Nacional de Investigación Científica y Tecnológica de Chile (CONICYT), within the framework of the grant Fondecyt Regular N°1171108.
Conflicts of Interest
The authors declare no conflict of interest.
References
- OPS, Organización Panamericana de la Salud. Guías Para El Desarrollo Del Recurso Físico En Salud; OPS: Washington, DC, USA, 1990. [Google Scholar]
- Navarro López, V.; Martín-Zurro, A. La Atención Primaria de Salud En España y Sus Comunidades Autónomas. Concepció Violán Fors, Ed.; Universitat Autònoma de Barcelona: Barcelona, Spain, 2009. [Google Scholar]
- Giliam, S.; Abbott, S. Can Primary Care Groups and Trusts Improve Health? BMJ 2001, 323, 89–92. [Google Scholar] [CrossRef]
- Starfield, B.; Sevilla, F.; Aube, D.; Bergeron, P.; De, J.M.; Hjortdahl, P.; Lumpkin, J.R.; Martínez, J.O.; Sarria-Santamera, A. Primary Health Care and Responsibilities of Public Health in 6 Countries of Europe and North America: A Pilot Study. Rev. Esp. Salud Publ. 2004, 78, 17–26. [Google Scholar]
- Muench, J.; Hoffman, K.; Ponce, J.; Calderón, M.; Meenan, R.T.; Fiestas, F. La Atención Primaria En Los Estados Unidos y La Experiencia Peruana En Perspectiva. Rev. Peru Med. Exp. Salud Publica 2013, 30, 297–302. [Google Scholar] [CrossRef] [PubMed]
- Alcázar, V.R.H.; María, C.P.L.; Julia, M.T.E.; Ivonne, E.F.D.; Daisy, A.M.D.; María del Carmen, M.L. General Considerations on the Evolution of Family Medicine and Primary Health Care in Cuba and Other Countries. Rev. Cuba. Med. Gen. Integral 2014, 30, 364–374. [Google Scholar]
- Montero, J.; Alvaro, T.; Cristian, H. Reforma Sanitaria Chilena y La Atención Primaria de Salud. Algunos Aspectos Críticos. Temas De Agenda Pública U.C. 2010, 5, 13. [Google Scholar]
- De Salud, M. Listado de Establecimientos DEIS Información Del Departamento de Estadísticas e Información de Salud (DEIS); Chilean Ministry of Health: Santiago, Chile, 2018.
- Benavides Paula, S.; Castro Rubén, L.; Jones Ingrid, J. Sistema Público de Salud, Situación Actual y Proyecciones Fiscales 2013-2050; Dirección de Presupuestos: Santiago, Chile, 2013. [Google Scholar]
- Lesley, C. Unit Costs of Health and Social Care. Unit Costs of Health and Social Care; Personal Social Services Research Unit, Ed.; Unit Costs of Health and Social Care: Canterbury, UK, 2009. [Google Scholar]
- Ministerio de Desarrollo Social MIDESO. Metodología de Preparación, Evaluación y Priorización de Proyectos Atención Primaria Del Sector Salud; Ministerio de Desarrollo Social MIDESO: Santiago, Chile, 2013.
- Guerras, J.J.S. Verticalidad versus Horizontalidad. Historia de La Construcción de Hospitales En El Siglo Xx. Inf. De La Construcción 2003, 55, 13. [Google Scholar]
- Facility Guidelines Institute. Guidelines for Design and Construction of Health Care Facilities; Facility Guidelines Institute, Ed.; Facility Guidelines Institute: Washington, DC, USA, 2006. [Google Scholar]
- Halverson, M.; Rosenberg, M. ANSI/ASHRAE/IES Standard 90.1-2013; Determination of Energy Savings; Quantitative Analysis: Washington, DC, USA, 2014. [Google Scholar]
- García, S. Diseño de Centros Sanitarios Eficientes; Agencia Extremeña de la Energía, Ed.; Agencia Extremeña de la Energía: Madrid, Spain, 2014. [Google Scholar]
- Mickaityte, A.; Zavadskas, E.K.; Kaklauskas, A.; Tupenaite, L. The Concept Model of Sustainable Buildings Refurbishment. Int. J. Strateg. Prop. Manag. 2008, 12, 53–68. [Google Scholar] [CrossRef]
- Oliver-Solà, J.; Armero, M.; de Foix, B.M.; Rieradevall, J. Energy and Environmental Evaluation of Municipal Facilities: Case Study in the Province of Barcelona. Energy Policy 2013, 61, 920–930. [Google Scholar] [CrossRef]
- Rajagopalan, P.; Hisham, E. Energy Performance of Medium-Sized Healthcare Buildings in Victoria, Australia—A Case Study. J. Healthc. Eng. 2014, 5, 247–260. [Google Scholar] [CrossRef] [PubMed]
- Bonnema, E.; Doebber, I.; Pless, S.; Torcellini, P. Technical Support Document: Development of the Advanced Energy Design Guide for Small Hospitals and Healthcare Facilities-30% Guide; National Renewable Energy Laboratory, Ed.; National Renewable Energy Laboratory: Golden, CO, USA, 2010. [Google Scholar]
- Moreno, C.M. Diseño y Monitorización a Través de Sensores de Diferentes Aspectos Ambientales y de Confort En Un Edificio; Universidad de Jaén: Jaén, Spain, 2016. [Google Scholar]
- Olgyay, V.; Josefina, F.; Luis, C. Arquitectura y Clima: Manual de Diseño Bioclimático Para Arquitectos y Urbanistas; Gustavo Gili: Barcelona, Spain, 1998. [Google Scholar]
- Hermelink, A.; Schimschar, S.; Boermans, T.; Pagliano, L.; Zangheri, P.; Armani, R.; Voss, K.; Musall, E. Towards Nearly Zero-Energy Buildings Definition of Common Principles under the EPBD—Final Report. In Proceedings of the 2013 European Council for an Energy Efficient Economy, Brussels, Belgium, 17 December 2013. [Google Scholar]
- Premrov, M.; Leskovar, V.Z.; Mihalič, K. Influence of the Building Shape on the Energy Performance of Timber-Glass Buildings in Different Climatic Conditions. Energy 2016, 108, 201–211. [Google Scholar] [CrossRef]
- Binaee, R. The Correlation between Building Shape and Building Energy. Int. J. Adv. Res. 2017, 5, 552–561. [Google Scholar]
- Kaewunruen, S.; Rungskunroch, P.; Welsh, J. A Digital-Twin Evaluation of Net Zero Energy Building for Existing Buildings. Sustainability 2019, 11, 159. [Google Scholar] [CrossRef]
- Menezes, A.C.; Cripps, A.; Bouchlaghem, D.; Buswell, R. Predicted vs. Actual Energy Performance of Non-Domestic Buildings: Using Post-Occupancy Evaluation Data to Reduce the Performance Gap. Appl. Energy 2012, 97, 355–364. [Google Scholar] [CrossRef]
- Moos, R.H.; Schaefer, J.A. Evaluating Health Care Work Settings: A Holistic Conceptual Framework. Psychol. Health 1987, 1, 97–122. [Google Scholar] [CrossRef]
- De Energía, M. Energía-2050, Política Energética de Chile; Ministerio de Energía, Ed.; Ministerio de Energía: Santiago, Chile, 2016.
- Mideplan. Preparación y Presentación de Proyectos de Inversión; Ministerio de planificaión y cooperación, Ed.; Ministerio de planificaión y cooperación: Santiago, Chile, 1998. [Google Scholar]
- Citectubb; Deconuc. TDRe1 Términos de Referencia Estandarizado Con Parámetros de Eficiencia Energética y Confort Ambiental, Para Licitaciones de Diseño y Obra de La Dirección de Arquitectura, Según Zonas Geográficas Del País y Según Tipología de Edificios; Concepciòn, Chile; 2004. Available online: http://construccionsustentable.uc.cl/images/Documentos/TDRe_MOP-DA.pdf (accessed on 15 January 2019).
- Rey-hern, J.M.; Velasco-g, E.; San, J.F.; Tejero-gonz, A.; Rey-mart, F.J. Energy Analysis at a Near Zero Energy Building. Available online: https://www.mdpi.com/1996-1073/11/4/857 (accessed on 15 January 2019).
- Instituto Nacional de Normalización. NCH 1079 Arquitectura y Construcción- Zonificación Climático Habitacional Para Chile y Recomendaciones Para El Diseño Arquitectónico; Instituto Nacional de Normalización: Santiago, Chile, 2008. [Google Scholar]
- Servicio andaluz de Salud. Guía de Diseño de Centros de Atención Primaria; Servicio andaluz de Salud: Sevilla, Spain, 2008. [Google Scholar]
- Nirit, P.P.; Kalay, Y.E. Open Architecture for Healthcare: Case Study of Hospital Change in Practice. 2017. Available online: http://www.uia2017seoul.org/P/papers/Full_paper/Special_Session/Oral/O-0631.pdf (accessed on 15 January 2019).

© 2019 by the authors. Licensee MDPI, Basel, Switzerland. This article is an open access article distributed under the terms and conditions of the Creative Commons Attribution (CC BY) license (http://creativecommons.org/licenses/by/4.0/).