The Influence of Information Services on Public Transport Behavior of Urban and Rural Residents


Abstract
1. Introduction
2. Literature Review
3. Data and Methods
3.1. Data Collection
3.2. Methodology
3.2.1. Theory of SEM
- Multiple endogenous variables (dependent variables) can be processed simultaneously;
- The model can contain variables that cannot be directly measured (latent variables, such as the subjective attitude of the individual), can characterize the relationship between latent variables, and can assess the reliability and validity of the variables;
- The structural relationship between various variables can be designed and the fitting level of the model can be estimated;
- In addition to analyzing the direct effects between variables (the direct effect of exogenous variables on endogenous variables), the indirect effects of independent variables on dependent variables can also be obtained (exogenous variables affect endogenous variables through one or more mediator variables) or a total effect (the sum of the two) that enables a more accurate analysis of the relationship between variables.
3.2.2. Conceptual Structure
3.2.3. Key Variables
3.2.4. Model Hypothesis
3.3. Estimation Results
3.3.1. Model Fitness Indices
3.3.2. Effects of Variables
4. Suggestions
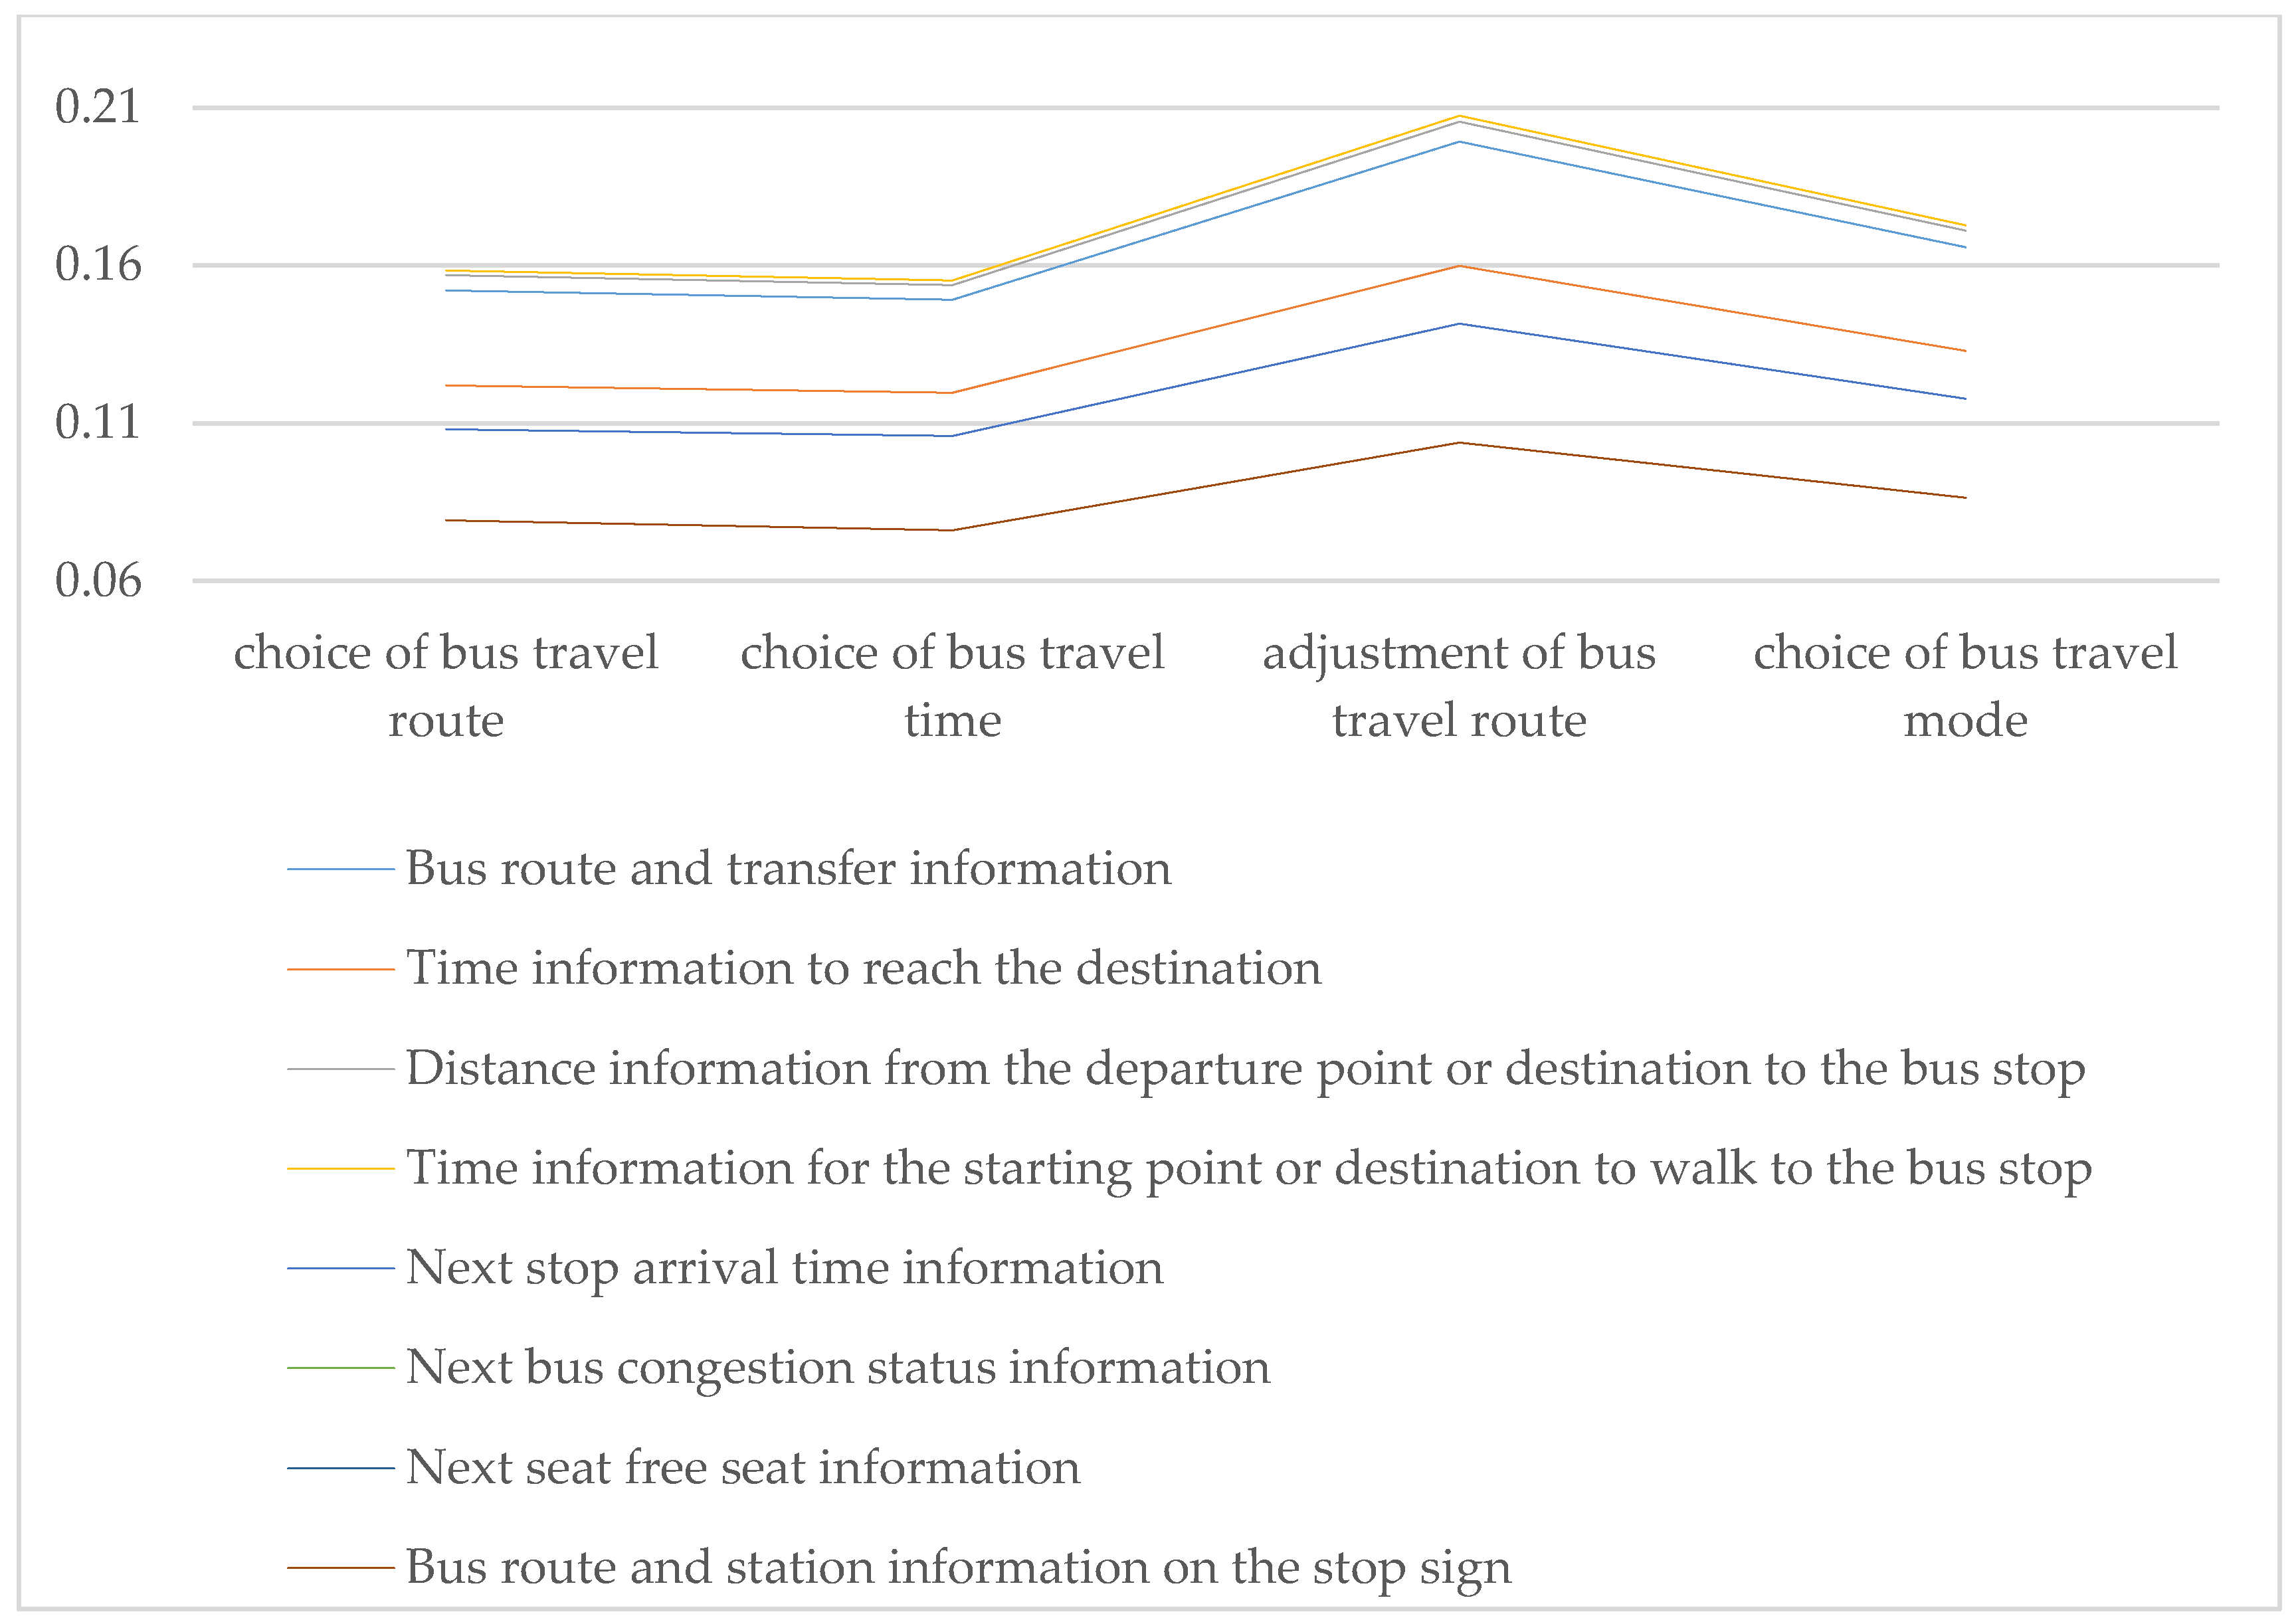
- In the public transport information service of urban and rural areas, the information service before travel has a greater influence on the public transport travel choice behavior of urban and rural residents than information service during travel. Therefore, improving the information service level before travel is the key to improving the public transport information service level of urban and rural areas.
- “Time information of the starting point or destination walking to the bus stop”, “distance information of the starting point or destination walking to the bus stop” and “bus line and transfer information” have a relatively important influence on the public transport travel choice behaviors of urban and rural residents. Therefore, effective and convenient provision of static information services such as bus stops, bus routes and corresponding transfers should be the focus of public transport information service construction before travel of urban and rural areas.
- The “incoming station arrival time information” and “next bus congestion status information” also have a relatively important influence on public transport travel choices of urban and rural residents, especially “the next station arrival time information”. Therefore, providing information such as the arrival time of the next station on the train and the information of the congestion status of the next bus with dynamic characteristics should be the focus of the construction of public transport information services of urban and rural areas.
- Before the trip, the static public transport information service is recommended to be released via the Internet or mobile app. The bus terminal and some large-scale stop stations are recommended to post a complete bus route map and timetable information map, and the bus map should indicate the public transport information that can be transferred. For dynamic public transport information during travel, if economic conditions permit, it is recommended to build an intelligent docking station for distribution (via electronic display), such as publishing the next bus arrival time, the next bus congestion situation and other information. Otherwise, it can be temporarily released through the mobile app.
5. Conclusions
Author Contributions
Funding
Acknowledgments
Conflicts of Interest
Appendix A

Appendix B
| Questionnaire survey of residents’ public transportation in Beidaihe New District, Qinhuangdao City |
| Investigator: ________ Date: __________ Location of investigation: ___________ |
| Hello! The Beidaihe New District of Qinhuangdao City is conducting a survey on residents’ public transport trips to provide basic information for public transport planning in the district. Your answers will only be used for statistical analysis, not personal privacy, and will not be used for other purposes. Thank you for your cooperation. |
- ■
- If you frequently take the public transport, please fill in this section, where the box with “-” is not required.
- ■
- Please refer to the following five levels to score the actual satisfaction and expectations for the daily public transport service indicators listed in the table below.
- ■
- Satisfaction level division: 5 points means “very satisfied”; 4 points means “satisfactory”; 3 points means “general satisfaction”; 2 points means “unsatisfactory”; 1 point means “very dissatisfied”.
- ■
- Expectation level division: 5 points means “very expected”; 4 points means “comparative expectations”; 3 points means “general expectations”; 2 points means “not expected”; 1 point means “very undesired”.
- ■
- The last column of indicators is sorted by importance, using sequence numbers, arranged from high to low.
| Index | Serial Number | Specific Indicators | Satisfaction | Expectation | Order Importance Ranking | ||||||||
| 1 | 1 | Bus fare information (B1) | 5 | 4 | 3 | 2 | 1 | 5 | 4 | 3 | 2 | 1 | ___>___>___>___>___>___ |
| 2 | Bus route and transfer information (B2) | 5 | 4 | 3 | 2 | 1 | 5 | 4 | 3 | 2 | 1 | ||
| 3 | Time information to reach the destination (B3) | 5 | 4 | 3 | 2 | 1 | 5 | 4 | 3 | 2 | 1 | ||
| 4 | Bus route schedule information (B4) | 5 | 4 | 3 | 2 | 1 | 5 | 4 | 3 | 2 | 1 | ||
| 5 | Distance information from the departure point or destination to the bus stop (B5) | 5 | 4 | 3 | 2 | 1 | 5 | 4 | 3 | 2 | 1 | ||
| 6 | Time information for the starting point or destination to walk to the bus stop (B6) | 5 | 4 | 3 | 2 | 1 | 5 | 4 | 3 | 2 | 1 | ||
| 2 | 1 | Next bus location information (C1) | 5 | 4 | 3 | 2 | 1 | 5 | 4 | 3 | 2 | 1 | ___>___>___>___>___>___ |
| 2 | Site next bus arrival time information (C2) | 5 | 4 | 3 | 2 | 1 | 5 | 4 | 3 | 2 | 1 | ||
| 3 | Next stop arrival time information on the bus (C3) | 5 | 4 | 3 | 2 | 1 | 5 | 4 | 3 | 2 | 1 | ||
| 4 | Next bus congestion status information (C4) | 5 | 4 | 3 | 2 | 1 | 5 | 4 | 3 | 2 | 1 | ||
| 5 | Next bus free seat information (C5) | 5 | 4 | 3 | 2 | 1 | 5 | 4 | 3 | 2 | 1 | ||
| 6 | Bus route and site information on the stop sign (C6) | 5 | 4 | 3 | 2 | 1 | 5 | 4 | 3 | 2 | 1 | ||
| 3 | 1 | Air conditioning service in the bus (D1) | 5 | 4 | 3 | 2 | 1 | 5 | 4 | 3 | 2 | 1 | ___>___>___>___ |
| 2 | Credit card machine service in the bus (D2) | 5 | 4 | 3 | 2 | 1 | 5 | 4 | 3 | 2 | 1 | ||
| 3 | The smoothness of bus operation (D3) | 5 | 4 | 3 | 2 | 1 | 5 | 4 | 3 | 2 | 1 | ||
| 4 | Service attitude of the staff (D4) | 5 | 4 | 3 | 2 | 1 | 5 | 4 | 3 | 2 | 1 | ||
| 4 | 1 | The convenience of taking the bus to the city (E1) | 5 | 4 | 3 | 2 | 1 | 5 | 4 | 3 | 2 | 1 | ___>___>___ |
| 2 | The convenience of taking the bus to the adjacent town (E2) | 5 | 4 | 3 | 2 | 1 | 5 | 4 | 3 | 2 | 1 | ||
| 3 | The convenience of transferring to other buses at the site (E3) | 5 | 4 | 3 | 2 | 1 | 5 | 4 | 3 | 2 | 1 | ||
| 5 | 1 | Bus on time by schedule (F1) | 5 | 4 | 3 | 2 | 1 | 5 | 4 | 3 | 2 | 1 | - |
| 6 | 1 | The completeness of the site facilities (such as seats, canopies, etc.) (F2) | - | - | - | - | - | 5 | 4 | 3 | 2 | 1 | - |
| Index | Serial Number | Specific Indicators | Compliance | ||||
| 7 | 1 | If the car is not crowded, it will be more willing to use (G1) | 5 | 4 | 3 | 2 | 1 |
| 2 | If you know the next bus arrival time at the site, you will be more willing to use it (G2) | 5 | 4 | 3 | 2 | 1 | |
| 3 | If the bus is more punctual, it will be more willing to use (G3) | 5 | 4 | 3 | 2 | 1 | |
| 4 | If the bus fare is lowered, it will be more willing to use (G4) | 5 | 4 | 3 | 2 | 1 | |
| 5 | If you have a bus stop near your home, you will be more willing to use it (G5) | 5 | 4 | 3 | 2 | 1 | |
| 6 | If the number of bus shifts increases, it will be more willing to use (G6) | 5 | 4 | 3 | 2 | 1 | |
| 7 | If you are convenient to transfer to other buses at the site, you will be more willing to use (G7) | 5 | 4 | 3 | 2 | 1 | |
| 8 | 1 | I will use the route query information to select the travel route (H1) | 5 | 4 | 3 | 2 | 1 |
| 2 | I will use the timetable and each bus arrival time to adjust the departure time (H2) | 5 | 4 | 3 | 2 | 1 | |
| 3 | I will use the line and transfer query information to adjust the travel route in the middle (H3) | 5 | 4 | 3 | 2 | 1 | |
| 4 | I will not take the bus because the stop sign has no route and site information (H4) | 5 | 4 | 3 | 2 | 1 | |
| 5 | I will give up the bus because the station does not have the next bus arrival time information (H5) | 5 | 4 | 3 | 2 | 1 | |
References
- Gu, C.; Kesteloot, C.; Cook, I.G. Theorising Chinese urbanisation: A multilayered perspective. Urban Stud. 2015, 52, 2564–2580. [Google Scholar] [CrossRef]
- Wang, Z.; Xiao, D.L.; Tian, Y.J. The Integration of Urban and Rural Public Transportation Operation. In Proceedings of the IEEE International Conference on Intelligent Computation Technology & Automation, Changsha, China, 10–11 October 2009. [Google Scholar]
- ACTRDS and SRIMT (Academic Commission of Transp01tation Reform and Development Se1ninar, Scientific Research Institute of the Ministry of Transport). Annual Report on Sustainable Transportation Development in the Central Cities of China; China Communications Press: Beijing, China, 2008. [Google Scholar]
- Zhou, X.; Du, H.; Liu, Y.; Huang, H.; Ran, B. Investigating the intension of rural residents to use transit China: A case study in Cixi. J. Urban Plan. Dev. 2017, 143, 05016017. [Google Scholar] [CrossRef]
- Zhou, X.; Huang, H.; Jia, X.; Jiang, N. Analysis of Rural Public Transport Service Based on User’s Perception. In Proceedings of the Transportation Research Board (TRB) 94th Annual Meeting, Washington, DC, USA, 11–15 January 2015; Volume 1, pp. 11–15. [Google Scholar]
- Zhou, X.; Jia, X. Travel Mode Choice based on Perceived Quality of Public Transport Service. In Proceedings of the 15th COTA conference International Conference of Transportation Professionals (CICTP 2015), Beijing, China, 24–27 July 2015. [Google Scholar]
- Ji, X. Analysis of Travel Information Demand of Urban Public Transportation System. Compr. Transp. 2008, 3, 61–63. [Google Scholar]
- Bernick, M.; Cervero, R. Public Transportvillages for the 21st Century; McGraw-Hill Companies: New York, NY, USA, 1997. [Google Scholar]
- Huang, X. French Urbanization and Urban-Rural Integration and Enlightenment—Investigations in the Paris Region. Urban Probl. 1997, 5, 46–49. [Google Scholar]
- May, A.D.; Kelly, C.; Shepherd, S. The principles of integration in urban transport strategies. Transp. Policy 2006, 13, 319–327. [Google Scholar] [CrossRef]
- Guo, X.; Wang, D.; Jiang, X. Construction of the Overall Framework of Urban and Rural Public Transport Integration Planning. Mod. Urban Res. 2009, 24, 24–28. [Google Scholar]
- Shi, G.; Li, Y. Discussion on the Implementation Strategy of Urban and Rural Public Transport Integration. Urban Public Transp. 2012, 1, 21–23. [Google Scholar]
- Fan, J. Discussion on Several Problems of Urban and Rural Public Transport Integration Planning and Management. Traffic Stand. 2007, 2, 44–47. [Google Scholar]
- Fu, Q. Research on Urban Passenger Transport Integrated Passenger Transport Network Planning Method; Chongqing Jiaotong University: Chongqing, China, 2011. [Google Scholar]
- Cheng, L. Research on Optimization Layout of Urban and Rural Public Transport Integration Network; Changsha University of Science and Technology: Changsha, China, 2008. [Google Scholar]
- Wang, J.; Guo, X.; Wu, N.; Zhao, W.; Tong, Q. Analysis of characteristics of rural passenger flow and organization of class lines. In Proceedings of the International Conference on Transportation, Dalian, Liaoning, China, 23 June 2006. [Google Scholar]
- Jiang, X.; Guo, X.; Li, J.; Xi, Z. Research on Urban and Rural Public Transport Capacity Allocation Based on Area Organization. J. Transp. Syst. Eng. Inf. 2014, 126–130. [Google Scholar]
- Wen, X.; Wang, D.; Guo, X. Research on Operational Organization Optimization of Urban and Rural Public Transport Lines Based on Transportation Reliability. Mod. Urban Res. 2012, 97–102. [Google Scholar]
- Phanikumar, C.V.; Maitra, B. Willingness-to-Pay and Preference Heterogeneity for Rural Public Transport Attributes. J. Transp. Eng. 2007, 133, 62–69. [Google Scholar] [CrossRef]
- Yang, H.; Cherry, C.R. Statewide Rural-Urban Public Transport Travel Demand and Network Evaluation: An Application in Tennessee. J. Public Transp. 2012, 15, 97–111. [Google Scholar] [CrossRef]
- Wang, C.; Quddus, M.; Enoch, M.; Ryley, T.; Davison, L. Exploring the propensity to travel by demand responsive transport in the rural area of Lincolnshire in England. Case Stud. Transp. Policy 2015, 38, 129–136. [Google Scholar] [CrossRef]
- Dandapat, S.; Maitra, B. An approach for identifying optimal service for rural public transport routes. Case Stud. Transp. Policy 2015, 3, 287–294. [Google Scholar] [CrossRef]
- Chen, C.; Achtari, G.; Majkut, K.; Sheu, J.B. Balancing equity and cost in rural transportation management with multi-objective utility analysis and data envelopment analysis: A case of Quinte West. Transp. Res. Part Policy Pract. 2017, 95, 148–165. [Google Scholar] [CrossRef]
- Stern, E. Public transport Services in Rural Areas. Environ. Behav. 1982, 14, 94–112. [Google Scholar] [CrossRef]
- Gao, S.; Huang, H. Real-time traveler information for optimal adaptive routing in stochastic time-dependent networks. Transp. Res. Part C Emerg. Technol. 2012, 21, 196–213. [Google Scholar] [CrossRef]
- Chorus, C.G.; Molin, E.J.; Van Wee, B. Use and Effects of Advanced Traveller Information Services (ATIS): A Review of the Literature. Transp. Rev. 2006, 26, 127–149. [Google Scholar] [CrossRef]
- Juan, Z.; Xianyu, J. Research on Activity-Travel Decision Behavior under the Influence of Traffic Information. China J. Highw. Transp. 2008, 21, 88–93. [Google Scholar]
- Guo, S. Modeling and Simulation of Commuter Travel Behavior under Public Transport Dynamic Information Service; Southeast University: Nanjing, China, 2014. [Google Scholar]
- Toledo, T.; Beinhaker, R. Evaluation of the Potential Benefits of Advanced Traveler Information Systems. J. Intel. Transp. Syst. 2006, 10, 173–183. [Google Scholar] [CrossRef]
- Wang, X.; Khattak, A. Role of travel information in supporting travel decision adaption: Exploring spatial patterns. Transp. A Transp. Sci. 2013, 9, 316–334. [Google Scholar] [CrossRef]
- Levinson, D. The value of advanced traveler information systems for route choice. Transp. Res. Part C Emerg. Technol. 2003, 11, 75–87. [Google Scholar] [CrossRef]
- Wei, X.; Ji, X.; Li, J. Research on the Influence Mechanism of Public Transportation Travel Information on Passenger Travel Behavior. In Proceedings of the China Intelligent Transportation Annual Conference and International Energy Conservation and New Energy Vehicle Innovation Development Forum Excellent, Beijing, China, 6 September 2011. [Google Scholar]
- Emmerink, R.H.; Verhoef, E.T.; Nijkamp, P.; Rietveld, P. Information policy in road transport with elastic demand: Some welfare economic considerations. Eur. Econ. Rev. 1998, 42, 71–95. [Google Scholar] [CrossRef]
- Brakewood, C.; Macfarlane, G.S.; Watkins, K. The impact of real-time information on public transport ridership in New York City. Transp. Res. Part C Emerg. Technol. 2015, 53, 59–75. [Google Scholar] [CrossRef]
- Brakewood, C.; Barbeau, S.; Watkins, K. An experiment evaluating the impacts of real-time public transportinformation on public transport riders in Tampa, Florida. Transp. Res. Part A Policy Pract. 2014, 69, 409–422. [Google Scholar] [CrossRef]
- Watkins, K.E.; Ferris, B.; Borning, A.; Rutherford, G.S.; Layton, D. Where Is My Public transport? Impact of mobile real-time information on the perceived and actual wait time of public transport riders. Transp. Res. Part A Policy Pract. 2011, 45, 839–848. [Google Scholar] [CrossRef]
- Zhu, H. Research on Traffic Behavior Characteristics and Mode Selection Model Based on Activity Analysis; Tongji University: Shanghai, China, 2005. [Google Scholar]
- Ma, F.; Sun, Q.; Wang, L.; Chen, Y. Research on Influencing Factors of Urban and Rural Public transport Service Quality Based on SERVPERF. Transp. Syst. Eng. Inf. 2013, 13, 153–157. [Google Scholar]
- Chen, J.; Yan, Q.; Yang, F.; Hu, J. SEM-Logit Integration Model of Travel Mode Choice Behavior. J. South China Univ. Technol. (Nat. Sci. Ed.) 2013, 41, 51–57. [Google Scholar]
- Ben-Akiva, M.E.; Lerman, S.R.; Lerman, S.R. Discrete Choice Analysis: Theory and Application to Travel Demand; MIT Press: Cambridge, MA, USA, 1987. [Google Scholar]
- Chen, J.; Ma, Y.; Zhu, N. Research on the Choice Behavior of Public Transport Trip Mode Based on Nested Logit Model. Transp. Syst. Eng. Inf. 2011, 11, 120–125. [Google Scholar]
- Train, K.E. Discrete Choice Methods with Simulation, 2nd ed.; Cambridge University Press: Cambridge, UK, 2009. [Google Scholar]
- Daganzo, C. Multinomial Probit: The Theory and Its Application to Demand Forecasting; Elsevier: San Diego, CA, USA, 1979. [Google Scholar]
- Hongfei, L.; Pengfei, H.U. Analysis of Residents’ Travel Mode Choice Based on Prospect Theory. J. Transp. Inf. Saf. 2012, 30, 37–40. [Google Scholar]
- Lyon, P.K. Time-dependent structural equations modelling of the relationship between attitudes and discrete choice behavior of transportation consumers. Consumers. 1981. Available online: https://elibrary.ru/item.asp?id=7344476 (accessed on 1 October 2019).
- Golob, T.F.; Kitamura, R.; Supernak, J. A Panel-Based Evaluation of the San Diego I-15 Carpool Lanes Project; Panels for Transportation Planning, Kluwer Academic Publishers: Dordrecht, The Netherlands, 1997; pp. 97–128. [Google Scholar]
- Golob, T.F.; Hensher, D.A. Greenhouse gas emissions and australian commuters’ attitudes and behavior concerning abatement policies and personal involvement. Transp. Res. Part D Transp. Environ. 1998, 3, 1–18. [Google Scholar] [CrossRef]
- Acker, V.V.; Witlox, F. Car ownership as a mediating variable in car travel behaviourresearch using a structural equation modelling approach to identify its dual relationship. J. Transp. Geogr. 2010, 18, 65–74. [Google Scholar] [CrossRef]
- Chung, J.H.; Kim, S.; Lee, Y.K.; Choi, Y.S. Multilevel Structural Equation Model for Activity Participation and Travel Behavior: Data from the Puget Sound Transportation Panel. Transp. Res. Rec. J. Transp. Res. Board 2004, 1898, 52–60. [Google Scholar] [CrossRef]
- Li, Y.; Yan, L.; Wei, Y. Analysis of Travel Characteristics of Residents in Coastal Developed Small Towns and Countermeasures for Traffic Development—Taking Wanquan Town, Pingyang County, Zhejiang Province as an Example. Transp. Transp. Acad. Ed. 2011, 7, 8–11. [Google Scholar]
- Esztergár-Kiss, D. Framework of aspects for the evaluation of multimodal journey planners. Sustainability 2019, 11, 4960. [Google Scholar] [CrossRef]
- Von Behren, S.; Minster, C.; Magdolen, M.; Chlond, B.; Hunecke, M.; Vortisch, P. Bringing travel behavior and attitudes together: An integrated survey approach for clustering urban mobility types. In Proceedings of the 97th Annual Meeting of the Transportation Research Board (TRB 2018), Washington, DC, USA, 7–11 January 2018. [Google Scholar]
- Abenoza, R.F.; Cats, O.; Susilo, Y.O. How does travel satisfaction sum up? An exploratory analysis in decomposing the door to door experience for multimodal trips. Transportation 2018, 1–28. [Google Scholar] [CrossRef]
- Peng, C.; Zhou, X.; Zhang, D.; Lin, N.; Song, X. Analysis of Factors Affecting Bus Service Quality Based on Passenger Perception. J. Traffic Inf. Saf. 2013, 31, 40–44. [Google Scholar]


| Main Feature | Classification | Percentage (%) |
|---|---|---|
| Gender | male | 41 |
| female | 59 | |
| Age | <20 | 10 |
| 20–29 | 37 | |
| 30–39 | 26 | |
| 40–49 | 18 | |
| 50–59 | 3 | |
| ≥60 | 6 | |
| Registered residence | Local registered residence | 95 |
| Non-local registered residence | 5 | |
| Career | Office staff | 48 |
| Self-employed | 8 | |
| Worker | 15 | |
| Business service staff | 6 | |
| Farmer | 8 | |
| Student | 6 | |
| Unemployed | 4 | |
| Others | 5 | |
| Educational background | High school, technical secondary school and below | 25 |
| Junior college | 37 | |
| Undergraduate | 34 | |
| Postgraduate and above | 4 | |
| Monthly personal income | <1000 | 5 |
| 1000–2000 | 18 | |
| 2000–3000 | 17 | |
| 3000–4000 | 42 | |
| 4000–5000 | 12 | |
| ≥5000 | 6 | |
| Annual household income | <20,000 | 4 |
| 20,000–50,000 | 30 | |
| 50,0000–80,000 | 33 | |
| 80,000–100,000 | 21 | |
| 100,000–150,000 | 8 | |
| ≥150,000 | 4 | |
| Car ownership | Yes | 44 |
| No | 56 |
| Variable Attribute | Variable Categories | Variable Names (Encoding) |
|---|---|---|
| Exogenous variable | Personal and family characteristics (UV1) | Gender (A1) |
| Age (A2) | ||
| Monthly personal income (A3) | ||
| Occupation (A4) | ||
| Driving license (A5) | ||
| Car ownership (A6) | ||
| Annual household income (A7) | ||
| Endogenous variable | Information service factors before travel (UV2) | Bus fare information (B1) |
| Bus route and transfer information (B2) | ||
| Time information to arrive at the destination (B3) | ||
| Bus route schedule information (B4) | ||
| Distance information from the departure point or destination to the bus stop (B5) | ||
| Time information for the departure point or destination to walk to the bus stop (B6) | ||
| Information service factors during travel (UV3) | Next bus location information (C1) | |
| Site next bus arrival time information (C2) | ||
| Next stop arrival time information (C3) | ||
| Next bus congestion status information (C4) | ||
| Next seat free seat information (C5) | ||
| Bus route and station information on the stop sign (C6) | ||
| Other public transport service factors (UV4) | Air conditioning service in the bus (D1) | |
| Credit card machine service in the bus (D2) | ||
| The smoothness of bus operation (D3) | ||
| Service attitude of the passengers (D4) | ||
| Convenience of taking the bus to the city (E1) | ||
| Convenience of taking the bus to the adjacent town (E2) | ||
| The convenience of transferring to other buses at the site (E3) | ||
| The punctuality of the bus to the station by timetable (F1) | ||
| The completeness of the site facilities (such as seats, canopies, etc.) (F2) | ||
| Public transport travel willingness of urban and rural residents (UV5) | If the car is not crowded, it will be more willing to use (G1) | |
| If you know the next bus arrival time at the site, you will be more willing to use (G2) | ||
| If the bus is more punctual, it will be more willing to use (G3) | ||
| If the bus fare is reduced, it will be more willing to use (G4) | ||
| If there is a bus stop near the home, you will be more willing to use (G5) | ||
| If the number of bus shifts increases, it will be more willing to use (G6) | ||
| If you are convenient to transfer to other buses at the site, you will be more willing to use (G7) | ||
| Public transport travel choice behavior of urban and rural residents (UV6) | I will use the route query information to select the travel route (H1) | |
| I will use the timetable and each bus arrival time to adjust the departure time (H2) | ||
| I will use the line and transfer query information to adjust the travel route in the middle (H3) | ||
| I will not take the bus because the stop sign has no route and site information (H4) | ||
| I will give up the bus because the station does not have the next bus arrival time information (H5) |
| Latent Variable | Cronbach’s Alpha Coefficient | Observed Indicator (Coding) | Cronbach’s Alpha Coefficient with the Item Taken Out |
|---|---|---|---|
| Information service before travel | 0.874 | Bus fare information (B1) | 0.857 |
| Bus route and transfer information (B2) | 0.861 | ||
| Time information to arrive at the destination (B3) | 0.866 | ||
| Bus route schedule information (B4) | 0.873 | ||
| Distance information from the departure point or destination to the bus stop (B5) | 0.856 | ||
| Time information for the departure point or destination to the bus stop (B6) | 0.859 | ||
| Information service during travel | 0.867 | Next bus location information (C1) | 0.864 |
| Next bus arrival time information on the site (C2) | 0.857 | ||
| Next stop arrival time information (C3) | 0.852 | ||
| Next bus congestion status information (C4) | 0.851 | ||
| Next seat free seat information (C5) | 0.854 | ||
| Bus route and station information on the stop sign (C6) | 0.850 | ||
| Other public transport services | 0.859 | Air conditioning service in the bus (D1) | 0.846 |
| Credit card machine service in the bus (D2) | 0.849 | ||
| The smoothness of bus operation (D3) | 0.850 | ||
| Service attitude of the passengers (D4) | 0.848 | ||
| Convenience of taking the bus to the city (E1) | 0.850 | ||
| The convenience of taking the bus to the adjacent town (E2) | 0.850 | ||
| The convenience of transferring to other buses at the site (E3) | 0.852 | ||
| The punctuality of the bus to the station by timetable (F1) | 0.855 | ||
| The completeness of ordinary facilities (such as seats, canopies, etc.) (F2) | 0.856 | ||
| public transport travel willingness of urban and rural residents | 0.861 | If the car is not crowded, it will be more willing to use (G1) | 0.850 |
| If you know the next bus arrival time at the site, you will be more willing to use (G2) | 0.853 | ||
| If the bus is more punctual, it will be more willing to use (G3) | 0.850 | ||
| If the bus fare is lowered, it will be more willing to use (G4) | 0.845 | ||
| If there is a bus stop near the home, you will be more willing to use (G5) | 0.851 | ||
| If the number of bus shifts increases, it will be more willing to use (G6) | 0.850 | ||
| If you are convenient to transfer to other buses at the site, you will be more willing to use (G7) | 0.855 | ||
| public transport travel choice behavior of urban and rural residents | 0.857 | I will use the route query information to select the travel route (H1) | 0.850 |
| I will use the timetable and each bus arrival time to adjust the departure time (H2) | 0.850 | ||
| I will use the line and transfer query information to adjust the travel route in the middle (H3) | 0.851 | ||
| I will not take the bus because the stop sign has no route and site information (H4) | 0.850 | ||
| I will give up the bus because the station does not have the next bus arrival time information (H5) | 0.850 |
| Relationship between Variables | Estimate | S.E. | C.R. | P | ||
|---|---|---|---|---|---|---|
| UV4 | <--- | UV1 | 0.348 | 0.237 | 1.472 | 0.141 |
| UV2 | <--- | UV1 | 0.775 | 0.463 | 1.673 | 0.094 |
| UV3 | <--- | UV1 | 0.227 | 0.189 | 1.206 | 0.228 |
| UV5 | <--- | UV4 | 0.233 | 0.197 | 1.184 | 0.236 |
| UV5 | <--- | UV1 | 0.179 | 0.214 | 0.837 | 0.403 |
| UV5 | <--- | UV2 | 0.160 | 0.063 | 2.527 | 0.012 |
| UV5 | <--- | UV3 | 0.506 | 0.588 | 0.862 | 0.389 |
| UV6 | <--- | UV4 | 0.543 | 0.364 | 1.489 | 0.136 |
| UV6 | <--- | UV5 | 0.537 | 0.250 | 2.146 | 0.032 |
| UV6 | <--- | UV3 | 1.284 | 1.161 | 1.106 | 0.269 |
| A1 | <--- | UV1 | 1.000 | |||
| A2 | <--- | UV1 | −0.717 | 0.523 | −1.370 | 0.171 |
| A3 | <--- | UV1 | −3.448 | 0.800 | −4.311 | *** |
| A4 | <--- | UV1 | 2.561 | 1.102 | 2.324 | 0.020 |
| A5 | <--- | UV1 | 0.668 | 0.224 | 2.983 | 0.003 |
| A6 | <--- | UV1 | −0.520 | 0.200 | −2.607 | 0.009 |
| A7 | <--- | UV1 | −2.571 | 0.659 | −3.904 | *** |
| C6 | <--- | UV3 | 1.000 | |||
| C5 | <--- | UV3 | 4.954 | 3.922 | 1.263 | 0.207 |
| C4 | <--- | UV3 | 4.524 | 3.665 | 1.234 | 0.217 |
| C3 | <--- | UV3 | 4.491 | 3.576 | 1.256 | 0.209 |
| C2 | <--- | UV3 | 9.041 | 7.045 | 1.283 | 0.199 |
| C1 | <--- | UV3 | 7.631 | 5.944 | 1.284 | 0.199 |
| B6 | <--- | UV2 | 1.000 | |||
| B5 | <--- | UV2 | 0.913 | 0.153 | 5.961 | *** |
| B4 | <--- | UV2 | 0.268 | 0.153 | 1.755 | 0.079 |
| B3 | <--- | UV2 | 0.600 | 0.148 | 4.041 | *** |
| B2 | <--- | UV2 | 0.676 | 0.135 | 5.002 | *** |
| B1 | <--- | UV2 | 0.262 | 0.158 | 1.656 | 0.098 |
| D4 | <--- | UV4 | 1.000 | |||
| D3 | <--- | UV4 | 1.649 | 0.907 | 1.818 | 0.069 |
| D2 | <--- | UV4 | 1.381 | 0.827 | 1.670 | 0.095 |
| D1 | <--- | UV4 | 0.951 | 0.594 | 1.602 | 0.109 |
| G1 | <--- | UV5 | 1.000 | |||
| G2 | <--- | UV5 | 1.587 | 0.410 | 3.872 | *** |
| G3 | <--- | UV5 | 1.443 | 0.380 | 3.801 | *** |
| G4 | <--- | UV5 | 1.526 | 0.462 | 3.304 | *** |
| G5 | <--- | UV5 | 1.688 | 0.438 | 3.851 | *** |
| G6 | <--- | UV5 | 1.742 | 0.445 | 3.915 | *** |
| G7 | <--- | UV5 | 1.721 | 0.468 | 3.675 | *** |
| H1 | <--- | UV6 | 1.000 | |||
| H2 | <--- | UV6 | 0.943 | 0.264 | 3.577 | *** |
| H4 | <--- | UV6 | 1.085 | 0.316 | 3.432 | *** |
| H5 | <--- | UV6 | 0.941 | 0.328 | 2.870 | 0.004 |
| E1 | <--- | UV4 | 1.570 | 0.850 | 1.848 | 0.065 |
| F2 | <--- | UV4 | 0.756 | 0.519 | 1.457 | 0.145 |
| F1 | <--- | UV4 | 1.817 | 0.981 | 1.852 | 0.064 |
| E3 | <--- | UV4 | 2.160 | 1.132 | 1.908 | 0.056 |
| E2 | <--- | UV4 | 2.978 | 1.512 | 1.970 | 0.049 |
| H3 | <--- | UV6 | 1.200 | 0.370 | 3.242 | 0.001 |
| Adaptation Index | Numerical Value | Standard |
|---|---|---|
| Chi-square/df | 2.346 | [1,3] |
| Goodness-of-fit indexGFI) | 0.906 | >0.9 |
| Adjusted goodness-of-fit index (AGFI) | 0.912 | >0.9 |
| Root mean square error of approximation (RMSEA) | 0.064 | <0.08 |
| The Relation | Choice of Bus Travel Route | Choice of Bus Travel Time | Adjustment of Bus Travel Route | Choice of Bus Travel Mode |
|---|---|---|---|---|
| Annual household income | −0.07200 | −0.07056 | −0.09432 | −0.07848 |
| The Relation | Choice of Bus Travel Route | Choice of Bus Travel Time | Adjustment of Bus Travel Route | Choice of Bus Travel Mode |
|---|---|---|---|---|
| Bus route and transfer information | 0.152064(III) | 0.149023(IV) | 0.199204(I) | 0.165750(II) |
| Time information to reach the destination | 0.121968(V) | 0.119529(V) | 0.159778(III) | 0.132945(IV) |
| Distance information from the departure point or destination to the bus stop | 0.156816(III) | 0.153680(III) | 0.205429(I) | 0.170930(II) |
| Time information for the starting point or destination to walk to the bus stop | 0.158400(III) | 0.155232(III) | 0.207504(I) | 0.172656(II) |
| The Relation | Choice of Bus Travel Route | Choice of Bus Travel Time | Adjustment of Bus Travel Route | Choice of Bus Travel Mode |
|---|---|---|---|---|
| Next stop arrival time information on the bus | 0.10800(III) | 0.10584(III) | 0.14148(I) | 0.11772(II) |
| Next bus congestion status information | 0.07920(V) | 0.07603(V) | 0.10375(III) | 0.08633(IV) |
| Next seat free seat information | 0.07920(V) | 0.07603(V) | 0.10375(III) | 0.08633(IV) |
| Bus route and site information on the stop sign | 0.07920(V) | 0.07603(V) | 0.10375(III) | 0.08633(IV) |
| The Relation | Choice of Bus Travel Route | Choice of Bus Travel Time | Adjustment of Bus Travel Route | Choice of Bus Travel Mode |
|---|---|---|---|---|
| Convenience of taking the bus to the city | 0.1800 | 0.1728 | 0.2358 | 0.1962 |
© 2019 by the authors. Licensee MDPI, Basel, Switzerland. This article is an open access article distributed under the terms and conditions of the Creative Commons Attribution (CC BY) license (http://creativecommons.org/licenses/by/4.0/).
Share and Cite
Zhou, X.; Liang, J.; Ji, X.; Cottrill, C.D. The Influence of Information Services on Public Transport Behavior of Urban and Rural Residents. Sustainability 2019, 11, 5454. https://doi.org/10.3390/su11195454
Zhou X, Liang J, Ji X, Cottrill CD. The Influence of Information Services on Public Transport Behavior of Urban and Rural Residents. Sustainability. 2019; 11(19):5454. https://doi.org/10.3390/su11195454
Chicago/Turabian StyleZhou, Xuemei, Jiahui Liang, Xiangfeng Ji, and Caitlin D. Cottrill. 2019. "The Influence of Information Services on Public Transport Behavior of Urban and Rural Residents" Sustainability 11, no. 19: 5454. https://doi.org/10.3390/su11195454
APA StyleZhou, X., Liang, J., Ji, X., & Cottrill, C. D. (2019). The Influence of Information Services on Public Transport Behavior of Urban and Rural Residents. Sustainability, 11(19), 5454. https://doi.org/10.3390/su11195454