Abstract
Pendent pedestrian path is a new structure form in long-span city bridges to satisfy vehicle passing demand and pedestrian passing demand simultaneously. For such design form, besides the traditional comfort problem caused by pedestrians, the vibration induced by upper passing vehicles and oncoming turbulent wind also cannot be ignored. In this research, the vibration characteristics of the pendent pedestrian path induced by pedestrians, upper vehicles, and turbulent wind are all investigated based on a designed long-span extradosed bridge. The results show that the design of the pedestrian path could satisfy the comfort demands comprehensively regardless of the local magnification effects of pedestrian path vibration. Reducing the spacing of the supported beam is meaningful for suppressing the local vibration effects. The road roughness of the upper pavement has significant effects on the maximum acceleration of pedestrian paths while the influence of the vehicle speed is relatively limited. An approximate quadratic relationship is observed between the buffeting-induced acceleration and the oncoming wind speed. Thus, the pedestrian path should be closed during strong winds.
1. Introduction
For the highway bridge crossing a river in the city, besides vehicle traffic, the pedestrian pass is also an important part in its whole life cycle. The most common design for integrating these two functions is presented in Figure 1a, where the pedestrian path is located on the edge of the top flange. However, this design is quite uneconomical when the required width of the pedestrian path is large to some extent since the value of pedestrian load is usually far less than that of the vehicle load. The design idea presented in Figure 1b,c could be adopted for this condition, where the pedestrian path is connected to the web or bottom flange, and the path size is only determined by pedestrian loads for saving construction materials as much as possible. However, the flexible design of the pedestrian path may cause serious local vibration, and the pedestrians will feel uncomfortable when passing from the structure. In general, the vibration can be induced by the pedestrians, the upper vehicles and the oncoming turbulent wind.
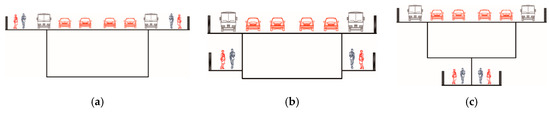
Figure 1.
Three different types for vehicle-pedestrian integrated designs. (a) the pedestrian path is located on the edge of the top flange, (b) the pedestrian path is connected to the web, (c) the pedestrian path is connected under the girder.
Pedestrian-induced vibration has been widely studied since the reported comfort problem of London’s Millennium in 2000 [1,2]. Predicting the dynamic response of footbridges under crowd loads has, therefore, become a critical part in structural design. The basis of predicting structure response is to establish pedestrian loads properly. Many researchers, such as Harper [3], Galbraith [4], Kasperski [5], Racic [6], and Chen [7], had proposed different models to describe the walking characteristics based on experimental results. These single-person models could be extended to crowd loads by equivalent theory [8] or probability-based methods [9], and the comfort to users could be evaluated according to different standards [8,10]. Recently, vibration analysis of some relatively long and slender footbridges was carried out worldwide. Caetano et al. [11,12] evaluated the comfort of the Pedro e Inês footbridge constructed in Coimbra and discussed the implementation of tuned mass dampers through more than one year of continuous dynamic monitoring. Bullo et al. [13] analyzed the vibration characteristics of a footbridge over the Adige in Legnago under single pedestrian and pedestrian group’s traffic and evaluated the serviceability behavior by calculating the worst conditions. Lai et al. [14] presented the experimental and numerical vibration serviceability assessment of a slender steel suspension footbridge according to the HiVoSS (Human-induced vibration of steel structures) guideline; the numerical results are in good agreement with experimental outcomes. The analysis procedure of above engineering projects contributes a good reference to human-induced vibration of the pendent pedestrian path.
Besides human-induced vibration, vehicle-induced vibration may also lead to serious comfort problem in the pendent pedestrian path. The structural vibration caused by moving vehicles could be well -imulated through the vehicle-bridge-interaction (VBI) method. Zhong et al. [15] simulated the dynamic responses of a prestressed bridge caused by driving vehicles using VBI analysis and the results showed that prestress has a significant effect on the maximum vertical acceleration of vehicles. Li et al. [16] investigated the dynamic property of a specially shaped hybrid girder bridge with concrete-filled steel tube arches under moving vehicles and indicated that the impact factor formula from the design standards significantly underestimates the dynamic impact effect. Yin et al. [17] evaluated the dynamic responses of bridges induced by vehicles moving on the poor road surface and proposed practical suppression methods by using pounding tuned mass dampers. Wang et al. [18] evaluated the comfort of driving vehicles through VBI analysis and obtained the relationship between acceleration values and vehicle speed and vehicle weight. The previous research provides a common process for obtaining the dynamic response of bridge structures induced by vehicles and evaluating the pedestrian comfort according to the classes defined in human-induced vibration analysis.
The wind-induced bridge vibration could be divided into four fundamental categories named flutter, galloping, buffeting, and vortex resonance, respectively [19]. Generally, flutter, galloping, and vortex resonance all could be avoided or suppressed by proper aerodynamic measures, while buffeting caused by turbulent wind is inevitable to some degree. Cheynet et al. [20] studied the buffeting response of a long-span suspension bridge in a complex terrain based on full-scale data from sonic anemometers and accelerometers. Kavrakov et al. [21] compared the buffeting response of a multi-span cable-stayed bridge calculated by different buffeting forces and proposed an accurate method for the inclusion of the aerodynamic admittance in the complex mode-by-mode model. Wang et al. [22] presented a comparative study on the buffeting performance of the Sutong Bridge between the design and measured spectrum, and the results showed that the girder responses from the design spectrum are larger in the horizontal direction and smaller in other direction. For these previous studies, the main concern of the buffeting is the potential influence on the structural strength and stiffness, while for the pendent pedestrian path, the comfort to users caused by buffeting also needed to be considered and discussed.
Through this research, it was expected that the possible vibration problems of pendent pedestrian path induced by pedestrians, upper vehicles, and turbulent wind could be thoroughly analyzed through a long-span extradosed bridge. In this study, the human-induced vibration is studied based on the definition of EN03 [8], the vehicle-induced vibration is studied by VBI theory, and the buffeting-induced vibration is studied by the turbulent wind simulation method.
2. Engineering Background and Finite Element Model
The research is carried out based on a (64 m + 86 m + 400 m + 86 m + 64 m) extradosed bridge, the total width of the main girder is 29.0 m with a bi-directional and six-lane design. The required width of the pedestrian path is 10.0 m according to the population size of the city; thus the design type in Figure 1b,c are adopted in this project. Figure 2 plots the elevation design of the whole structure, and Figure 3 plots two different connection forms of the pedestrian paths designed in this project.
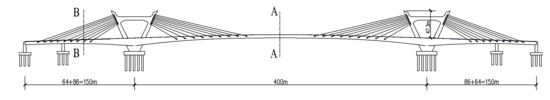
Figure 2.
Elevation design of whole structure.
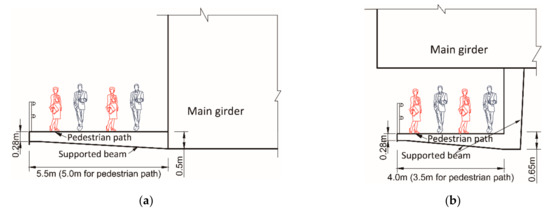
Figure 3.
Two different connection forms of the pedestrian path. (a) Section A-A; (b) Section B-B.
The whole bridge structure is modeled in the ANSYS software, as shown in Figure 4. In the finite element model, the main girder and pylons are modeled by the BEAM element, the cables are modeled by the LINK element, and the pedestrian pavement is modeled by the SHELL element to obtain more accurate local vibration results. The piers are replaced by relative boundary conditions in the model. Figure 5 plots some details of the finite element model.
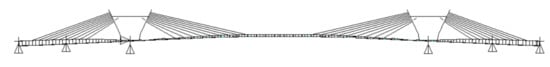
Figure 4.
Finite element model and boundary conditions.
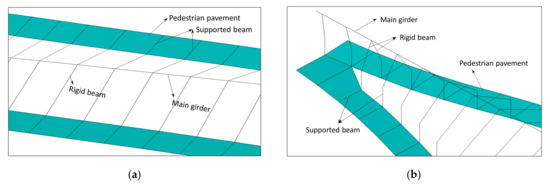
Figure 5.
Finite element model details. (a) Middle span; (b) Side span.
3. Vibration Caused by Pedestrians
3.1. Human-Induced Loads
Walking loads have been studied thoroughly in the past and different models have been developed. Generally, the walking loads induced by a single pedestrian could be described as a form of Fourier series [23]:
where is the time-dependent load of a single pedestrian; is the static weight; is the order number of harmonic; is the total number of harmonics; is the dynamic load factor; is the step frequency, and is the phase shift.
In Germany Code EN03 [8], only the first two orders in the vertical and longitudinal direction and the first order in the lateral direction are considered, then, the dynamic walking loads caused by the crowd are simplified as follows:
where is the time-dependent dynamic load of the crowd (per square meter); the average weight is determined to be ; the values of in different directions are: in the vertical direction, in the longitudinal direction, and in the lateral direction. is the equivalent number of pedestrians per square meter which could be calculated by Equation (3); is the reduction coefficient defined in Figure 6.
where is the total number of pedestrians on the loaded surface ; is the damping ratio; is the pedestrian density.
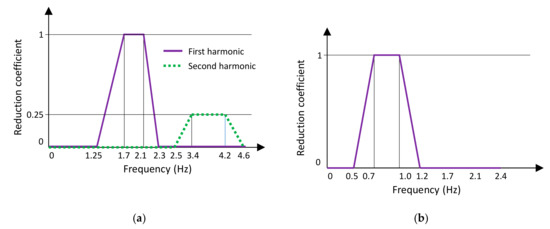
Figure 6.
Definition of reduction coefficient (a) Vertical and longitudinal direction; (b) Lateral direction.
According to the definition in EN03, the most unfavorable crowd load is , the equivalent number of pedestrians with a stationary walking frequency equals to the natural frequency of structures and could be calculated by Equation (3) and then the dynamic loads on the pavement surface could be determined by Equation (2). In this condition, the static weights of the crowd must be considered as the form of MASS element because of their contribution to modal characteristics.
The predominant frequency (1.25 Hz–2.3 Hz for vertical and longitudinal vibration, 0.5 Hz–1.2 Hz for lateral vibration) of bridge structure considering the influence of pedestrian mass is calculated and summarized in Figure 7. These four modes are named as LV, TV, VV_1, and VV_2, respectively. As can be seen, in higher-order vertical modes, the local vibration of the pedestrian path seems quite obvious.
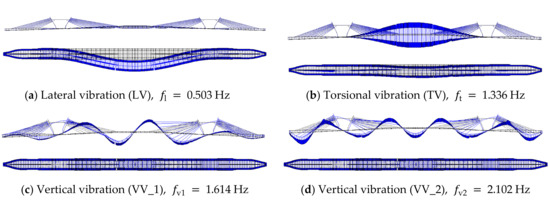
Figure 7.
Predominant frequency of the bridge structure considering the influence of pedestrian mass.
3.2. Analysis Results
According to the finite element model established in Section 2 and the basic theory described in Section 3.1, the time-dependent accelerations for each predominant frequency could be calculated, and results of LV and VV_1 are displayed in Figure 8 as an example. As could be seen, the maximum acceleration of the pedestrian path for VV_1 is much larger than that of the main girder, which indicates that the local vertical vibration of the pedestrian path should be noticed and further recognized.
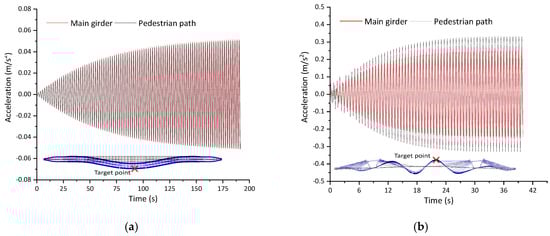
Figure 8.
Time-dependent acceleration results of the main girder and the pedestrian path. (a) LV; (b) VV_1.
The local vertical stiffness of pedestrian path can be improved by reducing the spacing of supported beam in Figure 5, Figure 9 plots the maximum acceleration results of different modes with different spacing of the supported beam (the original design is 4.0 m), where the target points are the position of the recorded maximum accelerations regarding different spacing of the supported beam. It is observed that reducing the spacing of the supported beam has considerable contribution to control the vertical vibration of the pedestrian path, especially for that of VV_2, where the local vibration in the side span is quite obvious. However, the spacing of the supported beam has limited influence to the maximum acceleration of TV. According to the definition in EN03, the comfort to users could be regarded as ‘Maximum’ if the maximum acceleration is less than 0.50 m/s2 (Table 1). Hence, the original spacing of the supported beam is optimal for human-induced vibration comfort.
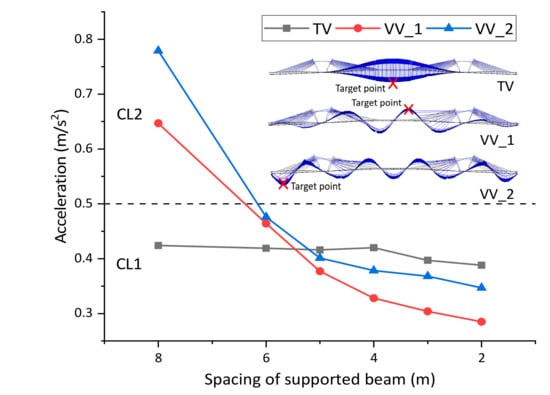
Figure 9.
Maximum acceleration results of different modes varied with the spacing of the supported beam.

Table 1.
Defined comfort classes in EN03.
4. Vibration Caused by Upper Vehicles
4.1. Vehicle Model
The pedestrian path vibration caused by upper driving vehicles is simulated by the VBI theory. The whole-vehicle-model-based VBI theory is detailed in [24]. Here, a typical three-axle vehicle model is adopted to clarify its influence on pedestrian path vibration. The vehicle model is presented in Figure 10, and relative parameters are defined in Table 2. In Figure 10, are the vertical displacement, pitching angle, and rolling angle of the vehicle body; is the vertical displacement of the wheel
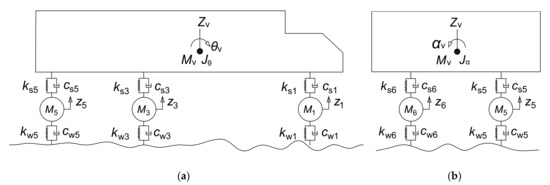
Figure 10.
Diagram of a three-axle vehicle model. (a) Length direction; (b) Width direction.
Table 2.
Parameters of vehicles [25].
4.2. Road Roughness
The road roughness, which indicates the deviation degree of road surface from the reference plane, should be considered in VBI analysis. The road roughness can be assumed as an ergodic Gaussian random process with zero mean value, and its power spectral density function can be defined as:
where is the power spectral density function of road roughness; is the exponential term; is the spatial frequency, and are the lower limit, and upper limit of ; is the coefficient term which settles the level of road roughness as presented in Table 3.
Table 3.
Definition of coefficient term [26].
The longitudinal distribution of road roughness could be obtained by solving Equation (4), and results are presented in Equations (5)–(7):
where is a random phase angle; is the location along the bridge; and is the number of trigonometric series.
Thus, the road roughness of this bridge is simulated in MATLAB and the results are displayed in Figure 11 with different levels. The simulated values will be introduced to VBI-based acceleration analysis.
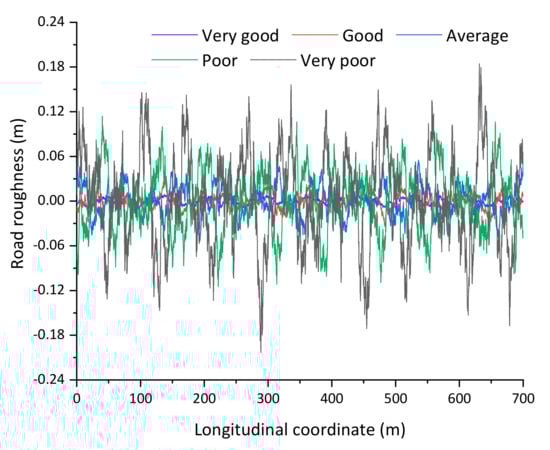
Figure 11.
Simulation results of road roughness.
4.3. Analysis Results
The vehicle-induced vibration is substantially controlled by the traffic density and vehicle types, which can be simulated by random traffic flow (RTF) theory. The vibration characteristics under the RTF are further discussed in Section 6. Here a simple traffic model is adopted to analyze the vibration condition caused by upper vehicles. The traffic model is composed of six three-axle vehicles driving at six different lanes, as presented in Figure 12. Noting that some possibly worse conditions, e.g., three vehicles running in a single direction with the remaining three lanes empty, can be obtained theoretically. Thus, the defined model is mainly adopted for clarifying the relationship between vehicle-induced vibration characteristics and some key parameters instead of judging the comfort level under the most favorable conditions. Based on this traffic model, the influence of vehicle speed and road roughness on the vibration characteristics is analyzed. Figure 13 plots the simulated time-dependent acceleration laws, where the vehicle speed is 60 km/h (same as the design speed of bridge), and the road roughness is ‘Good’. The points A, B, and C are defined in Figure 12. It is observed that the vibration in the middle span is far larger than that of the side span, which is quite different from the vibration characteristics caused by pedestrians, especially for the results of VV_2 presented in Figure 9, where the local vibration in side span is much significant.
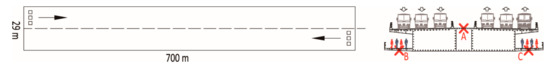
Figure 12.
Traffic model adopted in vehicle-induced vibration analysis.
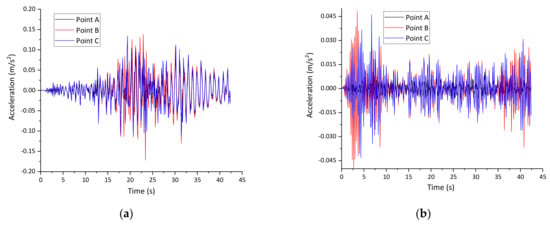
Figure 13.
Time-dependent acceleration when vehicle speed is 60 km/h and the road roughness is ‘Good’. (a) Middle span; (b) Side span.
Figure 14 displays the maximum acceleration under different values of vehicle speed and road roughness. In Figure 14a, the road roughness is fixed as ‘Average’ and in Figure 14b, the vehicle speed is fixed as 60 km/h. It is observed that the vehicle speed has limited effects on the maximum acceleration of the main girder and the pedestrian path. Besides, the variation laws between the maximum acceleration and vehicle speed are irregular. Figure 14b indicates that the maximum acceleration amplifies significantly with the increase in the road roughness. Thus, an effective maintenance strategy of the bridge deck pavement is certainly important for ensuring the comfort of pedestrians. Again, the local vibration in the pedestrian path is larger than that of the main girder because of the insufficiency of the local stiffness.
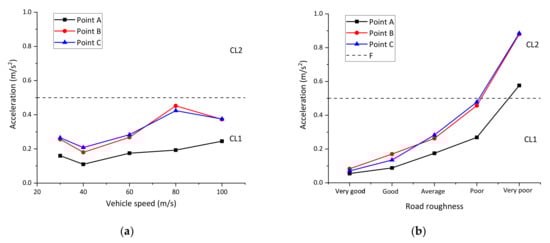
Figure 14.
Maximum accelerations caused by upper vehicles. (a) acceleration VS vehicle speed; (b) acceleration VS road roughness.
5. Vibration Caused by Turbulent Wind
5.1. Turbulent Wind and Aerodynamic Force
The time-dependent turbulent wind can be simulated according to the power spectrum theory if no credible data could be observed. Here the Simiu Spectrum [27] is adopted for simulating the lateral turbulent wind and the Panofsky Spectrum [28] is adopted for simulating vertical turbulent wind. Figure 15 displays the simulation results of turbulent wind in the middle span under the basic wind speed of 31.3 m/s.
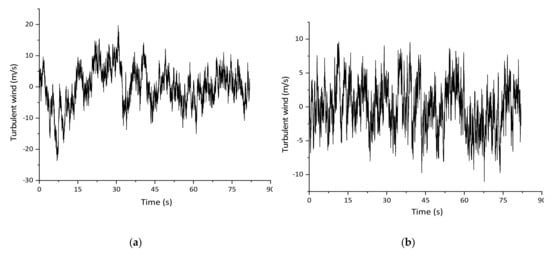
Figure 15.
Simulation results of turbulent wind in the middle span. (a) Lateral direction; (b) Vertical direction.
The influence of turbulent wind is added to the structure by the form of aerodynamic force. Based on the quasi-steady theory, the aerodynamic forces per unit span in the global axes are expressed as:
where and are the drag force, lift force and pitching moment; is the air density; is the girder height; is the girder width; is the mean wind velocity; and are the lateral and vertical turbulent wind; and are drag force, lift force and pitching moment coefficients under attack angle ; and are the derivates of and .
and can be obtained by computational fluid dynamics (CFD) analysis in FLUENT. Here only the CFD model of the middle span section and a typical velocity contour are plotted in Figure 16 since the detailed CFD simulation process is not the main concern in this research. The simulation results of the above coefficients are detailed in Figure 17 and Table 4, where are determined by the maximum value of and are determined by the derivates when approximately.
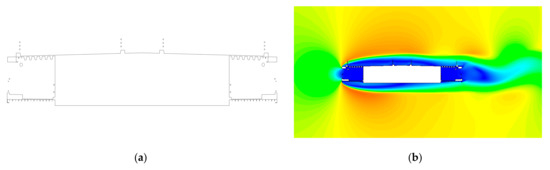
Figure 16.
Diagram of the CFD model in the middle span and the velocity contour when (a) CFD model; (b) Velocity contour.
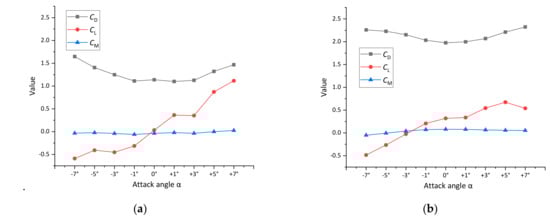
Figure 17.
Simulated aerodynamic force coefficients with different attack angles. (a) Middle span; (b) Side span.
Table 4.
Simulation results of relative coefficients in FLUENT.
5.2. Analysis Results
On the basis of the defined aerodynamic force and the finite element model, the turbulent wind-induced vibration can be simulated by transient analysis in ANSYS. The time-dependent acceleration laws of the pedestrian path in the middle span are presented in Figure 18, where the wind speed is 5 m/s at the height of 10m. Figure 19 displays the maximum acceleration under different wind speed. It is observed that the maximum acceleration increases with the growth of wind speed, and their relationship can be regarded as a quadratic equation approximately. The maximum acceleration of the pedestrian path is much larger than that of the main girder in the vertical direction, while they are almost identical in the lateral direction. Following the comfort definition in Table 1, it can be judged that the comfort to users is ‘Maximum’ when the wind speed less than 10 m/s (five-level wind and below), and the comfort will be ‘Unacceptable’ if the wind speed is larger than 17.5 m/s (eight-level wind and above). Thus, the pedestrian path should be closed during strong winds.
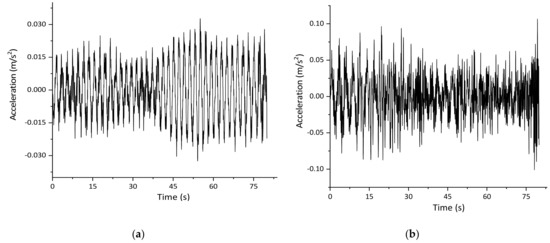
Figure 18.
Time-dependent acceleration of pedestrian path with the wind speed of 5 m/s. (a) Lateral direction; (b) Vertical direction.
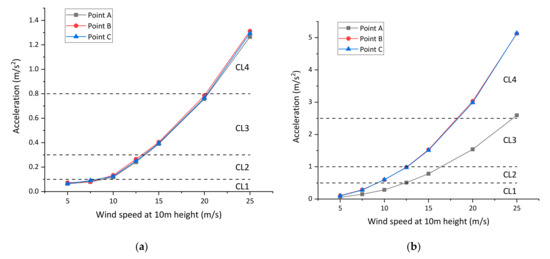
Figure 19.
Maximum acceleration of the pedestrian path under different wind speed. (a) Lateral direction; (b) Vertical direction.
6. Joint Effects Analysis
The vibrations of pendent pedestrian path caused by pedestrians, upper vehicles, and turbulent wind are simulated and analyzed separately in Section 3, Section 4 and Section 5; these three simulations are all calculated under extremely unfavorable conditions. However, the pedestrian loads, the traffic loads, as well as the wind loads usually exist simultaneously in a real bridge. Thus, their joint effects must be considered to make sure the comfort level can meet the design demands in general. In the analysis of the joints effects, these three loads should be limited in the normal service conditions instead of the extremely unfavorable conditions discussed in Section 3, Section 4 and Section 5.
In EN03, a total of five pedestrian load conditions are defined which named as ‘Very weak traffic’, ‘Weak traffic’, ‘Dense traffic’, ‘Very dense traffic’ and ‘Exceptionally dense traffic’. In Section 3, the ‘Exceptionally dense traffic’ is analyzed to verify the comfort level under the most unfavourable condition. Here to consider the joint effects, the pedestrian density is defined to be , which is described as ‘Dense traffic’ in EN03.
The vehicle load is simulated as an RTF which consists of three typical vehicle types: 1.5 tons car, 15 tons truck, and 50 tons trailer. The proportion of these three vehicle types is 1.5 tons car: 15 tons truck: 50 tons trailer = 0.65:0.15:0.20. A more detailed description of the RTF can be found in our previous research [29].
The daily average wind speed is adopted to reflect the wind characteristics in joint effects analysis. The value of daily average wind speed can be defined according to the recorded data in 2015 by wind speed station. The distribution laws of daily average wind speed can be well fitted by Generalized Extreme Value distribution with a mean value of 1.7 m/s and a standard deviation of 0.6 m/s. As plotted in Figure 20, the daily average wind at 10 m height is determined to 3.2 m/s by adopting a 90% guaranteed rate.
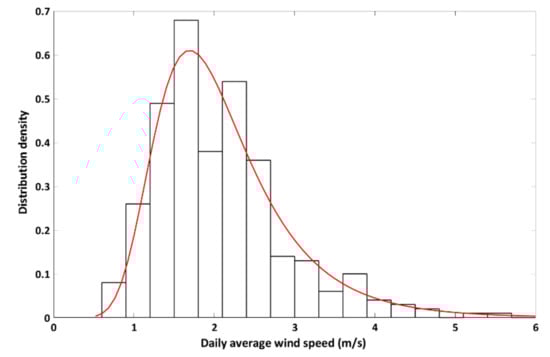
Figure 20.
Distribution laws of daily average wind speed in 2015.
Other relative calculation parameters are listed as follows:
- (1).
- The predominant frequency of bridge structure is determined to be ‘TV’ (the most unfavorable frequency) according to the simulation results in Figure 9 under the condition of 4.0 m (original design);
- (2).
- The road roughness is defined to be ‘Average’, since additional maintenance measures must be carried out when the road condition is below that level;
- (3).
- Only the vertical vibration is calculated here, considering the traffic loads have limited influence to lateral vibration.
Hence, the joint effects are analyzed considering pedestrian loads, traffic loads and wind loads simultaneously, and the maximum time-dependent acceleration is plotted in Figure 21. It can be observed that the maximum acceleration of the pedestrian path under the defined joint effects is 0.37 m/s2. The comfort to users is ‘Maximum’ according to the definition in Table 1, which indicates that the design of pendent pedestrian path can satisfy the comfort demands in general.
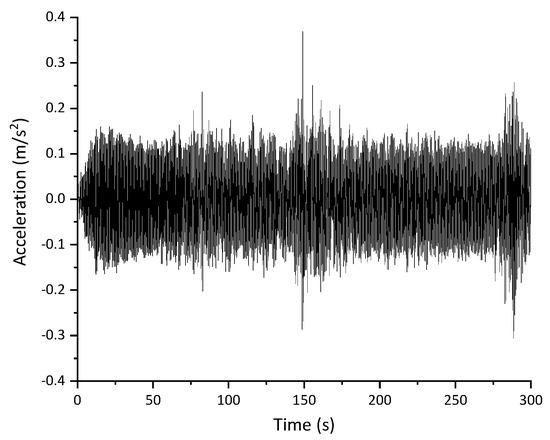
Figure 21.
Maximum time-dependent acceleration under defined joint loads.
7. Conclusions
In this research, the vibration characteristics of the pendent pedestrian path in a long-span extradosed bridge are investigated, and the following conclusions can be drawn:
- (1).
- The design of the pedestrian path can fit the comfort demand defined in EN03 even under the most unfavorable crowd conditions. However, it should be noticed that the maximum vertical acceleration of pedestrian path is much larger than that of the main girder, and reducing the spacing of supported beam has a considerable contribution to suppressing that local vibration.
- (2).
- The parametric study of vehicle-induced vibration under different values of vehicle speed and road roughness shows that the vehicle speed has limited effects on the maximum acceleration of main girder and pedestrian path, while the maximum acceleration amplifies significantly with the increase of road roughness. The results indicate that an effective maintenance strategy of bridge deck pavement is quite important for ensuring the comfort of pedestrians.
- (3).
- The maximum acceleration caused by turbulent wind increases with the growth of wind speed, and their relationship can be approximately regarded as a quadratic equation. The comfort to users is ‘Maximum’ when the wind speed at 10 m height less than 10 m/s, but the pedestrian will feel ‘Unacceptable’ if the wind speed at 10 m height exceeds 17.5 m/s, which indicates that the pedestrian path should be closed during strong winds.
- (4).
- The comfort to users is calculated to be ‘Maximum’ under the simulated joint effects, which indicates that the design of the pendent pedestrian path can satisfy the comfort demands in general.
Author Contributions
Conceptualization—R.M. and X.H.; Methodology—R.M. and C.C.; Software—C.C.; Formal analysis—C.C. and W.H.; Investigation—X.H.; Writing—original draft preparation—C.C.; Writing—review and editing—X.H.
Funding
This research is jointly supported by the National Natural Science Foundation of China (Contract No. 51878493 and No. 51678437).
Conflicts of Interest
The authors declare no conflict of interest.
References
- Dallard, P.; Fitzpatrick, A.J.; Flint, A.; Le Bourva, S.; Low, A.; Ridsdill Smith, R.M.; Willford, M. The London Millennium Footbridge. Struct. Eng. 2001, 79, 17–33. [Google Scholar]
- Dallard, P.; Fitzpatrick, T.; Flint, A.J.A.; Low, A.; Smith, R.R.; Willford, M.; Roche, M. London Millennium Bridge: Pedestrian-Induced Lateral Vibration. J. Bridge Eng. 2001, 6, 412–417. [Google Scholar] [CrossRef]
- Harper, F.C.; Warlow, W.J.; Clarke, B.L. The Forces Applied to the Floor by the Foot in Walking; HM Stationery Off: London, UK, 1961. [Google Scholar]
- Galbraith, F.W.; Barton, M.V. Ground loading from footsteps. J. Acoust. Soc. Am. 1970, 48, 1288–1292. [Google Scholar] [CrossRef]
- Sahnaci, C.; Kasperski, M. Random loads induced by walking. In Proceedings of the Sixth European Conference on Structural Dynamics, Urodyn, Paris, France, 4–7 September 2005; pp. 441–446. [Google Scholar]
- Racic, V.; Brownjohn, J.M.W. Stochastic model of near-periodic vertical loads due to humans walking. Adv. Eng. Inf. 2011, 25, 259–275. [Google Scholar] [CrossRef]
- Chen, J.; Peng, Y.X.; Wang, L. Experimental investigation and mathematical modeling of single footfall load using motion capture technology. China Civ. Eng. J. 2014, 47, 79–87. [Google Scholar]
- Design of Footbridges Guideline. Available online: http://www.stahlbau.stb.rwth-aachen.de/projekte/2007/HIVOSS/docs/Footbridge_Guidelines_EN03.pdf (accessed on 22 August 2019).
- Ding, G.; Chen, J. Influences of walking load randomness on vibration responses of long-span floors. J. Vib. Eng. 2016, 29, 123–131. [Google Scholar]
- Ma, R.J.; Ke, L.; Wang, D.L.; Chen, A.; Pan, Z. Experimental study on pedestrians’ perception of human-induced vibrations of footbridges. Int. J. Struct. Stab. Dyn. 2018, 18, 1850116. [Google Scholar] [CrossRef]
- Elsa, C.; Alvaro, C.; Filipe, M.; Carlos, M. Studies for controlling human-induced vibration of the Pedro e Inês footbridge, Portugal. Part 1: Assessment of dynamic behaviour. Eng. Struct. 2010, 32, 1069–1081. [Google Scholar]
- Elsa, C.; Alvaro, C.; Filipe, M.; Carlos, M. Studies for controlling human-induced vibration of the Pedro e Inês footbridge, Portugal. Part 2: Implementation of tuned mass dampers. Eng. Struct. 2010, 32, 1082–1091. [Google Scholar]
- Bullo, S.; Di Marco, R. The footbridge over the river Adige at Legnago in Italy Part 2: The assessment of human-induced vibrations. Int. J. Space Struct. 2007, 22, 19–34. [Google Scholar] [CrossRef]
- Lai, E.; Gentile, C.; Mulas, M.G. Experimental and numerical serviceability assessment of a steel suspension footbridge. J. Constr. Steel Res. 2017, 132, 16–28. [Google Scholar] [CrossRef]
- Zhong, H.; Yang, M.; Gao, Z. Dynamic responses of prestressed bridge and vehicle through bridge–vehicle interaction analysis. Eng. Struct. 2015, 87, 116–125. [Google Scholar] [CrossRef]
- Li, Y.; Cai, C.S.; Liu, Y.; Chen, Y.J.; Liu, J.F. Dynamic analysis of a large span specially shaped hybrid girder bridge with concrete-filled steel tube arches. Eng. Struct. 2016, 106, 243–260. [Google Scholar] [CrossRef]
- Yin, X.F.; Liu, Y.; Song, G.; Mo, Y.L. Suppression of bridge vibration induced by moving vehicles using pounding tuned mass dampers. J. Bridge Eng. 2018, 23, 04018047. [Google Scholar] [CrossRef]
- Wang, G.C.; Li, W.S. Analysis on the vehicle ride comfort based on vehicle-bridge coupled vibration. J. Vib. Shock 2016, 35, 224–230. [Google Scholar]
- Chen, Z.Q.; Liu, G.D. Some recent progresses in bridge wind engineering research. Eng. Mech. 2006, 23, 93–111. [Google Scholar]
- Cheynet, E.; Jakobsen, J.B.; Jónas, S. Buffeting response of a suspension bridge in complex terrain. Eng. Struct. 2016, 128, 474–487. [Google Scholar] [CrossRef]
- Kavrakov, I.; Morgenthal, G. A Comparative assessment of aerodynamic models for buffeting and flutter of long-span bridges. Engineering 2017, 3, 823–838. [Google Scholar] [CrossRef]
- Wang, H.; Hu, R.; Xie, J.; Tong, T. Comparative study on buffeting performance of Sutong Bridge based on design and measured spectrum. J. Bridge Eng. 2013, 18, 587–600. [Google Scholar] [CrossRef]
- Racic, V.; Pavic, A.; Brownjohn, J.M.W. Experimental identification and analytical modelling of human walking forces: Literature review. J. Sound Vib. 2009, 326, 1–49. [Google Scholar] [CrossRef]
- Kim, C.W.; Kawatani, M.; Kim, K.B. Three-dimensional dynamic analysis for bridge-vehicle interaction with roadway roughness. Comput. Struct. 2005, 83, 1627–1645. [Google Scholar] [CrossRef]
- Li, X.N. Theoretical Research on Bridge Weigh-In-Motion System Based on Monitored Strain; Tongji University: Shanghai, China, 2014. [Google Scholar]
- Au, F.T.K.; Cheng, Y.S.; Cheung, Y.K. Effects of random road surface roughness and long-term deflection of prestressed concrete girder and cable-stayed bridges on impact due to moving vehicles. Comput. Struct. 2001, 79, 853–872. [Google Scholar] [CrossRef]
- Simiu, E. Wind spectra and dynamic along wind response. J. Struct. Div. ASCE 1974, 100, 1897–1910. [Google Scholar]
- Panofsky, H.A.; McCormick, R.A. The Spectrum of vertical velocity near the surface. Q. J. R. Meteorol. Soc. 1960, 86, 495–503. [Google Scholar] [CrossRef]
- Chuanjie, C.; Airong, C.; Rujin, M.; Wang, B.; Xu, S. Fatigue life estimation for suspenders of a three-pylon suspension bridge based on vehicle–bridge-interaction analysis. Materials 2019, 12, 2617. [Google Scholar]
© 2019 by the authors. Licensee MDPI, Basel, Switzerland. This article is an open access article distributed under the terms and conditions of the Creative Commons Attribution (CC BY) license (http://creativecommons.org/licenses/by/4.0/).