Vibration Analysis for Pendent Pedestrian Path of a Long-Span Extradosed Bridge


Abstract
1. Introduction
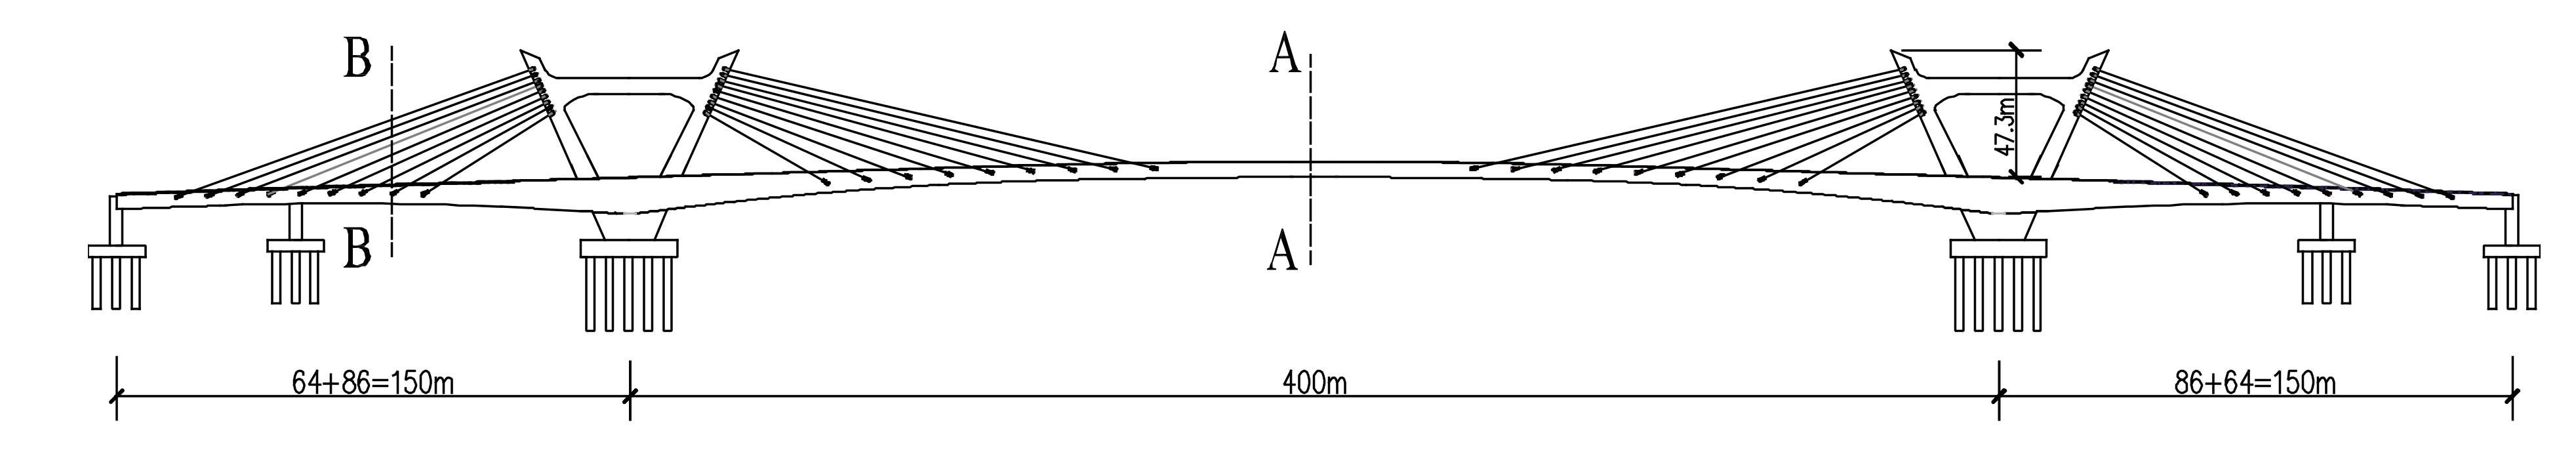
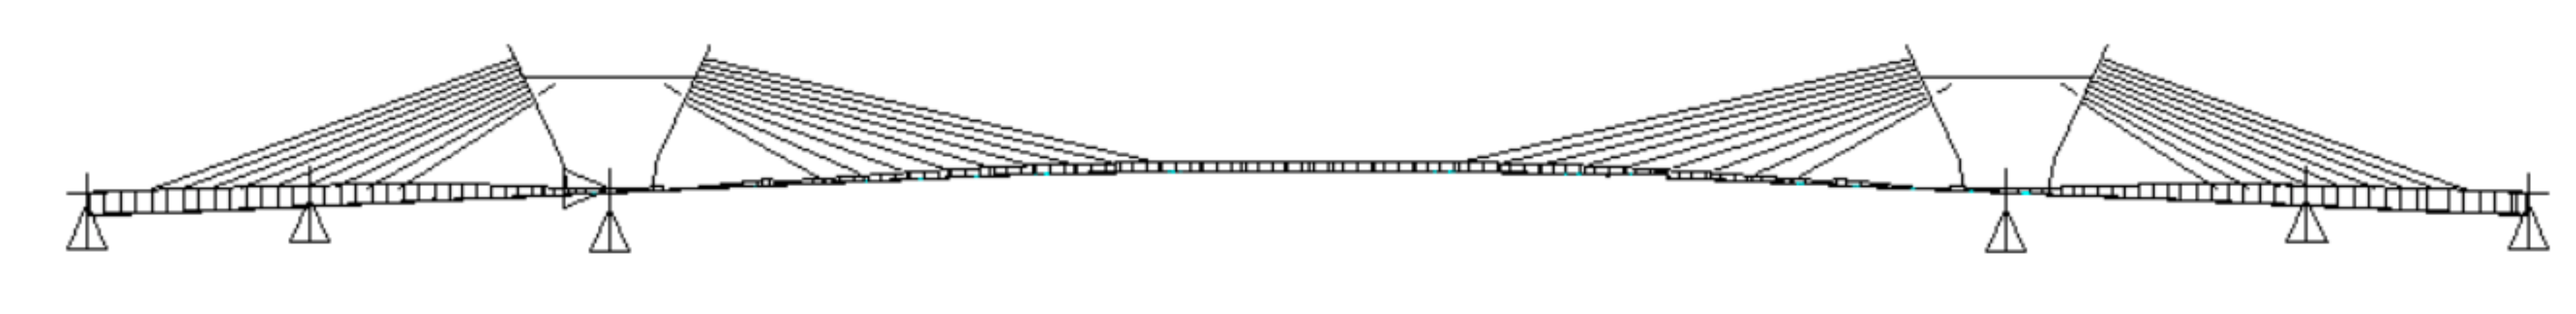
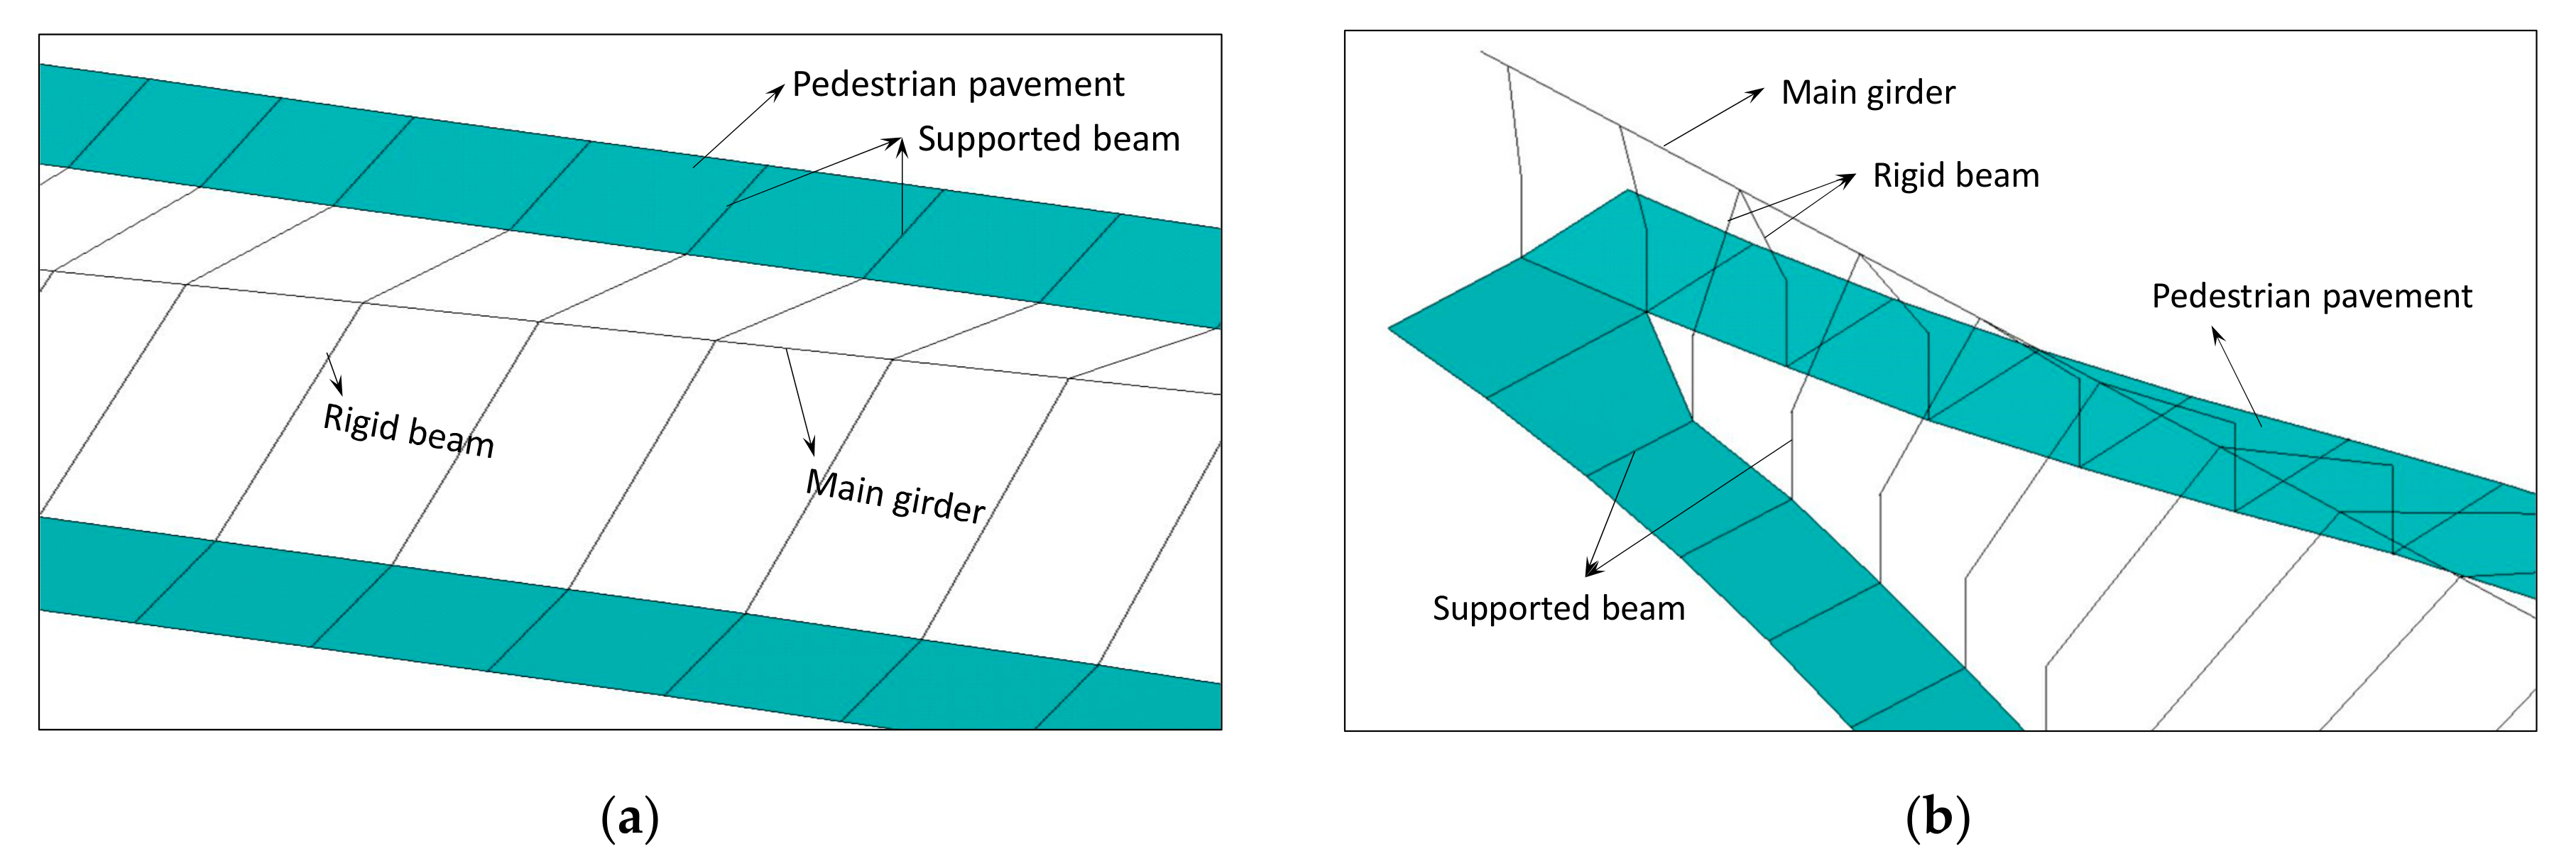
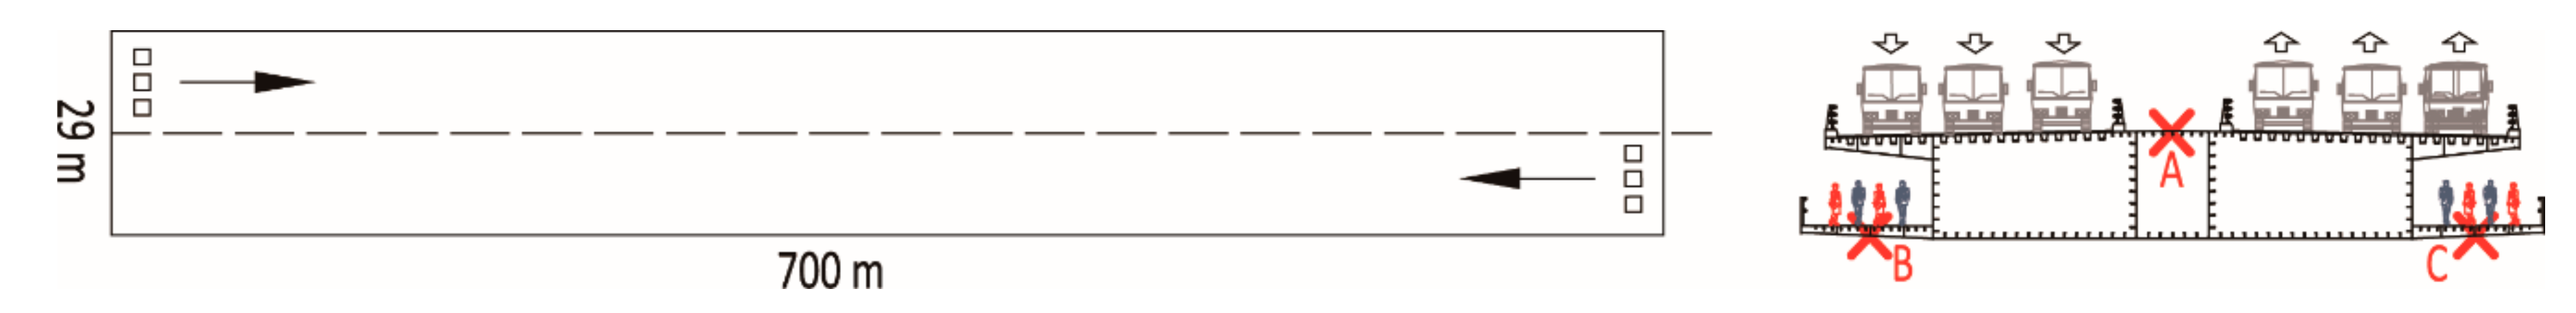
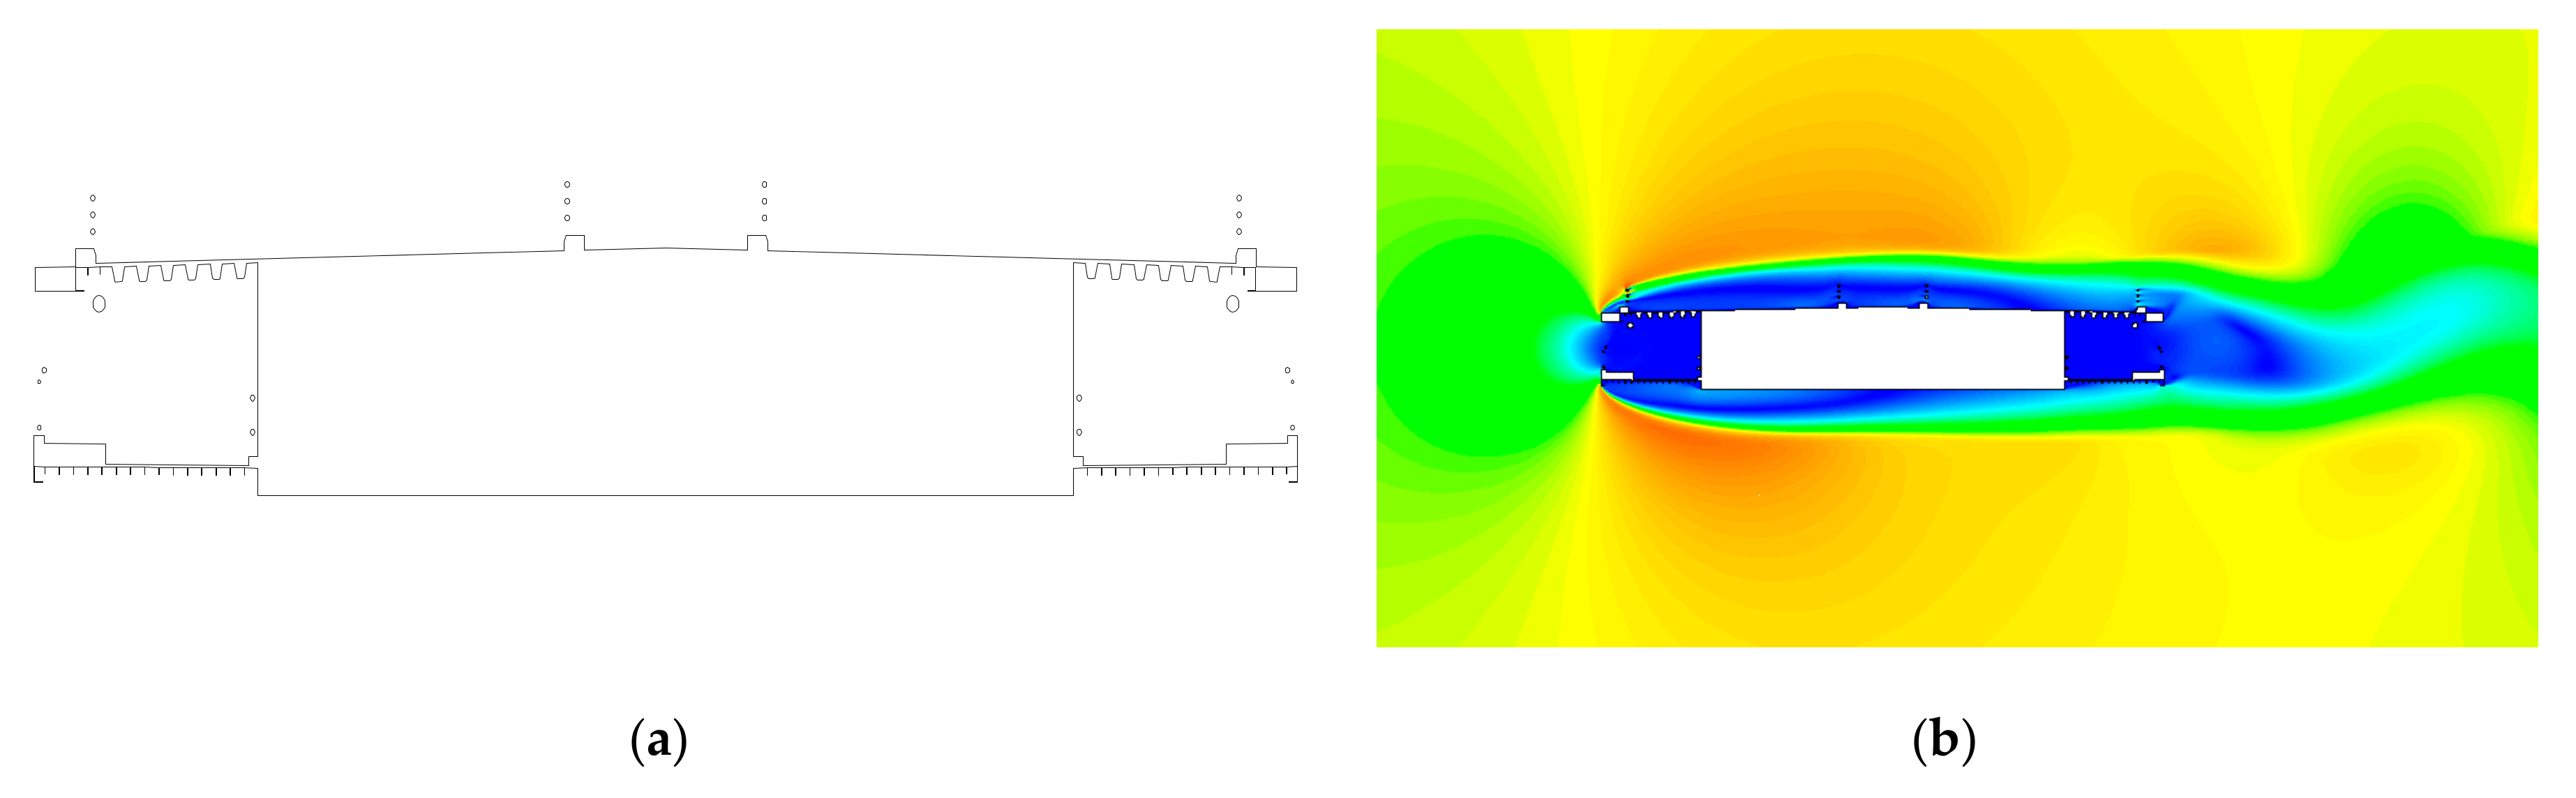
2. Engineering Background and Finite Element Model
3. Vibration Caused by Pedestrians
3.1. Human-Induced Loads
3.2. Analysis Results
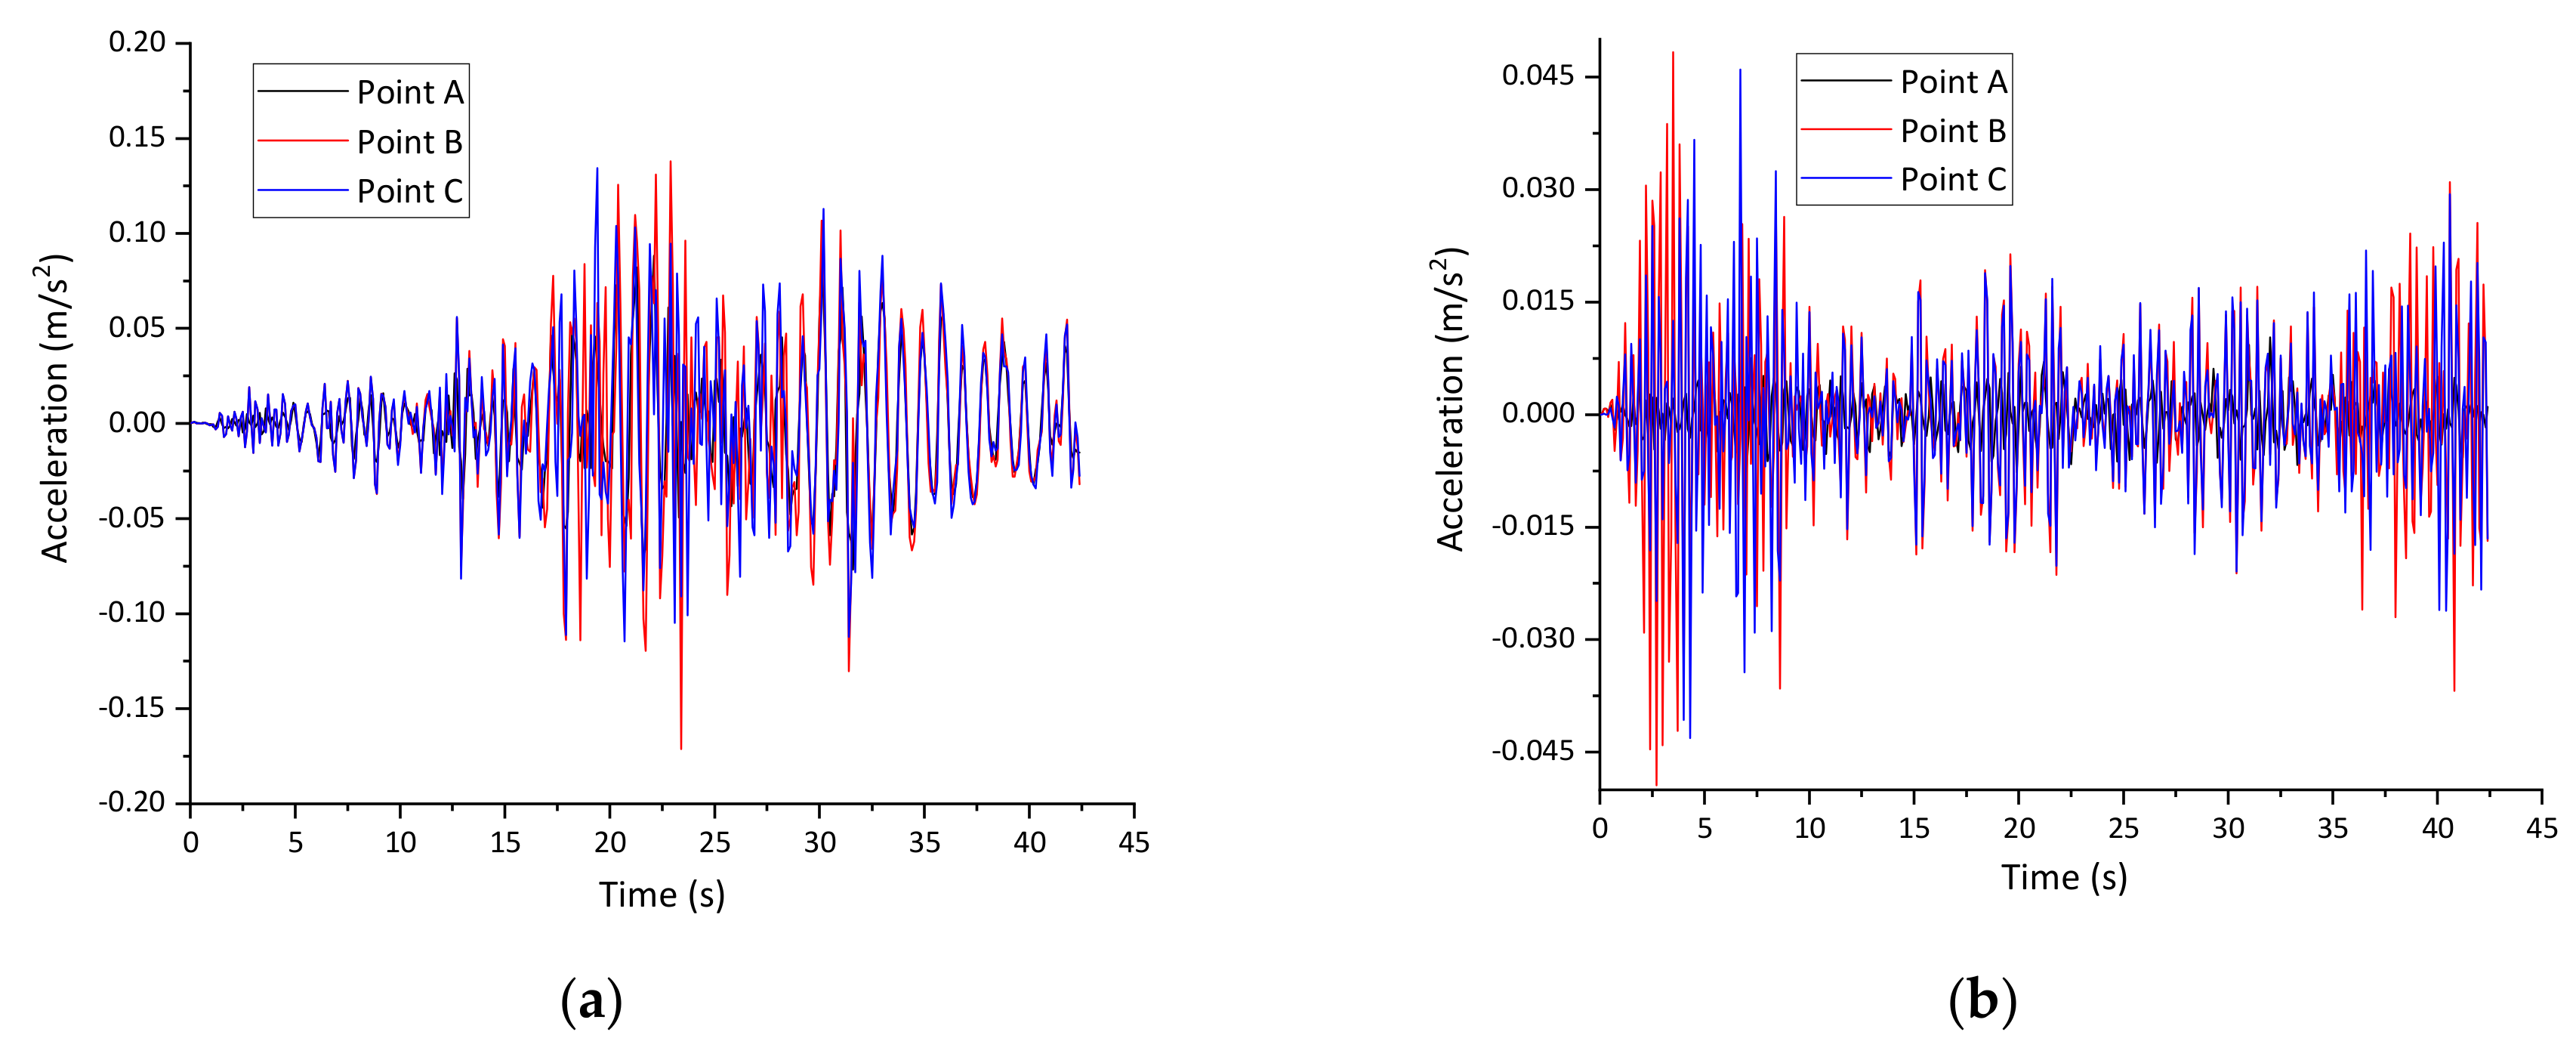
4. Vibration Caused by Upper Vehicles
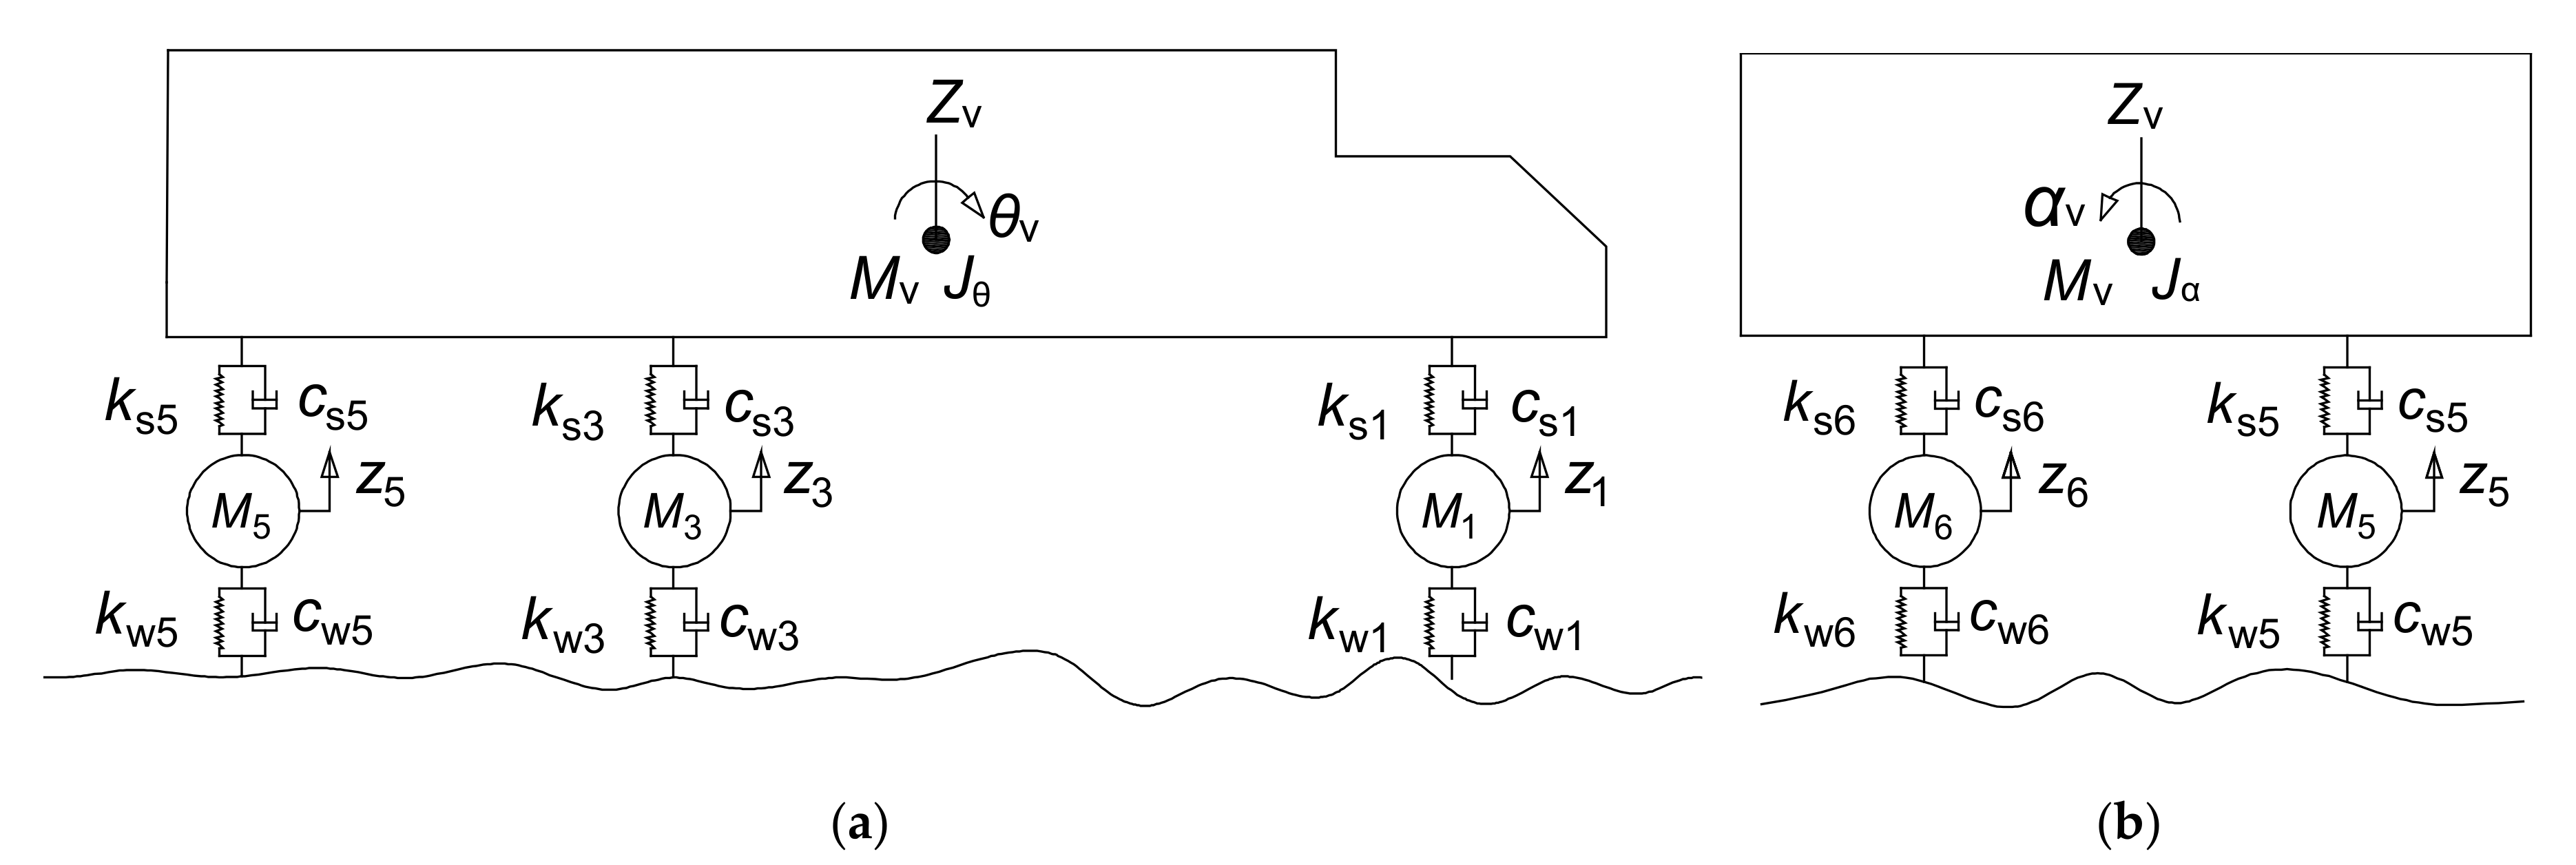
4.1. Vehicle Model
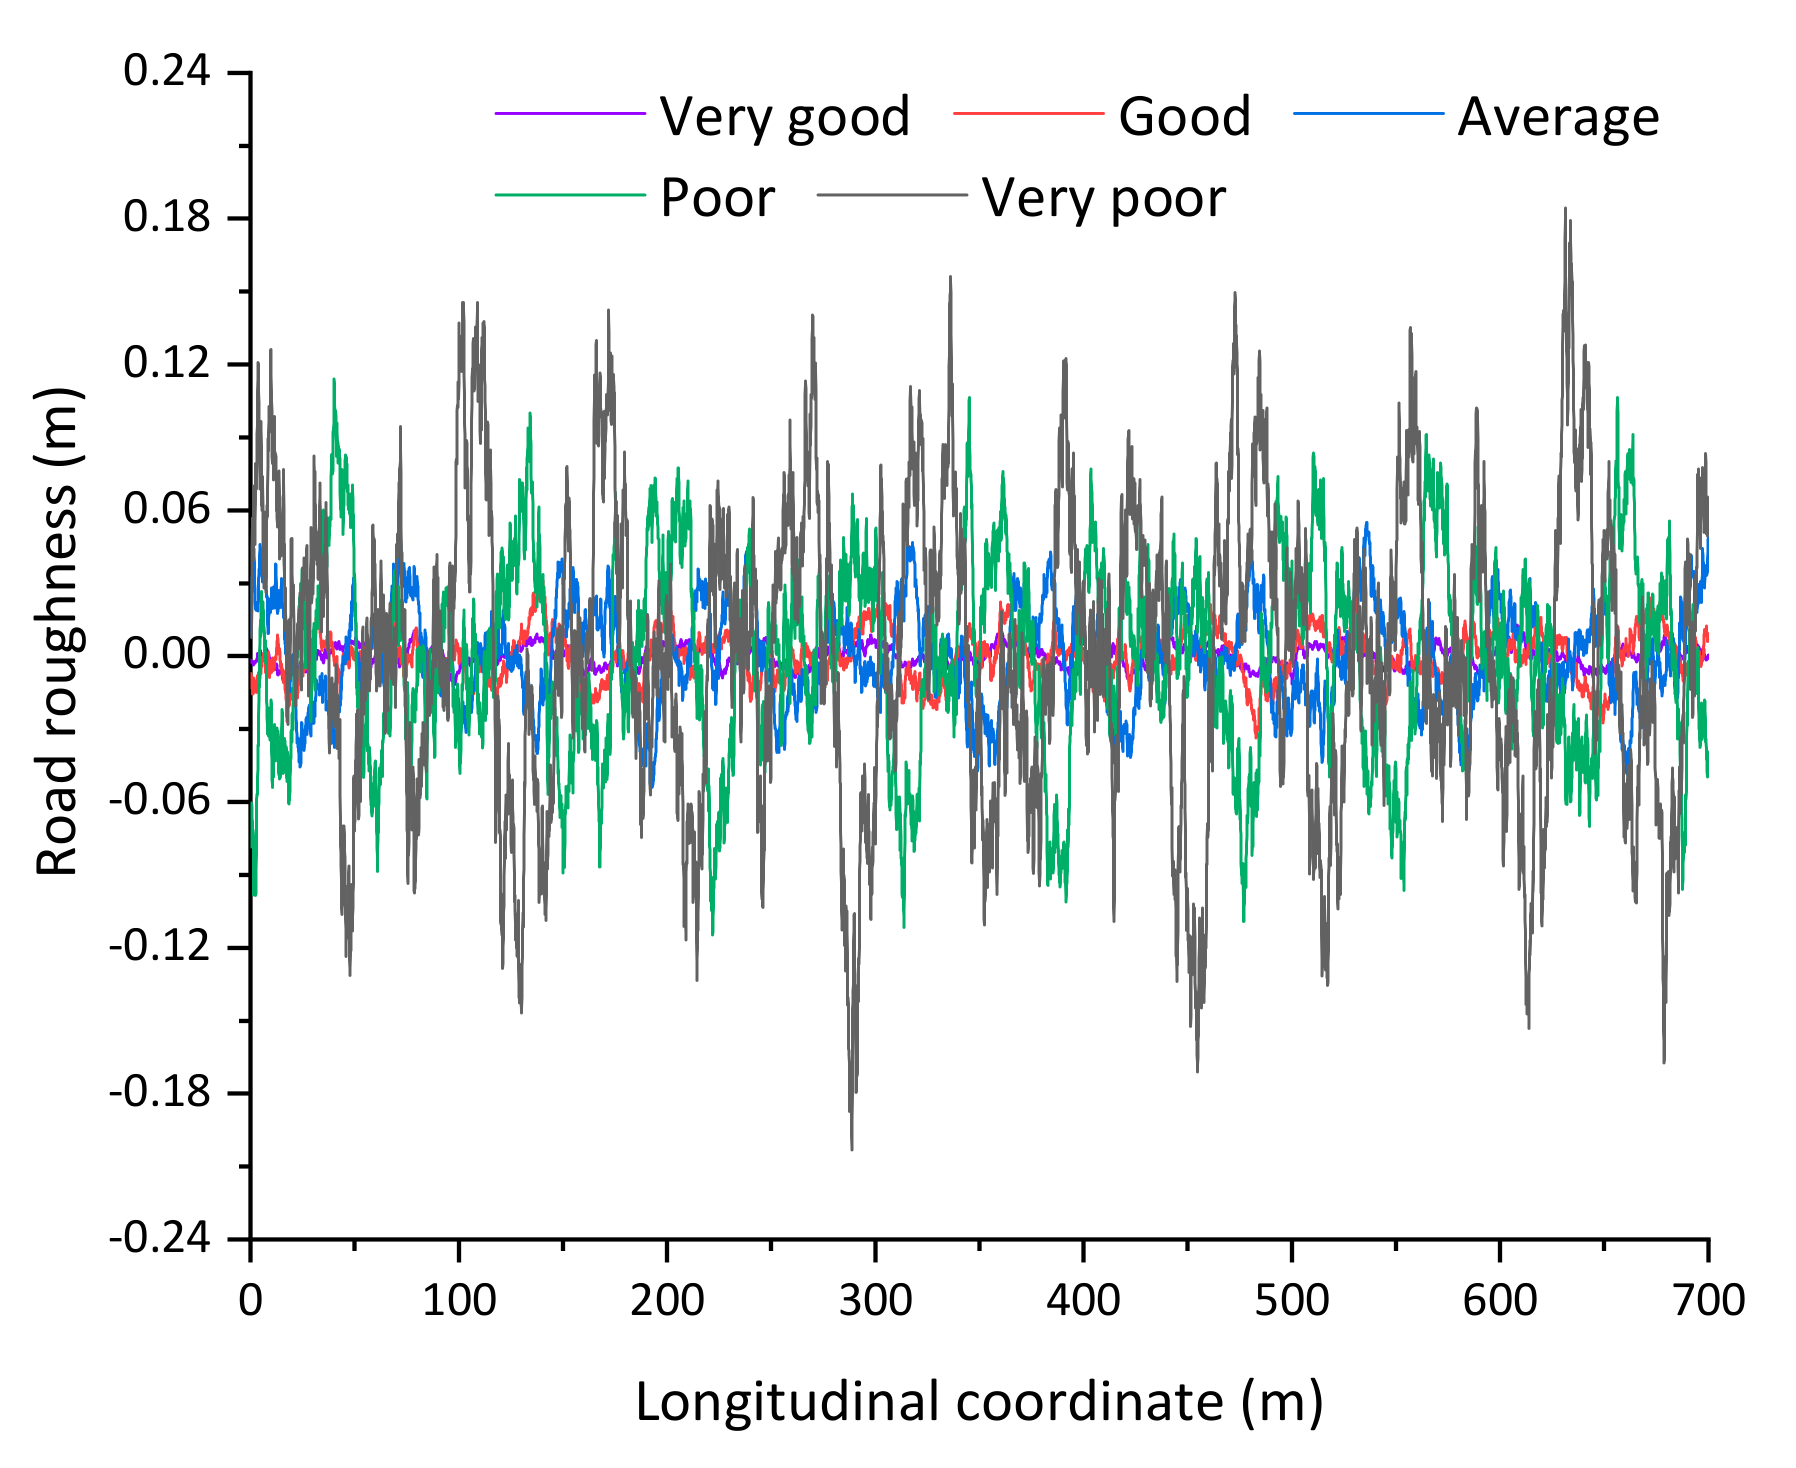
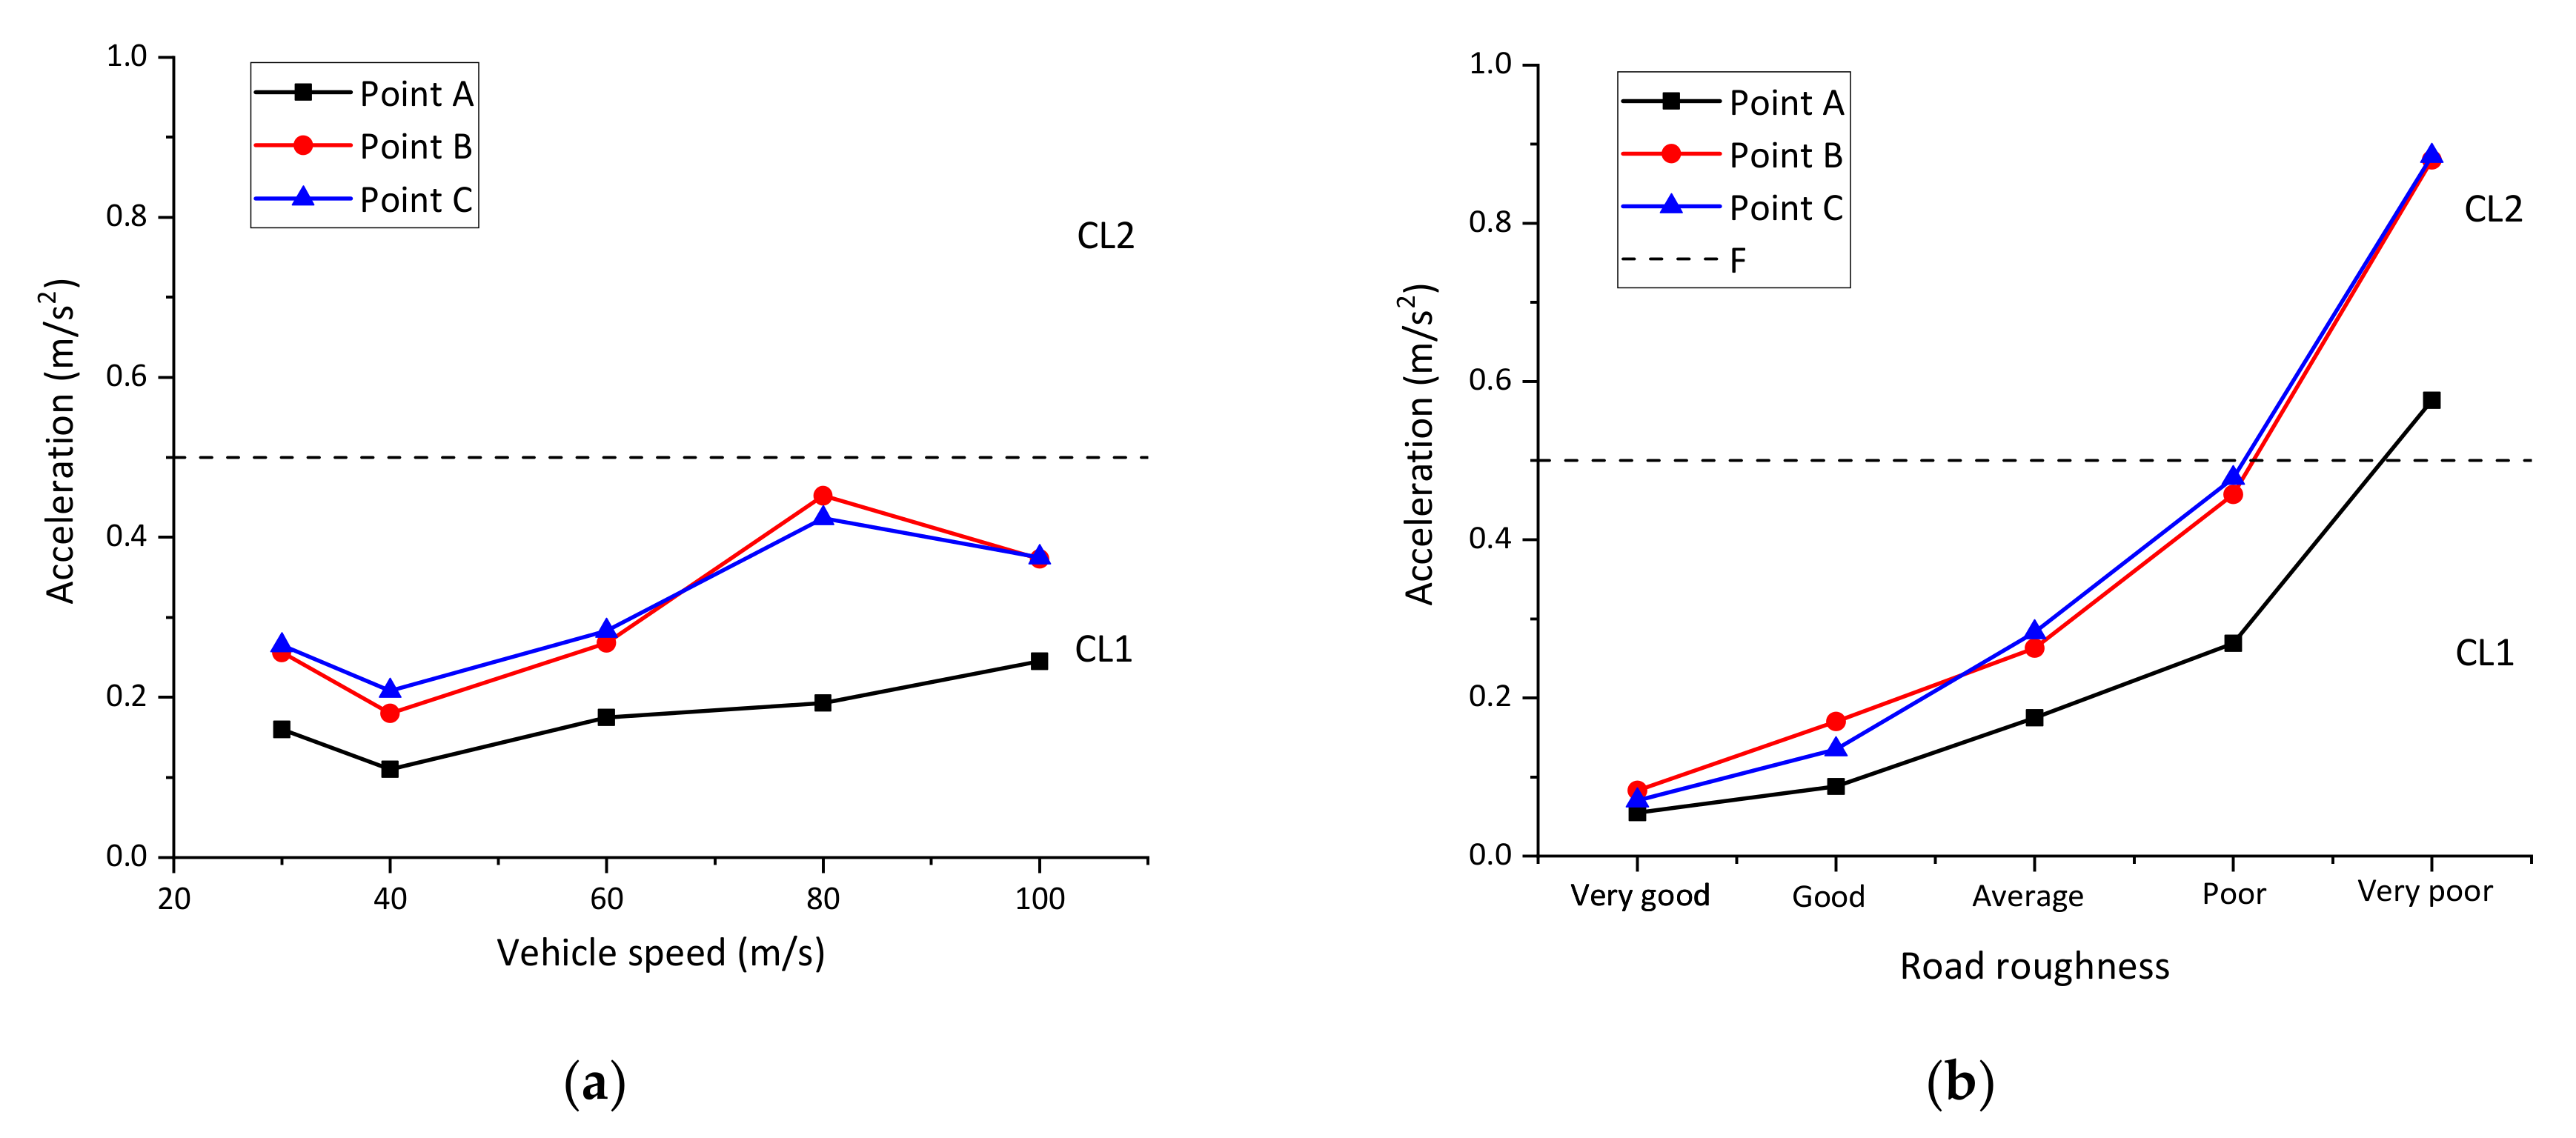
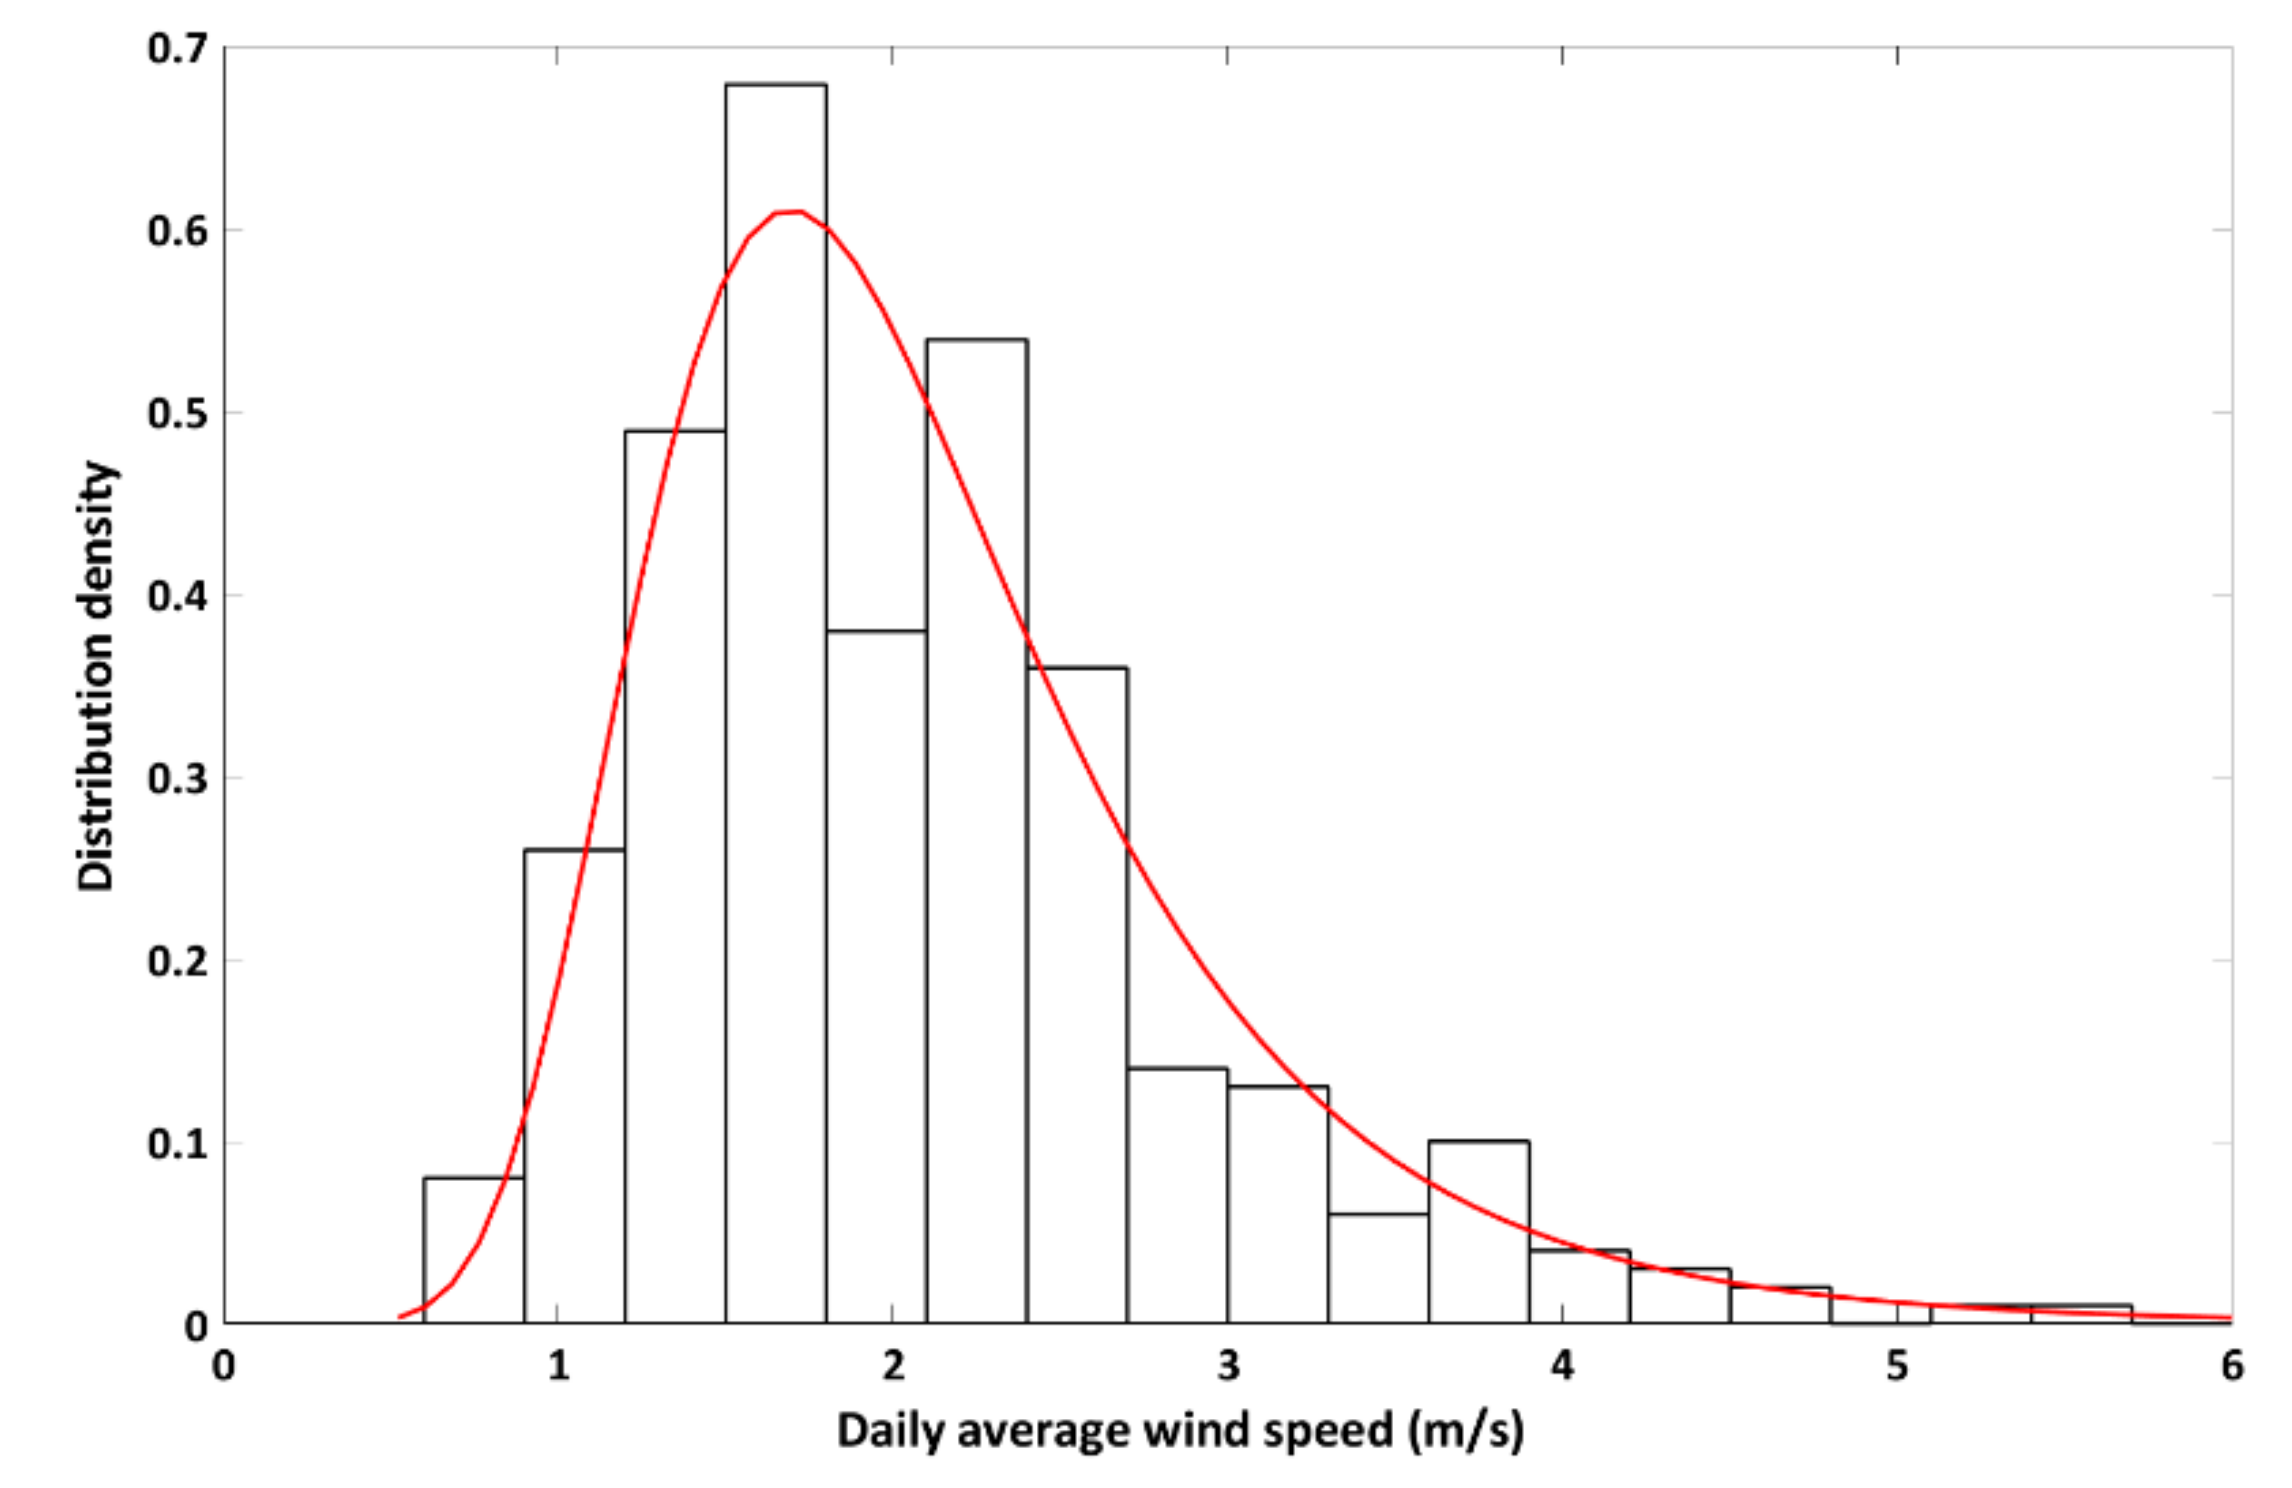
4.2. Road Roughness
4.3. Analysis Results
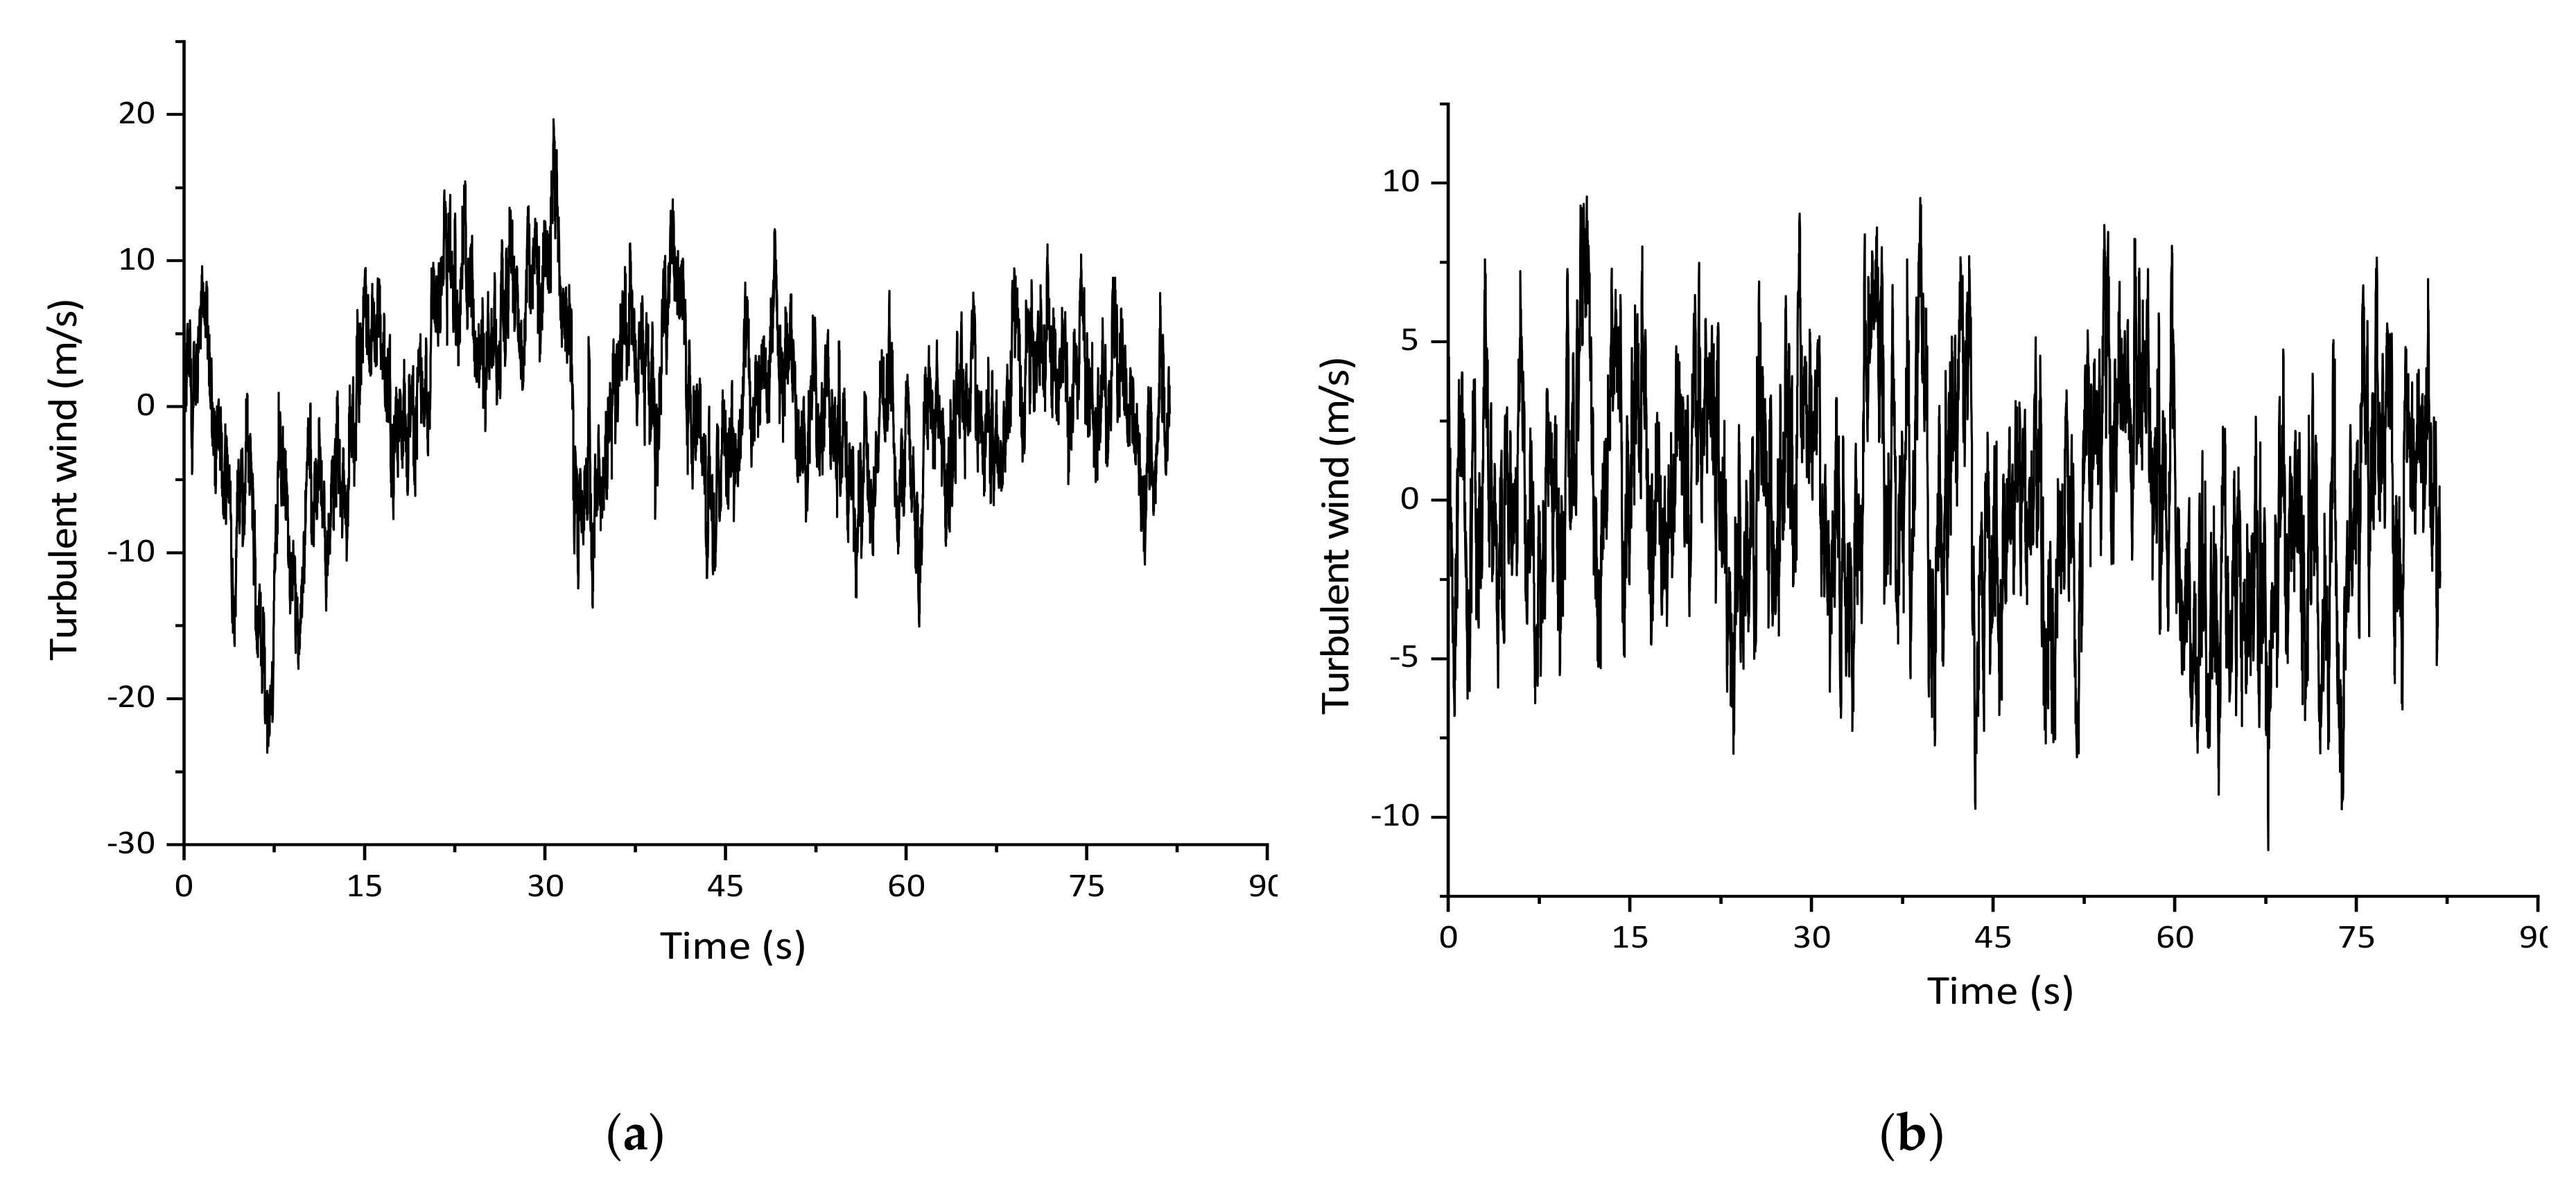
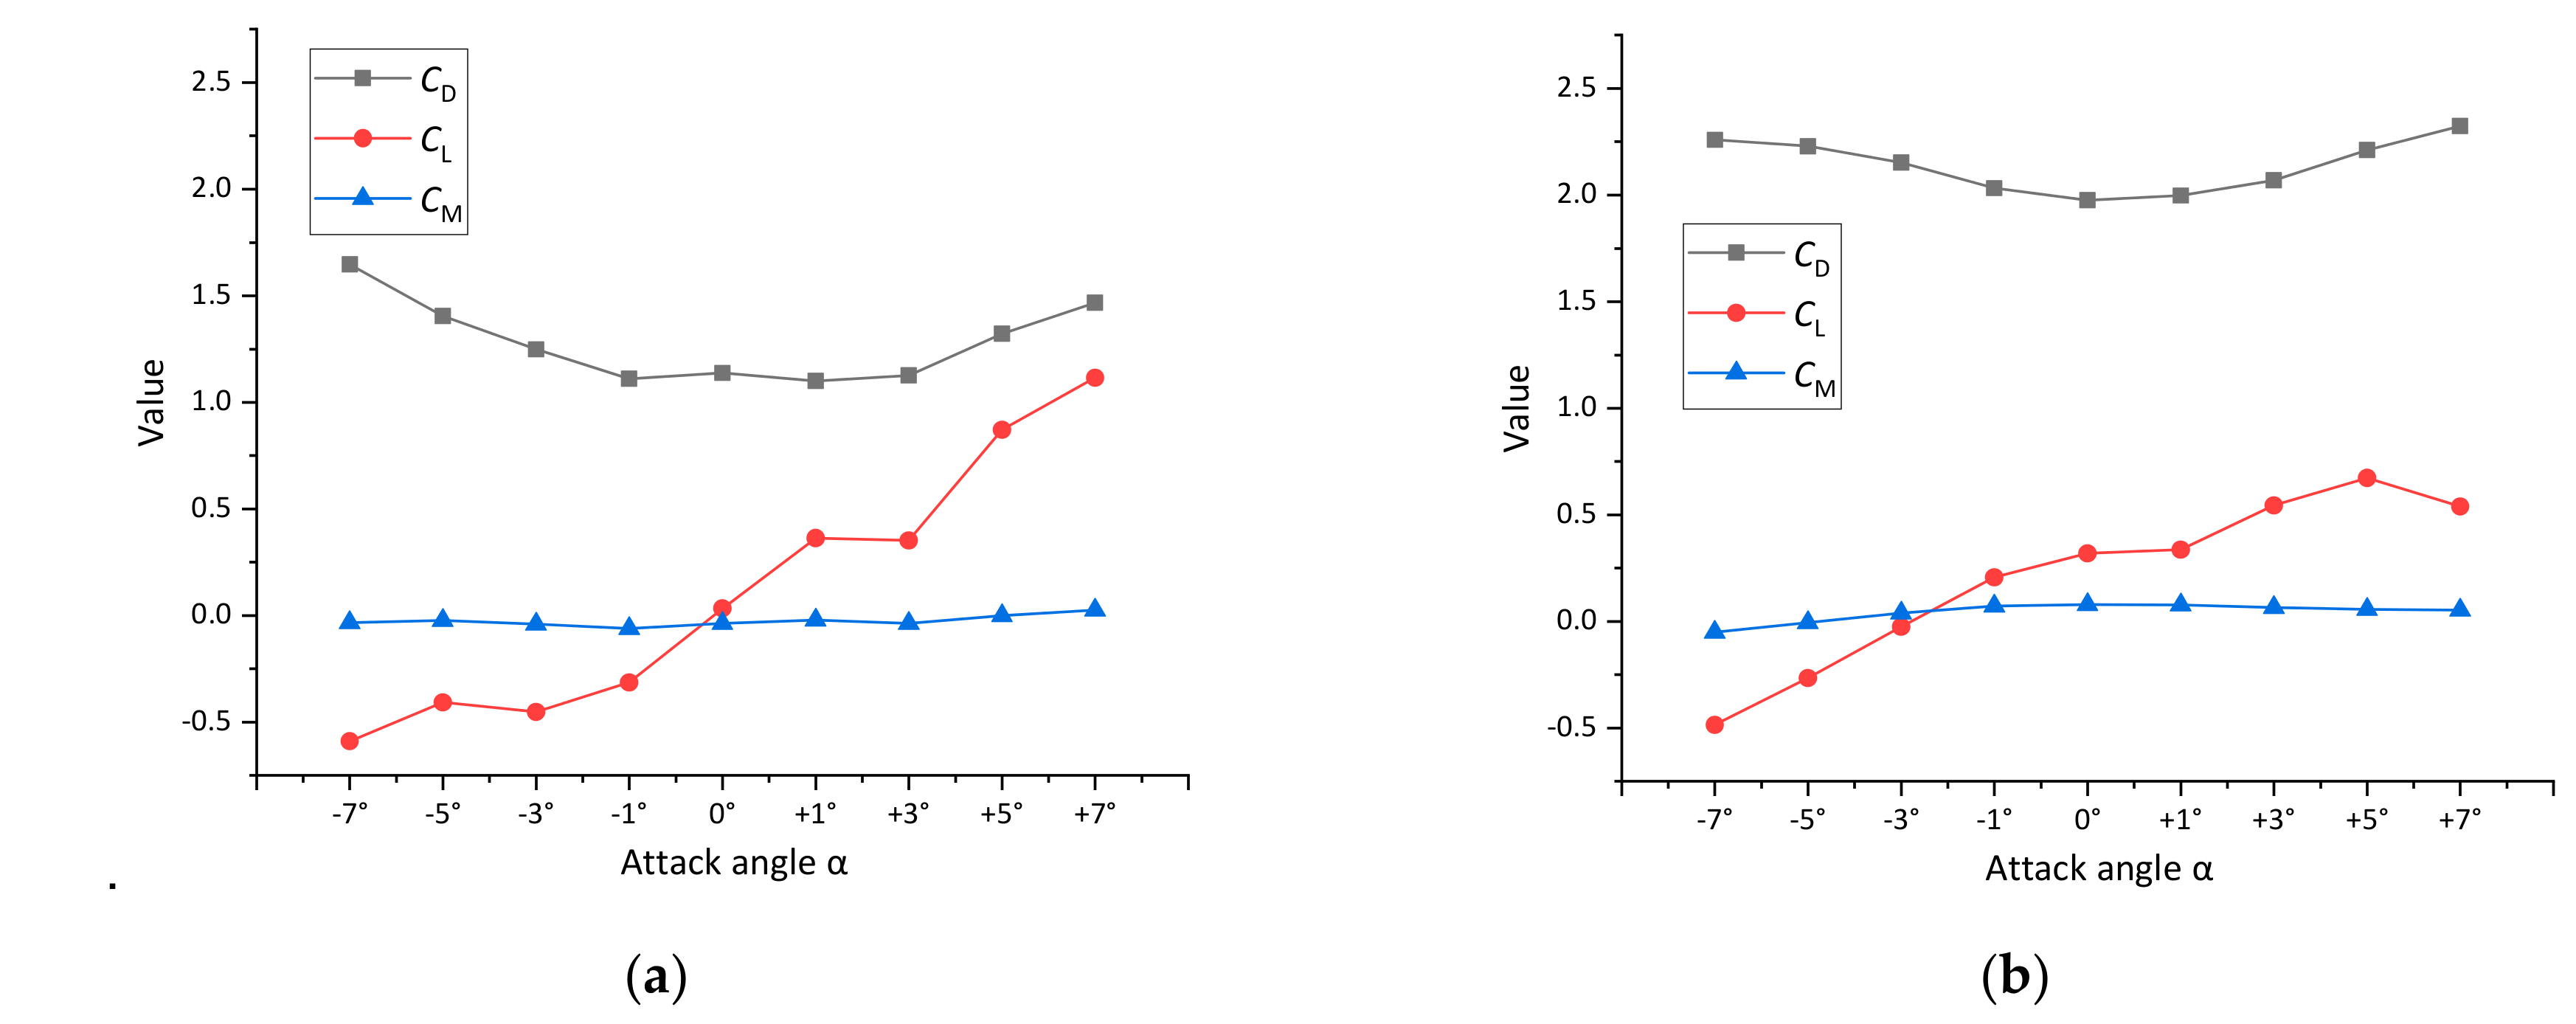
5. Vibration Caused by Turbulent Wind
5.1. Turbulent Wind and Aerodynamic Force
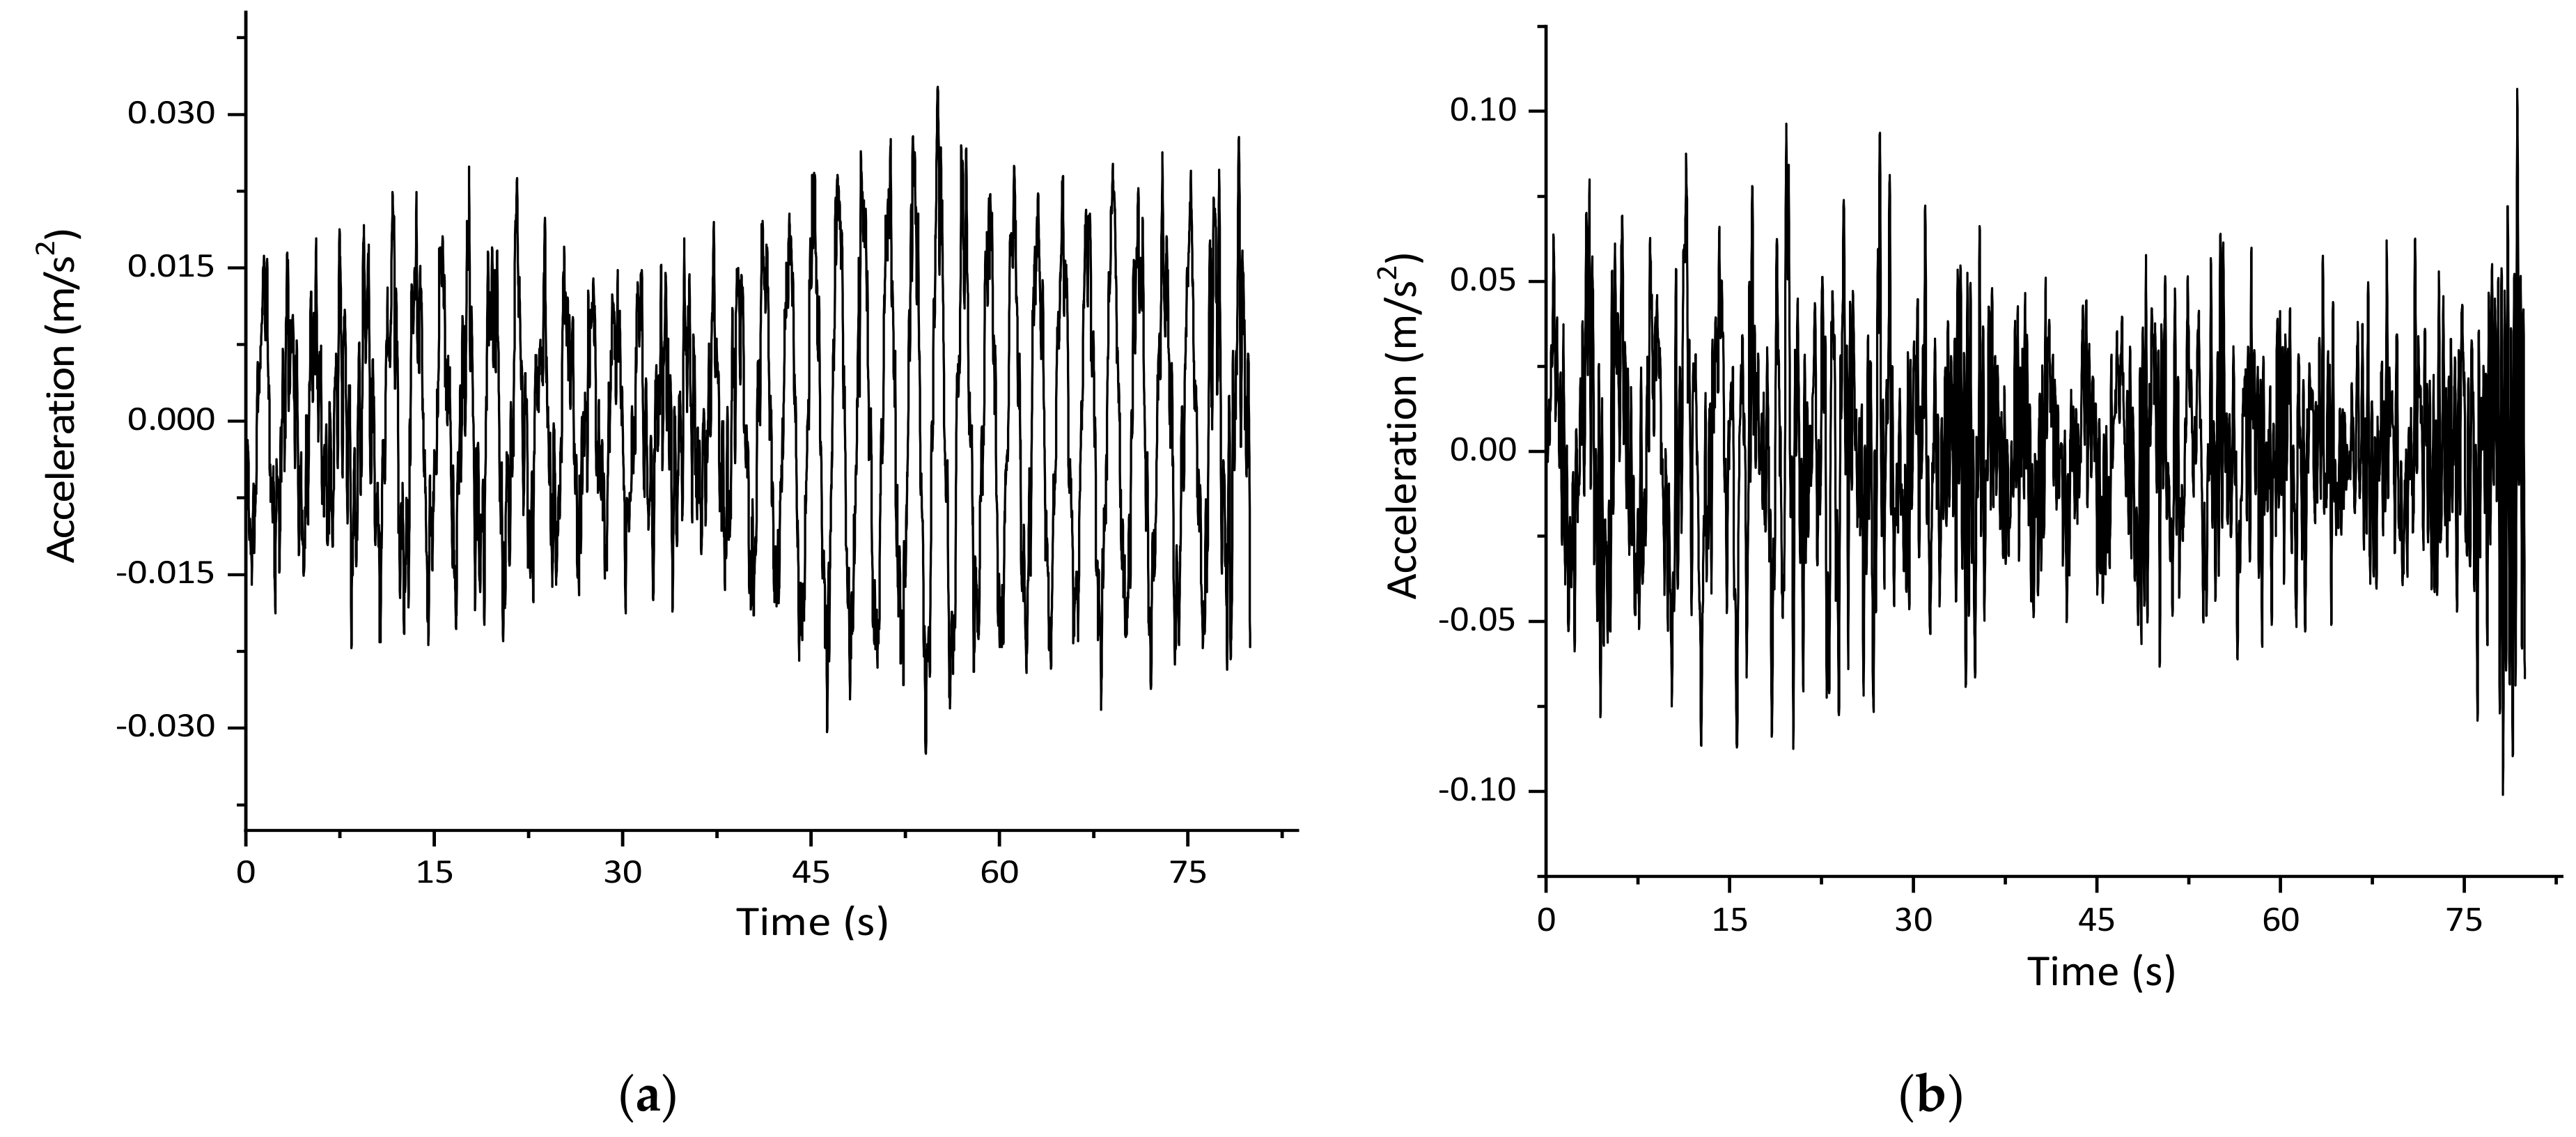
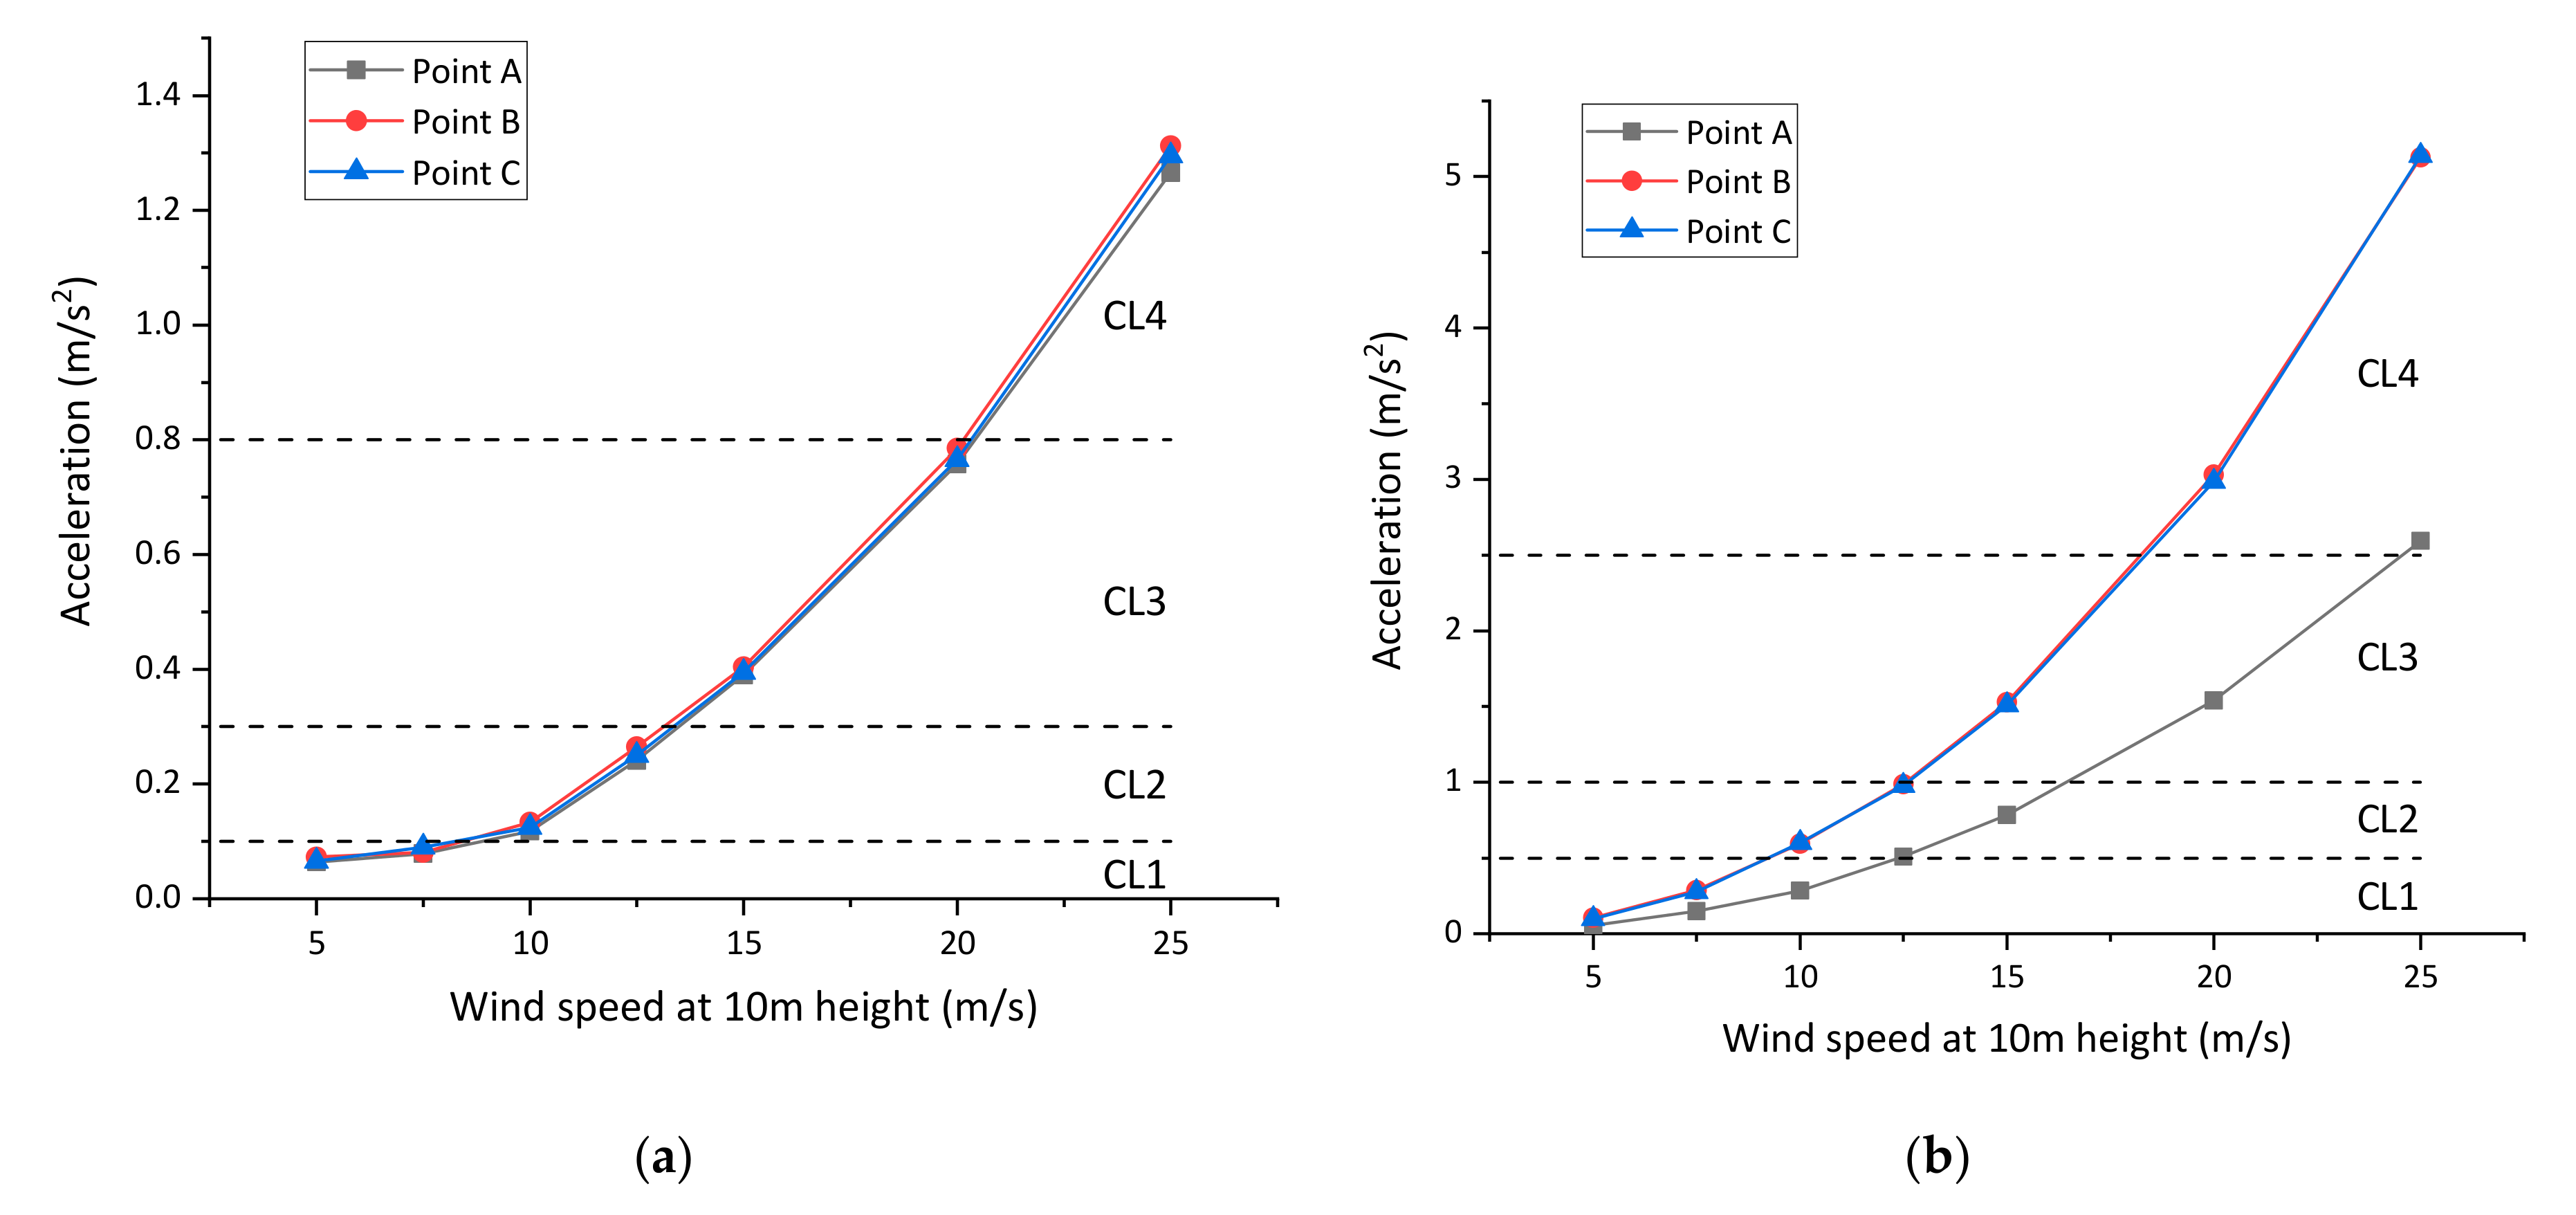
5.2. Analysis Results
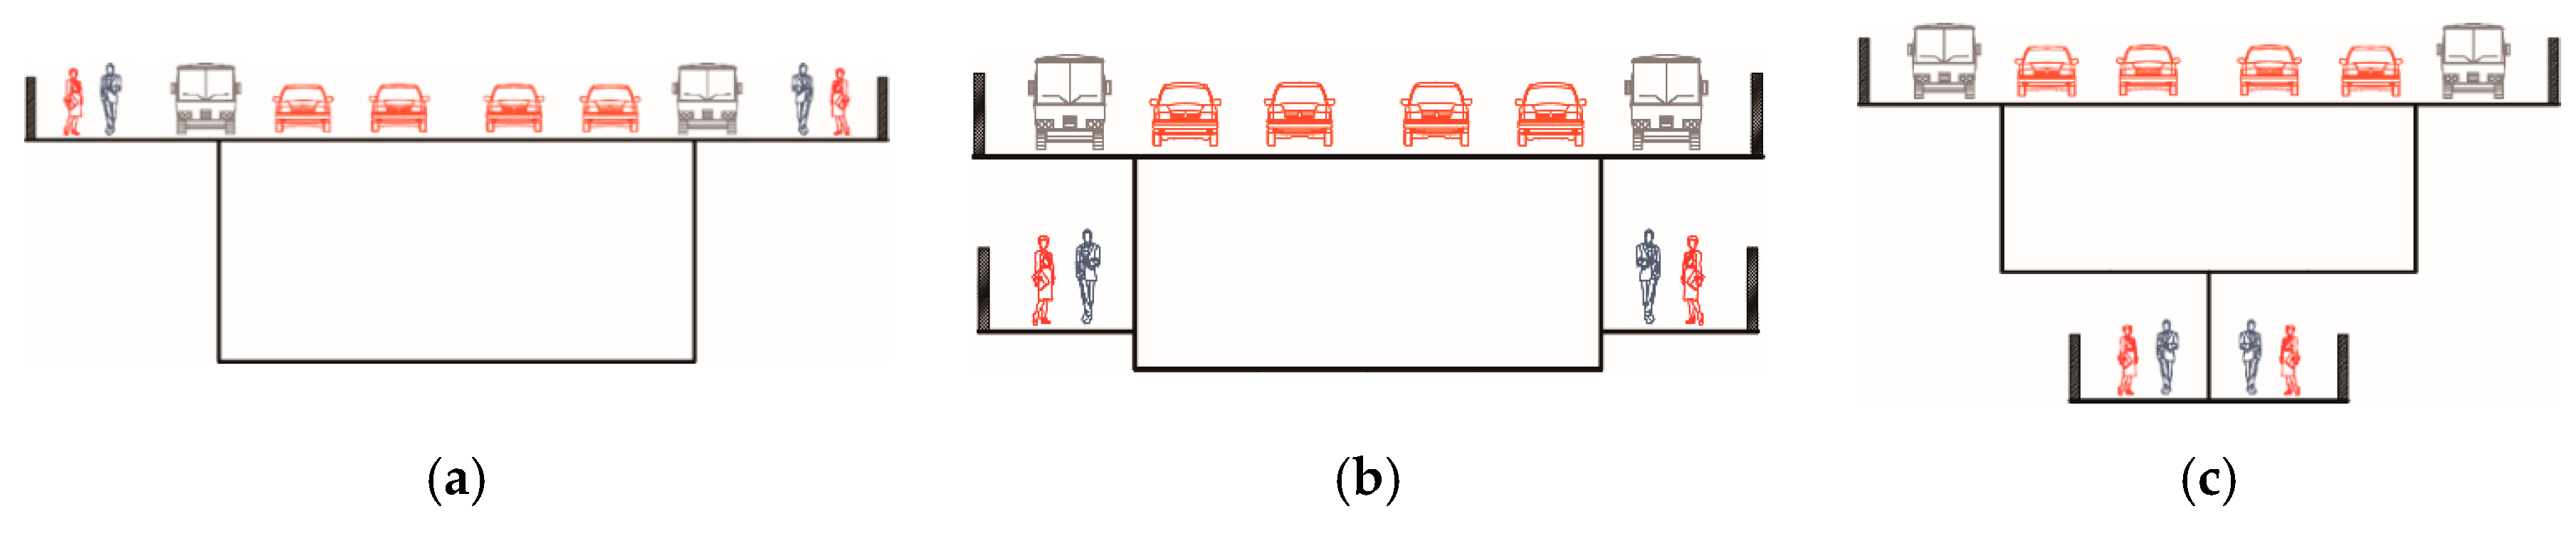
6. Joint Effects Analysis
- (1).
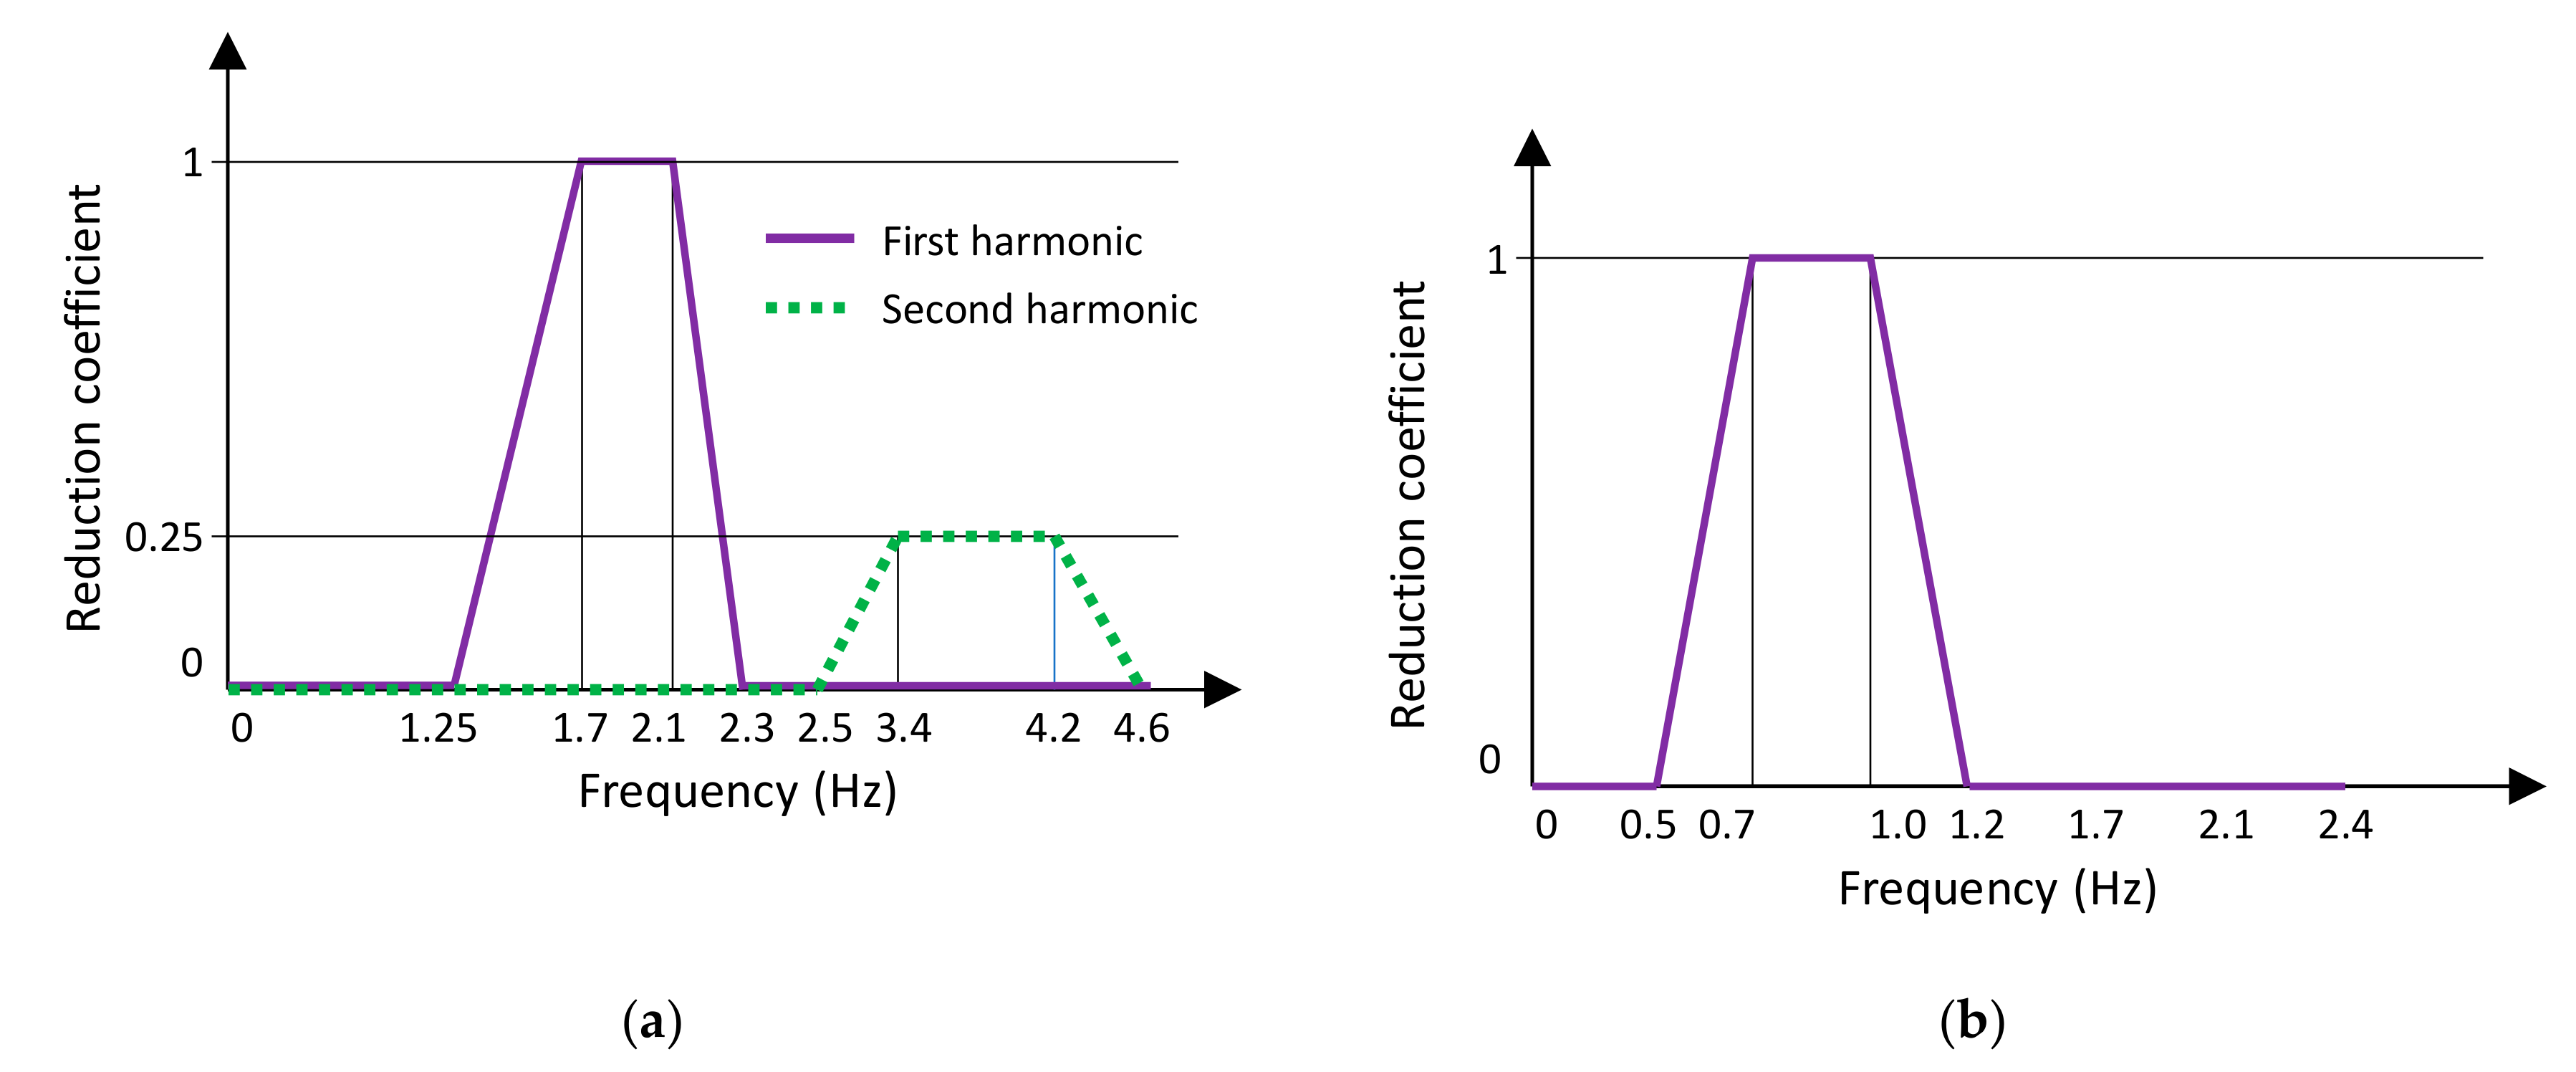
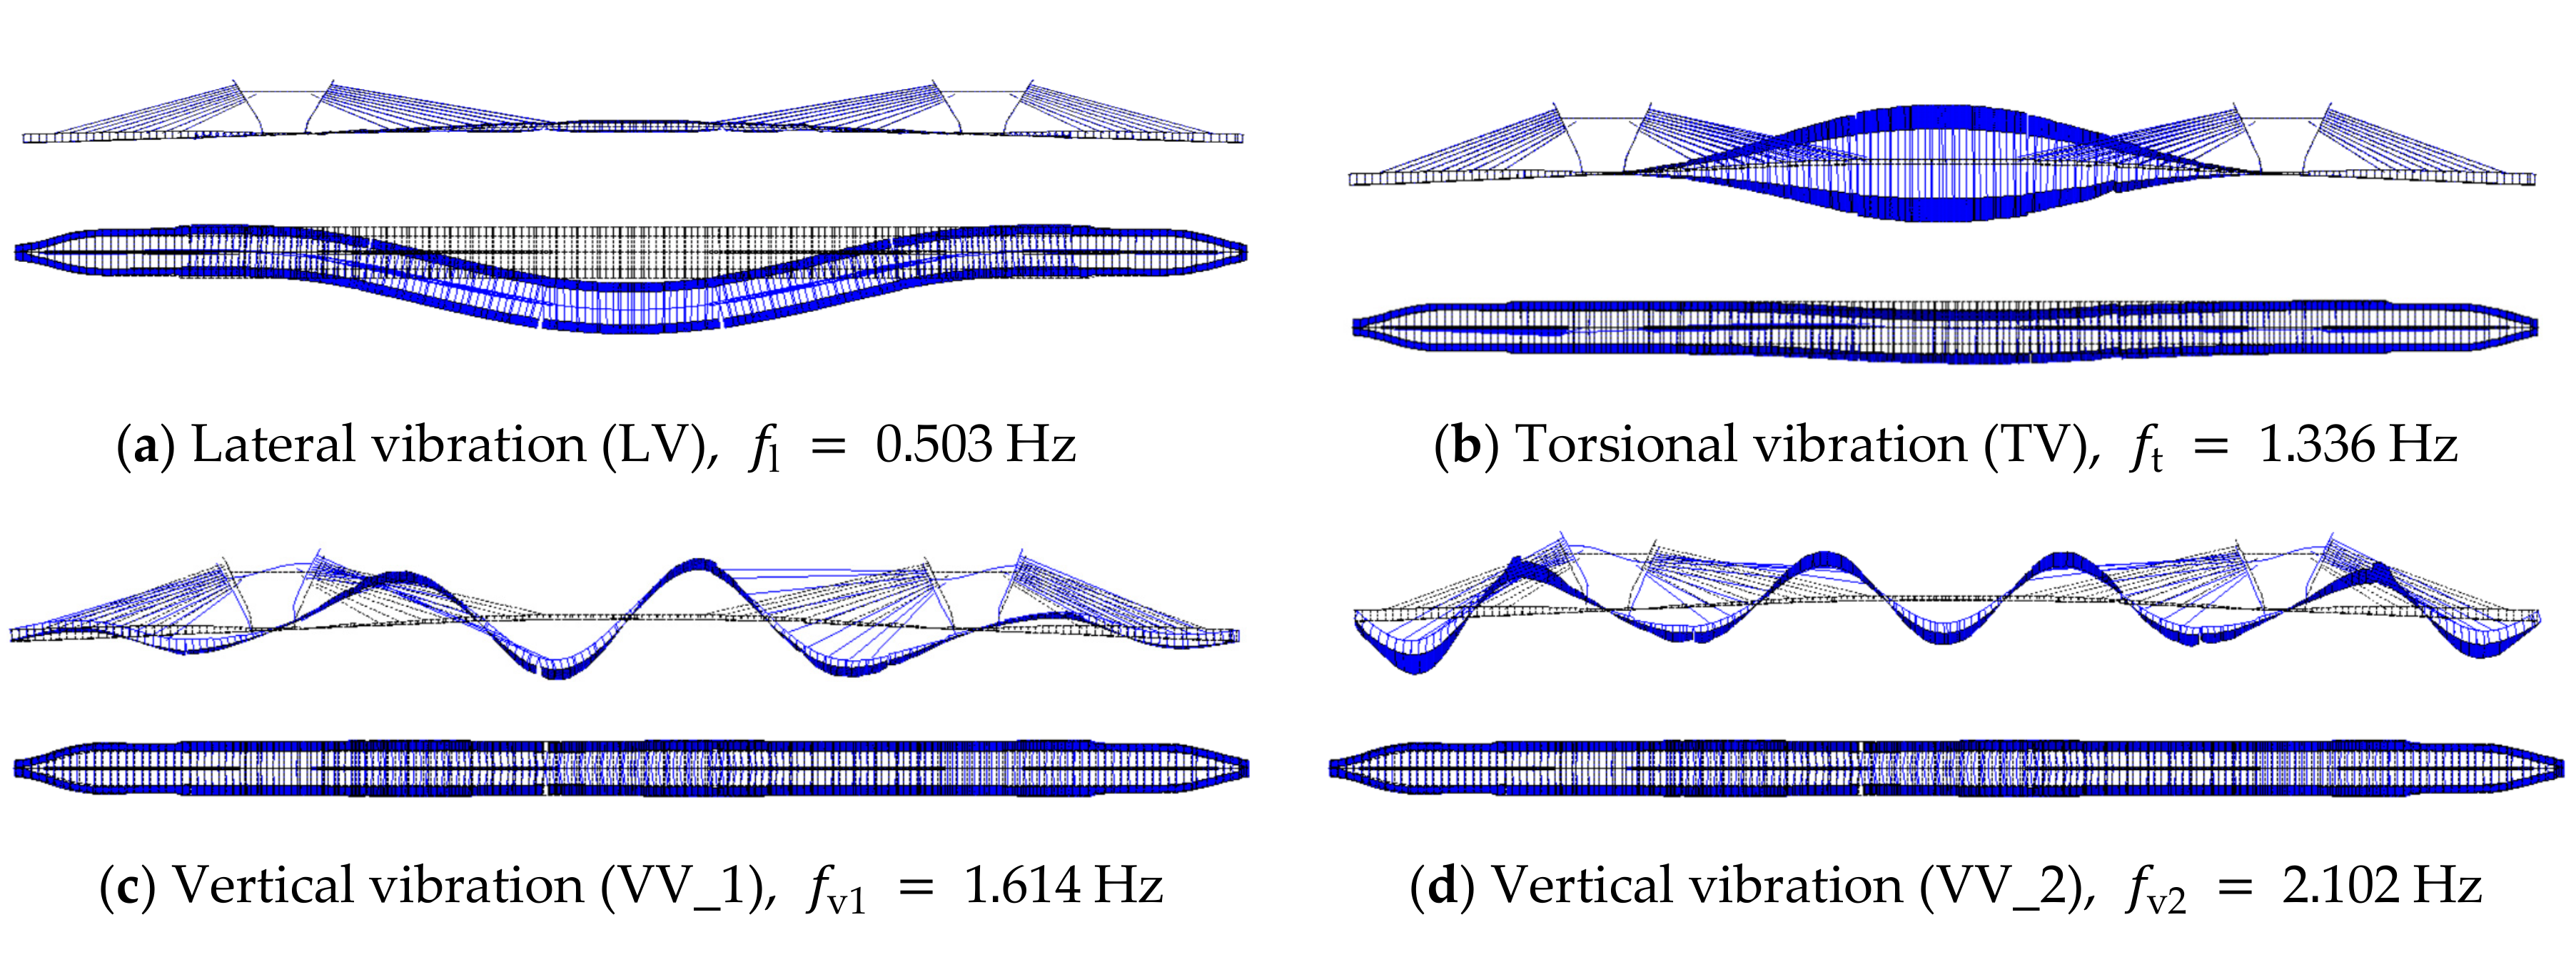
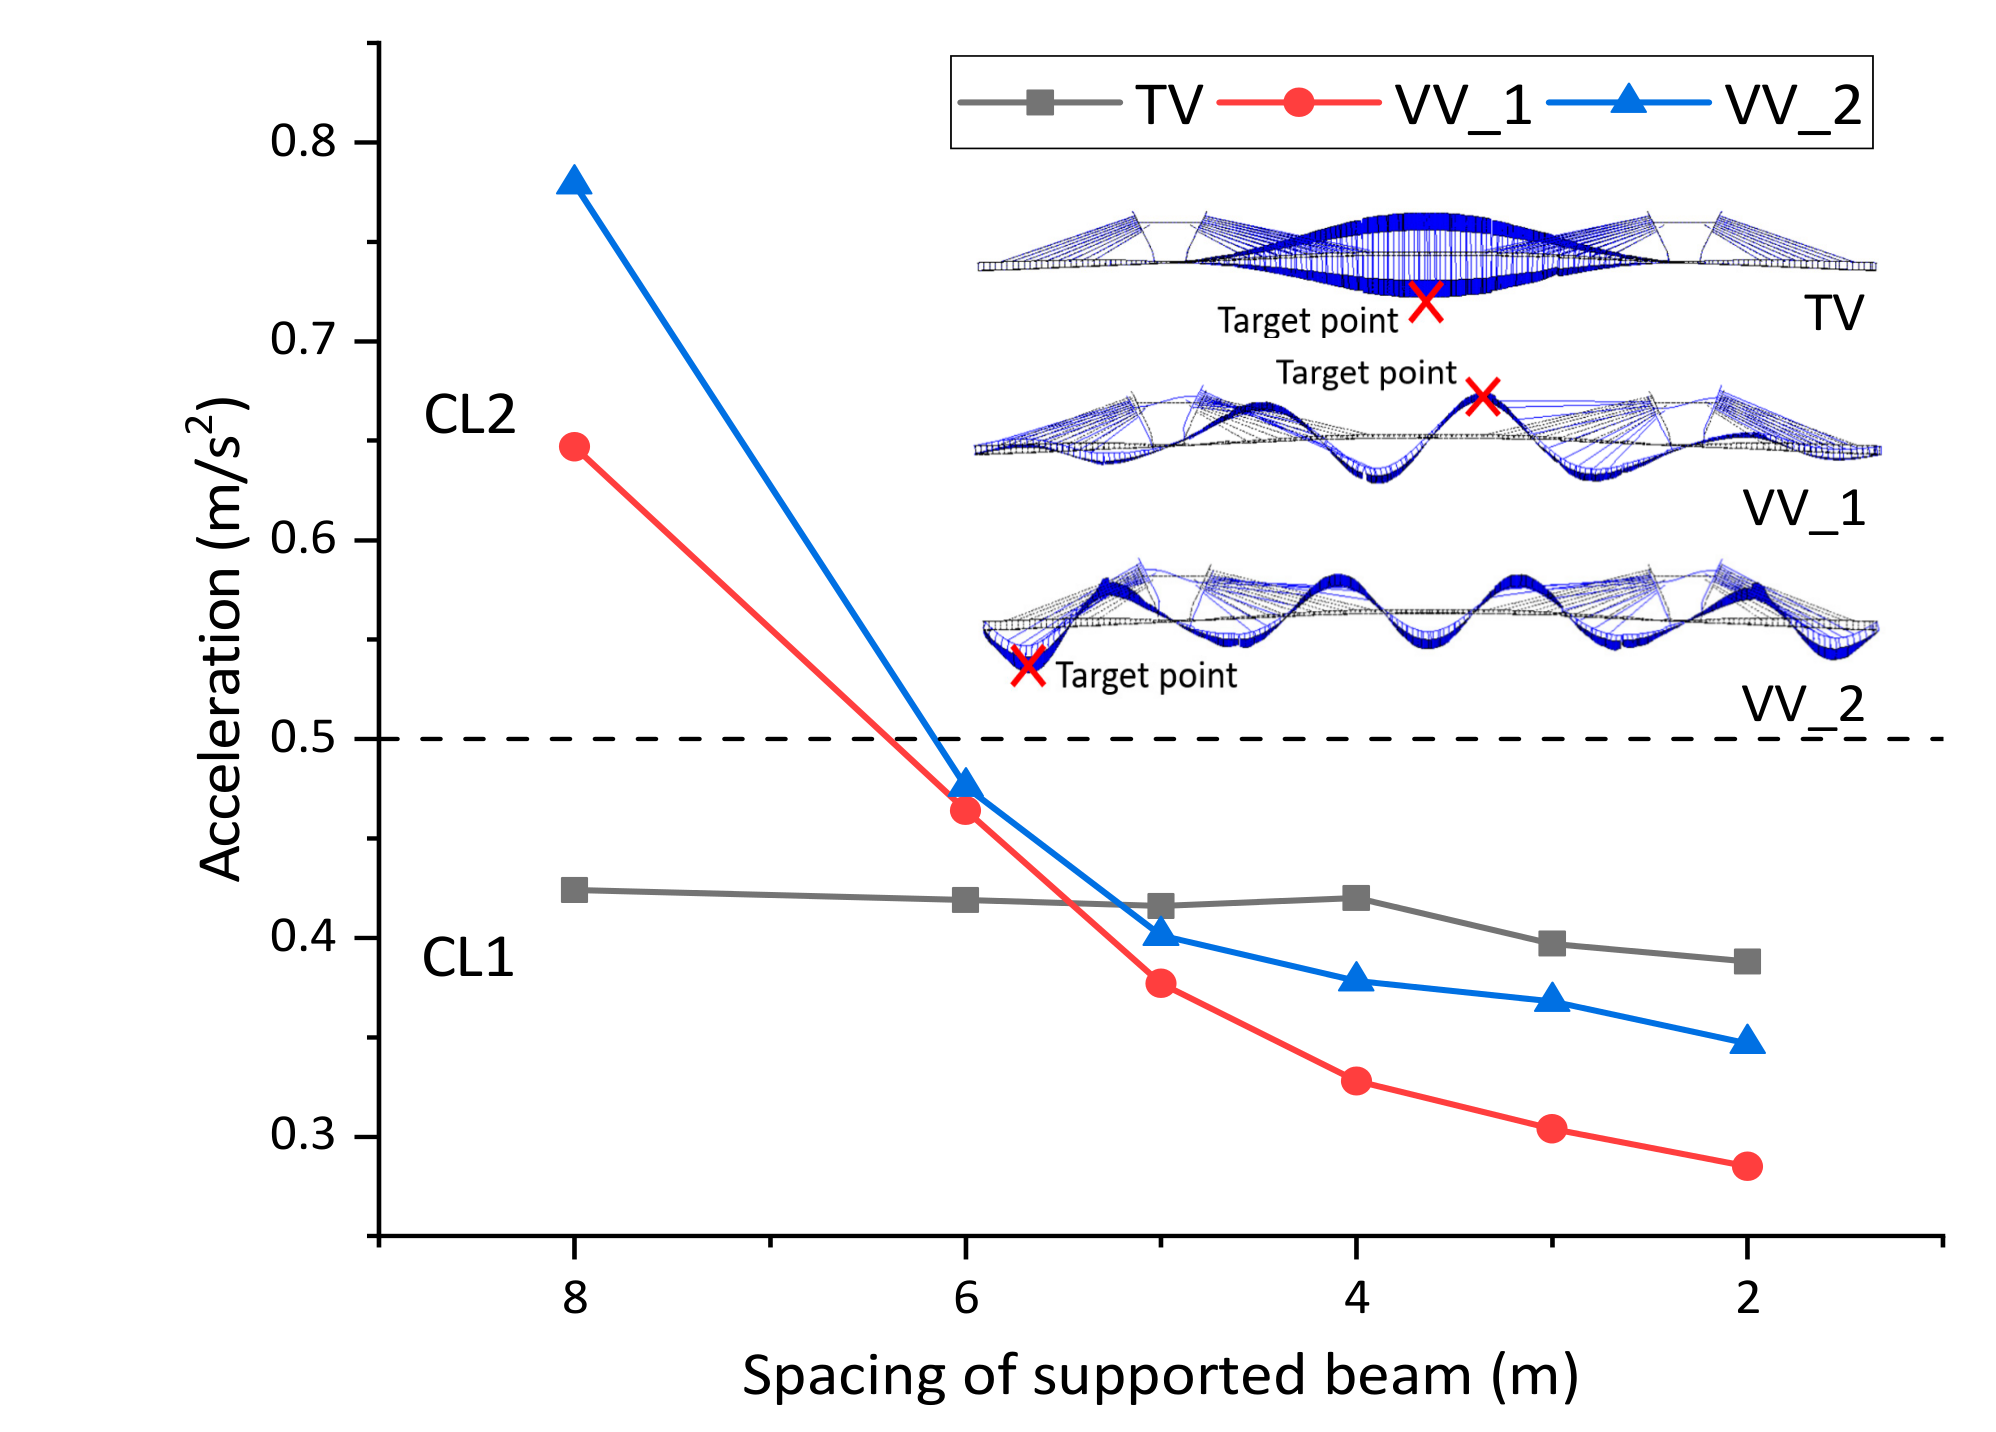
- The predominant frequency of bridge structure is determined to be ‘TV’ (the most unfavorable frequency) according to the simulation results in Figure 9 under the condition of 4.0 m (original design);
- (2).
- The road roughness is defined to be ‘Average’, since additional maintenance measures must be carried out when the road condition is below that level;
- (3).
- Only the vertical vibration is calculated here, considering the traffic loads have limited influence to lateral vibration.
7. Conclusions
- (1).
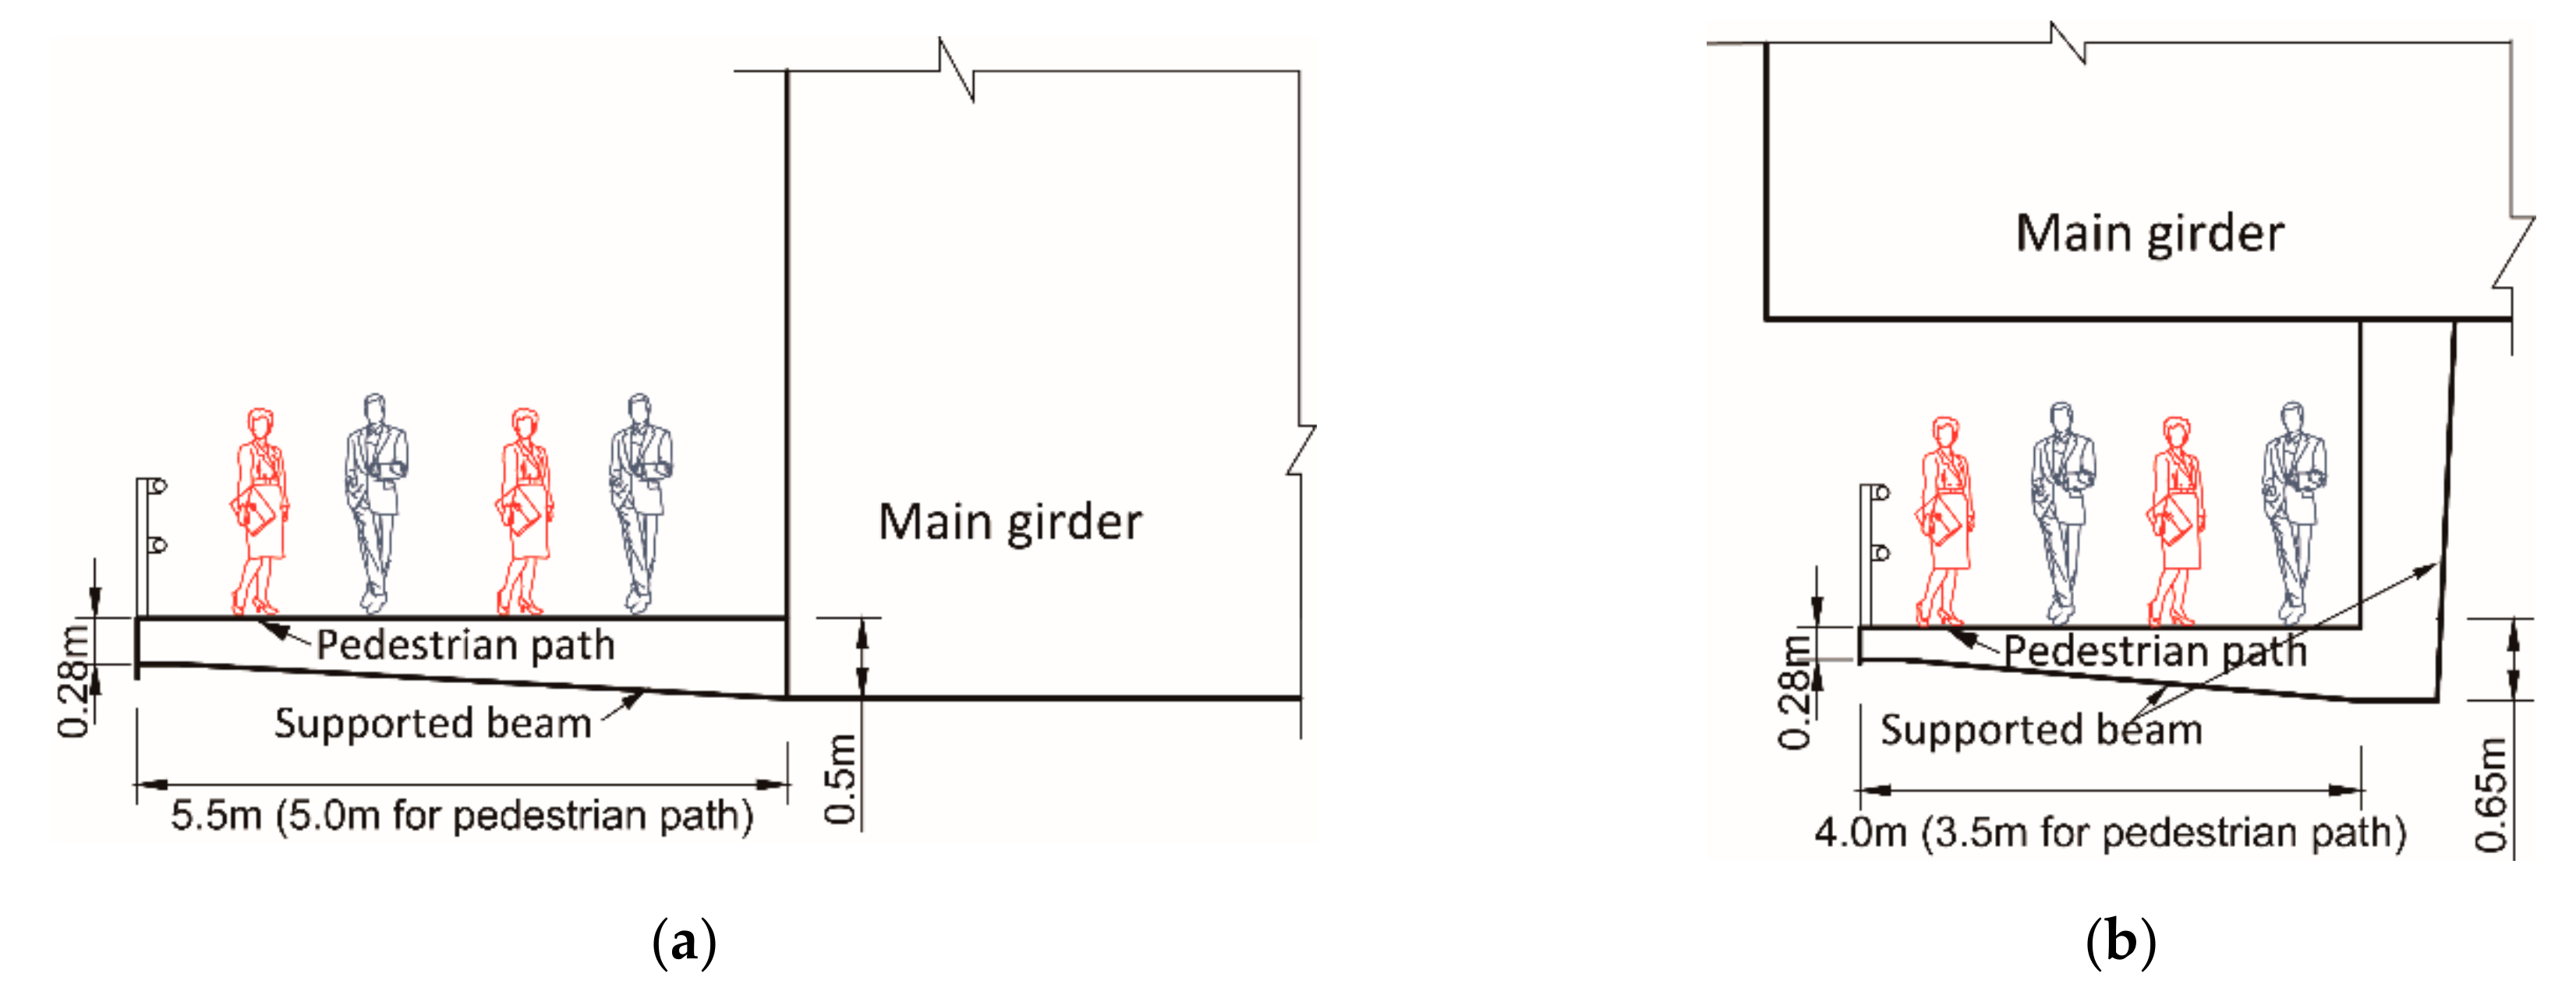
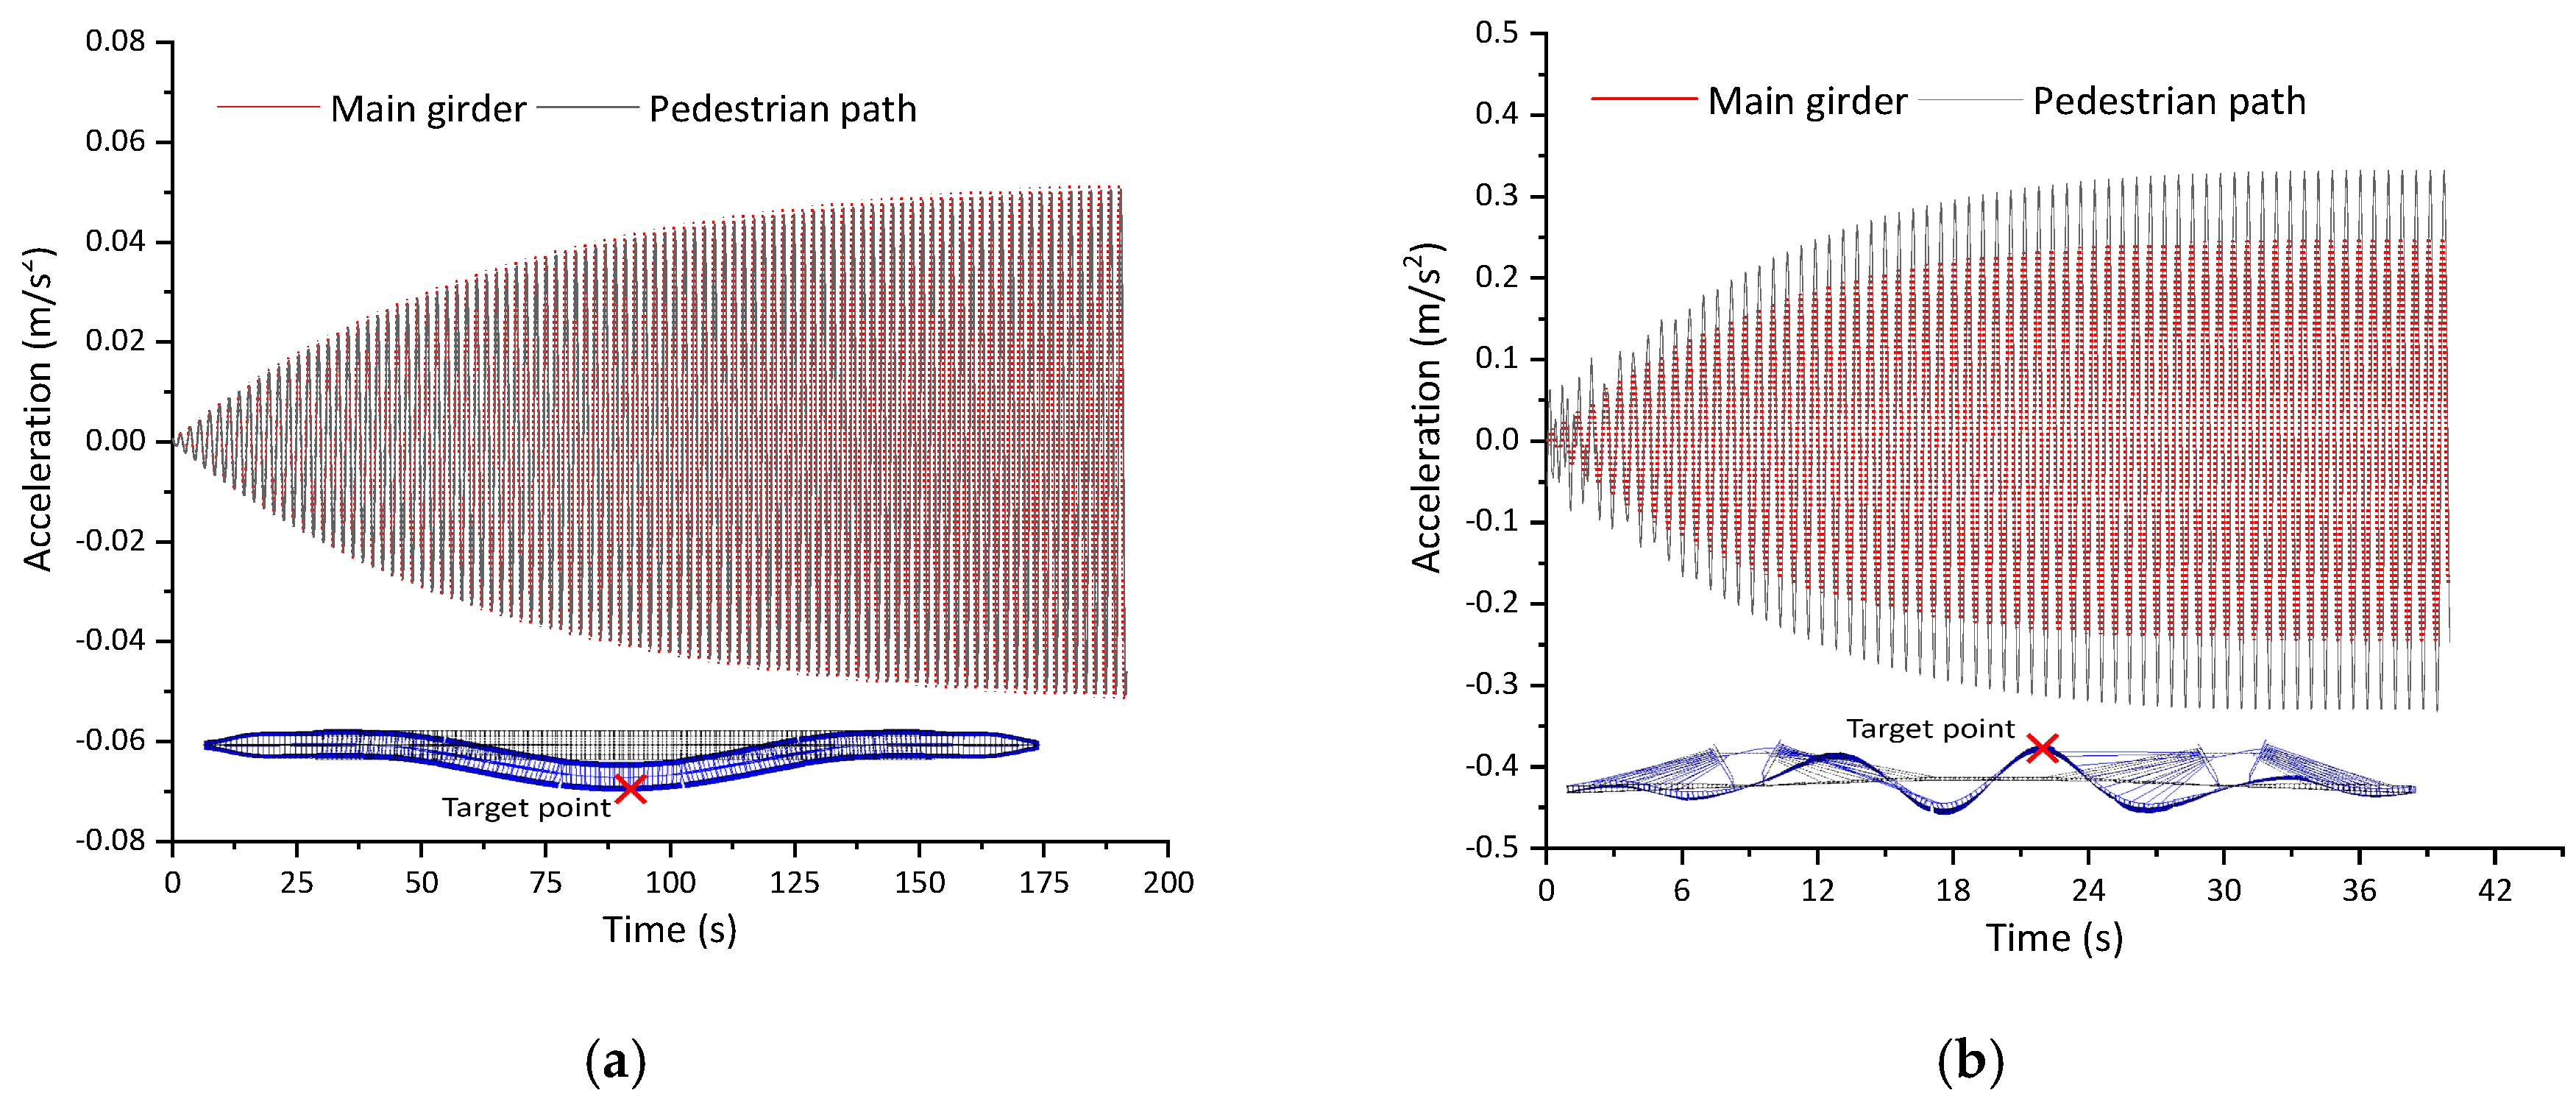
- The design of the pedestrian path can fit the comfort demand defined in EN03 even under the most unfavorable crowd conditions. However, it should be noticed that the maximum vertical acceleration of pedestrian path is much larger than that of the main girder, and reducing the spacing of supported beam has a considerable contribution to suppressing that local vibration.
- (2).
- The parametric study of vehicle-induced vibration under different values of vehicle speed and road roughness shows that the vehicle speed has limited effects on the maximum acceleration of main girder and pedestrian path, while the maximum acceleration amplifies significantly with the increase of road roughness. The results indicate that an effective maintenance strategy of bridge deck pavement is quite important for ensuring the comfort of pedestrians.
- (3).
- The maximum acceleration caused by turbulent wind increases with the growth of wind speed, and their relationship can be approximately regarded as a quadratic equation. The comfort to users is ‘Maximum’ when the wind speed at 10 m height less than 10 m/s, but the pedestrian will feel ‘Unacceptable’ if the wind speed at 10 m height exceeds 17.5 m/s, which indicates that the pedestrian path should be closed during strong winds.
- (4).
- The comfort to users is calculated to be ‘Maximum’ under the simulated joint effects, which indicates that the design of the pendent pedestrian path can satisfy the comfort demands in general.
Author Contributions
Funding
Conflicts of Interest
References
- Dallard, P.; Fitzpatrick, A.J.; Flint, A.; Le Bourva, S.; Low, A.; Ridsdill Smith, R.M.; Willford, M. The London Millennium Footbridge. Struct. Eng. 2001, 79, 17–33. [Google Scholar]
- Dallard, P.; Fitzpatrick, T.; Flint, A.J.A.; Low, A.; Smith, R.R.; Willford, M.; Roche, M. London Millennium Bridge: Pedestrian-Induced Lateral Vibration. J. Bridge Eng. 2001, 6, 412–417. [Google Scholar] [CrossRef]
- Harper, F.C.; Warlow, W.J.; Clarke, B.L. The Forces Applied to the Floor by the Foot in Walking; HM Stationery Off: London, UK, 1961. [Google Scholar]
- Galbraith, F.W.; Barton, M.V. Ground loading from footsteps. J. Acoust. Soc. Am. 1970, 48, 1288–1292. [Google Scholar] [CrossRef]
- Sahnaci, C.; Kasperski, M. Random loads induced by walking. In Proceedings of the Sixth European Conference on Structural Dynamics, Urodyn, Paris, France, 4–7 September 2005; pp. 441–446. [Google Scholar]
- Racic, V.; Brownjohn, J.M.W. Stochastic model of near-periodic vertical loads due to humans walking. Adv. Eng. Inf. 2011, 25, 259–275. [Google Scholar] [CrossRef]
- Chen, J.; Peng, Y.X.; Wang, L. Experimental investigation and mathematical modeling of single footfall load using motion capture technology. China Civ. Eng. J. 2014, 47, 79–87. [Google Scholar]
- Design of Footbridges Guideline. Available online: http://www.stahlbau.stb.rwth-aachen.de/projekte/2007/HIVOSS/docs/Footbridge_Guidelines_EN03.pdf (accessed on 22 August 2019).
- Ding, G.; Chen, J. Influences of walking load randomness on vibration responses of long-span floors. J. Vib. Eng. 2016, 29, 123–131. [Google Scholar]
- Ma, R.J.; Ke, L.; Wang, D.L.; Chen, A.; Pan, Z. Experimental study on pedestrians’ perception of human-induced vibrations of footbridges. Int. J. Struct. Stab. Dyn. 2018, 18, 1850116. [Google Scholar] [CrossRef]
- Elsa, C.; Alvaro, C.; Filipe, M.; Carlos, M. Studies for controlling human-induced vibration of the Pedro e Inês footbridge, Portugal. Part 1: Assessment of dynamic behaviour. Eng. Struct. 2010, 32, 1069–1081. [Google Scholar]
- Elsa, C.; Alvaro, C.; Filipe, M.; Carlos, M. Studies for controlling human-induced vibration of the Pedro e Inês footbridge, Portugal. Part 2: Implementation of tuned mass dampers. Eng. Struct. 2010, 32, 1082–1091. [Google Scholar]
- Bullo, S.; Di Marco, R. The footbridge over the river Adige at Legnago in Italy Part 2: The assessment of human-induced vibrations. Int. J. Space Struct. 2007, 22, 19–34. [Google Scholar] [CrossRef]
- Lai, E.; Gentile, C.; Mulas, M.G. Experimental and numerical serviceability assessment of a steel suspension footbridge. J. Constr. Steel Res. 2017, 132, 16–28. [Google Scholar] [CrossRef]
- Zhong, H.; Yang, M.; Gao, Z. Dynamic responses of prestressed bridge and vehicle through bridge–vehicle interaction analysis. Eng. Struct. 2015, 87, 116–125. [Google Scholar] [CrossRef]
- Li, Y.; Cai, C.S.; Liu, Y.; Chen, Y.J.; Liu, J.F. Dynamic analysis of a large span specially shaped hybrid girder bridge with concrete-filled steel tube arches. Eng. Struct. 2016, 106, 243–260. [Google Scholar] [CrossRef]
- Yin, X.F.; Liu, Y.; Song, G.; Mo, Y.L. Suppression of bridge vibration induced by moving vehicles using pounding tuned mass dampers. J. Bridge Eng. 2018, 23, 04018047. [Google Scholar] [CrossRef]
- Wang, G.C.; Li, W.S. Analysis on the vehicle ride comfort based on vehicle-bridge coupled vibration. J. Vib. Shock 2016, 35, 224–230. [Google Scholar]
- Chen, Z.Q.; Liu, G.D. Some recent progresses in bridge wind engineering research. Eng. Mech. 2006, 23, 93–111. [Google Scholar]
- Cheynet, E.; Jakobsen, J.B.; Jónas, S. Buffeting response of a suspension bridge in complex terrain. Eng. Struct. 2016, 128, 474–487. [Google Scholar] [CrossRef]
- Kavrakov, I.; Morgenthal, G. A Comparative assessment of aerodynamic models for buffeting and flutter of long-span bridges. Engineering 2017, 3, 823–838. [Google Scholar] [CrossRef]
- Wang, H.; Hu, R.; Xie, J.; Tong, T. Comparative study on buffeting performance of Sutong Bridge based on design and measured spectrum. J. Bridge Eng. 2013, 18, 587–600. [Google Scholar] [CrossRef]
- Racic, V.; Pavic, A.; Brownjohn, J.M.W. Experimental identification and analytical modelling of human walking forces: Literature review. J. Sound Vib. 2009, 326, 1–49. [Google Scholar] [CrossRef]
- Kim, C.W.; Kawatani, M.; Kim, K.B. Three-dimensional dynamic analysis for bridge-vehicle interaction with roadway roughness. Comput. Struct. 2005, 83, 1627–1645. [Google Scholar] [CrossRef]
- Li, X.N. Theoretical Research on Bridge Weigh-In-Motion System Based on Monitored Strain; Tongji University: Shanghai, China, 2014. [Google Scholar]
- Au, F.T.K.; Cheng, Y.S.; Cheung, Y.K. Effects of random road surface roughness and long-term deflection of prestressed concrete girder and cable-stayed bridges on impact due to moving vehicles. Comput. Struct. 2001, 79, 853–872. [Google Scholar] [CrossRef]
- Simiu, E. Wind spectra and dynamic along wind response. J. Struct. Div. ASCE 1974, 100, 1897–1910. [Google Scholar]
- Panofsky, H.A.; McCormick, R.A. The Spectrum of vertical velocity near the surface. Q. J. R. Meteorol. Soc. 1960, 86, 495–503. [Google Scholar] [CrossRef]
- Chuanjie, C.; Airong, C.; Rujin, M.; Wang, B.; Xu, S. Fatigue life estimation for suspenders of a three-pylon suspension bridge based on vehicle–bridge-interaction analysis. Materials 2019, 12, 2617. [Google Scholar]


| Comfort Class | Design of Comfort | Vertical Acceleration Limit | Lateral Acceleration Limit |
|---|---|---|---|
| CL 1 | Maximum | <0.50 m/s2 | <0.10 m/s2 |
| CL 2 | Medium | 0.50–1.00 m/s2 | 0.10–0.30 m/s2 |
| CL 3 | Minimum | 1.00–2.50 m/s2 | 0.30–0.80 m/s2 |
| CL 4 | Unacceptable | >2.50 m/s2 | >0.80 m/s2 |
| Parameter | Symbol | Unit | Value |
|---|---|---|---|
| Total weight | ton | 30 | |
| Distance between front axle and gravity center of body | m | 3.576 | |
| Distance between middle axle and gravity center of body | m | 0.424 | |
| Distance between rear axle and gravity center of body | m | 1.824 | |
| Tread | m | 1.8 | |
| Mass of vehicle body | ton | 24.75 | |
| Pitching moment of inertia of vehicle body | ton·m2 | 40 | |
| Rolling moment of inertia of vehicle body | ton·m2 | 8.2 | |
| Un-sprung mass of front axle | ton | 0.525 | |
| Un-sprung mass of middle axle | ton | 1.05 | |
| Un-sprung mass of rear axle | ton | 1.05 | |
| Spring constant of suspension of front axle | kN/m | 250 | |
| Spring constant of suspension of middle axle | kN/m | 500 | |
| Spring constant of suspension of rear axle | kN/m | 500 | |
| Damping coefficient of suspension of front axle | kN·s/m | 10 | |
| Damping coefficient of suspension of middle axle | kN·s/m | 15 | |
| Damping coefficient of suspension of rear axle | kN·s/m | 15 | |
| Spring constant of the tire of the front axle | kN/m | 600 | |
| Spring constant of the tire of the middle axle | kN/m | 1200 | |
| Spring constant of the tire of the rear axle | kN/m | 1200 | |
| Damping coefficient of the tire of the front axle | kN·s/m | 2 | |
| Damping coefficient of the tire of the middle axle | kN·s/m | 4 | |
| Damping coefficient of the tire of the rear axle | kN·s/m | 4 |
| Standards of Road Roughness | |
|---|---|
| Very good | |
| Good | |
| Average | |
| Poor | |
| Very poor |
| Section | ||||||
|---|---|---|---|---|---|---|
| Middle span | 1.249 | −0.452 | −0.061 | 0.032 | 0.341 | 0.020 |
| Side span | 2.153 | 0.544 | 0.080 | 0.021 | 0.065 | 0.008 |
© 2019 by the authors. Licensee MDPI, Basel, Switzerland. This article is an open access article distributed under the terms and conditions of the Creative Commons Attribution (CC BY) license (http://creativecommons.org/licenses/by/4.0/).
Share and Cite
Cui, C.; Ma, R.; Hu, X.; He, W. Vibration Analysis for Pendent Pedestrian Path of a Long-Span Extradosed Bridge. Sustainability 2019, 11, 4664. https://doi.org/10.3390/su11174664
Cui C, Ma R, Hu X, He W. Vibration Analysis for Pendent Pedestrian Path of a Long-Span Extradosed Bridge. Sustainability. 2019; 11(17):4664. https://doi.org/10.3390/su11174664
Chicago/Turabian StyleCui, Chuanjie, Rujin Ma, Xiaohong Hu, and Wuchao He. 2019. "Vibration Analysis for Pendent Pedestrian Path of a Long-Span Extradosed Bridge" Sustainability 11, no. 17: 4664. https://doi.org/10.3390/su11174664
APA StyleCui, C., Ma, R., Hu, X., & He, W. (2019). Vibration Analysis for Pendent Pedestrian Path of a Long-Span Extradosed Bridge. Sustainability, 11(17), 4664. https://doi.org/10.3390/su11174664