Abstract
To find sustainable technology in various areas, we propose an analytical methodology based on data envelopment analysis (DEA) and the state space model (SSM). DEA is an analytical method used to compare the efficiencies and performances of several items. In DEA, for sustainable technology analysis, the items of DEA can be the technological keywords or international patent classification (IPC) codes in patent documents. In this paper, the proposed method is used to find the relative performance of different patent keywords using comparison and evaluation. We apply this methodology to compare the technological efficiencies between patent keywords for sustainable technology analysis. We apply the additive model and directional distance function of DEA to develop the proposed methodology for building the technological structure of target technology. In addition, we forecast the future trend of target technology using the SSM and find the area of sustainable technology by its result. The SSM is well suited for time series forecasting on technology analysis. We extract the IPC codes from patent documents for the SSM. In our research, we combine the results of DEA and the SSM to find the area of technological sustainability. To illustrate the validity and performance of our research, we conduct a case study using the patent documents used and registered by Apple.
1. Introduction
Researchers have been trying to forecast future technology for various purposes [1]. For example, using the results of technology forecasts, a company can undertake a variety of technological innovations to improve its technological competitiveness in the market [2]. The ability to predict the future state of technology can have a significant impact on a company. Thus, technology forecasting enables companies to develop better research and development (R&D) strategies. It may also identify potential business opportunities in the market and provide the opportunity to identify a new product. Recently, various methods for technology forecasting have been researched in diverse fields using statistics and machine learning algorithms [2,3,4,5]. Researchers have used graphical methods, ensemble modeling, Bayesian inference, and copula modeling to analyze patent documents for technology analysis, because a patent contains many examples of developed technology [6]. In this paper, we introduce a methodology for technology forecasting by analyzing patent document data.
We consider additive model and directional distance function of data envelopment analysis (DEA) for technology analysis. In previous research, DEA was used for constructing patent-enhancing strategies in Korean industries [7]. It has been used to find the empirical measure of productive efficiency for a decision-making unit (DMU) [8,9], and in this study, we use this method for patent data analysis. In our research, this unit can be considered to be one of many items, such as patent keywords, representing the sub-technology. Our research proposes a new method to address the technological relation between patent keywords to support R&D planning in the management of technology (MOT). In this study, we conducted two analyses of additive model and directional distance function and combined these results to understand the sustainable technology in a given target domain. We also considered the state space model (SSM) to forecast the future state of technology. This is similar to the hidden Markov model (HMM), and the only difference from the HMM is the use of a continuous value for the hidden state. The SSM is very well suited for time series forecasting [10].
In this paper, we used a local level model as the SSM for sustainable technology analysis. This model is based on Gaussian distribution and provides good results for time series forecasting of technology. The input data applied to the SSM are the international patent classification (IPC) codes containing detailed information about developed technology. An IPC code is defined by its corresponding technology [11]. Finally, we combine the results of DEA and the SSM to find technological sustainability. Sustainable technology is a technology sustaining the technological competitiveness of a nation or company in the global market [5,12,13,14,15,16]. The goal of this paper is to find the sustainable technology structure of a target domain using DEA and the SSM. To illustrate the validity and performance of our study, we conducted a case study using the patent documents used and registered by Apple, because Apple is one of leading companies in technological innovation [17].
The remainder of this paper is organized as follows. First, we explain the research background related to our paper in Section 2. In Section 3, we explain the proposed methodology of our research. We also show the result of our case study of Apple’s patent data in Section 4. Lastly, in Section 5, we present our conclusions and discuss our future work related to sustainable technology analysis.
2. Research Background
2.1. Data Envelopment Analysis
In 1978, Charnes, Cooper, and Rhodes introduced a method related to operations research called data envelopment analysis [8]. DEA has been actively used by many companies and organizations for the effective measurement and evaluation of organizational performance. The problem in DEA is characterized by the number of decision-making units (DMUs), size of input and output, and percentage of extreme efficient units in the data. DEA is a nonparametric method used in operations research or economics for the performance estimation of production. DEA is also a method used to evaluate the efficiency of a set of DMUs transforming inputs into outputs. The inputs and outputs are represented by and , respectively. A DMU produces outputs Y from inputs X, and the efficiency is defined as follows [18]:
where V and are the weights for inputs and outputs. The V and U are determined by linear programming called multiple form as follows [8,18]:
where () and () are larger than or equal to 0, respectively. In DEA, the highest efficiency is set to 1, and the relative ratio to this value is calculated and used for analysis. If the value of the objective function is equal to one or close to one, the evaluated DMU is efficient. It is used to measure the productive efficiency of a DMU. In our study, DMU is a technology; it has control over its inputs—the occurred frequencies of technological keywords. DMU can also be expected to have control over its outputs—the technological performances of technological keywords. The technique of DEA is based on linear programming to evaluate the efficiency of a technological keyword in target technology. The strategy of DEA is determined by controlling the inputs and outputs of the DMU. After determining the strategy, DEA is performed on the observed units using linear programming [8,9,19].
2.2. Sustainable Technology
Most companies have built and implemented enterprise-wide strategies for sustainability and are committed to developing sustainable technology. Sustainable technology is a technology that can sustain the technological competitiveness of a company [2]. Leading companies, such as Apple or Samsung, have carried out technological innovation continuously with respect to their sustainable technologies. Many studies related to sustainable technology have been performed in diverse technology domains. Jun (2018) proposed Bayesian count data modeling for finding technological sustainability [2]. This applied Bayesian inference and Poisson probability model to the proposed method for extracting technological relations between technologies. Park et al. (2015) developed a network model for selecting sustainable technology [5]. They used graph theory and social network analysis for their proposed model, and international patent classification codes as input data. Kim et al. (2015) introduced various growth curve methods for technology management of the defense industry [13]. They also combined the Delphi technique with surveys and applied the combined results to the growth curve model. In addition, sustainable technology analysis using various analytical techniques has been performed in diverse technology fields [4,12,14,15,16].
3. Sustainable Technology Analysis Using Data Envelopment Analysis and State Space Models
In this paper, we propose a new methodology for patent data analysis for sustainable technology analysis. First, we applied the additive model and directional distance function of DEA to the proposed methodology. We also used patent document data as input data for the DEA model, because patents have detailed and rich information about developed technology, such as the titles, abstracts, claims, inventors’ names, applied and issued dates, figures, etc. [1,6]. After determining the target technology, we collected the patent documents related to the target technology from patent databases all over the world [20,21]. Next, we extracted patent keywords from the patent documents. The keywords represent various sub-technologies related to the target technology. In the process of preprocessing keyword data, we use various text mining techniques based on R data language and its provided package [22,23]. Our text mining process is shown in Figure 1.

Figure 1.
Preprocessing via the text mining technique.
Using the preprocessing of Figure 1, we obtain a patent–keyword matrix consisting of patent (row) and keywords (column), and each element of this matrix represents the frequency of a keyword in each patent document. This matrix is used as input data for EDA. The keywords and patent are used for variables and observational items in our model. We consider the additive model of DEA to analyze the patent keyword data to find technological structure in the target technology.
The additive model maximizes outputs and minimizes inputs at the same time [23]. The vector is optimized as follows [9,19,24,25,26,27,28]:
where si and s0 are the input and output slack vectors, respectively, and e and e’ are conformable vectors. The dual problem to the above model is shown as follows [9,19,24,25,26,27,28]:
As we maximize the input and output slacks simultaneously, the units in the optimal basis of Equation (2) are always Pareto–Koopmans efficient unlike in the case of the oriented models [24]. Using this model, we find the efficiency of each patent keyword. We use another method of DEA to obtain the efficiency of the technology keyword. This is directional distance function. The directional output distance function is the output-oriented version of the benefit function [29,30,31]. The benefit function is applied to diverse optimization areas. The directional distance function is a generalized form based on a radial model as follows [32,33]:
where and are direction vectors related to x (input) and y (output) and B is un-efficiency measure. This is formulated on undesirable outputs as follows [32,33]:
Equation (4) shows a directional between good (y) and bad (b) outputs. Using a direction vector , we control the bad outputs (b). In addition, all direction vectors are non-negative. We control the good and bad outputs at the same time. Both have meaning in technology analysis. In the process of finding the final sustainable technology area, good output strengthens the technology association, and bad output weaken the association. In our study, we combine the results of the additive model and directional distance function to find the technological sustainability in the target technology. The technological structure between two keywords X and Y is shown in Figure 2.
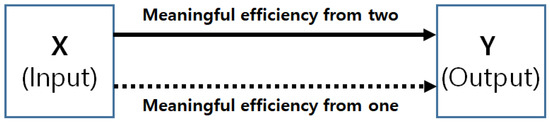
Figure 2.
Technological structure between two keywords.
In Figure 2, the input keyword X affects the output keyword Y by two results of the additive model and directional distance function. The solid line shows a meaningful efficiency in both models, and the dotted line shows a case in which only one model has significant efficiency. That is, the solid line shows a greater influence. We can build this structure between all the keywords related to the target technology. The following procedure summarizes the proposed method described above.
Step 1: Determining the target technology;
Step 2: Collecting patent documents related to the target technology;
Step 3: Preprocessing collected patent documents using text mining techniques;
Step 4: Extracting technological keywords for constructing the patent–keyword matrix;
Step 5: Performing additive model using the patent–keyword matrix;
Step 6: Performing directional distance function using the patent–keyword matrix;
Step 7: Combining the results of Step 5 and Step 6 to find the technological structure
Step 8: Building R&D strategy for the technological sustainability of the target technology.
In next case study, we will determine five variables (technological keywords) that are used for variables X and Y. Holding variable Y as constant, we change variable X through the other four variables and observe how they interact with variable Y, respectively. Then, we obtain the results of each interaction and visualized them. We search the patent documents used and registered by Apple. Using text mining techniques, we also extract keywords and built structured data. This data type is a matrix of patents (rows) and keywords (columns). The element of this matrix is the frequency value of a specific keyword in the patent document. We use this matrix for input and output measurements of DEA.
In this paper, we evaluate the state space model as another approach to patent analysis for sustainable technology. The SSM is similar to the hidden Markov model (HMM), and the only difference is that the hidden state of the HMM is discrete and the state of the SSM is continuous. The general form of the SSM is as follows [10]:
where , , and are the hidden state, input, and observation, respectively. G and H are the transition and observation models. and are the noises of system and observation at time t. The goal of the SSM is to estimate the belief state and predict future observation using the beliefs of the hidden state. To understand the technological trend for sustainable technology, we use the SSM for time series forecasting, because the SSM is an efficient approach to time series forecasting [10]. The SSM makes a generative model using hidden variable integration and posterior prediction. This is local level model based on Gaussian distribution as follows [10]:
where and are already explained in Equation (5) and and are distributed to Gaussian with same mean 0 and variances and , respectively. The forecasting process of the local level model is carried out as follows:
In our research, we develop a structural time series model (local level model) to find the technological trend. In this paper, we use the international patent classification codes by year in the time series model, because the IPC codes contain various technological descriptions on the target domain. We combine the results of DEA and the SSM to find technological areas for technological sustainability of a company. Thus, the final goal of our research is to build the R&D strategy for the technological sustainability of the target technology. A company can improve its technological competitiveness in the market using the results of our research. Next, we illustrate a case study implementing our proposed method. In this study, we show the technological efficiencies of five patent keywords (system, data, device, media, user) using DEA. We also illustrate the technological structure of high-ranked IPC codes using the SSM. Combining the results of DEA and the SSM, we find sustainable areas of the given technology.
4. Case Study
To show the performance and validity of our research, we carried out a case study on Apple technology. We retrieved patent documents used by Apple [20,21]. The documents used in this study were filed between 1980 and 2010. We used R and its Package to compute the efficiencies by using additive model and directional distance function [22,23,34]. First, we extracted the technological keywords from the retrieved patent documents via text mining techniques [22]. Based on expert opinions and previous studies [3,35], we identified five key keywords as follows: system, media, data, user, and device. They represent Apple’s sub-technologies. Using them, we performed five experiments using DEA. For each experiment, we changed the combination of keywords used as input and output variables. We did so to understand the association between Apple’s sub-technologies and the keywords. In this paper, we conclude that these five technology keywords are the basis of the technology that supports Apple’s innovative products. In addition, the keywords were used as variables in our models. Each keyword represents a sub-technology of Apple. For example, the data keyword represents the Apple technology related to data collecting, integrating, preprocessing, analyzing, visualizing, etc. We used a total of 8114 patent documents associated with DMUs. We applied additive model and directional distance function to measure productivity for the efficiency of Apple technological keywords. Table 1 shows the results of an additive model in which the Y variable is system and the others are X variables.

Table 1.
Result of additive model: Y = system, X = (media, data, user, device)
We maintained variable Y (system) as a constant and changed variables Xs (data, device, media, user). As the results shown in Table 1, all the Xs has a technological impact on system. However, during the first 10 years, only media had an impact on the system, and its effect was mainly on its stability. More precise implications occurred after 1990, except for device. The variable of data had two peaks and its trend showed growth peak and then decline with 2010 being the most substantial time. With respect to the variable device, the apparent impact occurred around 2000, and its roughest time occurred approximately in 2009 then decreased in approximately 2010. For the media variable, a peak occurred around 1992 and then reduced to zero. After 1995, it increased steadily and tended to stabilize. In 2005, it reached its highest essential time and then decreased. For the user variable, the peak occurred around 1993, and after 1996, the growth tended to stabilize and then reduce. Figure 3 illustrates the results of the directional distance function for Y = system and X = (media, data, user, device).
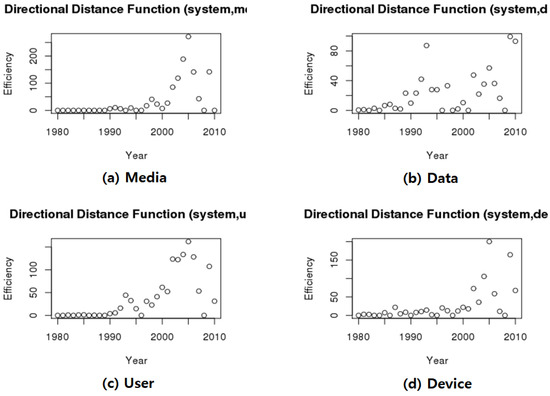
Figure 3.
Result of directional distance function: Y = system, X = (media, data, user, device).
According to the results of the directional distance function, during the first 10 years, there was no impact for all the variables. After 1990, the growth trend was similar to the additive model, except for the media variable. The media variable had no obvious impacts before 2000, but after 2000, it increased rapidly and arrived at its peak in 2005 before decreasing. Using the results of the additive model and directional distance function, a diagram of the technological sustainability of system is shown in Figure 4.
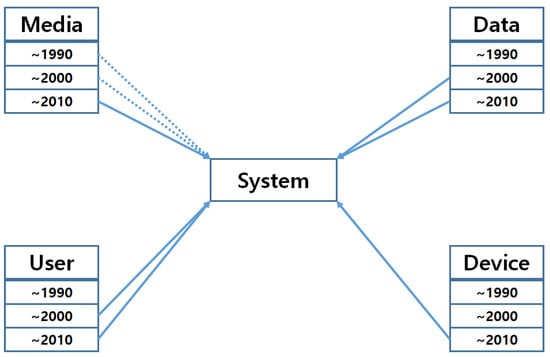
Figure 4.
Diagram of the technological sustainability of system.
The solid line shows efficiency in both the additive model and directional distance function, and the dotted line shows efficiency in one of the two results. Therefore, system technology was continuously influenced by the media technology, and it can be seen that it was affected by user and data technologies recently. Next, the results of the additive model in which the Y variable is the media and the X variables are system, data, user, and device are shown in Table 2.
Table 2.
Result of additive model: Y = media, X = (system, data, user, device).
In Table 2, the growth trends of all variables are similar. There was no impact before 1990, and the impact increased rapidly after 1990 until it peaked in 1995. Then it decreased around 2000. There was increased fluctuation after 2000. This was because the rates of fluctuation are different. Figure 5 shows the results of the directional distance function for media (Y variable).
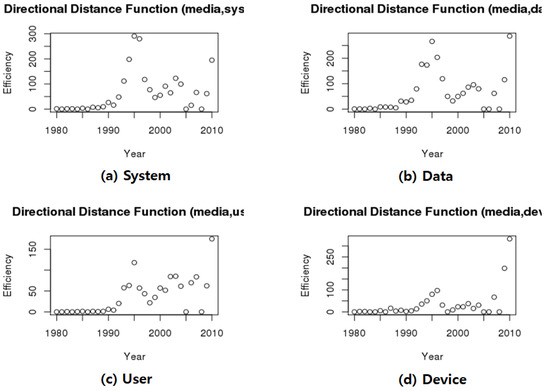
Figure 5.
Result of directional distance function: Y = media, X = (system, data, user, device).
According to the results of the directional distance function in Figure 5, the main growth trends were similar to the additive model; the scale of efficiency was merely less than that in additive model. From the results of Table 2 and Figure 5, we developed a technological diagram for the model in which media was the Y variable and others were the X variables (system, media, user, device) in Figure 6.
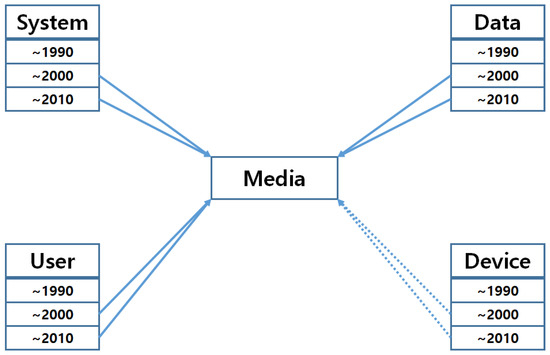
Figure 6.
Diagram of the technological sustainability of media.
We found that the technology of media was affected by system, data, and user strongly and influenced by device technology weakly. Next, Table 3 provides the result of Y (data) and X (system, media, user, device) using the additive model.
Table 3.
Result of additive model: Y = data, X = (system, media, user, device).
In Table 3, there was no impact in the first 10 years except the media variable. The media variable had a stability effect in the first 10 years. Then, around 1990, it arrived peak and decreased to zero. In the following years, it increased steadily and declined after 2005. For the system variable, its peak was reached in around 1995. Then it reduced but also steadily grew over the next few years. With respect to the device variable, it increased around 1995, showing slow but steady growth. The user variable steadily increased around 1995 and remain unchanged for around five years. It was peaked in 2005 and then decreased to zero. Another result of the data keyword (variable Y) by the directional distance function is shown in Figure 7.
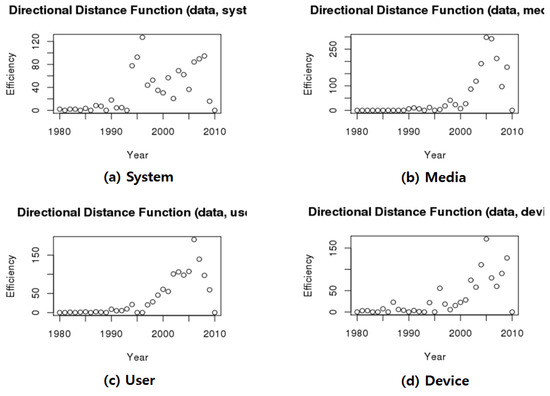
Figure 7.
Result of the directional distance function: Y = data, X = (system, media, user, device).
According to the results of the directional distance function in Figure 7, the main impact was similar to that of the additive model except with respect to the media variable. The efficiency of the media began at zero and stayed in this situation for around 20 years. After 2000, it increased rapidly and peaked in 2005, before decreasing to zero. Using the results of Table 3 and Figure 5, we built a diagram of the sustainable technology of data, as shown in Figure 8.
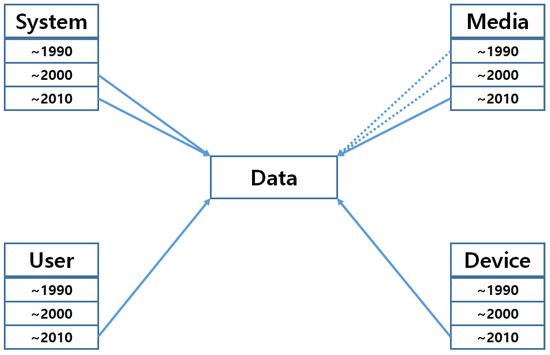
Figure 8.
Diagram of the technological sustainability of data.
Based on Figure 6, we knew that data technology was most affected by media technology. Moreover, media technology had the least impact on data technology. Thus, the system and user have influenced data technology continuously since 1990. Table 4 represents the additive model results with respect to user technology.
Table 4.
Result of additive model: Y = user, X = (system, media, data, device).
According to the additive model result in Table 4, comparing data with the system, the primary growth trends were similar. There was no efficiency in the first 10 years, but after 1990, it increased and peaked in 1995, before decreasing to zero. The main difference was that the data variable increased stability, but the system variable showed increased fluctuation from 2000 to 2005; after 2005, the data variable multiplied, but the system variable increased slowly. The device variable appeared to show inefficiency before 2010 before demonstrating a sudden increase in influence in 2010. For the media variable, the first 10 years were efficient, and the growth rate fluctuated until 2010; the peak occurred around 2005. In addition, we visualized the result of the directional distance function for the user variable in Figure 9.
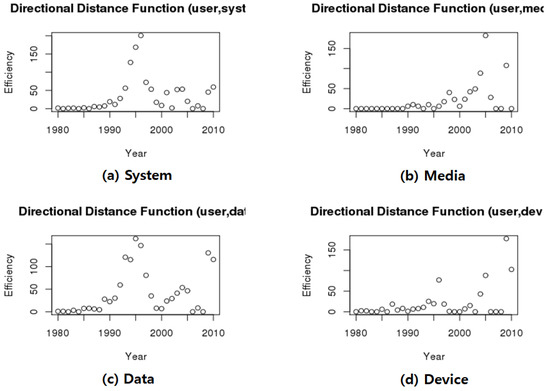
Figure 9.
Result of the directional distance function: Y = user, X = (system, media, data, device).
According to the results of the directional distance function in Figure 9, the main trends were similar to the results of the additive model except for the media variable. There was no significant impact before 2000. After that, the fluctuation increased until 2010, and the peak occurred around 2005. Figure 10 shows the technological diagram for the sustainability of user technology.
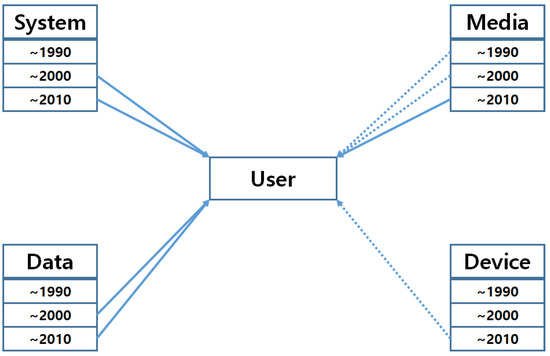
Figure 10.
Diagram of the technological sustainability of user.
In Figure 10, it can be observed that the technology of the media affected the technology of the user continuously. Since 1990, system and data technologies have had strong impacts on user technology. On the other hand, it can be seen that device technology had a weak influence on user technology after 2000. Lastly, we show the results of the additive model for device (Y variable) in Table 5.
Table 5.
Result of additive model: Y = device, X = (system, media, data, user).
In the results of Table 5, it is apparent that all the variables were inefficient during the first 10 years. Comparing data with the system, the overall increasing trend was same, it increased after 1990, and the peak arrived around 1995 and then decreased until 2000. After 2000, it grew slowly but steadily. The singular difference was that the scale of efficiency for the system was higher than that for data. Comparing media with user, the growth trend before 2000 was similar. However, after 2000, media is increased rapidly and peaked at 2005 before decreasing to zero. The user also changed after 2000 but insignificantly; the maximum was reached around 2005, and then it quickly reduced. The result of the directional distance function for device is represented in Figure 11.

Figure 11.
Result of the directional distance function: Y = device, X = (system, media, data, user).
According to the results of the directional distance function in Figure 11, the main growth trends were similar to the additive model for all the variables. So, we constructed a diagram of the sustainable technology for the Y variable (device) and X variables (system, media, data, user) in Figure 12.
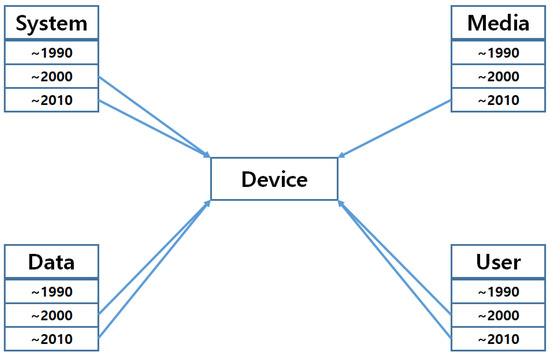
Figure 12.
Diagram of the technological sustainability of device.
In Figure 12, the technology of device was influenced by the technologies of system, data, and user continuously since 1990. Using all the results of the additive model and the directional distance function, we show the efficiency ranking of the Y and X variables in Table 6.
Table 6.
Efficiency ranking of the Y and X variables.
In this paper, we determined that Apple’s technology consists of five sub-technologies (system, media, data, user, and device), and we computed the mutual efficiency of the five technologies. In Table 6, we found that the media, system, and data technologies are important for the technological sustainability of Apple. Next, we performed the SSM using R and its packages related to SSM [23,36,37,38,39]. We selected top four IPC codes from Apple’s patent documents.
We identified the technological definition of each IPC code in the World Intellectual Property Organization (WIPO) [11]. Table 7 represents the major technologies of Apple by IPC code. Thus, we used these four IPC codes for the SSM. Figure 13 shows the technological trends of the observed, smoothed, and forecasted levels, as well as 50% probability limits.
Table 7.
Four international patent classification (IPC) codes of Apple’s patents.
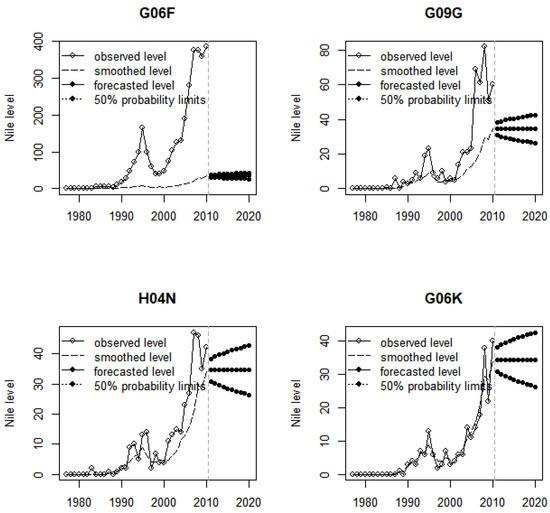
Figure 13.
Forecasts and probability limits of the four IPC codes.
The forecasted levels of G06F and G09G were smaller than the observed levels. In addition, the forecasted level of H04N did not reached the observed level. In comparison, the forecasted level of G06K tended to increase compared to the observed level. From the result show in Figure 13, we know that Apple should keep sustaining technology based on G06K to increase technological competitiveness. We also show the prediction errors of the four IPC codes in Figure 14.
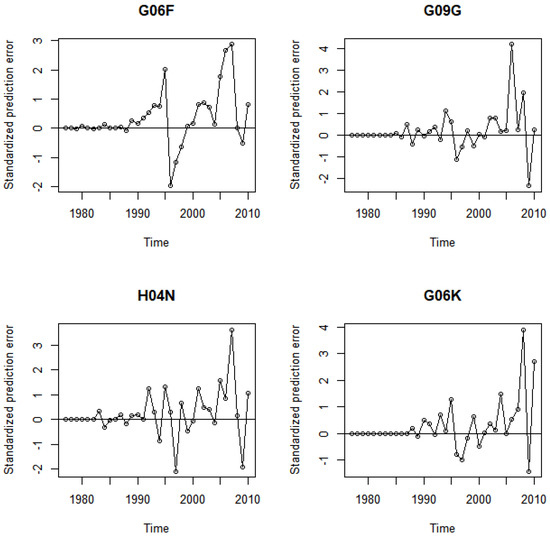
Figure 14.
Prediction errors of the four IPC codes.
We know that prediction errors have been getting bigger in recent years than in the past. A large error means that the risk is high. However, from a sustainability point of view, it is necessary to constantly manage technological areas with a large error (risk). In the results of Figure 14, we found that the technological risks of H04N and G06K were larger than those of the other IPC codes. So, we should manage technologies based on H04N and G06K. Lastly, we present the sustainability forecasts for the four IPC codes using the forecasts and probability limits via the SSM in Figure 15. From the results of Figure 13, Figure 14 and Figure 15, we found that technologies based on H04N and G06K are important for the sustainability of Apple’s technologies.
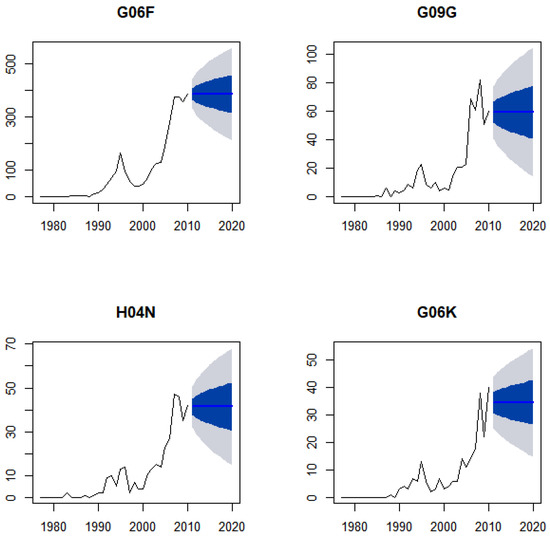
Figure 15.
Sustainability forecasts for the four IPC codes.
From the result of Figure 15, we can see the growth potential of the H04N and G06K codes. This is because their forecast trends show an upward trend until 2020. To understand Apple’s technological sustainability, we must simultaneously consider the results of DEA and the SSM. Figure 16 shows the combined results of the two approaches.
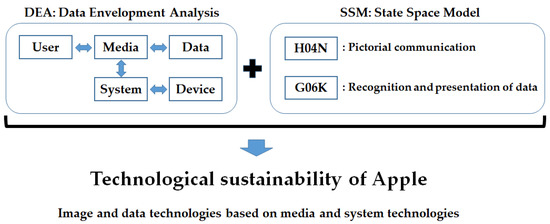
Figure 16.
Technological sustainability of Apple.
In Figure 16, the DEA results provide the technological relationship between patent keywords of Apple. We considered only the first relation between technological keywords from the efficiency ranking of the DEA results. It can be seen that the media keyword has a technological relation with the user, data, and system keywords. In addition, the system and device keywords are connected to each other. From the DEA perspective, we have confirmed that media and system technologies are important factors in Apple’s technological sustainability. From the perspective of the SSM, we found that two IPC codes, H04N and G06K, are important for Apple’s sustainable technology. The IPC codes of H04N and G06F represent the technologies of ‘pictorial communication’ and ‘recognition and presentation of data’, respectively. Therefore, Apple needs to continue to research and develop ‘image and data technologies based on media and system technologies’ for its technological sustainability.
5. Conclusions
In this study, we proposed a methodology consisting of two models, DEA and the SSM, to analyze the technological relationship of the target technology. We used patent keywords and IPC codes extracted from patent documents for the proposed methodology. The target domain of our case study is Apple technology, because Apple is one of the leading companies in the technological innovation markets. We considered Apple’s top five keywords (system, data, user, device, media) and four IPC codes (G06F, G09G, H04N, G06K) in our case study. Of course, the list of keywords used by the analyst can be changed, but the method of constructing the technological structure between given keywords can follow the proposed steps in this paper. Using the results of DEA, we found technological relationships between sub-technologies (patent keywords). In addition, we forecasted the future trends of sub-technologies (IPC codes) via the result of the SSM. In the DEA result, we could see that technologies based on ‘media’ and ‘system’ are connected to each other and others. This means that Apple needs to research and develop these areas for the sustainability of Apple’s technology. Furthermore, via the SSM result, we confirmed that technologies based on H04N (pictorial communication) and G06K (recognition and presentation of data) are important to Apple’s technological sustainability. Finally, by combining the results of the two analyses, we were able to identify ‘Image and data technologies based on media and system technologies’ as Apple’s sustainable technology.
In this paper, we extended the usage of traditional DEA to sustainable technology analysis. We used technological keywords extracted from patent documents as DEA input and output variables. This is a new attempt, different from existing DEA. For a technological keyword that becomes the output variable, all other keywords are input variables. The relative efficiency of the input keywords with respect to the technological keyword corresponding to the output variable was evaluated, and the sub-technologies for constructing the sustainable technology were defined by searching for the keywords corresponding to the high-ranked input keywords. The frequency values of the technological keywords were used to measure the consumption and gain for DEA at the same time. In addition, in this paper, sustainable technologies were presented comprehensively, considering both the results of the SSM, as well as the DEA. In our future research, we plan to apply Bayesian inference to the traditional SSM to improve the predictive performance of the general SSM and to consider non-Gaussian distributions for more sophisticated modeling. We will also study more advanced and hybrid models using statistics and machine learning algorithms, such as Bayesian inference with Markov chain Monte Carlo (MCMC) and deep learning with convolutional neural network (CNN).
Author Contributions
J.-M.K. and B.S. designed this research and collected the data set for the experiment. S.J. analyzed the data, wrote the paper, and performed all the research steps. All the authors cooperated to revise the paper.
Funding
This research was supported by Basic Science Research Program through the National Research Foundation of Korea (NRF) funded by the Ministry of Education (NRF-2017R1D1A3B03031152).
Conflicts of Interest
The authors declare no conflicts of interest.
References
- Roper, A.T.; Cunningham, S.W.; Porter, A.L.; Mason, T.W.; Rossini, F.A.; Banks, J. Forecasting and Management of Technology, 2nd ed.; John Wiley & Sons: Hoboken, NJ, USA, 2011. [Google Scholar]
- Jun, S. Bayesian Count Data Modeling for Finding Technological Sustainability. Sustainability 2018, 10, 3220. [Google Scholar] [CrossRef]
- Kim, J.; Jun, S. Graphical causal inference and copula regression model for Apple keywords by text mining. Adv. Eng. Inf. 2015, 29, 918–929. [Google Scholar] [CrossRef]
- Lee, J.; Kang, J.; Jun, S.; Lim, H.; Jang, D.; Park, S. Ensemble Modeling for Sustainable Technology Transfer. Sustainability 2018, 10, 2278. [Google Scholar] [CrossRef]
- Park, S.; Lee, S.; Jun, S. A network analysis model for selecting sustainable technology. Sustainability 2015, 7, 13126–13141. [Google Scholar] [CrossRef]
- Hunt, D.; Nguyen, L.; Rodgers, M. Patent Searching Tools & Techniques; Wiley: Hoboken, NJ, USA, 2007. [Google Scholar]
- Lee, B.; Won, D.; Park, J.; Kwon, L.; Moon, Y.; Kim, H. Patent-Enhancing Strategies by Industry in Korea Using a Data Envelopment Analysis. Sustainability 2016, 8, 901. [Google Scholar] [CrossRef]
- Chames, A.; Cooper, W.W.; Rhodes, E. Measuring the efficiency of decision making units. Eur. J. Oper. Res. 1978, 2, 429–444. [Google Scholar]
- Forsund, F.R.; Sarafoglou, N. On the origins of data envelopment analysis. J. Product. Anal. 2002, 17, 23–40. [Google Scholar] [CrossRef]
- Murphy, K.P. Machine Learning: A Probabilistic Perspective; MIT Press: Cambridge, MA, USA, 2012. [Google Scholar]
- International Patent Classification (IPC); World Intellectual Property Organization. Available online: http://www.wipo.int/classifications/ipc/en (accessed on 30 October 2018).
- Choi, J.; Jun, S.; Park, S. A Patent Analysis for Sustainable Technology Management. Sustainability 2016, 8, 688. [Google Scholar] [CrossRef]
- Kim, S.; Jang, D.; Jun, S.; Park, S. A Novel Forecasting Methodology for Sustainable Management of Defense Technology. Sustainability 2015, 7, 16720–16736. [Google Scholar] [CrossRef]
- Kim, J.; Jun, S.; Jang, D.; Park, S. Sustainable Technology Analysis of Artificial Intelligence Using Bayesian and Social Network Models. Sustainability 2018, 10, 115. [Google Scholar] [CrossRef]
- Park, S.; Jun, S. Statistical Technology Analysis for Competitive Sustainability of Three Dimensional Printing. Sustainability 2017, 9, 1142. [Google Scholar] [CrossRef]
- Uhm, D.; Ryu, J.; Jun, S. An Interval Estimation Method of Patent Keyword Data for Sustainable Technology Forecasting. Sustainability 2017, 9, 2025. [Google Scholar] [CrossRef]
- Jun, S.; Park, S. Examining Technological Innovation of Apple Using Patent Analysis. Ind. Manag. Data Syst. 2013, 113, 890–907. [Google Scholar] [CrossRef]
- Marinho, J.F.M.A.; Laurencel, L.C.; Amaral, M.R.S. Implementing DEA models in the R program. In Proceedings of the 11th International Conference on Data Envelopment Analysis, Samsun, Turkey, 28–30 June 2013; pp. 1–6. [Google Scholar]
- Banker, R.D.; Cooper, W.W.; Seiford, L.; Thrall, M.; Zhu, J. Returns to Scale in different DEA models. Eur. J. Oper. Res. 2004, 154, 345–362. [Google Scholar] [CrossRef]
- The United States Patent and Trademark Office (USPTO). Available online: http://www.uspto.gov (accessed on 1 November 2018).
- WIPSON. WIPS Corporation. Available online: http://www.wipson.com (accessed on 15 October 2018).
- Feinerer, I.; Hornik, K. Package ‘tm’ Ver. 0.7-5, Text Mining Package, CRAN of R Project. Available online: https://cran.r-project.org/web/packages/tm/tm.pdf (accessed on 1 August 2018).
- R Development Core Team. R: A Language and Environment for Statistical Computing; R Foundation for Statistical Computing: Vienna, Austria. Available online: http://www.R-project.org (accessed on 1 July 2018).
- Chames, A.; Cooper, W.W.; Golany, B.; Stutz, J. Foundations of Data Envelopment Analysis for Pareto-Koopmans efficient empirical production functions. J. Econom. 1985, 30, 91–107. [Google Scholar]
- Chames, A.; Cooper, W.W.; Thrall, R.M. A structure for classifying and characterizing efficiency and inefficiency in Data Envelopment Analysis. J. Prod. Anal. 1991, 2, 197–237. [Google Scholar]
- Chames, A.; Haag, S.; Jaska, P.; Semple, J. Sensitivity of efficiency classifications in the additive model of data envelopment analysis. Int. J. Syst. Sci. 1992, 23, 789–798. [Google Scholar]
- Chames, A.; Rousseau, J.J.; Semple, J.H. Sensitivity and stability of efficiency classifications in data envelopment analysis. J. Prod. Anal. 1996, 7, 5–18. [Google Scholar]
- Fried, H.O.; Lovell, C.A.K.; Schmidt, S.S. The Measurement of Productive Efficiency and Productivity Growth; Oxford University Press: New York, NY, USA, 2008. [Google Scholar]
- Luenberger, D.G. Benefit Functions and Duality. J. Math. Econ. 1992, 21, 461–486. [Google Scholar] [CrossRef]
- Luenberger, D.G. New Optimality Principles for Economic Efficiency and Equilibrium. J. Optim. Theory Appl. 1992, 75, 221–264. [Google Scholar] [CrossRef]
- Luenberger, D.G. Dual Pareto Efficiency. J. Econ. Theory 1994, 62, 70–85. [Google Scholar] [CrossRef]
- Cheng, G.; Zervopoulos, P. A Generalized Directional Distance Function in Data Envelopment Analysis and Its Application to a Cross-Country Measurement of Health Efficiency. Available online: http://mpra.ub.uni-muenchen.de/42068 (accessed on 1 July 2018).
- Chung, Y.H.; Färe, R.; Grosskopf, S. Productivity and Undesirable Outputs: A Directional Distance Function Approach. J. Environ. Manag. 1997, 51, 229–240. [Google Scholar] [CrossRef]
- Oh, D.H.; Suh, D. Package ‘nonparaeff’ Ver. 0.5-8, Nonparametric Methods for Measuring Efficiency and Productivity Package, CRAN of R Project. Available online: https://cran.r-project.org/web/packages/tm/tm.pdf (accessed on 1 August 2018).
- Korea Intellectual Property Strategy Agency (KISTA). Available online: http://www.kista.or.kr (accessed on 16 November 2018).
- Commandeur, J.J.F.; Koopman, S.J.; Ooms, M. Statistical Software for State Space Methods. J. Stat. Softw. 2011, 41. [Google Scholar] [CrossRef]
- Petris, G.; Petrone, S. State Space Models in R. J. Stat. Softw. 2011, 41. [Google Scholar] [CrossRef]
- Hyndman, R.; Athanasopoulos, G.; Bergmeir, C.; Caceres, G.; Chhay, L.; O’Hara-Wild, M.; Petropoulos, F.; Razbash, S. Package ‘forecast’ Ver. 8.7, Forecasting Functions for Time Series and Linear Models, CRAN of R Project. 2019. Available online: https://cran.r-project.org/web/packages/forecast/forecast.pdf (accessed on 1 May 2019).
- Petris, G.; Gilks, W. Package ‘dlm’ Ver. 1.1-5, Bayesian and Likelihood Analysis of Dynamic Linear Model, CRAN of R Project. 2019. Available online: https://cran.r-project.org/web/packages/dlm/dlm.pdf (accessed on 30 December 2018).
© 2019 by the authors. Licensee MDPI, Basel, Switzerland. This article is an open access article distributed under the terms and conditions of the Creative Commons Attribution (CC BY) license (http://creativecommons.org/licenses/by/4.0/).