Abstract
This research examines the overall performance achievement of social media marketing (SMM) in Bangladesh by determining whether social media is successful in creating brand consciousness (i.e., brand preference, brand attachment, brand association, and brand loyalty) toward online consumers, which in turn may lead to buying commitment. In total, 564 Bangladeshi consumers were surveyed to monitor their responsiveness toward social media-aided motivations. We selected the online buying environment in Bangladesh, which is an emerging market established less than one decade ago. We specifically choose the entire local fashion industry as our target market, excluding the websites of international fashion brands operated overseas. We used the holistic concept of the five aspects of SMM, namely, interaction, entertainment, customization, electronic word of mouth (eWOM), and trendiness. Moreover, we statistically calculated the performance of social media through the consequences of five measures, namely, brand loyalty, brand preference, brand attachment, brand association, and buying commitment. We used regular linear multiple regression, correlation, and descriptive statistics to obtain statistical results. The study found strong evidence that SMM efforts (SMMEs) of the local Bangladeshi fashion industry are successful in establishing consumer attachment and preference. However, they fail to secure committed buyers when the measurement scale is below 50%. In line with the results of previous studies on consumer loyalty, our results demonstrate that SMMEs fail to create committed buyers. Lack of loyalty and association drive consumers to become uncommitted buyers.
1. Introduction
The brick-and-mortar selling philosophy is currently surrounded by a virtual skeleton in which social media is vital in shaping the mindset of consumers. Thus, marketers use social media to determine the implicit and explicit needs of actual and potential consumers. Social media enhances consumer sophistication and helps consumers develop new ideas and tactics in searching, evaluating, selecting, and buying products and services [1]. Social media marketing (SMM) is a buzzword used to describe the market situation in our technologically developed world. Numerous studies analyzed the customer perception of online buying intention. As such, we specify four brand factors that may directly or indirectly affect sustainable customer retention, namely, brand association, loyalty, attachment, and preference. According to Lamberton and Stephen [2], social media in the business-to-consumer (B2C) context is vastly analyzed because of its developed constructs and concepts, which are vital in the lives of consumers [2]. Moon and Byungho [3] believed that social media platforms can serve as satisfactory marketing platforms for small and medium enterprises by providing access to large audiences at low costs. The increased popularity of social media considerably changed the marketing strategy of companies and shaped the B2C business [4].
This study attempts to analyze the effect or success of SMM efforts (SMMEs) on Bangladeshi consumers. This emerging market segment has adequate wealth, as identified by the booming economy and the increased buying power of consumers. Therefore, we use the SMME framework of Kim and Ko [5], which includes five dimensions to specify SMMEs, namely, entertainment, interaction, trendiness, customization, and electronic word of mouth (eWOM). Firstly, we examine entertainment, which has a positive effect on people’s attitudes. Entertainment increases interactions between brands and consumers, which in turn encourage active participation and consumers to enjoy their roles spontaneously [6]. Thus, interaction is used as the second measurement scale. Martin and Todorov [7] described social media customization as a tool used by companies to communicate the uniqueness and preferences of their brands and to ensure customer loyalty; thus, it is used as the third element in our study. Muntinga et al. [8] summarized that social media trendiness, which is the fourth measurement scale, is information that covers four motivations, namely, surveillance, knowledge, pre-purchase information, and inspiration. Our final measurement scale is e-WOM, which plays a vital role as a form of buzz marketing that can become viral if a message is sufficiently persuasive or amusing.
This study examines the local Bangladeshi fashion market by using the SMME framework to investigate the success of SMMEs in consumer retention by creating brand loyalty, brand association, brand preference, brand attachment, and buying commitment. We developed a model to describe our study by analyzing and reviewing previous studies. The research model is presented below (Figure 1).
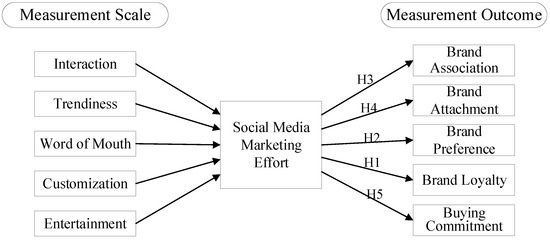
Figure 1.
Research framework to determine the effectiveness of social media marketing efforts (SMMEs).
Building and maintaining brand loyalty, which is consistently one of the central themes of market research, is our first measurement dimension [9,10]. Brand loyalty can be conceptualized as the final dimension of consumer brand resonance, which symbolizes the consumer’s ultimate relationship and level of identification with a brand. Brand preference refers to consumers’ selection of a specific company product or services in the presence of other, equally priced, and available options. Thus, brand preference is used as the second measurement dimension for our study. According to Isik and Yasar [11], brand preference is the extension of consumer favor toward the designed services provided by a specific company in comparison with services provided by other companies presented in a consideration set. Brand associations related to functions represent a considerable degree of abstraction compared to those that refer to attributes; thus, the former is more accessible and stays longer in the memory of consumers than the latter [12]. People with strong brand attachment can influence those around them, thereby leading to the final goal and dimension, which is buying commitment. However, by integrating social media, companies can undoubtedly enhance sales performance and achieve brand loyalty, preference, and association [13,14].
This study is designed with a compendious framework to determine whether the SMMEs of Bangladeshi fashion websites are successful in retaining customer loyalty. Individuals between the ages of 18 and 34 are active users of social media platform. Thus, they are included in the survey to determine the performance measures empirically. We also investigate whether the activities of SMMEs can create sustainable brand consciousness among the online consumers. We analyze five dependent factors, namely, brand attachment, brand preference, brand loyalty, brand association, and buying commitment, as well as the level of cognitive and affective responses to products, by using a statistical approach. As such, we aim to contribute to the growing body of literature on online buying and the effect of online store presentation on sustainable consumer retention.
The objectives of this study are as follows: (1) to measure SMM success in enabling Bangladeshi consumers to interact on social media and to become associated with and attached to local fashion brands; (2) to evaluate whether social media can successfully create loyalty via the online platforms of local fashion brands; (3) to analyze the performance of SMM in creating the products that suit consumer preference; (4) to measure whether Bangladeshi consumers are prepared to make online purchases or commit to buying local fashion products online, which is the ultimate sustainable goal of all marketing activity; and (5) to fill the gap in the existing literature. This empirical study analyzes the SMM activities of local fashion brands. The activities on the online stores of the best local fashion brands in Bangladesh, such as Rang, Aarong, Kay Kraft, and Dorjibari, are deemed to be promising. Social media is one of the best channels in promising promotional strategy for luxury and fashion brands [5,15,16].
The present study was conducted using a structural survey on Bangladeshi consumers who are familiar with luxury, non-luxury, local, and international fashion brands. Moreover, they have sufficient time and financial means to make purchases and interact online and have access to smart devices that can connect them with social media platforms. The remainder of the paper is organized as follows: Section 2 provides a brief literature review of previous studies. Section 3 explains the formulation of the hypotheses. Section 4 describes the methodology clearly, detailing the statistical procedures and the analytical testing of the hypotheses. Section 5 presents the results of the statistical analysis and hypothesis testing. Section 6 discusses the results of the study. Finally, Section 7 concludes the research with the final outcomes, managerial implications, practical implications, the scope and limitations of this study, and directions for future research.
2. Literature Review
2.1. Social Media Marketing and Its Five Measures
Social media is an internet-based application group established on the technological and ideological foundations of Web 2.0 that allows users to create and exchange their generated content [17]. In the marketing perspective, social media is a marketplace in which both sellers and buyers coexist with multiple facilities and interact in multifaceted ways with one another [18]. SMM refers to the practice of using social media technologies to communicate with consumers easily by offering lower costs, building personal relationships, and exchanging offerings. For example, customer ratings in the hotel industry have a strong effect on customer preference for which hotels to book [19].
Kim and Ko [5] identified five dimensions to specify SMMEs, namely, entertainment, interaction, trendiness, customization, and e-WOM, to analyze the acceptance of luxury brands. Agichtein et al. [20] explained that entertainment is the play and fun that emerges from the social media experience. According to Kim and Ko [15], entertainment has a positive effect on consumer attitude and the development of increased interactions between brands and consumers. The hedonic perspective views social media users as pleasure-seekers who are being entertained and who experience enjoyment [21,22]. The third measurement tool, namely, trendiness, is a social media tool for grabbing attention by providing customers with the most recent information on the latest trends [23]. Muntinga et al. [8] summarized that trendy information on social media covers four motivations, namely, surveillance, knowledge, pre-purchase information, and inspiration. Surveillance refers to the observation of the updates on the social environment of specific consumers. Knowledge refers to the information provided by brands to tell consumers about their products. Pre-purchase information refers to product reviews on brand communities, which can help consumers make the right buying decision. Finally, inspiration describes how consumers follow brand-associated information and obtain new ideas, which they consider as a source of inspiration [8].
Customization is effective for companies to increase interactions with customers by allowing them to design and customize products. Companies such as Gucci and Burberry provide a similar service for their customers. According to Schmenner [24], customization describes the degree to which a service is customized to satisfy individual preference. Burberry and Gucci made considerable use of their online presence by sending personalized messages to individual customers to enable them to customize their purchased product. According to Zhu and Chen [25], customization can be divided into customized messages and broadcasts based on a given message. Customized messages (e.g., Facebook posts) target a specific person or a small audience [26], whereas broadcasts send to a specific person who is interested [22].
E-WOM is defined as “the believability of the product position information contained in a brand, which depends on the willingness and stability of firms to deliver what they promise” [27]. Consumers tend to experience increased difficulty in evaluating the credibility of an online context based on reviews and comments, because reviewers are anonymous sources without prior relationship with the consumer [26,28]. Previous studies explored the influence of source credibility on perceived information with inconsistent results [29,30,31]. As such, the believability of the information on fashion websites will generate a positive perception in the minds of consumers. A website that is perceived to be credible is likewise perceived to be useful, thereby increasing consumers’ effective use of their time in obtaining their fashion-related information and purchase making.
Interaction is exchanging communication between brands and customers [32]. Kaplan and Heinlen [17] found that social interaction is an important factor in creating user-generated content. Social media can offer consumer assistance and spaces for the discussion and exchange of ideas [17,33]. Social media networks are social and virtual environments in which individuals and groups can communicate and share experiences. Monika et al. [34] demonstrated that Romanian emergency agencies promote transparency and institutional images on Facebook. By contrast stakeholders are most likely to engage with brand-oriented posts, especially if these posts also offer rich multimedia features. In contrast, stakeholders are less likely to interact with messages about natural hazards, particularly if they incorporate educational content. The subjective quality of the medium makes interactions social and salient, thereby increasing the social presence of customers, which in turn will likely enhance brand engagement. Below Table 1 comprises of some important researches in the field of social media marketing effectiveness in shaping consumer behavior.

Table 1.
Similar research on social media marketing effort (SMME).
2.2. Social Media Marketing and Brand Loyalty
Social media represents a new challenge for brands and consumer researchers because it presents a new form of the consumer–brand relationship [14,43,44]. Srinivasan et al. [45] examined that communities are highly effective in promoting by establishing word-of-mouth, exchanging information, comparing product experiences, seeking advice, and especially encouraging social relationships among members [45]. Interactions among and between members and brands largely influence consumers’ relationships with and attitudes toward the brand [46] to generate emotional connections with the social media network subject, thereby helping establish customer loyalty [47]. Similar effects are observed among social media users because consumers’ engagement behavior characterized by sharing, advocating, socializing, and co-developing in online brand communities by social media marketing is a significant non-transactional pathway to brand loyalty [48]. Social bonds established within brand communities create a special environment to develop communication strategies to cultivate consumers’ trust and customers’ loyalty [13,14,49,50,51,52].
2.3. Social Media Marketing and Brand Preference
The study of Ku et al. [53] indicated various reasons as to why individuals communicate with brands through social networking websites [53]. Individuals are rapidly increasing their daily use of the internet by engaging on social networks. However, academic studies about user and brand preference and loyalty via social media remain scarce [53]. Ryan and Jones [54] also proposed that marketing products and services using social media are cheap and generate a higher rate of return, thus making social media useful in creating efficient advertising campaigns to be connected with and preferred by the consumer [54]. Therefore, social media is an efficient use of marketing costs [55], which is important for even small and medium-sized enterprises (SMEs) because they are expected to have far smaller budgets than the larger companies. Moreover, firms use social media not merely to win the preference of new customers but also to maintain and retain their existing customers [36,56,57,58].
2.4. Social Media Marketing and Brand Association
According to McAlexander et al. [46], brand community integration is a multi-component concept that includes customer relationships with brands, products, companies, and other customers [46]. When the brand community is well integrated, socially aggregated members share both customer–brand [59] and customer–customer relationships [60]. Schau et al. [61] concluded that this dynamism generated within the community will create value for the brand to the consumer; thus, perceived association coming from the community leads to customer loyalty [61]. Brand image is widely agreed to be a set of customers’ perceptions of a brand as reflected by the brand associations held in memory [62,63,64]. These associations can originate from information obtained from market offerings or customers’ direct experiences shopping with the brand [62]. Customers’ sets of feelings, attitudes, and ideas about the brand are very important to their buying behavior [65,66,67]. Normann [68] argued that, together with the effects of advertising, word-of-mouth, and customers’ experiences with the products and services, brand association can affect customers’ minds on purchases [6]. A favorable brand association can both help the company to increase competition and encourage customers to make repeat purchases [69].
2.5. Social Media Marketing and Brand Attachment
According to Park et al. [70], attitude and attachment are important and different phenomena that plausibly relate to distinct behavioral intentions. Following this logic of Park et al. [70], we posit that attitude towards social media and attitude show different influences on social media outcomes. They demonstrated that brand attachment is distinct from brand attitude and that brand attachment provides incremental predictive value when attachment and attitude are considered together as predictors of behavioral intentions. In addition, they demonstrated that brand attachment is a better predictor of more difficult (versus less difficult) consumer behavioral intentions [32]. That is, brand attitude plays a considerable role in predicting less difficult consumer behaviors, whereas brand attachment plays an increasingly large role as behavioral intentions become progressively difficult to enact. These differential outcomes stem from theoretical differences in the constructs themselves [36]. However, the strength of attachment lies in the bond that connects social media with the self. By contrast with attitudes, the person’s judgment of the goodness or badness of social media determines its strength. Attachment requires a deep bond between the person and the attachment object [71].
2.6. Social Media Marketing and Buying Commitment
In the studies of Riemer and Lehrke [72] and Senecal and Nantel [73], it is clearly indicated that online recommendation systems have a significant influence on the buyer [72,73]. However, such systems are often biased based on findings in different markets [72,73]. Research also shows that reviews by a third party significantly affect the purchasing decision of consumers [74]. In fact, one of the main reasons that customer reviews have such an influence on sales is related to the value of information and the experience a customer has for a product or service [75]. Moreover, from the research of Reyes-Menendez [76], the relationship between willingness to pay and the quality of service is directly related to variables such as price [76]. This phenomenon can be shared by social media with consumers who are yet to have the experience. Research shows that a recommendation as a source of information strongly influences [73] a customer’s buying behavior. Online recommendations via social media strongly influence the online choice of product [73], thereby influencing the attitude toward positive premium prices.
3. Hypothesis Development
According to Khan and Mahmood [77], brand loyalty is the unconditional commitment of customers toward brands, which will lead to a strong bond between them. The benefits of brand loyalty include positive WOM [78] and business profitability [79]. Customer engagement by social media marketing [80,81,82] depicts that customer engagement includes both the direct (transactional) contribution of customer purchases and the indirect (non-transactional) contribution of customer referrals, influence, and knowledge. From the research of Brodie et al. [48], we understand that consumers who engage in non-transactional behaviors have substantial repeat purchases in transactional exchanges [48] because ‘‘engagement marketing may lead to more purchases or enhance customer–brand relationships by increasing customers’ trust, commitment, and satisfaction” [80]. Brands become irresistible and irreplaceable as they gain exclusive, positive, and prominent meanings in the minds of a large number of consumers, thereby winning their loyalty. Therefore, Hypothesis 1 (H1) was developed to shed light on the success of the holistic framework of Bangladeshi SMMEs.
Hypothesis 1. (H1)
The SMMEs of the local Bangladeshi fashion industry can successfully create brand loyalty among Bangladeshi consumers (brand loyalty).
Isik and Yasar [11] stated that brand preference is the extension of consumer favor toward the designed services provided by the specific company when compared with services provided by other companies presented in a consideration set. Self-image congruity was a very strong predictor of consumer brand preferences and a good predictor of consumer satisfaction. On this basis, we developed Hypothesis 2 (H2).
Hypothesis 2. (H2)
The SMMEs of the local Bangladeshi fashion industry can successfully influence and strengthen the preferences of Bangladeshi consumers (brand preference).
According to Belen et al. [83], brand associations differ from brand preference in terms of the level of abstraction, that is, by how much information is summarized or subsumed in their association. In line with this criterion, Keller [84] classified brand associations based on three major categories, namely, attributes, benefits, and attitudes. Attributes are descriptive features that characterize a brand, such as consumers’ perception of a brand and what its purchase or consumption entails. Benefits are the personal value that consumers attach to the brand attributes, that is, what consumers think a brand can do for them. Brand attitudes are consumers’ overall evaluation of a brand. Thus, we developed Hypothesis 3 (H3).
Hypothesis 3. (H3)
The SMMEs of the local Bangladeshi fashion industry can successfully create a positive brand association with the Bangladeshi consumer.
An individual’s emotional attachment (brand attachment) to a brand predicts his/her commitment to the relationship with that brand. Consumers with higher levels of self-image congruity are more likely to prefer a brand and enjoy higher levels of satisfaction than those with lower levels of self-image congruity [62]. Previous studies provided evidence for the positive effect of self-image congruity on the context of the tangible product (only for the actual and the ideal self-image congruity) in terms of overall attitude [85] and purchase intentions [86]. We developed Hypothesis 4 (H4) on the basis of this significant measure.
Hypothesis 4. (H4)
The SMMEs of the local Bangladeshi fashion industry can successfully create an emotional attachment toward brands among Bangladeshi consumers (brand attachment).
Fashion brands should provide a sense of emotional attachment with consumers to encourage their eagerness to make purchases. We examine the relationship between SMMEs and brand attachment of the Bangladeshi consumers to understand their buying behavior, as influenced by social media.
Finally, in terms of consumer buying commitment, firms are recognizing the pressing need to focus on building personal two-way relationships with customers who foster interactions through social media [87]. Customer engagement is recognized as an emotional connection between a company and its customers. Moreover, consumer engagement is focused on interactions with customers and their participation. The key element to customer engagement is knowledge exchange. Therefore, information and communication technologies can provide immense opportunities for organizations to exchange knowledge and engage with customers [88]. Such technologies can help marketers understand customer engagement as a psychological process that models underlying mechanisms via which loyalty toward a service brand is formed in new customers. Furthermore, they can assist in understanding the mechanism via which loyalty can be maintained to strengthen the buying commitment of customers toward a service or a brand [88]. We developed Hypothesis 5 (H5) on the basis of this climacteric measure.
Hypothesis 5. (H5)
The SMMEs of the local Bangladeshi fashion industry can successfully influence Bangladeshi consumers to become committed buyers (buying commitment).
This hypothesis focuses on the ultimate goal of SMMEs, that is, whether it is successful in generating revenue by influencing positive buying intention among consumers.
4. Methodology
The objective of this study was to examine whether SMMEs of local Bangladeshi fashion brands can influence consumer online purchase. We used the five SMME measurement tools described by Kim and Ko [5] as independent variables to construct the research model to determine the perception of consumers. We constructed a structured questionnaire and distributed 700 forms, among which approximately 564 proper responses were returned and used for measurement. The data were collected carefully through online and face-to-face surveys. The responses were used for correlation, ordinal chi-square, and multiple regression analyses in the SPSS 21 Statistical Software.
4.1. Data Sampling
We focused on three demographic variables, namely, gender, age, and years of buying online. These variables led to the five dependent measures, namely, brand association, attachment, preference, loyalty, and buying commitment. Consumers’ buying commitment was used to determine the success of SMMEs in these five different arenas. We took the entire local Bangladeshi fashion industry and set the demographics of the respondents according to different age groups. We selected individuals who were buying online for at least 1–3 years and had a considerable presence on social media. Firstly, we asked the participants whether they were regular online buyers. Table 2 shows the demographic structure of the respondents. Among the 564 respondents, 49.6% were female, and 50.4% were male. Next, we carefully chose respondents who were between the ages of 18 and 34 years to obtain responses from those who actively used online applications. Table 2 shows that most of the respondents were between the ages of 29 and 33 years. Among the respondents, 89% said that they used Facebook and Instagram to follow fashion brand advertisements, and 91% said that they searched for local Bangladeshi fashion brand websites regularly. The respondents generally followed over 83 fashion brands, among which 23 were local Bangladeshi brands. Over 82% of the respondents said that they visited the homepages of several brands multiple times a month, and 50% said that they visited the sites weekly.
Table 2.
Demographic structure of respondents.
4.2. Descriptive Data
The five holistic measurement scales of entertainment, trendiness, interaction, customization, and e-WOM, taken from the research of Kim and Ko [5], obtained the following results: mean (M) = 6.712, SD = 2.77; M = 6.98, SD = 2.37; M = 5.95, SD = 2.97; M = 10.79, SD = 2.93; and M = 15.48, SD = 2.25, respectively. Entertainment, trendiness, and interaction had two measurement scale dimensions, whereas customization and e-WOM had three dimensions, which were relevant for the outcome. The outcome measurement scales, namely, buying commitment, brand loyalty [2], brand association, brand attachment [12], and brand preference [14], were spread as M = 12.80, SD = 3.32; M = 7.42, SD = 1.80; M = 7.50, SD = 1.64; M = 8.78, SD = 2.09; and M = 10.61, SD = 2.23, respectively. The means of the measurement scales were close to one another, except for customization and e-WOM, which outperformed the other three.
4.3. Validity Measure
We conducted a reliability test to ensure the acceptance of the research, and the results are shown in Table 3. We obtained a Cronbach’s alpha ≥0.7 for the SMME measures, highlighting their consistent reliability based on the accepted norm. Reliability is concerned with the consistency of measures used in data collection. Multiple indicators such as the Likert scale and the internal reliability test can be conducted using Cronbach’s alpha. Interaction (0.657), trendiness (0.639), and brand preference (−0.667) were below the benchmark; however, their values were very close to 0.7. On the other hand, brand association showed the lowest negative Cronbach’s alpha at −0.616. This result questioned the validity of the brand association measure, which led us to use the chi-square test for independence for the measurement scale in the analysis.
Table 3.
Validity measures of measurement scales (Cronbach’s alpha).
5. Analysis of Results
5.1. Measurement Instrument and Chi-Square Test
The questionnaire was developed based on a Likert scale model ranging from 1 (highly disagree) to 5 (highly agree) for possible responses to assess each component of the SMME and to measure the five selected measurement tools (i.e., brand attachment, brand preference, brand association, brand loyalty, and buying commitment). Table 4 contains the measurement scale.
Table 4.
Measurement scale (questionnaire).
We conducted Person’s chi-square and confirmatory factor analysis to understand the independence and internal strength of the assessment measures. This test was conducted to comprehend the strength of the scale measure as the R2 value. The results show that one of the validity measures (brand association = −0.616) was lower than the acceptable range. A high or low R2 is not necessarily good or bad, because it does not convey the reliability of the model nor the right regression. A low R2 for a good model, or a high R2 for a poorly fitted model can occur, and vice versa. Here, the comparative fit indices for brand association, attachment, loyalty, preference, and buying commitment were 0.916, 0.901, 0.897, 0.942, and 0.961, respectively; the standardized root-mean-square residuals were 0.03, 0.063, 0.091, 0.0342, and 0.0331, respectively. The chi-square results and the root-mean-square error approximation (RMSEA) are thoroughly discussed in Table 5.
Table 5.
Chi-square independence test for SMME. df—degrees of freedom; RMSEA—root-mean-square error approximation.
Table 5 shows that the measures used to test brand association did not violate the assumptions. The research was well structured and had an expected count <5, despite the significance values for the Pearson chi-square. Only customization had the expected count of 12.5, which remained below 20%. All five measures had an equal accepted RMSEA level of <0.08, and the others did not violate the fitness level.
Brand preference and attachment demonstrated that the expected count for all variables was below 20%. Therefore, the assumption was not violated. Customization had a high expected count (16.7% for both cases) but still less than 20%. Brand attachment calculations showed that all the variables (except customization) were significant. Apart from e-WOM for brand attachment in Table 5, customization and interaction of brand preference also violated the <0.08 benchmark.
Table 5 also shows that the measures did not violate the expected count for brand loyalty. Only customization had an expected count of less than 12.7%, which was below the accepted level of 20%. The RMSEA values of all the values of all the measures were within the acceptable range.
Based on Table 5, the measures for buying commitment were evidently feasible and did not violate the assumption. All the expected values were less than 20%. Only customization was significant for the Pearson chi-squared test. Moreover, only customization violated the RMSEA range of <0.08.
We considered the Pearson chi-square test to determine whether the assumption was violated. The significance of the test was not considered here because the measure was . We used Kendall’s tau-b and gamma with the regression test to solidify the hypothesis testing.
5.2. Hypotheses Testing
We calculated five linear regressions by analyzing the statistical outcomes to determine whether the desired effect was achieved. Buying commitment, brand loyalty, brand preference, brand association, and brand attachment were used as the dependent variables. We selected entertainment, interaction, trendiness, customization, and e-WOM as the independent variables of the research model. Table 6 presents the correlations between the variables, which were derived from SPSS 21.
Table 6.
Correlations between dependent and independent variables.
Table 6 shows that the correlation for brand loyalty (r = −0.068, p ≤ 0.05) was similar and weakly negatively significant. Although the correlation was not strongly significant (negatively) for the sample size of 564, the r value of −0.068 was very weak. Thus, it shows that the components of SMM had an inverse impact on consumer brand loyalty. Table 7 indicates that R = 13% of the changes in the dependent variable could be explained by the changes in the independent variable and that the linear correlation was very weak. Table 7 exhibits the results from the regression, in which β = −0.060* (p < 0.002). Among the five independent factors, customization was the only significant one that supported the correlation result. Therefore, we reject Hypothesis 1.
Table 7.
Multiple regressions for brand loyalty.
Figure 2 shows that only trendiness was within the acceptable range of the tau-b value of −0.137; thus, it was weakly related to the other variables. The other insignificant values clearly suggest and support the decision derived for Hypothesis 1.
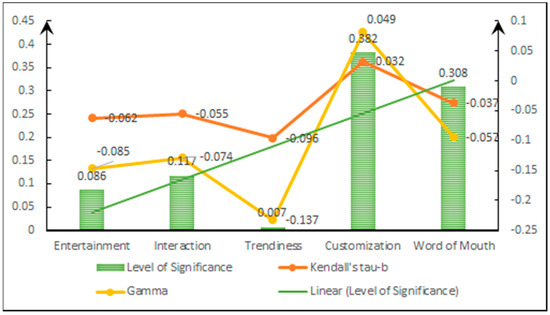
Figure 2.
Kendall’s tau-b and gamma for brand loyalty.
Hypothesis 2 states that the SMMEs of the local Bangladeshi fashion industry can successfully influence and strengthen brand preference among Bangladeshi consumers. Table 6 (r = 0.611, p < 0.05) indicates that the SMMEs of the local Bangladeshi fashion brands had a strong influence on the brand preference of consumers. The regression in Table 8 shows that R = 58% of the changes in the dependent variable could be explained by the changes in the independent variable and that the linear correlation was moderately strong. The regression results of entertainment, trending, interaction (β = −0.159, 0.308, 0.110), and e-WOM (0.061, p < 0.05) strongly supported the correlation. Thus, we accept the null Hypothesis 2.
Table 8.
Multiple regressions for brand preference.
Figure 3 shows that trendiness, customization, and e-WOM all had acceptable ranges for significance. Kendall’s tau-b values for customization and e-WOM had a strong (0.502) and a moderate (0.212) relationship, respectively. Thus, they support the acceptance of the hypothesis.
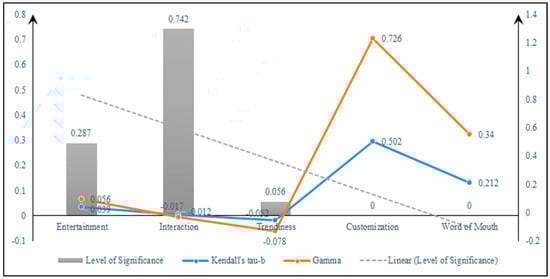
Figure 3.
Kendall’s tau-b and gamma for brand preference.
Hypothesis 3 attempts to predict whether the SMMEs of the local Bangladeshi fashion industry can successfully create a positive brand association. Table 6 indicates that the correlation between brand association and SMMEs was significant (r = 0.139, p < 0.05). By contrast, Table 9 shows that only entertainment was significant at 0.097 (p < 0.05) supporting the correlation result. The regression in Table 9 also shows that R = 21% of the changes in the dependent variable could be explained by the changes in the independent variable and that the linear correlation was moderately strong. The results of the tests show that the effect of SMMEs on brand association for the consumers was insignificant. Therefore, we fail to accept Hypothesis 3.
Table 9.
Multiple regressions for brand association.
Figure 4 below presents that trendiness, customization, and e-WOM were all insignificant. Kendall’s tau-b values for trendiness, customization, and e-WOM were 0.054, 0.029, and −0.013, respectively, which had a very weak relationship. Therefore, we reject Hypothesis 3.
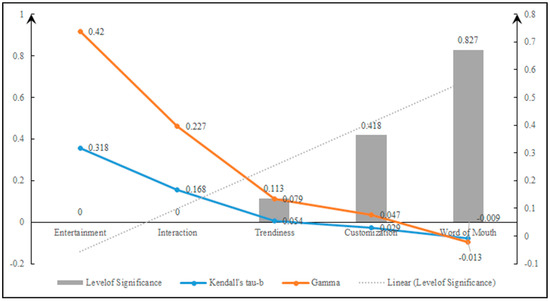
Figure 4.
Kendall’s tau-b and gamma for brand association.
For Hypothesis 4, we found that the SMMEs of the local Bangladeshi fashion industry could successfully create an emotional attachment (brand attachment). A very strong correlation, r = 0.350 (p < 0.05), is presented in Table 6. The result of the correlation was very strong and significant. Trending, customization, and eWOM were significant at β = 0.245, −0.134, −0.227 (p < 0.001). Table 10 proves that the presence of the Bangladeshi fashion industry in the minds of consumers through SMMEs was not only statistically significant but also strong. The regression in Table 10 shows that R = 46% of the changes in the dependent variable could be explained by the changes in the independent variable and that the linear correlation was moderately strong. The brand attachment of consumers was not independent. Therefore, we accept Hypothesis 4.
Table 10.
Multiple regressions for brand attachment.
Figure 5 depicts that entertainment, interaction, and trendiness were all significant (p < 0.05). Kendall’s tau-b values were −0.359, −0.287, and −0.193, which suggested a moderately strong relationship. Thus, they support the acceptance of Hypothesis 4.
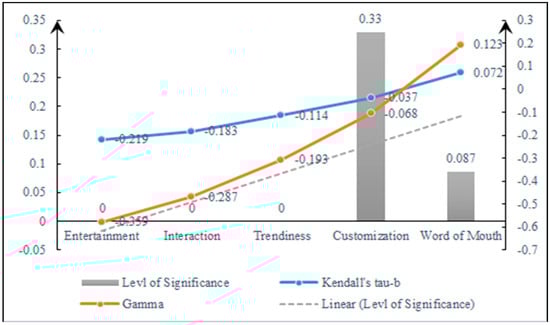
Figure 5.
Kendall’s tau-b and gamma for brand attachment.
The results of Hypothesis 5 in Table 6 were weakly negatively related (r = −0.90, p < 0.05). Upon careful scrutiny of brand loyalty, the correlation in Table 6 indicated that r = −0.068, p < 0.05. However, the relationship was negative but not very weak. This negative value created an adverse impact on buying commitment. The finding shows that if SMMEs is increased by 100 units, then the effect will decrease by 90 units. The regression of buying commitment in Table 11 shows several effects. Interaction and customization were significant in the regression analysis as β = −0.242, 0.106 (p < 0.05), supporting the correlation result. Table 11 shows that R = 30% of the changes in the dependent variable could be explained by the changes in the independent variable and that the linear correlation was moderately strong. Thus, we fail to accept Hypothesis 5 because it showed the significance of the independent factors to be below 50%.
Table 11.
Multiple regressions for buying commitment.
Figure 6 shows that only interaction and customization were significant (p < 0.05), and the rest were unacceptable. Kendall’s tau-b values for interaction and customization were 0.096 and −0.325 respectively, thereby suggesting a very weak and a moderately strong relationship, respectively. Thus, they support the rejection of the null hypothesis.
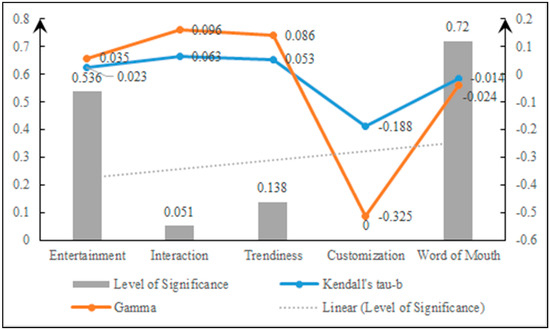
Figure 6.
Kendall’s tau-b and gamma for buying commitment.
5.3. Summary of Hypotheses Testing
The hypothesis testing that evaluated the success of SMMEs is clearly described here in the summary. Below, Figure 7 contains a summary of the hypothesis results. This figure shows that two elements of brand consciousness (brand loyalty, brand association) could not succeeded to the level of acceptance. Our observation shows that independent variable customization for brand loyalty and entertainment for brand association were significant. Due to their effects, the final measurement outcome of buying commitment was also rejected.
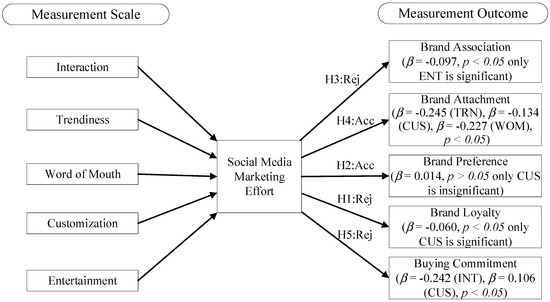
Figure 7.
Summary of hypothesis testing. Acc = accepted, Rej = rejected, ENT = entertainment, CUS = customization, TRN = trending, WOM = word-of-mouth, INT = interaction).
We selectively show important statistical measurement outcomes in Figure 7, whereas Table 12 is used to explain the summary of accepted independent variables. Table 12 shows that brand preference and brand attachment had the most accepted independent variables (brand preference had four and brand attachment had three). The remaining two elements of brand consciousness had four unacceptable independent variables; thus, they were rejected. The buying commitment had two (interaction and customization) among five independent variables accepted; however, due to less than 50% of the independent variables being accepted, buying commitment was also rejected. The statistical measurements are stated in Table 12.
Table 12.
Summary of the hypothesis results.
6. Discussion of Results
Numerous studies support the idea that social media has theoretical and practical implications for brand building [22,32,89]. Similarly, several management opportunities and challenges are included. Researchers struggled to identify the gap and the influence of SMMEs on brand building goals such as brand loyalty, brand attachment, brand association, and brand preference. All sales have a similar ultimate target, revenue generation. SMMEs also struggle in this era to maximize revenue via online means to obtain consumers’ buying commitment. Success is difficult to obtain, especially among challenging consumers. An increase in the consumer’s reluctance to become close to an online platform adds difficulty when engaging them in business. Conceptual and measurement issues are continuously being challenged [90,91], and it is becoming increasingly difficult with consumers who have diversified demands and similar cultural backgrounds. The present research attempts to fill this gap in the literature by putting the local Bangladeshi fashion industry in a challenging situation, with consumers of mixed ages with social-media-friendly attitudes. Previous studies were based on luxury segments that operate internationally. SMM is effective in successfully engaging consumers via new media [15,16]. This study further contributes to the literature by providing a holistic framework to enrich previous studies by demonstrating how it engages mono-cultural consumers. Previous studies examined the relationship between brand equity and SMMEs [5,22] by using all five SMME elements. Such studies empirically proved that all of the elements can be considered when designing and implementing social media activities [22]. The results of the present study are consistent with the responses across the different age groups.
Figure 8 and Figure 9 show the scatter plots of the regression standardized predicted values, whereby brand loyalty and buying commitment failed to cross the expected significance of the multiple regression beta value. Bangladeshi consumers who browsed websites on online platforms were not loyal to a particular product of local Bangladeshi fashion brands. Thus, this attitude was the harbinger of negative buying commitment.
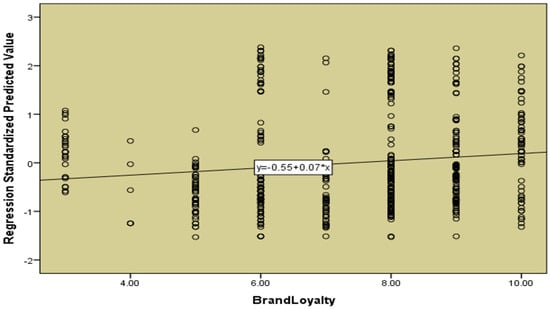
Figure 8.
Regression standardized value for brand loyalty.
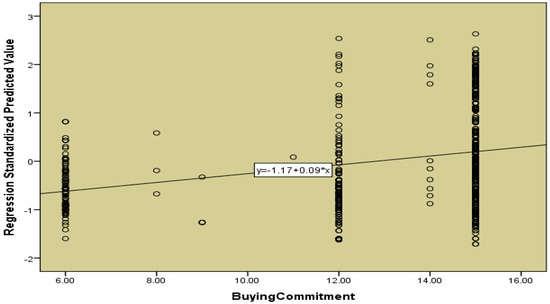
Figure 9.
Regression standardized value for buying commitment.
Figure 8 and Figure 9 also show R2 values of only 0.211 and 0.389; thus, 21% and 39% variance were considered. The predictors and the outcome variables were linear and had a constant error variance. However, the error variance constant A = 0.55 and 1.17 were negative, and the slope B = 0.07 and 0.09 were insignificant. The beta coefficient frequencies were independently but weakly positively distributed. This result implies that the quality of Bangladeshi fashion brands was admirable, and consumers clearly preferred changing their choices randomly. If a consumer prefers a brand, they also associate with it. However, the present study found that association did not guarantee loyalty to a particular product. Although the values of brand loyalty were highly weak, feelings toward brand appeared easily because brand preference acted as a precursor [66]. Thus, Bangladeshi consumers were not loyal to online platforms, but they may have shown loyalty via other means.
Brand preference and brand attachment in Figure 10 and Figure 11 confirmed that the R2 values were strong at 0.811 and 0.769, respectively. These results mean that 81% and 76% variance were considered. The predictors and the outcome variables were highly positively linear and had an independently distributed constant error variance. However, the error variance was greater than 1, and the slope was strongly significant. The beta coefficient frequencies were independently and strongly positively distributed. This result indicates that our segmented consumers were highly conversant with the latest technologies, as clearly reflected in the high scores of brand preference and brand attachment.
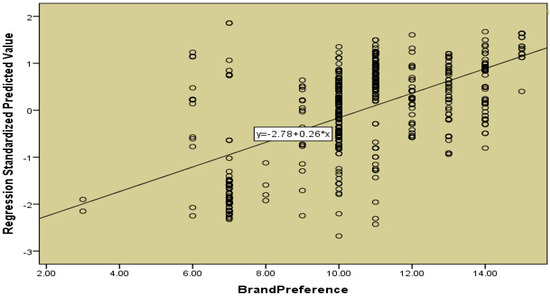
Figure 10.
Regression standardized value for brand preference.
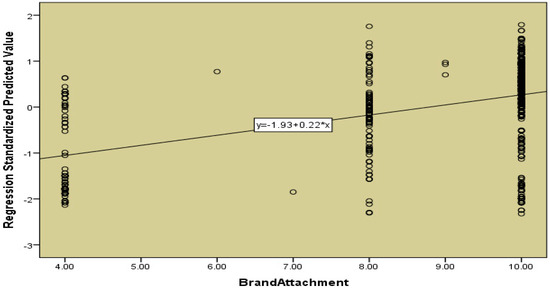
Figure 11.
Regression standardized value for brand attachment.
One of the significant contributions of this study was to determine whether brand preference and attachment had statistical significance, that is, if Bangladeshi consumers preferred local Bangladeshi fashion brands on online platforms. Figure 12 shows that brand association had a moderate R2 of 0.311; thus, 31% variance was considered. The predictors and the outcome variables were positively linear and were independently distributed throughout as constant error variance. The variance was greater than 1, and the slope was strongly significant. The beta coefficient frequencies were independently and strongly positively distributed, similar to brand preference and attachment. However, brand association still failed, because the regression analysis showed that less than 50% of the measurement scale was significant. The results of these figures were surprising because, despite brand preference leading to brand loyalty, SMMEs failed to influence brand association to generate consumer loyalty. Consumers were not associated well with local fashion brands. Table 10 and Table 11 show that all five SMME elements were statistically significant, thereby proving that consumers were well aware of the brands online.
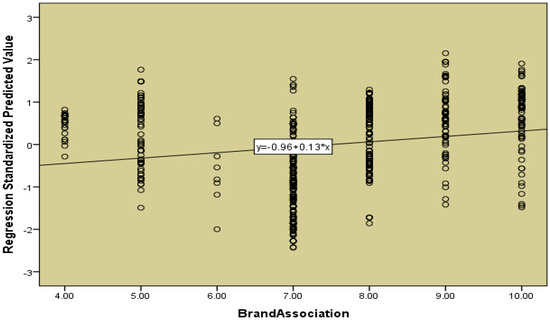
Figure 12.
Regression standardized value for brand association.
The SMMEs of local Bangladeshi fashion brands were successful in the brand preference and attachment dimensions. These factors are serious brand image building tools and have a genuine effect on consumers’ decision-making processes. Another contribution of this study was that it determined that local Bangladeshi fashion brands failed to create brand loyalty and association among consumers who were reluctant to buy a particular product repeatedly but were attached to it nonetheless. Attachment and preference showed that consumers had buying intention.
Finally, this study was the first to analyze the online shopping tendencies of Bangladeshi consumers. Moreover, it assessed the success of the SMMEs of local fashion brands in creating brand association, loyalty, preference, and attachment. This study attempted to determine whether SMMEs could motivate consumers to pay premium prices and prepare them to purchase from online platforms. The results of the analysis showed that SMMEs failed to create appeal among consumers to obtain buying commitment.
By contrast, despite the success of SMMEs in influencing preference and attachment, they were negatively viewed as failing to influence brand loyalty. This view does not align with the previous research of Bruno et al. [22], Keller and Lehmann [92], and Lessar et al. [93]. Furthermore, all other brand preferences were seen as harbingers of buying commitment [22]. Thus, these elements were ignored in previous studies [6,94].
7. Conclusions
The present research makes several contributions such as providing a glimpse into the success of the SMMEs of the local Bangladeshi fashion industry for attracting local consumers. It aligns brand loyalty, brand preference, brand attachment, brand association, and buying commitment with the SMMEs of local brands. We found that consumers are strongly attached to their online activities, as well as the existence of a very strong positive acceptance of local fashion brands in the minds of Bangladeshi consumers.
We determined that brand preference is equally important. Given the high standards of local Bangladeshi fashion products, preferences are already established in the minds of consumers, who forge connections with the SMMEs of companies. We found that the consumers had a very weak presence in terms of brand association and loyalty. The regression equation confirmed that these elements were statistically insignificant. Brand preference and attachment were significant, but the lack of loyalty to brands showed the weak significance of buying commitment. Further tests proved that buying commitment became significant if the value was close to 50%. Firstly, we considered buying commitment, which had the lowest beta value in the regression equation owing to brand loyalty. However, the regression table indicated that it was below the 50% significance level; thus, we rejected its credibility. Further research concluded that Bangladeshi consumers were willing to buy online but they were not committed to any particular brand. Therefore, their decision to buy was unaffected by the SMMEs.
7.1. Managerial Implications
This study may have considerable effects on customer attitudes and purchase intention from the managerial perspective. Elements such as entertainment, interaction, trendiness, eWOM, and customization all contribute toward brand loyalty, attachment, association, and preference. These contributions in turn lead to the ultimate goal of buying commitment. Godey [22] demonstrated that entertainment, trendiness, and customization are directly related to consumers [22]. The literature indicates that SMMEs should focus on providing entertainment and customization. Websites should produce congenial entertainment for Bangladeshi consumers. The research of Palos-Sanchez and Saura [95] also indicated that consumers tend to use the same search engines. Customization is important for consumers with buying power to feel unique and special. Thus, brands should create diversified content to attract consumers.
Compared with media such as television (TV), billboards, and print advertisements, SMMs are established as the best tools for reaching consumers through convenient and cost-effective means. SMMEs have considerable power to create emotional attachments between brands and consumers [22]. Our study determined from the regression residuals that, all other things being constant, brand loyalty can generate revenue of ) 0.07 dollars, and association can generate revenue of ) 0.13 dollars during purchases. Therefore, both are negligible. This research shows the weak dimensions and helps managers remodel their digital strategies by using sophisticated interactive media and selecting compelling mechanisms to entice Bangladeshi consumers.
7.2. Practical Implications
Here, we practically explain that the expectancy of Bangladeshi consumers to buy online remains uncertain, because they show preference and attachment but not buying commitment. Brand preference earns 0.26 and attachment earns 0.22 dollars for each purchase made in an SMME-aided environment. Thus, marketers should determine the gap between this conspicuous and contradictory behavior. This study raises the question of why such behavior is not applied to online platforms.
Here, we examined all the local fashion brands in Bangladesh regardless of their products. The eWOM of Bangladeshi consumers should be considered seriously by marketers because it will help them in leading the structure for future promotions. We found that consumers respond quite positively to participation. This finding may help marketers realize that they should use traditional tools such as store image or ambiance [22] to attract this online consumer segment and to convince them to pay premium online prices. The current research also supports the study of Palos-Sanchez et al. [96], from which we learn that internet advertising is a tool that can influence the user’s desire for a specific product or service.
Finally, our research findings shed light on the importance of effective targeting and differentiated customer relationship strategies in SMMEs. Previous studies focused on the participation of members of Generation Y, as well as on their activities on social networking sites [97,98]. However, findings from the present study suggest that age differences affect the buying pattern of online customers. Such findings encourage brands whose target customers include the young Bangladeshi generation to exert efforts through connecting with their customers by developing brand association and brand loyalty and by reinforcing customer–brand relationships.
7.3. Limitation and Future Research Scope
This study was not free from limitations. Firstly, we selected the entire local Bangladeshi fashion industry rather than focusing on specific brands. Thus, we could not make conclusions on the effect of social media activities of local renowned brands. Secondly, the demography of the survey may generate contradictory results if the chosen respondents belonged to a specific age group and multiple countries of origin. Considering overpopulation, the lack of proper communication, and traffic, people might prefer online shopping in Bangladesh. These factors could not be fully examined in this study. Bangladeshi consumers are eager to use online media when purchasing products. Furthermore, the knowledge of different international brands introduces difficulties in judging the success of SMMEs for local Bangladeshi fashion brands. We could not determine the social media performance of a Bangladeshi brand in this study, which involves selling fashion products internationally.
The effect of cultural perception, as well as comparisons between the responses on SMM of people with different cultural backgrounds, may be worth studying in future research. The buying patterns of Bangladeshi consumers, as well as preferred online products, can be another interesting point of study. Further research on specific consumer responses can also be conducted to assess the success of local Bangladeshi fashion brands on social media. Finally, the price sensitivity of Bangladeshi consumers, which may lead to online purchase decisions, also requires exploration. A research model in which gender and income play a moderating role can provide a clear answer to the buying behavior of consumers toward fashion products.
Author Contributions
Conceptualization, Y.W. and S.C.A.; methodology, Y.W. and S.C.A.; software, S.C.A.; validation, Y.W., S.C.A. and S.D.; formal analysis, H.W.; investigation, S.C.A.; resources, S.C.A.; data curation, S.C.A. and S.D.; writing—original draft preparation, S.C.A.; writing—review and editing, Y.W. and H.W.; visualization, S.C.A., S.D. and H.W.; supervision, Y.W.; project administration, Y.W.; funding acquisition, Y.W.
Funding
This research was supported by the National Natural Science Foundation of China (Project No. 71871035, 71402011, 71471024), the Humanity and Social Science Youth Foundation of Ministry of Education of China (18YJC630189,19YJAZH011), the China Postdoctoral Science Foundation (Project No. 2017T100692 and 2016M600735), the Chongqing Municipal Education Commission Science and Technology Research Project (KJQN201800723), and the 2017 Postdoctoral Science Foundation of Sichuan Province, China; this research was also partly supported by 2018 the Chongqing Liuchuang Plan Innovation Project(cx2018111) and the Program for the Philosophy and Social Science Research of Higher Learning Institutions of Shanxi (201803066).
Acknowledgments
The authors would like to express our appreciation for the valuable comments made by the three anonymous reviewers, which helped us improve the quality of this paper.
Conflicts of Interest
The authors declare no conflicts of interest.
References
- Albors, J.; Ramos, J.C.; Hervas, J.L. New learning network paradigm: Communities of objectives, croudsourcing, wikis and open source. Int. J. Inf. Manag. 2008, 28, 194–202. [Google Scholar] [CrossRef]
- Lamberton, C.; Stephen, A.T. A thematic exploration of digital, social media and mebile marketing. J. Mark. 2016, 80, 146–172. [Google Scholar] [CrossRef]
- Kang, Y.M.; Park, B. Sustainable Corporate Social Media Marketing Based on Message Structural Features: Firm Size Plays a Significant Role as a Moderator. Sustainability 2018, 10, 1167. [Google Scholar] [CrossRef]
- Eric, W.T.N.; Karen, K.L.M.; Tao, S.C. Social media research: Theories, constructs, and conceptual frameworks. Int. J. Inf. Manag. 2015, 35, 33–44. [Google Scholar]
- Kim, A.J.; Ko, E. Impact of luxury fashion brand’s social media marketing of customer relationship and purchase intension. J. Glob. Fash. Mark. 2010, 1, 164–171. [Google Scholar] [CrossRef]
- Netemeyer, R.G.; Balaji, C.K.; Pullig, C.; Wirth, F. Developing and validating measures of facets of customer-based brand equity. J. Bus. Res. 2004, 57, 209–224. [Google Scholar] [CrossRef]
- Martin, K.; Todorov, I. How will digital platforms be harnessed in 2010, and how will they change the way people interact with brands? J. Advert. 2010, 10, 61–66. [Google Scholar] [CrossRef]
- Muntinga, D.G.; Moorman, M.; Smit, E.G. Introducing COBRAS: Exploring motivations for brand elated social media use. Int. J. Advert. 2011, 30, 13–46. [Google Scholar] [CrossRef]
- Bennett, R.; Rundle-Thiele, S. A Comparison of Attitudinal Loyalty Measurement Approaches. J. Brand Manag. 2002, 9, 193–209. [Google Scholar] [CrossRef]
- Chaudhuri, A.; Holbrook, M.B. The Chain of Effects from Brand Trust and Brand Affect to Brand Performance: The Role of Brand Loyalty. J. Mark. 2001, 65, 81–93. [Google Scholar] [CrossRef]
- Isik, A.; Yasar, M.F. Effects of brand on consumer preferences: A study in Turkmenistan. Eur. J. Bus. Econ. 2015, 8, 139–150. [Google Scholar] [CrossRef]
- Chattopadhyay, A.; Alba, J.W. The situational importance of recall and inference in consumer decision making. J. Consum. Res. 1988, 15, 1–12. [Google Scholar] [CrossRef]
- Laroche, M.; Habibi, M.R.; Richard, M.O. To be or not to be in social media: How brand loyalty is affected by social media. Int. J. Inf. Manag. 2015, 33, 76–82. [Google Scholar] [CrossRef]
- Laroche, M.; Habibi, M.R.; Richard, M.O.; Sankaranarayanan, R. Effects of social media based brand communities on brand community markers, value cration practice, brand trust and brand loyalty. Comput. Hum. Behav. 2013, 28, 1755–1767. [Google Scholar] [CrossRef]
- Kim, A.J.; Ko, E. Do social media marketing activity enhance customer equity? An empirical study on luxury fashion brand. J. Bus. Res. 2016, 65, 1480–1486. [Google Scholar] [CrossRef]
- Phan, M.; Thomas, R.; Heine, K. Social Media and Luxury Brand Management: The case of Burberry. J. Glob. Fash. Mark. 2011, 2, 213–222. [Google Scholar] [CrossRef]
- Kaplan, A.M.; Haenlein, M. Users of the world, unite! The challenges and opportunities of social media. Bus. Horiz. 2010, 53, 59–68. [Google Scholar] [CrossRef]
- Hennig-Thurau, T.; Hofacker, C.F.; Bloching, B. Marketing the pinball way: Understanding how the social media change the generation of value for the consumers and companies. J. Interact. Mark. 2013, 27, 237–241. [Google Scholar] [CrossRef]
- Verma, R.; Stock, D.; McCarthy, L. Customer Preferences for online, social media and mobile innovations in the hospitality industry. Cornell Hosp. Q. 2012, 53, 183–186. [Google Scholar] [CrossRef]
- Agichtein, E.; Castillo, C.; Donato, D.; Aristides, G.; Gilad, M. Finding High Quality Content in Social Media. In Proceedings of the 2008 International Conference on Web Search and Data Mining, Palo Alto, CA, USA, 11–12 February 2008; pp. 183–193. [Google Scholar]
- Manthiou, A.; Chiang, L.; Tang, L. Identifying and responding to customer needs on Facebook fan pages. Int. J. Technol. Hum. Interact. 2013, 9, 36–52. [Google Scholar] [CrossRef]
- Godey, B.; Manthiou, A.; Pederzoli, D.; Rokka, J.; Aiello, G.; Donvito, R.; Singh, R. Social media marketing effort of luxury brands: Influence on brand equity and consumer behavior. J. Bus. Res. 2016, 69, 5833–5841. [Google Scholar] [CrossRef]
- Naaman, M.; Becker, H.; Gravano, L. Hip and trendy: Characterizing emerging trends on twitter. J. Am. Soc. Inf. Sci. Technol. 2011, 62, 902–918. [Google Scholar] [CrossRef]
- Schmenner, R.W. How can service business survive and prosper. Sloan Manag. Rev. 1986, 27, 21–32. [Google Scholar]
- Zhu, Y.Q.; Chen, H.G. Social media and human need satisfaction: Implications for social media marketing. Bus. Horiz. 2015, 58, 335–345. [Google Scholar] [CrossRef]
- Park, J.H.; Lee, J. E-WOM overload and its behavioural effect on consumer intension depends on consumer’s involvement. Electron. Commer. Res. Appl. 2008, 7, 386–398. [Google Scholar] [CrossRef]
- Erdem, T.; Swait, J.; Valenzuela, A. Brands as signals, cross country validation study. J. Mark. 2006, 70, 34–49. [Google Scholar] [CrossRef]
- Dellarocus, C. The digitization of word of mouth: Promise and challenges of online feedback and machanisms. Manag. Sci. 2003, 49, 1407–1424. [Google Scholar] [CrossRef]
- Cheung, C.M.K.; Lee, M.K.O.; Rabjhan, N. The impact of electronic Word of Mouth:the adoption of online opinions in online customer communities. Internet Res. 2008, 18, 229–247. [Google Scholar] [CrossRef]
- Willemsen, L.M.; Niejens, P.C.; Bronner, F.; De Ridder, J.A. Highly recommended! The content characteristics and perceived usefulness of online consumer reviews. J. Comput.-Mediat. Commun. 2011, 17, 19–38. [Google Scholar] [CrossRef]
- Filieri, R. What makes online reviews helpful? A diagonisticity-adoption framework to explain informational and normative influence of E-WOM. J. Bus. Res. 2015, 68, 1261–1270. [Google Scholar] [CrossRef]
- Gallaugher, J.; Ransbotham, S. Social media and customer dialogue management at starbucks. MIS Q. Exec. 2010, 9, 197–212. [Google Scholar]
- Dougherty, T.; Eastin, M.S.; Bright, L. Exploring consumer motivations for creating user generated content. J. Interact. Advert. 2013, 8, 16–25. [Google Scholar] [CrossRef]
- Meltzer, M.; Stefanescu, L.; Ozunu, A. Keep them Engaged: Romanian County inpectoraes for emergency situations’ Facebook Usage for Disaster Risk Communications and beyond. Sustainability 2018, 10, 1411. [Google Scholar] [CrossRef]
- Kim, J.; Lee, K.H. Influence of integration on interactivity in social media luxury brand communities. J. Bus. Res. 2019, 99, 422–429. [Google Scholar] [CrossRef]
- VanMeter, R.; Syrdal, H.A.; Powell-Mantel, S.; Grisaffe, D.B.; Nesson, E.T. Don’t Just “Like” Me, Promote Me: How Attachment and Attitude Influence Brand Related Behaviors on Social Media. J. Interact. Mark. 2018, 43, 83–97. [Google Scholar] [CrossRef]
- Yoshida, M.; Gordon, B.S.; Nakazawa, M.; Shibuya, S.; Fujiwara, N. Bridging the gap between social media and behavioural brand loyalty. Electron. Commer. Res. Appl. 2018, 28, 208–218. [Google Scholar] [CrossRef]
- Chen, S.C.; Lin, C.P. Understanding the effects of social media marketing activities: The mediation of social identification, perceived value and satisfaction. Technol. Forecast. Soc. 2019, 140, 22–31. [Google Scholar] [CrossRef]
- Felix, R.; Philipp, A.R.; Hinsch, C. Elements of strategic social media marketing: A holistic framework. J. Bus. Res. 2017, 70, 118–126. [Google Scholar] [CrossRef]
- Nisar, T.M.; Whitehead, C. Brand interactions and social media: Enhancing user loyalty through social networking sites. Comput. Hum. Behav. 2016, 62, 743–753. [Google Scholar] [CrossRef]
- Yan, Q.; Wu, S.; Wang, L.; Wu, P.; Chen, H.; Wei, G. E-WOM from e-commerce websites and social media: Which will consumers adopt? Electron. Commer. Res. Appl. 2016, 17, 62–73. [Google Scholar] [CrossRef]
- Hajli, N. Social commerce constructs and consumer’s intention to buy. Int. J. Inf. Manag. 2015, 35, 183–191. [Google Scholar] [CrossRef]
- Davis, R.; Piven, I.; Breazeale, M. Conceptualizing the brand in social media community: The five sources model. J. Retail. Consum. Serv. 2004, 21, 468–481. [Google Scholar] [CrossRef]
- Fournier, S.; Avery, J. The uninvited brand. Bus. Horiz. 2011, 54, 193–207. [Google Scholar] [CrossRef]
- Srinivasan, S.S.; Anderson, R.; Ponnavolu, K. Customer loyalty in e-commerce: An exploration of its antecedents and consequences. J. Retail. 2004, 78, 41–50. [Google Scholar] [CrossRef]
- McAlexander, J.H.; Schouten, J.W.; Koenig, H.F. Building brand community. J. Mark. 2002, 66, 38–45. [Google Scholar] [CrossRef]
- Casaló, L.V.; Flavián, C.; Guinalíu, M. Relationship quality, community promotion and brand loyalty in virtual communities: Evidence from free software communities. Int. J. Inf. Manag. 2010, 30, 357–367. [Google Scholar] [CrossRef]
- Brodie, R.J.; Ilic, A.; Juric, B.; Hollebeek, L. Consumer engagement in a virtual brand community: An exploratory analysis. J. Bus. Res. 2013, 66, 105–114. [Google Scholar] [CrossRef]
- Algesheimer, R.; Dholakia, U.M.; Herrmann, A. The social influence of brand community: Evidence from European car clubs. J. Mark. 2005, 69, 19–34. [Google Scholar] [CrossRef]
- Bagozzi, R.P.; Dholakia, U.M. Intentional social action in virtual communities. J. Interact. Mark. 2002, 16, 2–21. [Google Scholar] [CrossRef]
- Habibi, M.R.; Laroche, M.; Richard, M.O. The roles of brand community and community engagement in building brand trust on social media. Comput. Hum. Behav. 2014, 37, 152–161. [Google Scholar] [CrossRef]
- Labrecque, L.I. Fostering consumer-brand relationships in social media environments: The role of para-social interaction. J. Interact. Mark. 2014, 28, 134–148. [Google Scholar] [CrossRef]
- Ku, Y.; Chen, R.; Zhang, H. Why do users continue using social networking sites? An exploratory study of members in the United States and Taiwan. Inf. Manag. 2013, 50, 571–581. [Google Scholar] [CrossRef]
- Ryan, D.; Jones, C. Digital Marketing Strategies for Engaging the Digital Generation; Kogan Page Limited: London, UK, 2009. [Google Scholar]
- Krasnova, H.; Spiekermann, S.; Koroleva, K.; Hildebrand, T. Online social networks: Why we disclose. J. Inf. Technol. 2010, 25, 109–125. [Google Scholar] [CrossRef]
- Lim, J.; Hwang, Y.; Kim, S.; Biocca, F. How social media engagement leads to sports channel loyalty: Mediating roles of social presence and channel commitment. Comput. Hum. Behav. 2015, 46, 158–167. [Google Scholar] [CrossRef]
- Luo, N.; Zhang, M.; Liu, W. The effects of value co-creation practices on building harmonious brand community and achieving brand loyalty on social media in China. Comput. Hum. Behav. 2015, 48, 492–499. [Google Scholar] [CrossRef]
- Mohammadi, H. A study of mobile banking loyalty in Iran. Comput. Hum. Behav. 2015, 44, 35–47. [Google Scholar] [CrossRef]
- Grubb, E.L.; Grathwohl, H.L. Consumer self-concept, symbolism, and market behaviour: A theoretical approach. J. Mark. 1967, 31, 22–27. [Google Scholar] [CrossRef]
- Muniz, A.M.; O’Guinn, T.C. Brand community. J. Consum. Res. 2001, 27, 412–433. [Google Scholar] [CrossRef]
- Park, H.; Kim, Y.K. The role of social network websites in the consumer-brand relationship. J. Retail. Consum. Serv. 2014, 21, 460–467. [Google Scholar] [CrossRef]
- Jamal, A.; Goode, M. Consumers and brands: A study of the impact of selfImage congruence on brand preference and satisfaction. Mark. Intell. Plan. 2001, 19, 482–492. [Google Scholar] [CrossRef]
- Tokunaga, R.S. Social networking site or social surveillance sites under- standing the use of interpersonal electronic surveillance in romantic relation- ships. Comput. Hum. Behav. 2011, 27, 705–713. [Google Scholar] [CrossRef]
- Valenzuela, S.; Park, N.; Kee, K.F. Is there social capital in a social network site? Facebook use and college students’ life satisfaction, trust, and Participation. J. Comput.-Mediat. Commun. 2009, 14, 875–901. [Google Scholar] [CrossRef]
- Hollenbaugh, E.E.; Ferris, A.L. Facebook self-disclosure: Examining the role of traits, social cohesion, and motives. Comput. Hum. Behav. 2014, 30, 50–58. [Google Scholar] [CrossRef]
- Park, N.; Kee, K.F.; Valenzuela, S. Being immersed in social networking environment: Facebook groups, uses and gratifications, and social outcomes. Cyberpsychol. Behav. 2009, 12, 729–733. [Google Scholar] [CrossRef] [PubMed]
- Steinfield, C.; Ellison, N.B.; Lampe, C. Social capital, self-esteem, and use of online social network sites: A longitudinal analysis. J. Appl. Dev. Psychol. 2008, 29, 434–445. [Google Scholar] [CrossRef]
- Normann, R. Service Management: Strategy and Leadership in Service Business; John Wiley & Sons: Hoboken, NJ, USA, 1991. [Google Scholar]
- Porter, S.S.; Claycomb, C. The influence of brand recognition on retail store image. J. Prod. Brand Manag. 1997, 6, 373–384. [Google Scholar] [CrossRef]
- Park, W.C.; Deborah, J.M.; Priester, J.; Andreas, B.E.; Iacobucci, D. Brand Attachment and Brand Attitude Strength: Conceptual and Empirical Differentiation of Two Critical Brand Equity Drivers. J. Mark. 2010, 74, 1–17. [Google Scholar] [CrossRef]
- Bowlby, J. Attachment and Loss: Attachment; Basic Books: New York, NY, USA, 1980. [Google Scholar]
- Riemer, K.; Lehrke, C. Biased listing in electronic marketplaces: Exploring its implications in on-line hotel distribution. Int. J. Electron. Commun. 2009, 14, 55–78. [Google Scholar] [CrossRef]
- Senecal, S.; Nantel, J. The influence of online product recommendation on consumers’ online choices. J. Retail. 2004, 80, 159–169. [Google Scholar] [CrossRef]
- Yubo, C.; Jinhong, X. Third-party product review and firm marketing strategy. J. Mark. Sci. 2005, 24, 218–240. [Google Scholar]
- Chris, F.; Anindya, G.; Batia, W. Examining the relationship between reviews and sales: The role of reviewer identity disclosure in electronic markets. Inf. Syst. Res. 2008, 19, 291–313. [Google Scholar]
- Reyes-Menendez, A.; Palos-Sanchez, P.R.; Saura, J.R.; Martin-Velicia, F. Understanding the Influence of Wireless Communications and Wi-Fi Access on Customer Loyalty: A Behavioral Model System. Wirel. Commun. Mob. Comput. 2018, 2018. [Google Scholar] [CrossRef]
- Khan, M.A.; Mahmood, Z. Impact of brand loyalty factors on brand equity. Int. J. Acad. Res. 2012, 4, 33–38. [Google Scholar]
- Gounaris, S.; Stathakopoulos, V. Antecedents and consequences of brand loyalty: An empirical study. J. Brand Manag. 2004, 11, 283–306. [Google Scholar] [CrossRef]
- Kabiraj, S.; Shanmugan, J. Development of a conceptual framework for brand loyalty: A Euro-Mediterranean Perspective. J. Brand Manag. 2011, 18, 285–299. [Google Scholar] [CrossRef]
- Harmeling, C.; Moffett, J.W.; Arnold, M.J.; Carlson, B.D. Toward a theory of customer engagement marketing. J. Acad. Mark. Sci. 2017, 45, 312–335. [Google Scholar] [CrossRef]
- Pansari, A.; Kumar, V. Customer engagement: The construct, antecedents, and consequences. J. Acad. Mark. Sci. 2017, 45, 294–311. [Google Scholar] [CrossRef]
- Van Doorn, J.; Lemon, K.N.; Mittal, V.; Nass, S.; Pick, D.; Pirner, P.; Verhoef, P.C. Customer engagement behaviour: Theoretical foundations and research directions. J. Serv. Res. 2010, 13, 253–266. [Google Scholar] [CrossRef]
- Belen Del Rio, A.; Vazquezm, R.; Iglesias, V. The effects of brand associations on consumer response. J. Consum. Mark. 2001, 18, 410–425. [Google Scholar] [CrossRef]
- Keller, K.L. Conceptualizing, measuring and managing customer equity. J. Mark. 1993, 57, 1–22. [Google Scholar] [CrossRef]
- Kleijnen, M.K.; De Ruyter, K.; Andreassen, T.W. Image Congruence and the adoption of service innovations. J. Serv. Res. 2005, 7, 343–359. [Google Scholar] [CrossRef]
- Mehta, A. Using self-concept to assess advertising effectiveness. J. Advert. Res. 1999, 39, 81–89. [Google Scholar]
- Kumar, V.; Aksoy, L.; Donkers, B.; Venkatesan, R.; Wiesel, T.; Tillmanns, S. Undervalued or overvalued customers: Capturing total customer engagement value. J. Serv. Res. 2010, 13, 297–310. [Google Scholar] [CrossRef]
- Bowden, J.L.H. The process of customer engagement: A conceptual framework. J. Mark. Theory Pract. 2009, 17, 63–74. [Google Scholar] [CrossRef]
- Kozinets, R.V.; De Vlack, K.; Woznicki, A.C.; Wilner, S. Network Narratives: Understanding Word-of Mouth marketing in online communities. J. Mark. 2010, 74, 71–89. [Google Scholar] [CrossRef]
- Shultz, D.E. IMC measurement: The challenges of interactive marketplace. Int. J. Mark. Commun. 2011, 3, 7–24. [Google Scholar]
- Shultz, D.E.; Paltier, J. Social media’s slippery slope, challenges opportunities and future directions. J. Interact. Mark. 2013, 7, 86–99. [Google Scholar] [CrossRef]
- Keller, K.L.; Lehmann, D.R. Brands and Branding: Research findings and future priorities. Mark. Sci. 2006, 25, 740–759. [Google Scholar] [CrossRef]
- Lessar, W.; Mittal, B.; Sharma, A. Measuring Customer Based Brand Equity. J. Consum. Mark. 1995, 12, 11–19. [Google Scholar] [CrossRef]
- Cobb-Walgren, C.J.; Ruble, C.A.; Donthu, N. Brand Equity, Brand Preference, and Purchase Intent. J. Advert. 1995, 24, 25–40. [Google Scholar] [CrossRef]
- Palos-Sanchez, P.R.; Saura, J.R. The Effect of Internet Searches on Afforestation: The Case of a Green Search Engine. Forests 2018, 9, 51. [Google Scholar] [CrossRef]
- Palos-Sanchez, P.; Saura, J.R.; Martin-Velicia, F. A study of the effects of programmatic advertising on users’ concerns about privacy overtime. J. Bus. Res. 2019, 96, 61–72. [Google Scholar] [CrossRef]
- Bilgihan, A.; Bujisik, M. The Effect of Website Features in Online Relationship Marketing: A Case of Online Hotel Booking. Electron. Commer. Res. Appl. 2015, 14, 222–232. [Google Scholar] [CrossRef]
- Confos, N.; Davis, T. Young consumer-brand relationship building potential using digital marketing. Eur. J. Mark. 2016, 50, 1993–2017. [Google Scholar] [CrossRef]


© 2019 by the authors. Licensee MDPI, Basel, Switzerland. This article is an open access article distributed under the terms and conditions of the Creative Commons Attribution (CC BY) license (http://creativecommons.org/licenses/by/4.0/).