Abstract
Understanding travel behavior and its relationship with built environment is crucial for sustainable transportation and land-use policy-making. This study provides additional insights into the linkage between the built environment and travel mode choice by looking at the built environment characteristics at both the trip origin and destination in the context of transit-oriented development (TOD). The objective of this research is to provide a better understanding of how travel mode choice is influenced by the built environment surrounding both trip end locations. Specifically, it investigates the effect of transit-oriented development policy and the way it affects people’s mode choice decisions. This is accomplished by developing discrete choice models and consideration of urban form characteristics at both trip ends. Our findings not only confirmed the important role the built environment plays in influencing mode choice, but also highlighted the influence of policies, such as TOD, at both trip end locations. Results suggest that the probability of choosing transit and non-motorized modes is higher for trips originating and ending in TOD areas. However, the magnitude of this TOD effect is larger at trip origin compared to destination. Higher residential and employment densities at both trips ends are also associated with lower probability of auto and higher probability of transit and non-motorized mode choices.
1. Introduction
The relationship between the built environment and travel patterns have received significant scholarly attention within the past few decades. Previous research suggests that changing the urban form pattern to a more compact, transit-friendly, and mixed-use pattern will eventually result in lower auto dependency and promote transit and non-motorized modes [1,2,3,4]. Among various policies to promote transit ridership and cope with congestion, transit-oriented development (TOD) has become popular recently; it has been implemented in many regions in response to issues associated with urban sprawl and high auto dependency.
TOD offers many social, environmental, economic, and health benefits. It is associated with high-density, mixed-use development and walkable design, which brings various opportunities closer to residential locations, and facilitate walking, cycling, and transit mode choice [5]. Therefore, TOD affects people’s travel behavior primarily through increasing mode choice alternatives and encouraging transit and non-motorized modes. It is expected that people living in TODs have a more sustainable and active lifestyle and less automobile dependency [5,6].
Many researchers believe that the built environment pattern at both trip origin and trip destination plays a role in changing travel patterns, by influencing travel attributes such as travel time, distance, and mode of travel. Usually, in typical discrete mode choice models based on utility maximization theory [7], variables included are mostly the traveler’s socio-demographic characteristics, and the mode-specific attributes of travel, such as time, cost, and level of comfort; the effect of urban form at trip origin and destination is usually neglected in such models. This results in these models being under-specified and unable to fully explain the mode choice decision process, or the contributing factors [8]. This study tries to overcome these limitations by: (1) constructing a multinomial logit model for mode choice for Washington, D.C. metropolitan area, using built environment characteristics at both trip origin and destination; and (2) investigating the effect of TOD at either trip origin or destination on travel mode choice, and to see whether trips originated/ended in TOD areas have higher probabilities of transit and non-motorized mode choice.
This research investigates the effects of built environment on mode choice in the context of TOD for 22,367 individuals making over 87,000 trips within Washington, D.C., and 19,664 individuals making about 72,000 trips in the Baltimore metropolitan area. It considers the built environment characteristics at both trip origin and destination—such as residential and employment densities, level of mixed development, and street connectivity—in addition to controlling the households’ socio-demographic factors and travel time utilities. A multinomial logit model is built using the 2007/2008 household travel survey data for the Washington, D.C. and Baltimore metropolitan areas. The travel survey data includes geocoded trip origin and destination location as well as other characteristics of each trip, such as travel distance and time, trip purpose, and mode used on trip, as well as the characteristics of the trip maker, such as age, gender, education level, income, car ownership, worker status, etc.
Based on all of the discussions above, the objective of this paper is to understand how the mode choice decision is made in response to the built environment characteristics of both the trip origin and destination, particularly if one or both trip ends are located within a TOD boundary. It makes a comparison between two adjacent metropolitan areas and shows how mode choice behavior is different in TOD areas of two metropolitan areas with different populations, transit network characteristics, and land use patterns and provides additional evidence and lessons to learn by policy-makers and planners who seek to evaluate and expand TODs throughout the nation.
The following section provides a brief review of past studies on the impacts of urban form on travel behavior and more specifically, the influence of traveling to/from TODs, on mode choice decisions. Next, we describe the research design, including the characteristics of the study areas, data sources and processing, and methodology used to identify TODs, and investigate the mode choice patterns. Finally, multinomial logit (MNL) model results are presented and discussed, followed by conclusions, study limitations, and potential future research directions.
2. TOD and Travel Behavior in the Literature
TOD is generally defined as a neighborhood where people can access and use transit as easily and conveniently as driving a private automobile to reach various destinations [9]. TODs have many potential benefits highlighted in previous literature, such as promoting the use of transit and non-motorized modes, increasing job accessibility, reducing auto dependency and traffic congestion, and improving environmental air quality [10,11,12]. Several studies in the past have focused on quantifying the benefits of TOD and its impacts on travel behavior, such as VMT [13,14], traffic congestion [10,15,16], mode choice [11,17,18,19], and trip generation [20,21,22]. Many studies show that people who live in TOD areas tend to use transit and non-motorized modes more, compared to those living in non-TOD areas [13,23,24].
Travel mode choice analysis has received significant scholarly attention in previous literature. Various factors identified in the previous literature to have significant impact on mode choice decision-making are as follows: mode-specific factors, such as availability, cost, convenience, privacy, safety, etc.; individual-specific factors, such as socioeconomic and demographic characteristics; environmental factors, such as urban form of the trip origin and destination; Trip-related characteristics such as time of travel, purpose, trip distance, and origin/destination location of the trips; and attitudinal factors such as health concerns, habits, cultures, etc. [25]. Among these factors, the urban form characteristics have probably received the most scholarly attention [1,26,27,28]. Ewing and Cervero [26] performed a meta-analysis of the effect of built environment and urban form on travel and argue that mode choice is influenced by both the socioeconomic and demographic characteristics of the travelers as well as the built environment pattern. Moreover, not all the urban form measures have the same influence in terms of significance and magnitude on the choice of various modes. They argue that, for instance, walking is mostly influenced by measures of land use diversity, intersection density, and destination accessibility level within walking distance. On the other hand, transit mode choice is influenced by service proximity and street network design variables, in addition to the degree of land use diversity and parking availability and activity density around stations [26].
More recently, researchers investigated the effect of the built environment on mode choice through some mediating factors such as car ownership and travel distance and suggested that built environment has both direct and indirect effects on mode choice and confirmed that higher densities are associated with lower probability of auto mode choice and higher probability of transit and walk mode choice [29]. Similar results were found in many other empirical studies within the past several years [30,31,32].
However, there has been limited recognition of the spatial characteristics of where a trip begins and ends, and their impact on mode choice decision. Cervero [8] argued that “… the potential effects of densities, land-use mixtures, and urban designs in and around trip origins and destinations are left unsaid. This compromises the ability to test the possible transportation benefits of land-use initiatives, be they transit-oriented development, infill housing, neo-traditional towns, or clustered developments that promote efficient automobile circulation.” Within the past decade or so, several studies tried to fill in this research gap by considering the effects of built environment characteristics in their mode choice models [8,33,34,35,36]. However, due to many limitations, such as data availability and lack of a reliable land use quantification system at an appropriate spatial unit of measurement, the majority of these studies only looked at the urban form at trip origin (i.e., mostly at home location). Very few studies considered the built environment characteristics of both home and work locations and their influence on commute trips [1,8,32,35,37]. These studies all confirmed the importance of consideration of land use characteristics at both trip ends in the utility-based mode choice models, and suggested that people who travel to/from high-density mixed-use neighborhoods near rail transit stations tend to drive less and take transit more. For instance, Ding et al. [35] investigated the built environment effects of residential and workplace locations on mode choice using five major variables of residential and employment density, land use mixture, average block size, and distance from the city center. They found that employment density at workplace has a more important role than densities at residential location [35]. Additionally, Shen et al. [38] investigated effects of rail transit-supported urban expansion on commute mode choice in several Chinese cities and found that the proximity of the residence location to rail stations and the population density in the work location are both significantly and positively associated with the choice of rail transit as the primary commuting mode. However, they also found that longer commuting distance is associated with higher probabilities of using transit, rather than driving, to work [38].
However, as mentioned before, the majority of these studies excluded non-work trips (due to data limitations), which are the majority of daily trips made in the U.S. According to NHTS 2009, 69% of all trips made on weekdays and 90% of all trips made on weekends are non-work trips (compared to 31% and 10% work trips, respectively) (Summary of travel trends: 2009 national household travel survey) [39]. Thus, there is still significant research that needs to investigate the effect of the built environment and transit accessibility on mode choice, considering all trip purposes.
Moreover, despite numerous research efforts suggesting that TODs increase the probability of transit and non-motorized mode choice as they significantly improve transit accessibility and reduce the time and cost associated with transit mode choice [40], there has been limited research specifically looking at the quantitative effects of recently-popular development policies—such as TOD—on mode choice, looking at both trip origin and destination. Given the importance of effective evaluation of TOD’s performance for planners and policy-makers, a more in-depth investigation on various behavioral effects of TOD and other land use policies would be helpful for the future of urban design policy making and analyses. That requires analyzing the effect of the built environment and TOD—measured at both trip origin and destination—on mode choice.
In response to the existing research needs discussed above, this study investigates the effect of built environment and transit-oriented design—at both trip ends—on travel mode choice via a multinomial logit modeling approach. It contributes to the current literature by quantifying the effect of land use measures, such as density, diversity, and design, as well as the effect of a transit-oriented urban setting, on mode choice for both work and non-work trips. More importantly, it investigates the effect of transit-oriented policy by directly adding the variables to the model, specifying whether trip origin/destination is a TOD. The mode choice model is built based on socio-demographic characteristics of the trip maker (i.e., age, income, household size, number of workers, car ownership, and bike ownership), transit/auto travel time ratio (as a proxy for travel time utility), the built environment characteristics at both trip origin and destination (i.e., residential density, job density, entropy, and average block size), and a binary variable for TOD. The results of this study not only reveals the effect of the built environment at both trip origin and destination on travel behavior, but also measures the effect of TOD separately from other land use characteristics.
3. Research Design
3.1. Study Area
The Washington, D.C. metropolitan area consists of the District of Columbia, cities in Maryland and Northern Virginia, and a small part of West Virginia. It is the fourth-largest metropolitan area in terms of population and the most educated, highest-income metropolitan area in the country. According to US Census 2013, the Washington, D.C. metropolitan area has the highest per capita income and the third-highest household median income in the United States. The Baltimore–Columbia–Towson metropolitan area, also known as Central Maryland, is located next to the Washington, D.C. metro area and is well connected to it via road and transit networks.
Table 1 summarizes the characteristics of the study area in terms of population, size, and socio-demographic attributes of residents compared to the entire nation. As it indicates, both households’ median income and per capita income in Washington, D.C. metropolitan area are above the average for the whole nation. In terms of car ownership, which has proved to be one of the key factors influencing mode choice, the Washington D.C. metro area has a 1% lower percentage of zero-automobile households and households who own two and more automobiles. The percentage of households who own one automobile is the same as that in the whole nation.

Table 1.
Washington, D.C. characteristics.
The Washington, D.C. metro area also has a very extensive and efficient transit network, with four major rail transit systems (Washington, D.C. Metro line-WMATA, Maryland Commuter Rail-Marc, Virginia Railway Express, and Amtrak high-speed train) and many bus transit systems. Together, these systems connect the Capitol Hill/Downtown area to various parts of the District of Columbia, and several jurisdictions in the states of Maryland and Virginia. Figure 1 below illustrates the location and coverage of major rail transit lines in addition to the major highway network. As indicated, D.C.’s rail transit system connects Washington, D.C., Baltimore, and major cities in Virginia, such as Arlington and Fairfax. Promoting high-density and pedestrian-friendly development with a concentration of various destination types (i.e., mixed-use development) around these transit stations is expected to serve a large population living in these regions and encourage many transit trips to replace auto travel.
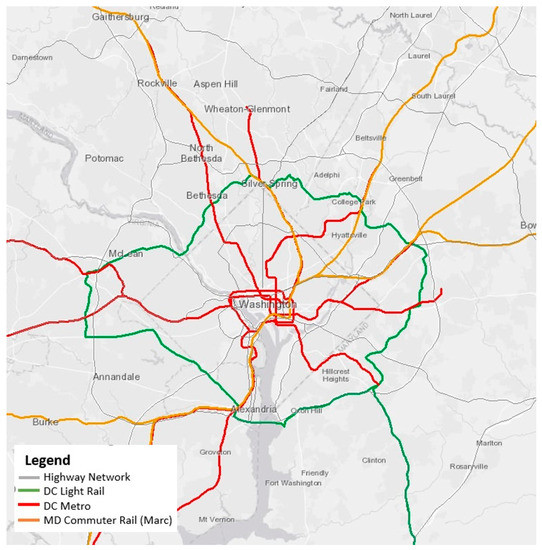
Figure 1.
Washington, D.C. transit system map.
The Washington, D.C. region has always been ahead of many other cities in the U.S. in terms of TOD planning and implementation. The successful implementation of TODs in Arlington, VA, Silver Spring, MD, and Columbia Heights, D.C. are a few examples. However, as it can be imagined, each of these TODs had its own characteristics in terms of current status of immediate land use around the stations and level of flexibility for redevelopment (as lands could be owned by government agencies, local transit authorities, or private parties) and required different approaches to satisfy the TOD requirements of high density mixed use developments and pedestrian-oriented designs. Thus, although D.C. metropolitan area is very active in terms of TOD planning and implementation, successful TODs have been achieved through varying approaches, customized based on area-specific status and needs.
3.2. Data and Variable Calculations
This study employs various data sources, such as travel survey data, land use data, transit station location data, and auto and transit travel time matrix data. The 2007/2008 household travel survey data was obtained from Metropolitan Washington Council of Government (MWCOG) in Washington, D.C. After removing observations with missing values, the data include around 87,000 trips made by 22,367 individuals living in the Washington, D.C. metro area with various backgrounds and socio-demographic characteristics.
For each trip, the origin and destination location information is provided at the traffic analysis zone (TAZ) level. Also, individual traveler’s information such as age, gender, race, and employment status, along with household information such as household’s size, annual income, car ownership status, number of workers, number of bikes available in the household, etc., is provided in the survey.
To calculate built environment characteristics associated with both trip ends, the most recent land use data was obtained from MWCOG. Four major land use variables were calculated for the analyses; residential density, job density, land use mix (entropy), and average block size (street connectivity).
In order to identify TOD areas, major rail transit station data for the Washington, D.C. metropolitan area was obtained from the National TOD database, created by the Center for Transit-Oriented Development (CTOD). This dataset includes exact XY coordinates for all fixed guideway transit stations in the Washington, D.C. metropolitan area [41] (http://toddata.cnt.org/). Using the ArcGIS version 10.2 (Redlands, CA, USA) [42] spatial analysis tools, a half-mile buffer was created around each station to represent the transit zone (TOD).
Travel time for auto and transit were calculated using the origin-destination (OD) skim matrices from the MWCOG, which includes the network-based time required to travel between centroids of each TAZ pairs in the area for auto and transit, separately. The travel times are calculated for peak and off-peak periods separately and replaced in the data based on when the trips were made (for trips made during peak/off-peak period, travel time for peak/off-peak hours is replaced). Additionally, to calculate transit travel time between each TAZ pairs, access time, initial waiting time, transfer waiting time, transfer walk time, and in-vehicle time are all considered. Walk travel time is also calculated based on travel distance, and by using the average walking speed (3.1 mph) and detour factor (1.4), although it is not included in the final model.
Three classes of explanatory variables were used in the model: (1) the ratio of travel time by transit to travel time by auto (as a measure of utility of travel); (2) the trip-maker’s socioeconomic characteristics such as age, income, gender, household size, car ownership, the number of workers in the household, and number of bikes available in the household; and (3) land use characteristics of both trip origin and destination location. Land use variables used in the model include residential and employment densities, level of land use mix, and average block size at both trip origin and destination. A binary variable to specify whether trip origin/destination was located in a TOD zone was also included. Table 2 provides a list of variables used in the mode choice model, along with definition, calculation process, and descriptive statistics. It divides the variables into four categories; trip makers’ characteristics, built environment characteristics, TOD, and travel attributes. It also provides a summary of the number of trips originated or ended in TODs vs. trips with both trip ends located in TODs. As it indicates, out of 86,824 trips in our analysis, 17,315 trips are either originated or ended in TOD zones (which is only 20% of all trips we modeled). Very few trips occurred with both trip ends located in TODs (2734), with a higher proportion of trips occurring between two different TODs as opposed to the same TOD (1725 vs. 1009). Our descriptive analysis also indicates that of the 2734 trips with both trip ends in TODs, only 191 trips were made by transit, and about the same number of trips were made by auto and walk/bike modes (1292 trips by auto and 1207 trips by walk/bike). Out of 1009 trips made within the same TOD, 291 were made by auto and the rest were made by walk/bike. No trips were made by transit within the same TOD as it is expected (as we only considered rail stations as TOD locations and it does not make sense to use transit unless you want to travel between different stations).
Table 2.
Variables and descriptions.
3.3. TOD Identification
Theoretically, TOD is defined as a neighborhood consisting of one major public transit station or hub, surrounded by high-density development with a mixture of residential, employment, shopping and civic uses, and lower-density development gradually spreading outward from the center [43]. In practice, many TOD studies defined TOD boundaries using a half-mile buffer around selected transit stops [6,44,45,46].
When TODs are identified, it is important to distinguish between TODs and TADs. TAD (transit-adjacent development) is identified as a failure of TOD, characterizing as a transit center surrounded by mostly homogenous land use patterns, poorly-connected streets, and relatively low densities that are characterized as auto-dependent [5,6,47,48]. Regrettably, many researchers in the past misleadingly treated TADs as TODs, ignoring the fact that about 60% of rail transit stations in the U.S. do not have the required features to be called TOD, rather they are more like TADs [5,49]. Failure to take into account other characteristics, such as high density, convenient and connected streets, and diversified land use patterns, into the TOD identification process would result in misleading results about the various impacts of TOD on travel behavior, traffic congestion, and the environment.
A few studies in the past tried to distinguish between TODs and TADs by considering one or more land use characteristics, such as residential and employment densities, street connectivity, and mixed-use development [5,13,49,50,51,52]. In addition, some studies considered housing affordability as an important factor to consider when identifying TODs [20].
We adapted a methodology first introduced in Nasri and Zhang [13]. They proposed a mathematically rigorous definition to quantitatively measure TODs and their boundaries based on the level of transit accessibility, as well as consider some important land use features required in TOD planning and design [13]. We chose this identification method as it clearly differentiates between TOD and TAD by taking into account measures such as density, street connectivity, and mixed-use pattern. Moreover, this methodology is easy to use and apply to various regions, as it is based on transit accessibility and zone-level built environment measures, which are easy to calculate in different metropolitan areas and regions. It identifies TODs as a single or a combination of adjacent geographical zones, where each zone meets the following requirements:
where:
- = Residential density of = residential population/area (acre)
- = Employment density of = employment/area (acre)
- = Average residential density for the entire metropolitan area
- = Average employment density for the entire metropolitan area
- = Average block size of (sq. mi)
- = Average block size for the entire metropolitan area
- is the rank of Entropy () when sorted decreasingly according to entropy
- is the circle of radius 0.5 mile around point
- is the point where the transit station is located
Figure 2 below shows the location of TOD zones with respect to the major road network in Washington, D.C. metropolitan area. As it indicates, the majority of TODs are located inside the I-495 Capital Beltway which covers the Central D.C. and Capitol Hill region. There are TODs located in other parts such as College Park, Rockville, and Silver Spring in Maryland and Arlington and Fairfax in Virginia as well.
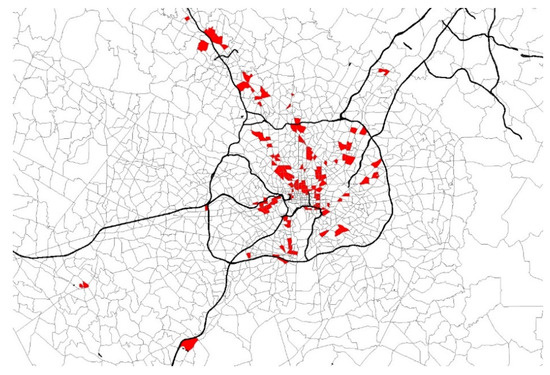
Figure 2.
TOD locations in Washington, D.C. metropolitan area.
Using data sources described in the previous section, the four built environment measures have been calculated for each zone; spatial analysis techniques were used to overlap the geocoded rail transit station data and the built environment measures in order to identify the transit stations with the specified urban form required to qualify as TODs. The results have been used in the model as a binary variable called TOD, with a value 1 for the TAZ to be considered as a TOD area and zero otherwise.
3.4. Mode Choice Models
Discrete choice models and specifically, multinomial logit (MNL) models based on random utility maximization, have been widely-used for mode choice studies in previous literature. These models have a simple mathematical framework and are relatively easy to estimate [29]. The MNL model is based on three main assumptions: (1) alternatives are independent from each other; (2) individual’s choice error terms are independent; and (3) the error associated with each individual is assumed to be normally distributed [53].
To test the hypothesis that trips that originate and/or end in TOD areas have a higher probability of being made by transit or non-motorized modes, the discrete choice model was developed for the Washington, D.C. metropolitan area. MNL was chosen and the utilities were calculated for each mode alternative. In this process, a random utility model is designed to predict the choice of an individual n among a discrete set of alternatives. It is assumed that each individual associates a utility to each available alternative and eventually, chooses the alternative with the highest utility. Utility is a unit-less measure of how much benefit individual n receives for choosing a particular alternative. Utilities calculated for each mode are used to obtain the probability of individual n selecting a specific alternative mode. The alternative mode with the highest utility is the most likely to be chosen by an individual. The utility associated by individual n to alternative i, denoted by , is a random variable so that:
where:
- = the utility of alternative i to individual n
- a set of socio-demographic characteristics of individual n, travel time ratio, and built environment characteristics of trip ends’ locations
- = a set of coefficient weights for the independent variables
- error term
The probability that individual n chooses alternative i is given by:
where:
- = the probability that alternative i is selected by individual n
- = the utility of alternative i to individual n (calculated in equation above)
- J = the total number of alternatives (in our case it is 4)
The maximum likelihood estimation (MLE) was used to calculate the MNL coefficient weights. It is done by using the observed records (the mode chosen in any of the trips recorded in the dataset) to calculate the set of coefficients that could re-produce the observed mode choice for each individual trip maker (with specific characteristics associated with it) in the most accurate way. The MLE maximizes the log likelihood function, which is calculated as:
where:
- = the log likelihood of a set of parameters θ given outcome x
- P = the probability of the observed outcome choice x given the set of parameters θ for the set of observed individuals n.
The process of calculating the log likelihood continues with iterations until the maximized value is obtained. Modes included in the model are transit, auto, walk/bike, and other (treated as base in the model specification). Biogeme software was employed to run the MNL models. It is an open source software designed for the maximum likelihood estimation of parametric models, and in particular, discrete choice models [54].
4. Results and Discussion
Table 3 summarizes the results of the final MNL mode choice model after many iterations. As it indicates, the choice of travel mode is significantly influenced by both socio-demographic characteristics of travelers as well as the land use pattern, at both trip origin and destination. The ratio of transit travel time to auto travel time has a significantly negative association with all modes (except for auto mode, which is not statistically significant). However, the coefficients for the walk/bike mode are larger in comparison. It implies that the higher the ratio of time it takes to travel from one point to another by transit to that by auto, the lower the probability of choosing transit and walk/bike modes for that specific trip. The age of the traveler also has a significant positive effect on all modes, with the coefficient of auto being slightly larger than the other two modes; the older the traveler, the higher the chance of driving, as opposed to taking transit or walking to reach destinations. Household income significantly and positively influences auto and non-motorized mode choice, while it does not show to be a significant factor in transit mode choice. Car ownership has a significant positive impact on auto and a negative impact on transit and walk/bike mode choice, which is an expected relationship. On the other hand, bike ownership (the number of bikes available in the household) does significantly influence mode choice by reducing the probability of choosing auto and transit, and increasing the probability of choosing the walk/bike mode. These results are all expected intuitively, and were found in a variety of previous research.
Table 3.
MNL results for mode choice.
Regarding the effect of built environment and transit accessibility on mode choice, the results indicate that overall, the built environment characteristics at both trip ends influences the mode choice. Specifically, trips originated and/or destined in TOD zones show to have lower probability of auto and higher probability of transit and walk/bike modes, as it is expected as one of the goals of TOD policy. However, the magnitude of the effect is slightly larger for the TOD at destination variable. This is probably because of the parking availability and price issue in TOD areas, which results in a lower probability of auto and higher probability of transit and non-motorized mode choice.
Other land use factors also have significant association with travel mode choice. Higher residential and employment densities at the trip origin and destination reduce the chance of driving and increase the probability of using transit and walk/bike modes (although the coefficient of residential density at both origin and destination is not statistically significant). A lower level of street connectivity (larger block size) at both trip origin and destination would reduce the probability of transit and walk/bike modes (although the coefficient for auto is also negative, its magnitude is much smaller than that of transit and walk/bike coefficients). Entropy—or level of land use mix—at both trip origin and destination has a significant positive correlation with auto and walk/bike probability and an insignificant negative correlation with transit mode choice probability. This implies that the choice of transit is minimally influenced by the level of land use mix. In reality, this is expected, since people who want to group their trips with various purposes into more complex tours do not usually tend to use transit, as auto is a more convenient mode for complex tours in more mixed-use development areas. On the other hand, living in neighborhoods with a high ratio of land use mix—where many destinations can be reached within walking distance—encourages residents to complete some non-work trips on foot, thus increasing the probability of choosing walk/bike mode. The results confirm that the effects of land use on mode choice is as significant at origin as it is at destination. Mode choice decision is influenced by the characteristics of trip origin (i.e., home location in most cases) such as density, connectivity, transit-friendliness, and destination accessibility, as well as the characteristics of trip destination. In many cases, the land use pattern (such as street design, parking availability, and level of mixed-use development) and transit accessibility at trip destinations play a more important role in determining the travel mode choice for both work and non-work trips, as the results highlighted.
Moreover, while the coefficients for trip origin and destination slightly differ in magnitude (i.e., in some cases the variables measured at trip origin is larger while in other cases, the destination variables are larger in magnitude), this difference is negligible and one could still conclude that built environment characteristics at both trips ends significantly influence mode choice, looking at the results presented here. This is in fact a significant finding as it provides additional evidence and insight for land use planners and policy makers for their future land use-transportation policies and programs. It supports the claim made in many previous studies that in order to reduce auto dependency and encourage more transit and non-motorized mode choice, land use and transportation planners and policy makers need to increase transit accessibility—via policies such as TOD—and support compact development not only in the city center, but also throughout the entire metropolitan areas to cover both trip ends [2,55].
In general, findings show that living and/or working in TODs reduces automobile use and encourages transit and non-motorized modes.
In summary, the mode choice model suggests that land use pattern at both trip ends plays an important role in determining the mode for travel in the study area. The mode choice model clearly shows that effective TOD policy and design significantly reduces the probability of driving and encourages transit ridership.
Findings from this disaggregate-level analysis clearly confirm the hypothesis proposed by TOD advocates, who claim that living within walking distance of transit, and specifically in TOD areas, will change people’s travel behavior towards a more sustainable manner, with less driving and more transit use, which will eventually lead to decreasing traffic congestion and pollution. Findings also show that, while proximity to transit alone encourages people to drive less and use transit more often, the additional attributes of TOD make it more influential on reducing automobile use and encourage transit ridership.
5. Conclusions
This study investigated the effect of the built environment, and TOD policy, at both trip origin and destination on travel mode choice, using data from the Washington, D.C. metropolitan area. It contributes to the current literature by investigating whether and to what extent compact and mixed use development and transit accessibility at the trip destination influences travel mode decisions. Previous literature has extensively focused on answering the same question—at the trip origin—and little was known about the similar effect of built environment and urban form at the other end of the trips. The results of this study offer some insight to mode choice decisions of people who travel to/from TOD areas and whether they are more likely to choose transit and non-motorized modes over automobiles. As TOD has become a very popular transportation policy in many cities with varying urban forms and transit network patterns all around the world, in addition to the cities and regions in the United States, land use planners and transportation policy makers in cities and metropolitan areas outside the U.S. can also benefit from the results of this study in their ongoing and future transit-friendly policies and plans to reduce auto dependency as the results suggest that providing transit accessibility and high-density urban form at trip destinations is as significant as it is at the trip origins. In fact, in order to get the best outcome of the TOD and compact development policies, it is crucial to implement them throughout the entire cities and metropolitan areas to provide better opportunities for people with varying mobility patterns to make sustainable modes, such as transit and walk/bike, a part of their routine daily travel and reduce their automobile dependency.
Despite the many societal benefits of TOD, challenges remain for TOD planning and implementation. There is a serious concern about how TOD serves different social classes, as well as the very young, elderly, and disabled population [23]; how to balance the population by providing affordable housing near TOD zones is an ongoing discussion. TOD design should also be convenient and appealing for disabled individuals by providing special accommodations for them to ride on/off transit as easily and smoothly as possible. At its current state, even in cities such as New York with an efficient transit system and high ridership level, the required facilities and services necessary for the disabled population are not in place. This is an important limitation of TODs, particularly because disabled individuals may not be able to drive and require transit even more than the rest of the population.
On the other hand, city planners and developers struggle to determine how much parking to provide in TOD areas to facilitate park-and-ride trips that promote transit usage for the auto-dependent majority. There are no guidelines in the literature for parking space requirements in TOD areas; it is also one of the limitations of the current study due to lack of parking data.
Another limitation of this study is that, similar to many other TOD studies, it only analyzes TODs of one metropolitan area. This limits the ability to generalize the findings to other regions. Additionally, the residential self-selection effect is not taken into account in this analysis, as it uses cross-sectional data. In terms of the power of the mode choice model, this study could be improved by incorporating trip purpose into the model’s framework for a more in-depth analysis of mode choice pattern in TOD areas, including additional transit service quality measures, as well as many land use factors, such as the length and quality of sidewalks, parking availability within TOD stations and surrounding neighborhoods, accessibility measures, and road network design measures. Overcoming these limitations requires additional data and research efforts which could be done in a future study.
Author Contributions
Conceptualization: A.N. and L.Z.; methodology: A.N.; software: A.N.; validation: A.N. and L.Z.; formal analysis: A.N.; investigation: A.N.; resources: A.N. and L.Z.; data curation: A.N.; writing—original draft preparation: A.N.; writing—review and editing: A.N. and L.Z.; visualization: A.N.; supervision: L.Z.; project administration: L.Z.; funding acquisition: L.Z.
Funding
This research received no external funding.
Acknowledgments
This research is partially funded by the Maryland Transportation Institute and National Center for Smart Growth at the University of Maryland, College Park. The authors would also like to thank Transportation Planning Board (TPB) at the MWCOG and Baltimore Metropolitan Council (BMC) for providing the data used in this analysis. The authors are solely responsible for the content of this paper.
Conflicts of Interest
The authors declare no conflict of interest.
References
- Ewing, R.; Cervero, R. Travel and the built environment: A synthesis. Transp. Res. Record J. Transp. Res. Board 2001, 1780, 87–114. [Google Scholar] [CrossRef]
- Nasri, A.A. The Influence of Urban Form at Different Geographical Scales on Travel Behavior; Evidence from US Cities. Ph.D. Thesis, University of Maryland, College Park, MD, USA, 2016. [Google Scholar]
- Zhang, L.; Hong, J.; Nasri, A.; Shen, Q. How built environment affects travel behavior: A comparative analysis of the connections between land use and vehicle miles traveled in US cities. J. Transp. Land Use 2012, 5, 40–52. [Google Scholar] [CrossRef]
- Chatman, D.G. Deconstructing development density: Quality, quantity and price effects on household non-work travel. Transp. Res. Part A Policy Pract. 2008, 42, 1008–1030. [Google Scholar] [CrossRef]
- Kamruzzaman, M.; Shatu, F.M.; Hine, J.; Turrell, G. Commuting mode choice in transit oriented development: Disentangling the effects of competitive neighbourhoods, travel attitudes, and self-selection. Transp. Policy 2015, 42, 187–196. [Google Scholar] [CrossRef]
- Dittmar, H.; Ohland, G. (Eds.) The New Transit Town: Best Practices in Transit-Oriented Development; Island Press: Washington, DC, USA, 2012. [Google Scholar]
- Domencich, T.A.; McFadden, D. Urban Travel Demand-A Behavioral Analysis: Contributions to Economic Analysis; North Holland: Amsterdam, The Netherlands, 1975; pp. 1–213. [Google Scholar]
- Cervero, R. Built environments and mode choice: Toward a normative framework. Transp. Res. Part D Transp. Environ. 2002, 7, 265–284. [Google Scholar] [CrossRef]
- Dittmar, H.; Poticha, S. Defining transit-oriented development: The new regional building block. In The New Transit town: Best Practices in Transit-Oriented Development; Island Press: Washington, DC, USA, 2004; pp. 19–40. [Google Scholar]
- Zhang, M. Can transit-oriented development reduce peak-hour congestion? Transp. Res. Record J. Transp. Res. Board 2010, 2174, 148–155. [Google Scholar] [CrossRef]
- Arrington, G.B.; Cervero, R. TCRP Report 128: Effects of TOD on Housing, Parking, and Travel; Transportation Research Board of the National Academies: Washington, DC, USA, 2008. [Google Scholar]
- Lund, H.M.; Cervero, R.; Willson, R. Travel Characteristics of Transit-Oriented Development in California; California Department of Transportation: Sacramento, CA, USA, 2004.
- Nasri, A.; Zhang, L. The analysis of transit-oriented development (TOD) in Washington, DC and Baltimore metropolitan areas. Transp. Policy 2014, 32, 172–179. [Google Scholar] [CrossRef]
- Chen, F.; Wu, J.; Chen, X.; Wang, J. Vehicle kilometers traveled reduction impacts of transit-oriented development: Evidence from Shanghai city. Transp. Res. Part D Transp. Environ. 2017, 55, 227–245. [Google Scholar] [CrossRef]
- Nasri, A.; Zhu, Z.; Zamir, K.R.; Xiong, C.; Zhang, L. Simulation-Based Approach for Analyzing the Regional and Local Impacts of Transit-Oriented Development on Congestion and Emissions. In Proceedings of the Transportation Research Board 93rd Annual Meeting (No. 14-3696), Washington, DC, USA, 12–16 January 2014. [Google Scholar]
- Tang, B.S.; Chiang, Y.H.; Baldwin, A.N.; Yeung, C.W. Study of the Integrated Rail-Property Development Model in Hong Kong; The Hong Kong Polytechnic University: Hong Kong, China, 2004. [Google Scholar]
- Cervero, R. Transit-oriented development’s ridership bonus: A product of self-selection and public policies. Environ. Plan. A 2007, 39, 2068–2085. [Google Scholar] [CrossRef]
- Lindsey, M.; Schofer, J.L.; Durango-Cohen, P.; Gray, K.A. Relationship between proximity to transit and ridership for journey-to-work trips in Chicago. Transp. Res. Part A Policy Pract. 2010, 44, 697–709. [Google Scholar] [CrossRef]
- Griffiths, B.; Curtis, C. Effectiveness of Transit Oriented Development in Reducing Car Use: Case Study of Subiaco, Western Australia. Urban Policy Res. 2017, 35, 391–408. [Google Scholar] [CrossRef]
- Zamir, K.; Nasri, A.; Baghaei, B.; Mahapatra, S.; Zhang, L. Effects of transit-oriented development on trip generation, distribution, and mode share in Washington, DC, and Baltimore, Maryland. Transp. Res. Record J. Transp. Res. Board 2014, 2413, 45–53. [Google Scholar] [CrossRef]
- Tian, G.; Ewing, R.; Weinberger, R.; Shively, K.; Stinger, P.; Hamidi, S. Trip and parking generation at transit-oriented developments: A case study of Redmond TOD, Seattle region. Transportation 2016, 44, 1235–1254. [Google Scholar] [CrossRef]
- Ewing, R.; Tian, G.; Lyons, T.; Terzano, K. Trip and parking generation at transit-oriented developments: Five US case studies. Landsc. Urban Plan. 2017, 160, 69–78. [Google Scholar] [CrossRef]
- Olaru, D.; Curtis, C. Designing TOD precincts: Accessibility and travel patterns. Eur. J. Transp. Infrastruct. Res. 2015, 15, 6–26. [Google Scholar]
- Langlois, M.; van Lierop, D.; Wasfi, R.A.; El-Geneidy, A.M. Chasing Sustainability: Do New Transit-Oriented Development Residents Adopt More Sustainable Modes of Transportation? Transp. Res. Record J. Transp. Res. Board 2015, 2531, 83–92. [Google Scholar] [CrossRef]
- Zhou, J. Sustainable commute in a car-dominant city: Factors affecting alternative mode choices among university students. Transp. Res. Part A Policy Pract. 2012, 46, 1013–1029. [Google Scholar] [CrossRef]
- Ewing, R.; Cervero, R. Travel and the built environment: A meta-analysis. J. Am. Plan. Assoc. 2010, 76, 265–294. [Google Scholar] [CrossRef]
- Badoe, D.A.; Miller, E.J. Transportation–Land-use interaction: Empirical findings in North America, and their implications for modeling. Transp. Res. Part D Transp. Environ. 2000, 5, 235–263. [Google Scholar] [CrossRef]
- Crane, R. The influence of urban form on travel: An interpretive review. J. Plan. Lit. 2000, 15, 3–23. [Google Scholar] [CrossRef]
- Ding, C.; Wang, D.; Liu, C.; Zhang, Y.; Yang, J. Exploring the influence of built environment on travel mode choice considering the mediating effects of car ownership and travel distance. Transp. Res. Part A Policy Pract. 2017, 100, 65–80. [Google Scholar] [CrossRef]
- Zhang, M. The role of land use in travel mode choice: Evidence from Boston and Hong Kong. J. Am. Plan. Assoc. 2004, 70, 344–360. [Google Scholar] [CrossRef]
- Pinjari, A.R.; Pendyala, R.M.; Bhat, C.R.; Waddell, P.A. Modeling residential sorting effects to understand the impact of the built environment on commute mode choice. Transportation 2007, 34, 557–573. [Google Scholar] [CrossRef]
- Chen, C.; Gong, H.; Paaswell, R. Role of the built environment on mode choice decisions: Additional evidence on the impact of density. Transportation 2008, 35, 285–299. [Google Scholar] [CrossRef]
- Rodríguez, D.A.; Joo, J. The relationship between non-motorized mode choice and the local physical environment. Transp. Res. Part D Transp. Environ. 2004, 9, 151–173. [Google Scholar] [CrossRef]
- Schwanen, T.; Mokhtarian, P.L. What affects commute mode choice: Neighborhood physical structure or preferences toward neighborhoods? J. Transp. Geogr. 2005, 13, 83–99. [Google Scholar] [CrossRef]
- Ding, C.; Lin, Y.; Liu, C. Exploring the influence of built environment on tour-based commuter mode choice: A cross-classified multilevel modeling approach. Transp. Res. Part D Transp. Environ. 2014, 32, 230–238. [Google Scholar] [CrossRef]
- Garrison, C. Livable Neighborhood Factors Affecting Mode Choices in a Medium Sized University Community. Master’s Thesis, Auburn University, Auburn, AL, USA, 2015. [Google Scholar]
- Khan, M.; Kockelman, K.M.; Xiong, X. Models for anticipating non-motorized travel choices, and the role of the built environment. Transp. Policy 2014, 35, 117–126. [Google Scholar] [CrossRef]
- Shen, Q.; Chen, P.; Pan, H. Factors affecting car ownership and mode choice in rail transit-supported suburbs of a large Chinese city. Transp. Res. Part A Policy Pract. 2016, 94, 31–44. [Google Scholar] [CrossRef]
- Santos, A.; McGuckin, N.; Nakamoto, H.Y.; Gray, D.; Liss, S. Summary of Travel Trends: 2009 National Household Travel Survey (No. FHWA-PL-ll-022); U.S. Department of Transportation: Washington, DC, USA, 2011.
- Collins, C.M.; Chambers, S.M. Psychological and situational influences on commuter transport-mode choice. Environ. Behav. 2005, 37, 640–661. [Google Scholar] [CrossRef]
- National TOD Database; Center for Neighborhood Technology: Chicago, IL, USA, 2012; Available online: https://toddata.cnt.org/ (accessed on 10 June 2019).
- ESRI. ArcGIS Desktop: Release 10. 2; Environmental Systems Research Institute: Redlands, CA, USA, 2011; Available online: https://www.esri.com/en-us/arcgis/about-arcgis/overview (accessed on 10 June 2019).
- Holmes, J.; van Hemert, J. Transit Oriented Development; The Rocky Mountain Land Use Institute: Denver, CO, USA, 2008. [Google Scholar]
- Fogarty, N.; Austin, M. Rails to Real Estate: Development Patterns along Three New Transit Lines (No. FTA CA-26-1007-03); The National Academies of Sciences, Engineering, and Medicine: Washington, DC, USA, 2011. [Google Scholar]
- Soursourian, M. Equipping Communities to Achieve Equitable Transit-Oriented Development. Community Invest. 2010, 22, 22–45. [Google Scholar]
- Evans, I.V.; Pratt, R.H.; Stryker, A.; Kuzmyak, J.R. Transit Oriented Development—Traveler Response to Transportation System Changes, Transit Cooperative Research Program (TCRP) Report 95; Transportation Research Board of the National Academies: Washington, DC, USA, 2007. [Google Scholar]
- Belzer, D.; Autler, G. Transit Oriented Development: Moving from Rhetoric to Reality; Brookings Institution Center on Urban and Metropolitan Policy: Washington, DC, USA, 2002; pp. 6–15. [Google Scholar]
- Cervero, R.; Duncan, M. Residential Self Selection and Rail Commuting: A Nested Logit Analysis; University of California Transportation Center: Berkeley, CA, USA, 2002; Available online: https://escholarship.org/uc/item/1wg020cd (accessed on 16 August 2017).
- Renne, J.L.; Ewing, R. Transit-Oriented Development: An Examination of America’s Transit Precincts in 2000 & 2010; UNOTI Publications: New Orleans, LA, USA, 2013; p. 17. Available online: https://scholarworks.uno.edu/unoti_pubs/17 (accessed on 16 August 2017).
- Pollack, S.; Gartsman, A.; Boston, M.; Benedict, A.; Wood, J. Rating the performance of station areas for effective and equitable transit oriented development. In Proceedings of the Transportation Research Board 93rd Annual Meeting (No. 14-0392), Washington, DC, USA, 12–16 January 2014. [Google Scholar]
- Jeihani, M.; Zhang, L.; Ardeshiri, A.; Amiri, A.; Nasri, A.; Zamir, K.R.; Baghaei, B. Development of a Framework for Transit-Oriented Development (TOD); No. SP209B4N; Maryland State Highway Administration: Baltimore, MD, USA, 2013. [Google Scholar]
- Laaly, S. New Definition of Transit Oriented Development (TOD) Based on Context Sensitive Paradigm. Ph.D. Thesis, Morgan State University, Baltimore, MD, USA, 2014. [Google Scholar]
- Hensher, D.A.; Button, K.J. (Eds.) Handbook of Transport Modelling; Emerald Group Publishing Ltd.: Bingley, UK, 2007. [Google Scholar]
- Bierlaire, M. BIOGEME: A free package for the estimation of discrete choice models. In Proceedings of the 3rd Swiss Transportation Research Conference, Ascona, Switzerland, 19–21 March 2003. [Google Scholar]
- Nasri, A.; Zhang, L. Multi-level urban form and commuting mode share in rail station areas across the United States; a seemingly unrelated regression approach. Transp. Policy 2018. [Google Scholar] [CrossRef]
© 2019 by the authors. Licensee MDPI, Basel, Switzerland. This article is an open access article distributed under the terms and conditions of the Creative Commons Attribution (CC BY) license (http://creativecommons.org/licenses/by/4.0/).