Analysis and Research on the Key Success Factors of Marketing Ugly Fruits and Vegetables


Abstract
:1. Introduction
1.1. Research Background and Motives
1.2. Research Purpose
- Obtain expert opinions from education, industry, and marketing through research, and integrate key success marketing factors.
- Aggregate the factors into perspectives and design a questionnaire for application to key consumer groups, collect consumer preferences and opinions, and obtain the ranking of important evaluation indices through the analytical hierarchical process (AHP) method.
- Use the opinions of the analysis results to plan service design blueprints and provide innovative service modes for enterprise reference.
1.3. Research Scope and Limitations
- Definition of ugly fruits and vegetables: the crops that do not meet purchasing conditions because of poor appearance, defective appearance, or shape, size, and appearance, which are also called off-grade products (products outside specifications), NT (No Good). The purpose of this study is to provide a solution to the topic of the waste of “edible but discarded fruits and vegetables products”. Therefore, only agricultural products that do not meet the purchasing conditions and are not dangerous to eat are the scope of this study.
- The main target group is consumers who regularly buy fruits and vegetables and pay close attention to relevant information in the long-term. As this research is a pilot study, the purpose is to synthesize the opinions of experts and major consumers, which can serve as a service design planning framework. Therefore, surveying the target customers will be beneficial to subsequent related marketing and product development references.
2. Literature Review
2.1. Food Waste
2.2. Service Design
2.3. Key Success Factors
- They vary from industry to industry, and are not fixed. They will change with time, product, or market.
- The key success factors may be internal or external factors, as well as both positive and negative factors.
- When considering future development trends, if you do not understand the key success factors and invest hastily, you will threaten the survival of the enterprise.
- The enterprise’s strategy, environment, resources, operation, and other fields can be evaluated.
- Key success factors will change with the industrial life cycle, and there are different key success factors at different stages.
- Managers must conduct in-depth research, evaluation, and analysis, and should not regard everything as equally important. They should concentrate their efforts on specific key tasks, and firstly identify the key success factors of the industry as the strategic basis.
3. Research Method
3.1. Interview
3.2. Procedure and Steps of the Analytic Hierarchy Process
3.3. Evaluation Scale of the Analytic Hierarchy Process
3.4. Questionnaire Survey
4. Research Results and Analysis
4.1. Expert Interview
4.2. Evaluation Indices
4.2.1. Discussion of Evaluation Index Literature
4.2.2. Data Coding
- Adjust the order of the relationships between different perspectives to make it easier for the respondents to enter the situation.
- Add the education perspective to the questionnaire structure.
4.2.3. Pre-test Analysis Result
4.3. Analysis Hierarchy Process Relationship Architecture
Analysis Hierarchy Process Relationship Architecture Establishment
4.4. Weight Ranking of Key Success Factors for Ugly and Vegetables Marketing
4.4.1. Questionnaire Distribution and Recovery
4.4.2. Questionnaire Reliability Analysis
4.5. Analysis Hierarchy Process Analysis Results
4.5.1. Weight Analysis of Strategic Evaluation Indices under Total Target Perspective Factor
4.5.2. Weight Analysis of Each Target Perspective
- (1)
- Analysis of the weights of strategic evaluation indices under the perspective factor of “production and planting”.
- (2)
- Analysis on the weight of strategic evaluation indices under the perspective factor of “policy making”.
- (3)
- Analysis on the weight of strategic evaluation indices under the perspective factor of “brand image”.
- (4)
- Analysis on the weight of strategic evaluation index under the perspective factor of “marketing promotion”.
4.6. Overall Evaluation and Analysis of Key Success Factors of Ugly Fruits and Vegetables Marketing
- A.
- Evaluation index of “using friendly farming methods” for the target perspective of “production and planting”
- B.
- Evaluation index of “government establishing organic standard certification” in the target perspective of “policy making”
- C.
- Evaluation index of “creating a brand story of innovative ugly fruits and vegetables” in the target perspective of “brand image”
- D.
- Evaluation index of “promoting the concept of local production and local consumption” in the target perspective of “marketing promotion”
- E.
- Evaluation index of “advocating the concept of no waste of food” in the target perspective of “education and advocacy”
- Evaluation index of “using friendly farming methods” for the target perspective of “production and planting”
- Evaluation index of “advocating the concept of no waste of food” in the target perspective of “education and advocacy”
- Evaluation index of “advocating importance of environmental protection” in the target perspective of “education and advocacy”
- Evaluation index of “production environment maintenance measures” in the target perspective of “education and advocacy”
- Evaluation index of “regular pesticide residue detection” for the target perspective of “production and planting”
5. Conclusions and Suggestions
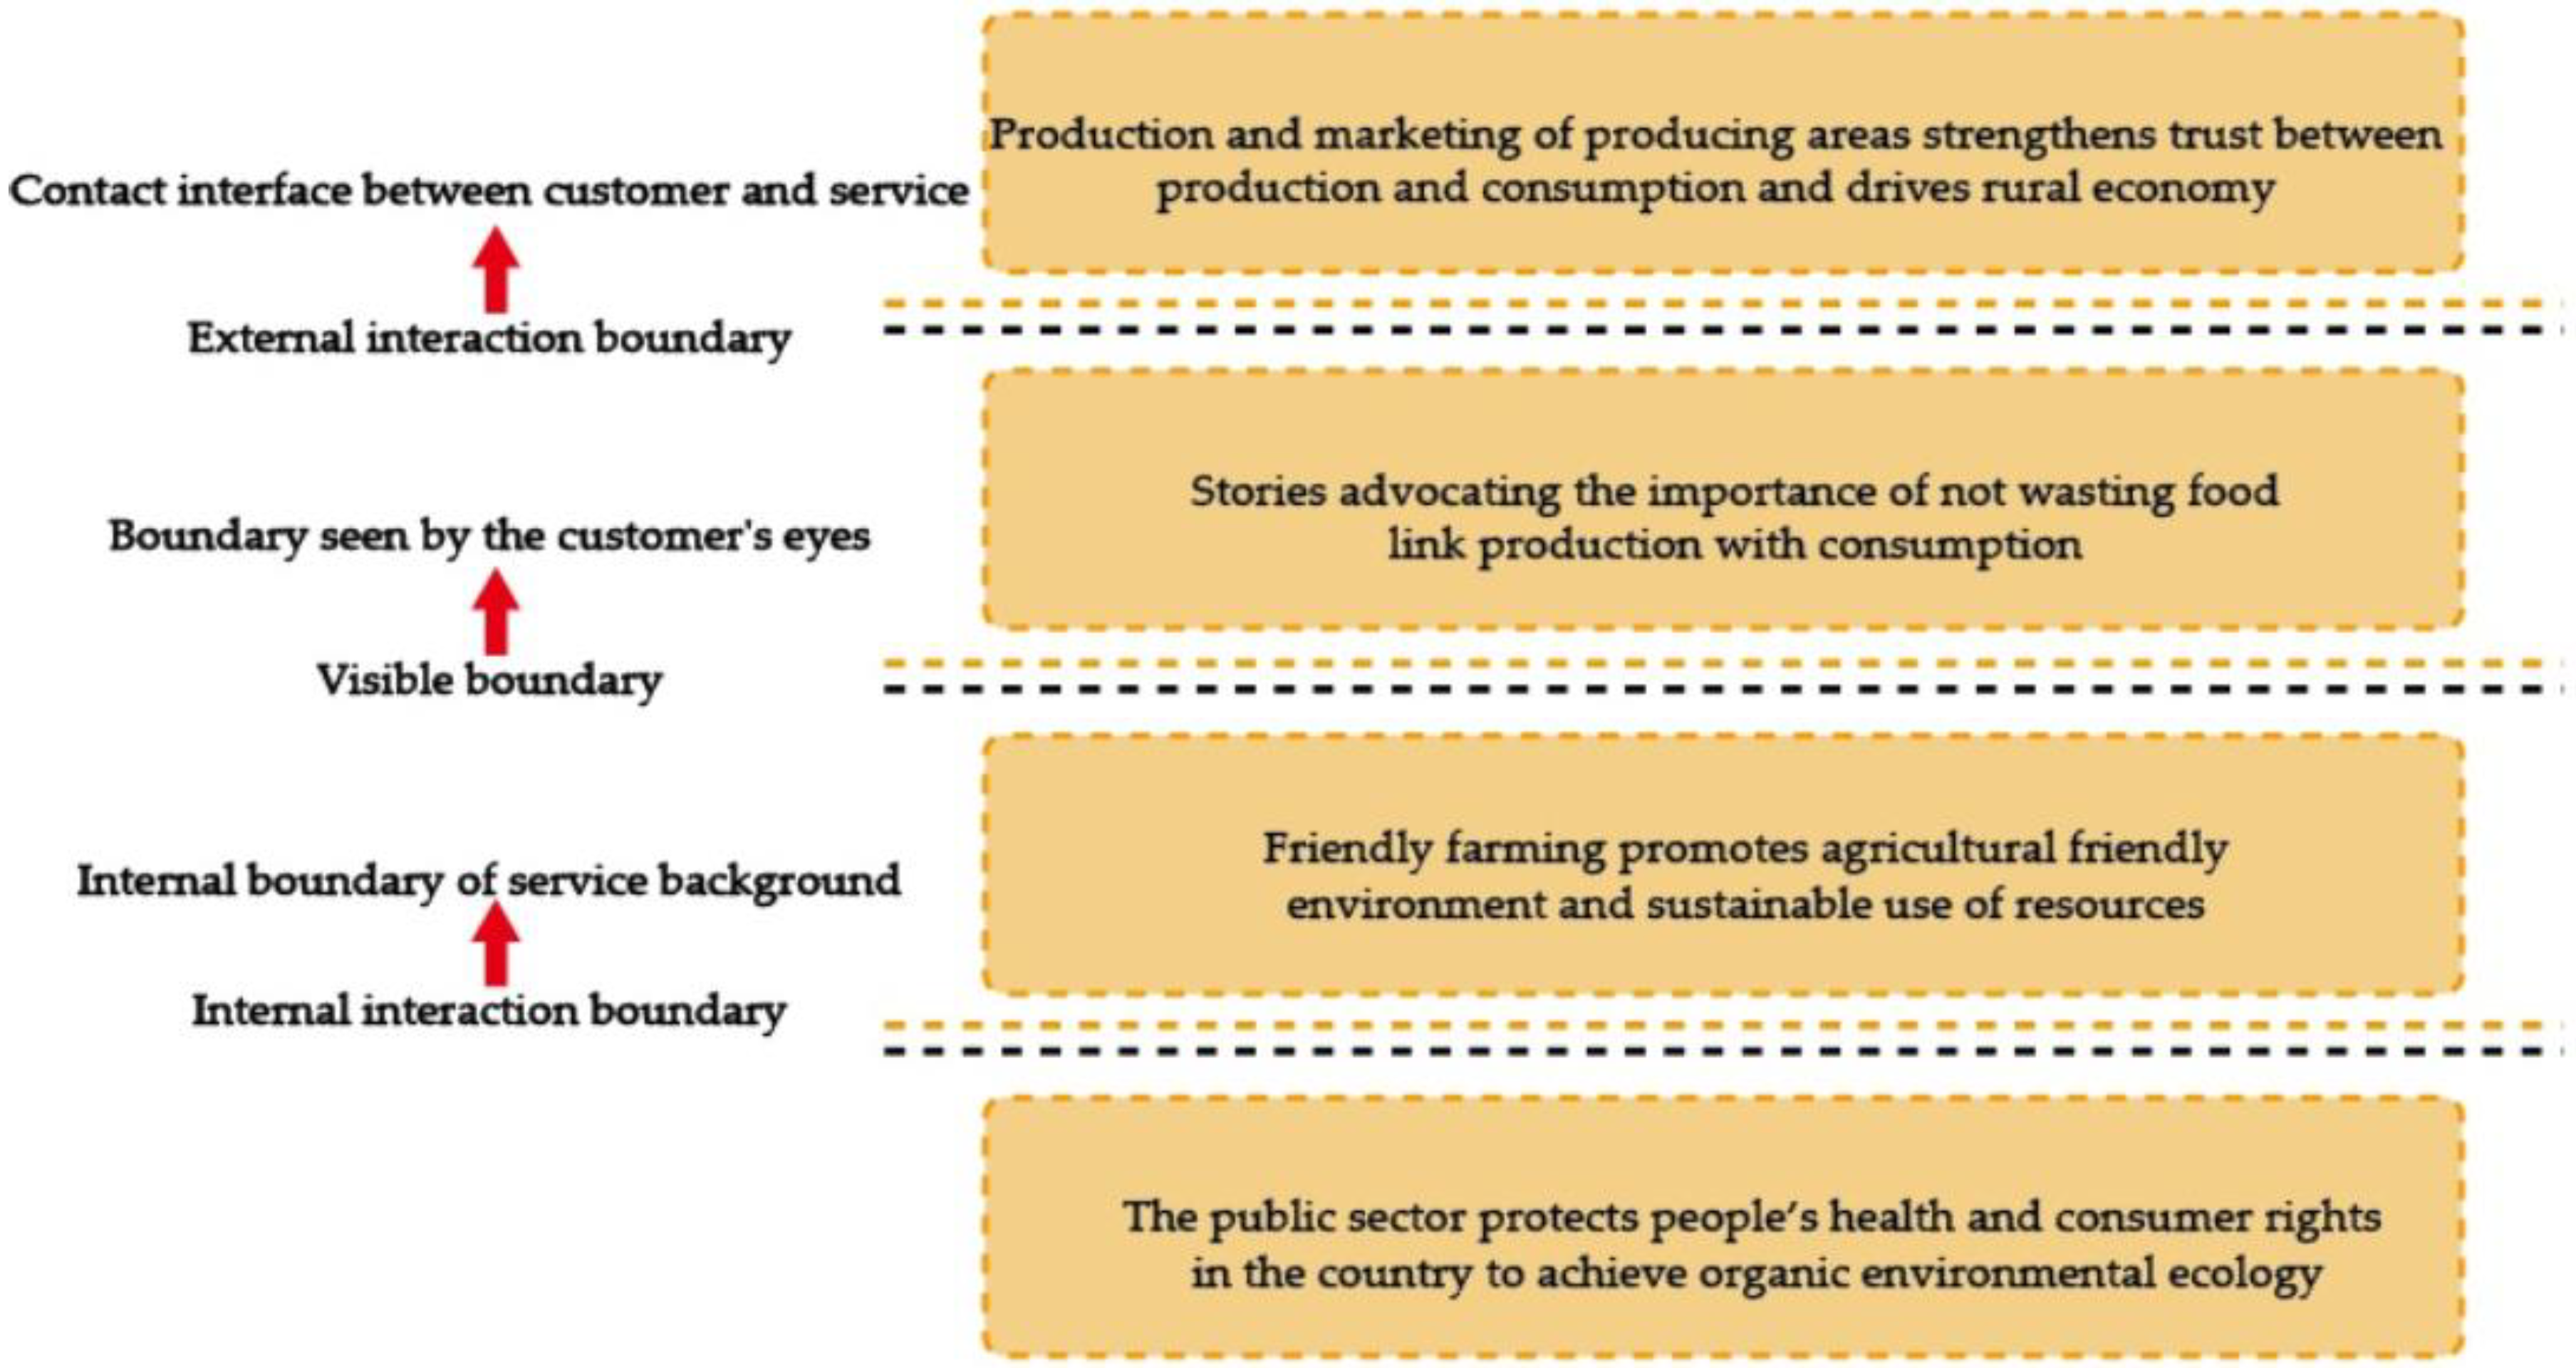
5.1. Preliminary Drafting of Service Design Blueprint Proposal for Ugly Fruits and Vegetables Marketing
5.2. Research Limitations and Suggestions for Future Research
- This research can serve as a pilot study, and follow-up related research can refer to this study and the planned service design blueprint for practical application or improvement of the service model of existing related industries in Taiwan. Moreover, whether the service process is optimized can be verified through actual operation.
- The present marketing of ugly fruits and vegetables in Taiwan is not mature. It is suggested that the opinions of experts and scholars in relevant research fields abroad can be added to follow-up research.
- It is suggested that follow-up in-depth studies can be conducted to investigate the status of production and cultivation of local agriculture or independent farmers in various regions.
- The subject of this research is the analysis of the “ugly vegetables” in the category of out-of-spec products. It is recommended that follow-up researchers can conduct more extensive and further investigations into all types of out-of-spec products.
- The conclusions of this research can also be provided to the education field and be actually taken as a reference for curriculum improvement and related activity planning. In response to the above research purposes, both consumers and producers can begin to pay attention to this topic in order to achieve the goal of environmental sustainability.
Author Contributions
Funding
Conflicts of Interest
References
- Food and Agriculture Organization of the U.N. Available online: http://www.fao.org/docrep/014/mb060e/mb060e00.pdf (accessed on 7 March 2015).
- Environmental Protection Administration Executive Yuan, R.O.C. (Taiwan). Environment Resource Database. Available online: https://erdb.epa.gov.tw/ENG/ (accessed on 14 March 2013).
- Stickdorn, M.; Schneider, J. This Is Service Design Thinking: Basics, Tools, Cases; China Productivity Center: New Taipei City, Taiwan, 2013; (Original work published 2011) (In Chinese, semantic translation). [Google Scholar]
- Lin, T.-W. Analysis of the Evaluation Criteria and Key Success Factors for Green Industries. Master’s Thesis, National Yunlin University of Science and Technology, Douliu, Taiwan, 2015. [Google Scholar]
- Satty, T.L. The Analytic Hierarchy Process; McGraw Hill, Inc.: New York, NY, USA, 1980. [Google Scholar]
- Council of Agriculture, Executive Yuan R.O.C. (Taiwan). Laws and Regulations Retrieving System. Available online: https://law.coa.gov.tw/GLRSnewsout/index.aspx (accessed on 25 March 2013).
- Taiwan Organic Information Portal. Available online: http://www.organic.org.tw (accessed on 8 September 2014).
- Ding, W.-H. Japan Farming Report. From News & Market. 2016. Available online: https://www.newsmarket.com.tw/blog/89589/ (accessed on 20 November 2016).
- Production and Marketing Record of Agricultural Products Verification Management Method. From Laws and Regulations Database of the R.O.C. Council of Agriculture, Executive Yuan, 2007. Available online: https://law.moj.gov.tw/ENG/index.aspx (accessed on 11 October 2015).
- Huang, Y.C. A Study on the Impact of Brand Image Effect on Customer Loyalty from the Viewpoint of Relationship Quality. Master’s Thesis, National Changhua University of Education, Changhua, Taiwan, 2012. Available online: https://hdl.handle.net/11296/gpky7c (accessed on 22 May 2013).
- Yao, B.H. The Ambrosial Palankeen of Taiwan. Master’s Thesis, National Taipei National University of the Arts, Taipei, Taiwan, 2008. [Google Scholar]
- Huang, S.N.; Lin, C.C. The Current Situation and the Future Vision of Organic Agriculture in Taiwan. Food and Agriculture Department, Council of Agriculture, Executive Yuan, 2003. Available online: https://www.ncl.edu.tw/ (accessed on 1 August 2018). (In Chinese, semantic translation).
- Chou, V. A Rising Center of Creativity Hot Taipei. Common Wealth Magazine, 2016. Available online: https://english.cw.com.tw/article/article.action?id=22 (accessed on 15 December 2016).
- Lee (Ed.) Branding and Marketing. Special Issue. Motive Business & Creative. 2014. Available online: http://www.motive.com.tw/?p=2198 (accessed on 15 December 2017).
- Council of Agriculture, Executive Yuan R.O.C. (Taiwan). Laws and Regulations Retrieving System. Available online: https://eng.coa.gov.tw/ws.php?id=2503698 (accessed on 19 May 2013).


| No. | Respondent Unit/Company | Respondents | Job Title |
|---|---|---|---|
| Emb01 | National Chung-Hsing University/Graduate Institute of Bio-Industry Management, Taiwan Agricultural Extension Association | Mr. Tung | Professor Chairman |
| 02 | National Taiwan University/Office of Smart Farming 4.0, Department of Bio-Industry Communication | Miss Ding | Director |
| 03 | National Taiwan University/Ugly Fruits and Vegetables Turnaround Marketing Team | Mr. Lin | Member |
| 04 | Good Will Foods Company | Mr. Yu | CEO |
| Evaluation Scale | Definition | Remarks |
|---|---|---|
| 1 | Equally important | The contribution of the comparison plans of the two parties are of equal importance and equal strength. |
| 3 | Slightly important | Experience and judgment are slightly inclined to prefer a certain plan, which is slightly stronger. |
| 5 | Quite important | Experience and judgment are slightly inclined to prefer a certain plan, which is quite strong. |
| 7 | Extremely important | In fact, it shows a very strong tendency to like a certain plan, which is extremely strong. |
| 9 | Absolutely important | There is enough evidence to be sure of being absolutely fond of a certain plan, which is absolutely strong. |
| 2, 4, 6, 8 | Intermediate value of adjacent scales | When a compromise value is required. |
| Target Perspective | Strategic Evaluation Index | Reference |
|---|---|---|
| Production and planting | Regular pesticide residue detection | [6] |
| Maintenance measures for production environment | ||
| Farming with organic fertilizer | [7] | |
| Using friendly farming methods | ||
| Policy making | Establishing a hierarchical purchasing mechanism | [8] |
| Government establishes organic agriculture law standards | ||
| Regular inspections, and inspection by government agencies | ||
| Meeting the standards of fruits and vegetables and other marks | ||
| Promoting food and education | ||
| Setting up a processing laboratory for renting professional equipment | ||
| Production and marketing record verification checks | [9] | |
| Brand image | Innovative design and logo | [10] |
| Innovative brand story | ||
| Innovative brand mascot | ||
| Humorous packaging design | ||
| Recyclable packaging design | [11] | |
| Marketing promotion | Advocating the importance of environmental protection | [12] |
| Holding trial eating activities | [13] | |
| Humorous advertisement marketing with ugliness as beauty | [14] | |
| Promoting the concept of moral consumption | ||
| Promoting local production and local consumption concept | [15] | |
| Establishing a communication platform for production and consumption | ||
| Perspective | Key Notes on Architecture Proposal |
|---|---|
| Policy perspective | (S1-03) Government’s legislative attention to this issue has the effect of raising public awareness. (S2-39) A credible government or academic institution should be responsible for education and promotion. (S3-18) The added value of agriculture creates a sense of identity, making people willing to return to reviving their local community. (S3-21) Enabling farmers to develop industries will promote the overall economy. (S3-22) To promote industrial circulation, the government should set up open kitchens and learn through them. (S3-24) Learning through an experimental kitchen can be beneficial to future development. (S3-26) Promote local agricultural products in counties through government publicity. (S3-30) Taiwan currently lacks a platform for integrating private and government resources. (S3-31) Lack of key figures to connect the resources of all parties. (S4-44) Public departments need to check overall production and marketing operations. (S4-45) Food waste and environmental problems are very serious due to production and marketing operations. (S4-47) The front-end waste should be handled by the government. The back-end food waste cannot be reused due to the strict control of the shelf life by laws and regulations. (S4-63) Other countries are certified by the public sector, which is not available in Taiwan. |
| Marketing perspective | (S1-08) Some farmers have begun to pay attention to food waste and land-related issues. (S1-10) Willingness to cooperate is the concept. After understanding the concept of promotion, farmers will carry out their duties. (S1-11) Consumers will buy fruits and vegetables because of their ideas, endorsement by farmers, and understanding of the origin of fruits and vegetables. (S2-04) The business opportunity of ugly fruits and vegetables is the promotion of no waste. (S2-06) Regardless of organic planting or not, the focus is still to reduce waste. (S2-07) Ugly fruits and vegetables marketing needs to break through traditional business thinking. (S2-08) The marketing route should have educational purposes so that consumers can understand the story of the place of origin. (S2-09) Farmer’s bazaar allows consumers to talk to production farmers. (S2-10) The consumption and marketing of ugly fruits and vegetables need to trust each other (S2-11) Consumers talk directly with producers, understand each other, and have generate trust, such as direct marketing. (S2-12) Farmer’s bazaar and community-supported agriculture will help to market ugly fruits and vegetables. (S2-14) Endorsement by a third party with good credibility gains consumer trust. (S2-15) It is best for consumers to experience it personally, combine it with their own experience, and improve their purchasing willingness. (S2-30) The importance of ugly fruits and vegetables marketing is to involve consumers and strengthen their willingness to cherish food. (S2-33) Plant biochemical elements are the resistance of plants to the environment, and can be used as health food. This can be considered. (S2-33) The most important thing in marketing is to communicate with consumers and convey correct knowledge. (S2-34) Ugly fruits and vegetables will not affect the nutritional value, and will not make people sick from eating them, which must be made clear in marketing. (S2-36) It is best to sell directly from the market, followed by reprocessing. (S2-42) A credible promotion platform is key. (S2-44) We can start with social enterprises or public welfare organizations taking the lead. (S3-04) Grade B products also have special Grade B product channels to purchase, which is equal to the level of grading in the market. (S3-05) The places that sell agricultural products near national or provincial roads are called direct selling places. (S3-06) Direct selling places pay attention to quality, local characteristics, organic, or friendly production, and the producer is indicated on the packaging. (S3-07) Direct selling place do not deal with agricultural products in an industrial manner. (S3-08) Direct selling places sell and display agricultural products with local characteristics. (S3-11) Selling local agricultural products in regional shops is popular in Japan. (S3-12) Direct selling places win in quality and create characteristic brand images to raise the unit price. (S3-38) The essence of promotion is not regular production, but rather to help solve the problem of the waste of ugly fruits and vegetables. (S4-08) A single farm or cooperative can have the concept of brand management, which can bring together many farmers. (S4-23) Marketing must pay attention to the professional division of labor. (S4-26) The main profit-making model does not come from agricultural products, but rather from the design of surrounding products, which will lead to the marketing of agricultural products after making profits (e.g., mascot). (S4-55) Through leisure agriculture or travel to places of origin, consumers can communicate directly with farmers. |
| Education perspective | (S1-01) Educate students to consider waste issues, learn from other countries’ practices, and let students attach importance to phenomena and raise awareness of environmental protection. (S1-12) There are regular consumers in Taiwan who support fruits and vegetables with known origin. (S1-13) Most of the purchase reasons are trust and support concepts, including trust for teams and farmers. (S1-15) A team specially brings food and farming courses to schools to promote food education, starting from primary school. (S1-21] Promote correct concepts to consumers. For example, ugly fruits and vegetables are not uniform in appearance because they are not applied with pesticide or growth hormone. (S2-17) You can learn more about the process of agricultural cultivation after you experience it yourself. (S2-18) Food and farming education means to plant and eat food in person, in order to know more about food knowledge. (S2-19) Food and farming education in schools allows students to experience planting firsthand and connect with crops. (S2-20) The marketing of ugly fruits and vegetables must include education for food and farming, not only commercial considerations. (S2-22) Enable consumers to change their attitudes and connect with life, thus creating motivation for consumption. (S2-23) Food and farming education can change consumers’ attitudes and behaviors through education. (S2-24) Make consumers understand the meaning of purchase, and arouse their social responsibility of cherishing blessings and not waste food. (S2-25) Emphasize that there are approaches that are helpful to the environment and farmers to inspire consumption motivation. (S2-26) Touch consumers with stories. (S2-27) Allow consumers to make contact with producers and participate personally, in order to have higher willingness to purchase. (S2-28) The core of food and farming education is to give consumers the opportunity to participate in the production process, and thus give people the correct basic concepts of agriculture. (S2-31) Marketing of ugly fruits and vegetables must incorporate agricultural knowledge. (S2-37) Educate consumers to have confidence in producers, and then experience the planting process. (S2-40) Marketing of ugly fruits and vegetables emphasizes education to change consumers’ behavior and move consumers’ thoughts. (S3-33) To promote ugly fruits and vegetables, it is very important to raise the correct awareness, which is the most fundamental method. (S3-39) Japan has established a food education law. (S3-40) It is most effective to begin from education, in order that one begins to experience activities, design courses, and learn agricultural common sense from an early age. (S4-18) Environmental and food and farming education can be promoted in schools. (S4-39) Change consumers’ cognition so that consumers can accept off-grade goods. (S4-54) Education for food and farming is very important, and when combined with agriculture, it can make consumers closer to the place of production. |
| Final Purpose | Definition Target Perspective | Strategic Evaluation Index |
|---|---|---|
| Key success factors of innovative marking of ugly fruits and vegetables | A: Production and planting | A1: Regular pesticide residue detection |
| A2: Maintenance measures for production environment | ||
| A3: Farming with organic fertilizer | ||
| A4: Using affordable farming | ||
| B: Policy making | B1: Establishing a hierarchical purchasing mechanism | |
| B2: Government establishing organic agriculture law standards | ||
| B3: Regular inspection and inspection by government agencies | ||
| B4: Meeting the standards of fruits and vegetables and other marks | ||
| B5: Production and sales record verification checks | ||
| B6: Promoting food education | ||
| B7: Setting up processing laboratory for renting professional equipment | ||
| C: Brand image | C1: Innovative design and logo | |
| C2: Innovative brand story | ||
| C3: Innovative brand mascot | ||
| C4: Humorous packaging design | ||
| C5: Recyclable packaging design | ||
| D: Marketing promotion | D1: Advocating the importance of environmental protection | |
| D2: Holding trial eating activities | ||
| D3: Humorous advertisement marketing with ugliness as beauty | ||
| D4: Promoting the concept of moral consumption | ||
| D5: Promoting the concept of local production and local consumption | ||
| D6: Establishing communication platform between production and consumption | ||
| E: Education and advocacy | E1: Experiential education | |
| E2: Food and farming education course | ||
| E3: Promoting the concept of no waste of food |
| Code Under Test | Target Perspective | Consistency Index (C.I.) ≤ 0.1 Means Meeting the Standard | ||||
|---|---|---|---|---|---|---|
| Production and Planting | Policy Making | Brand Image | Marketing Promotion | Education and Advocacy | ||
| A-1 | 0.13 | 0.86 | 0.40 | 0.25 | 0.00 | Not conforming |
| A-2 | 0.10 | 0.20 | 0.21 | 0.31 | 0.00 | Not conforming |
| A-3 | 0.24 | 0.24 | 0.27 | 0.23 | 0.00 | Not conforming |
| A-4 | 0.12 | 0.41 | 0.45 | 0.20 | 0.00 | Not conforming |
| A-5 | 0.09 | 0.20 | 0.22 | 0.22 | 0.00 | Not conforming |
| A-6 | 0.29 | 0.18 | 0.16 | 0.65 | 0.00 | Not conforming |
| A-7 | 0.29 | 0.39 | 1.44 | 0.86 | 0.00 | Not conforming |
| A-8 | 0.01 | 0.40 | 0.20 | 0.57 | 0.00 | Not conforming |
| A-9 | 0.07 | 0.27 | 0.17 | 0.22 | 0.00 | Not conforming |
| A-10 | 0.00 | 0.17 | 0.17 | 0.06 | 0.00 | Not conforming |
| A-11 | 0.20 | 0.64 | 0.24 | 0.24 | 0.00 | Not conforming |
| A-12 | 0.24 | 0.26 | 1.31 | 0.33 | 0.00 | Not conforming |
| A-13 | 0.24 | 0.39 | 0.09 | 0.25 | 0.00 | Not conforming |
| A-14 | 0.44 | 0.27 | 0.06 | 0.06 | 0.00 | Not conforming |
| A-15 | 0.03 | 0.16 | 0.11 | 0.15 | 0.00 | Not conforming |
| A-16 | 0.29 | 0.72 | 0.49 | 0.32 | 0.00 | Not conforming |
| A-17 | 0.09 | 0.30 | 0.17 | 0.09 | 0.00 | Not conforming |
| A-18 | 1.26 | 0.29 | 0.05 | 0.04 | 0.00 | Not conforming |
| A-19 | 0.06 | 0.20 | 0.08 | 0.08 | 0.00 | Not conforming |
| A-20 | 0.19 | 0.94 | 0.09 | 0.34 | 0.00 | Not conforming |
| Final Purpose | Target Perspective | Strategic Evaluation Index | Hierarchy Weight |
|---|---|---|---|
| Key success factors of innovative marking of ugly fruits and vegetables | A: Production and planting | A1: Regular pesticide residue detection | 0.351 |
| A2: Maintenance measures for production environment | 0.195 | ||
| A3: Farming with organic fertilizer | 0.250 | ||
| A4: Using affordable farming | 0.253 | ||
| B: Policy making | B1: Establishing a hierarchical purchasing mechanism | 0.057 | |
| B2: Government establishing organic agriculture law standards | 0.104 | ||
| B3: Regular inspection and inspection by government agencies | 0.167 | ||
| B4: Meeting the standards of fruits and vegetables and other marks | 0.105 | ||
| B5: Production and sales record verification checks | 0.212 | ||
| B6: Promoting food education | 0.128 | ||
| B7: Setting up processing laboratory for renting professional equipment | 0.068 | ||
| C: Brand image | C1: Innovative design and logo | 0.136 | |
| C2: Innovative brand story | 0.247 | ||
| C3: Innovative brand mascot | 0.076 | ||
| C4: Humorous packaging design | 0.186 | ||
| C5: Recyclable packaging design | 0.356 | ||
| D: Marketing promotion | D1: Advocating the importance of environmental protection | 0.174 | |
| D2: Holding trial eating activities | 0.081 | ||
| D3: Humorous advertisement marketing with ugliness as beauty | 0.095 | ||
| D4: Promoting the concept of moral consumption | 0.184 | ||
| D5: Promoting the concept of local production and local consumption | 0.266 | ||
| D6: Establishing communication platform between production and consumption | 0.200 | ||
| E: Education and advocacy | E1: Experiential education | 0.233 | |
| E2: Food and farming education course | 0.445 | ||
| E3: Promoting the concept of no waste of food | 0.322 |
| Object under Test | Number of Questionnaires Distributed | Number of Questionnaires Recovered | Recovery Rate | Valid Questionnaires | Invalid Questionnaires | Valid Recovery Rate |
|---|---|---|---|---|---|---|
| Consumers who have buying habits and pay attention to vegetable and fruit information | 32 | 27 | 84% | 25 | 2 | 78% |
| Classification | Number of Samples | |
|---|---|---|
| Gender | Male | 4 |
| Female | 23 | |
| Educational background | Junior high school (inclusive) or lower | 3 |
| Senior high school/vocational school | 6 | |
| University/junior college | 3 | |
| Master’s degree | 8 | |
| Doctor’s degree | 7 | |
| Frequency of monthly purchases of fruits and vegetables | 3–5 times | 10 |
| 5–10 times | 9 | |
| More than 10 times | 8 | |
| Age | 20–30 years old | 9 |
| 31–40 years old | 1 | |
| 41–50 years old | 7 | |
| 51–60 years old | 10 | |
| Subject No. | Target Perspective | Consistency Index (C.I.) ≤ 0.1 Means Meeting the Standard | ||||
|---|---|---|---|---|---|---|
| Production and Planting | Policy Making | Brand Image | Marketing Promotion | Education and Advocacy | ||
| C-1 | 0.03 | 0.09 | 0.09 | 0.07 | 0.08 | Conforming |
| C-2 | 0.03 | 0.03 | 0.03 | 0.06 | 0.09 | Conforming |
| C-3 | 0.03 | 0.06 | 0.10 | 0.08 | 0.08 | Conforming |
| C-4 | 0.03 | 0.07 | 0.09 | 0.07 | 0.06 | Conforming |
| C-5 | 0.03 | 0.10 | 0.09 | 0.08 | 0.09 | Conforming |
| C-6 | 0.01 | 0.09 | 0.06 | 0.08 | 0.09 | Conforming |
| C-7 | 0.03 | 0.06 | 0.06 | 0.08 | 0.06 | Conforming |
| C-8 | 0.01 | 0.06 | 0.04 | 0.04 | 0.03 | Conforming |
| C-9 | 0.03 | 0.08 | 0.07 | 0.06 | 0.05 | Conforming |
| C-10 | 0.04 | 0.07 | 0.07 | 0.10 | 0.07 | Conforming |
| C-11 | 0.03 | 0.06 | 0.07 | 0.09 | 0.06 | Conforming |
| C-12 | 0.01 | 0.10 | 0.09 | 0.10 | 0.10 | Conforming |
| C-13 | 0.08 | 0.10 | 0.07 | 0.04 | 0.04 | Conforming |
| C-14 | 0.04 | 0.04 | 0.01 | 0.04 | 0.04 | Conforming |
| C-15 | 0.03 | 0.03 | 0.08 | 0.09 | 0.07 | Conforming |
| C-16 | 0.01 | 0.07 | 0.07 | 0.09 | 0.07 | Conforming |
| C-17 | 0.03 | 0.08 | 0.09 | 0.07 | 0.06 | Conforming |
| C-18 | 0.03 | 0.07 | 0.09 | 0.08 | 0.06 | Conforming |
| C-19 | 0.03 | 0.09 | 0.10 | 0.08 | 0.02 | Conforming |
| C-20 | 0.03 | 0.10 | 0.10 | 0.06 | 0.10 | Conforming |
| C-21 | 0.01 | 0.05 | 0.03 | 0.04 | 0.03 | Conforming |
| C-22 | 0.04 | 0.05 | 0.03 | 0.04 | 0.04 | Conforming |
| C-23 | 0.03 | 0.07 | 0.03 | 0.09 | 0.03 | Conforming |
| C-24 | 0.03 | 0.04 | 0.06 | 0.04 | 0.02 | Conforming |
| C-25 | 0.03 | 0.08 | 0.09 | 0.05 | 0.06 | Conforming |
| C-26 | 0.26 | 0.09 | 0.15 | 0.03 | 0.05 | Not conforming |
| C-27 | 0.03 | 0.02 | 0.07 | 0.09 | 0.10 | Conforming |
| Subject No. | Target Perspective | Consistency Index (C.I.) ≤0.1 Means Meeting the Standard | ||||
|---|---|---|---|---|---|---|
| Production and Planting | Policy Making | Brand Image | Marketing Promotion | Education and Advocacy | ||
| C-1 | 0.0517 | 0.0725 | 0.0725 | 0.0564 | 0.0645 | Conforming |
| C-2 | 0.0517 | 0.0241 | 0.0241 | 0.0483 | 0.0725 | Conforming |
| C-3 | 0.0517 | 0.0483 | 0.0806 | 0.0645 | 0.0645 | Conforming |
| C-4 | 0.0517 | 0.0564 | 0.0725 | 0.0564 | 0.0483 | Conforming |
| C-5 | 0.0517 | 0.0806 | 0.0725 | 0.0645 | 0.0725 | Conforming |
| C-6 | 0.0172 | 0.0725 | 0.0483 | 0.0645 | 0.0725 | Conforming |
| C-7 | 0.0517 | 0.0483 | 0.0483 | 0.0645 | 0.0483 | Conforming |
| C-8 | 0.0172 | 0.0483 | 0.0322 | 0.0322 | 0.0241 | Conforming |
| C-9 | 0.0517 | 0.0645 | 0.0564 | 0.0483 | 0.0403 | Conforming |
| C-10 | 0.0689 | 0.0564 | 0.0564 | 0.0806 | 0.0564 | Conforming |
| C-11 | 0.0517 | 0.0483 | 0.0564 | 0.0725 | 0.0483 | Conforming |
| C-12 | 0.0172 | 0.0806 | 0.0725 | 0.0806 | 0.0806 | Conforming |
| C-13 | 0.1379 | 0.0806 | 0.0564 | 0.0322 | 0.0322 | Not conforming |
| C-14 | 0.0689 | 0.0322 | 0.0806 | 0.0322 | 0.0322 | Conforming |
| C-15 | 0.0517 | 0.0241 | 0.0645 | 0.0725 | 0.0564 | Conforming |
| C-16 | 0.0172 | 0.0564 | 0.0564 | 0.0725 | 0.0564 | Conforming |
| C-17 | 0.0517 | 0.0645 | 0.0725 | 0.0564 | 0.0483 | Conforming |
| C-18 | 0.0517 | 0.0564 | 0.0725 | 0.0645 | 0.0483 | Conforming |
| C-19 | 0.0517 | 0.0725 | 0.0806 | 0.0645 | 0.0161 | Conforming |
| C-20 | 0.0517 | 0.0806 | 0.0806 | 0.0483 | 0.0806 | Conforming |
| C-21 | 0.0172 | 0.0862 | 0.0241 | 0.0322 | 0.0241 | Conforming |
| C-22 | 0.0689 | 0.0403 | 0.0241 | 0.0322 | 0.0322 | Conforming |
| C-23 | 0.0517 | 0.0564 | 0.0241 | 0.0725 | 0.0241 | Conforming |
| C-24 | 0.0517 | 0.0322 | 0.0483 | 0.0322 | 0.0161 | Conforming |
| C-25 | 0.0517 | 0.0645 | 0.0725 | 0.0403 | 0.0483 | Conforming |
| C-26 | 0.4482 | 0.0725 | 0.1209 | 0.0241 | 0.0403 | Not conforming |
| C-27 | 0.0517 | 0.0161 | 0.0564 | 0.0725 | 0.0806 | Conforming |
| Perspective Factor | Production and Planting | Policy Making | Brand Image | Marketing Promotion | Education and Advocacy | Wi | Ranking |
|---|---|---|---|---|---|---|---|
| Production and planting | 1.9021 | 2.72189 | 1.92258 | 1.11441 | 0.297 | 1 | |
| Policy making | 1.62209 | 1.11441 | 2.04178 | 0.158 | 3 | ||
| Brand image | 1.67883 | 2.78847 | 0.100 | 5 | |||
| Marketing promotion | 2.02825 | 0.152 | 4 | ||||
| Education and advocacy | 0.293 | 2 |
| Production Planting Perspective Factor | Regular Pesticide Residue Detection | Maintenance Measures for Production Environment | Using Friendly Farming Methods | Wi | Ranking |
|---|---|---|---|---|---|
| Regular pesticide residue detection | 1.13741 | 1.87514 | 0.246 | 3 | |
| Maintenance measures for production environment | 2.0365 | 0.260 | 2 | ||
| Using friendly farming methods | 0.494 | 1 |
| Policy Making Perspective Factor | Establish a Hierarchical Purchasing Mechanism | Government Establishes Organic Standard Verification | Production and Marketing History Verification | Set Up Processing Laboratory for Renting Professional Equipment | Wi | Ranking |
|---|---|---|---|---|---|---|
| Establish a hierarchical purchasing mechanism | 1.78959 | 1.51212 | 1.96066 | 0.210 | 3 | |
| Government establishes organic standard verification | 1.0004 | 3.34651 | 0.351 | 1 | ||
| Production and marketing history verification | 2.60316 | 0.327 | 2 | |||
| Set up processing laboratory for renting professional equipment | 0.112 | 4 |
| Brand Image Perspective Factor | Establishing Innovative Ugly Vegetable and Fruit Brand CIS | Creating a Brand Story of Ugly Fruits and Vegetables | Humorous Packaging Design | Recyclable Packaging Design | Wi | Ranking |
|---|---|---|---|---|---|---|
| Establishing innovative ugly vegetable and fruit brand CIS | 1.31016 | 1.57824 | 1.19256 | 0.239 | 2 | |
| Creating a brand story of ugly fruits and vegetables | 2.63119 | 1.50062 | 0.359 | 1 | ||
| Humorous packaging design | 1.71209 | 0.145 | 4 | |||
| Recyclable packaging design | 0.257 | 3 |
| Marketing Promotion Perspective Factor | Humorous Advertisement Marketing with Ugliness as Beauty | Promoting the Concept of Moral Consumption | Promoting the Concept of Local Production and Local Consumption | Establishing a Communication Platform for Production and Consumption | Wi | Ranking |
|---|---|---|---|---|---|---|
| Humorous advertisement marketing with ugliness as beauty | 1.61579 | 2.39384 | 2.52012 | 0.132 | 4 | |
| The concept of moral consumption | 1.68975 | 1.63982 | 0.204 | 3 | ||
| Promoting the concept of local production and local consumption | 1.16485 | 0.344 | 1 | |||
| Establishing a communication platform for production and consumption | 0.320 | 2 |
| Education and Advocacy Perspective Factor | Experiential Education Activities | Food and Farming Education Course | Advocating the Idea of Not Wasting Food | Advocating Importance of Environmental Protection | Wi | Ranking |
|---|---|---|---|---|---|---|
| Experiential education activities | 1.13704 | 1.28867 | 1.19256 | 0.229 | 3 | |
| Food and farming education course | 1.56373 | 1.44054 | 0.195 | 4 | ||
| Advocating the idea of not wasting food | 1.17262 | 0.306 | 1 | |||
| Advocating importance of environmental protection | 0.271 | 2 |
| Final Purpose | Target Perspective (First Layer) | Hierarchy Weight | Ranking | Strategy Evaluation Index (2nd Layer) | Ranking | Overall Weight | Ranking | |
|---|---|---|---|---|---|---|---|---|
| Key success factors of ugly fruits and vegetables marketing | Production and planting | 0.297 | 1 | A1: Regular pesticide residue detection | 0.246 | 3 | 0.0730 | 5 |
| A2: Maintenance measures for production environment | 0.260 | 2 | 0.0772 | 4 | ||||
| A3: Using friendly farming methods | 0.494 | 1 | 0.1467 | 1 | ||||
| Policy making | 0.158 | 3 | B1: Establishing a hierarchical purchasing mechanism | 0.210 | 3 | 0.0331 | 13 | |
| B2: Government establishing organic standard certification | 0.351 | 1 | 0.0554 | 8 | ||||
| B3: Production and marketing history verification | 0.327 | 2 | 0.0516 | 10 | ||||
| B4: Setting up processing laboratory for renting professional equipment | 0.112 | 4 | 0.0176 | 18 | ||||
| Brand image | 0.100 | 5 | C1: Establishing innovative ugly fruits and vegetables brand CIS | 0.239 | 2 | 0.0239 | 16 | |
| C2: Creating a brand story of ugly fruits and vegetables | 0.359 | 1 | 0.0359 | 12 | ||||
| C3: Humorous packaging design | 0.145 | 4 | 0.0145 | 19 | ||||
| C4: Recyclable packaging design | 0.257 | 3 | 0.0257 | 15 | ||||
| Marketing promotion | 0.152 | 4 | D1: Humorous advertisement marketing with ugliness as beauty | 0.132 | 4 | 0.0200 | 17 | |
| D2: Promoting the concept of moral consumption | 0.204 | 3 | 0.0310 | 14 | ||||
| D3: Promoting the concept of local production and local consumption | 0.344 | 1 | 0.0522 | 9 | ||||
| D4: Establishing a communication platform between production and consumption | 0.320 | 2 | 0.0486 | 11 | ||||
| Education and advocacy | 0.293 | 2 | E1: Experiential education activities | 0.229 | 3 | 0.0670 | 6 | |
| E2: Food and farming education course | 0.195 | 4 | 0.0571 | 7 | ||||
| E3: Advocating the idea of not wasting food | 0.306 | 1 | 0.0896 | 2 | ||||
| E4: Advocating importance of environmental protection | 0.271 | 2 | 0.0794 | 3 |
© 2018 by the authors. Licensee MDPI, Basel, Switzerland. This article is an open access article distributed under the terms and conditions of the Creative Commons Attribution (CC BY) license (http://creativecommons.org/licenses/by/4.0/).
Share and Cite
Tu, J.-C.; Lee, Y.-L.; Wei, M.-Y. Analysis and Research on the Key Success Factors of Marketing Ugly Fruits and Vegetables. Sustainability 2018, 10, 2783. https://doi.org/10.3390/su10082783
Tu J-C, Lee Y-L, Wei M-Y. Analysis and Research on the Key Success Factors of Marketing Ugly Fruits and Vegetables. Sustainability. 2018; 10(8):2783. https://doi.org/10.3390/su10082783
Chicago/Turabian StyleTu, Jui-Che, Yi-Lin Lee, and Miao-Yu Wei. 2018. "Analysis and Research on the Key Success Factors of Marketing Ugly Fruits and Vegetables" Sustainability 10, no. 8: 2783. https://doi.org/10.3390/su10082783
APA StyleTu, J.-C., Lee, Y.-L., & Wei, M.-Y. (2018). Analysis and Research on the Key Success Factors of Marketing Ugly Fruits and Vegetables. Sustainability, 10(8), 2783. https://doi.org/10.3390/su10082783