Review

Opportunities and Challenges of Solar and Wind Energy in South Korea: A Review

Department of Electrical Engineering, College of Electronics and Information Engineering, Sejong University, 209 Neungdong-ro, Gwangjin-gu, Seoul 05006, Korea
*
Author to whom correspondence should be addressed.
Sustainability 2018, 10(6), 1822; https://doi.org/10.3390/su10061822
Submission received: 1 May 2018 / Revised: 25 May 2018 / Accepted: 30 May 2018 / Published: 1 June 2018

Abstract

:
South Korea is the ninth biggest energy consumer and the seventh biggest carbon dioxide emitter in global energy consumption since 2016. Accordingly, the Korean government currently faces a two-fold significant challenge to improve energy security and reduce greenhouse gas emissions. One of the most promising solutions to achieve the goals of sustainable development, energy security, and environmental protection is intensifying the role of renewable energy in electricity production. To this end, the Korean government plans to increase investments in the green energy field, where solar and wind energy will soon play a decisive role toward meeting energy demands and achieving a climate-friendly environment. In this context, this study discusses the future of solar and wind energy in South Korea in four key aspects: (i) opportunities and potential achievement of the vision of government; (ii) potential daily energy output across different geographical areas; (iii) current status and prospects; and (iv) challenges and potential solutions.

1. Introduction

Energy security is one of the key issues in industrial countries, such as South Korea, which has been ranked as the ninth biggest energy consumer worldwide since 2016 [1]. In December 2017, the total energy production of the country was 441.2 TWh (Figure 1). Energy security is defined as the uninterrupted availability of energy sources at an affordable price in the long term, that is, involving timely investments to supply energy in line with economic developments and environmental needs and in the short term by focusing on the ability of the energy system to react promptly to sudden changes in supply and demand. Several factors should be considered to guarantee energy security, such as energy sources, energy production and demand, operational expenditure (OPEX), and environmental issues [2]. Unfortunately, 84% of South Korea’s energy supply relies on non-renewable sources (coal, oil, and gas) [1,3], which represent the bulk of the country’s total imports because South Korea lacks these resources [4]. Figure 1 presents a comprehensive vision of the energy sources, strategies, and policies of South Korea in 2017. However, the use of non-renewable sources is a growing concern for the government as it aims not only to reduce OPEX but also to decrease the overall environmental effects [5] because South Korea is, globally, the seventh biggest carbon dioxide (CO2) emitter [3]. One of the most promising solutions to achieve the goals of sustainable development, energy security, and environmental protection is intensifying the role of renewable energy for electricity production, especially because South Korea has renewable natural resources that enable it to pursue a sustainable energy strategy that combines energy, environment, economy, and society [5]. Moreover, the country’s rapid deployment of renewable energy and energy efficiency and its technological diversification of energy sources has resulted in significant energy security and economic benefits. Hitherto, the Korean government has been seeking to increase the percentage contribution of renewable energy from 6.5% in 2017 (Figure 1) to 11% by 2030 according to the “Fourth Basic Plan for New and Renewable Energy” [6,7]. Such an increase is sought to achieve efficient development and to ensure the sustainability of clean energy provision with improved planning [8,9].
The government will devote increased attention to solar and wind energy, which will play significant roles in meeting energy demands and in achieving a climate-friendly environment in the long-term plan of the government. The vision of the government is to increase the energy contribution of solar stations and wind farms to 14.1% and 18.2%, respectively, of the total renewable energy production by 2035 (Figure 2) [5,11]. Accordingly, solar and wind energy research will continue to dominate South Korea in the coming decades [12].
South Korea lies between 35.9° N latitude and 127.7° E longitude and has a temperate climate with four distinct seasons and significantly abundant sunlight and wind across different geographical areas [13]. The average daily solar radiation in South Korea is estimated to be 4.01 kWh/m2, varying between 2.56 kWh/m2 in December and 5.48 kWh/m2 in May, which is considered relatively high compared with other countries located at similar latitudes [14,15,16]. The average wind speed is estimated at 4.0 m/s, varying between 3.5 m/s in September and 4.6 m/s in March. Although the average wind speed may be low, the wind can generate a high amount of energy in winter, especially on the east and southeastern coasts, during strong surges of cold air, in which the wind speed reaches up to 8.5 m/s [17]. Accordingly, South Korea has an abundant potential for using these two renewable resources to generate energy, and endeavors for research and development in this area continue. As a major contribution, this study discusses these two main renewable resources in terms of opportunities and potential for achieving the government’s vision, potential daily energy output across different geographical areas, current status and prospects, and challenges and potential solutions.
The rest of this study is organized as follows. Section 2 highlights the data sources for this study and collection methods. The opportunities, potential energy output across different geographical areas, current status, and the Korean government’s long-term plan and prospects, as well as the challenges and limitations of solar and wind energy are discussed in Section 3 and Section 4, respectively. A summary of the key recommendations to ensure energy sustainability and improved planning in the future concludes the study in Section 5.

2. Data Sources and Collection Methods

For the assessment of the solar and wind energy sectors and the exploration of the aspects of their development and the possibility of increasing their contribution in the future, knowing the current contribution of both forms of energy to total energy production is important. For the same reason, knowing the long-term plans of the future government about increasing the percentage of contribution of solar and wind energy to the total energy production and how comprehensively a government can advance these plans is also important. The sources of information in this field are numerous and diverse. In this study, several data factors were considered: the accuracy, suitability, adequacy, and timeliness of data. Therefore, we collected data from original and reliable sources, especially government agencies that are considered a good source of information in this field. Accordingly, the latest updated annual reports and periodic publications from the Korea Meteorological Administration (KMA) [14], National Institute of Meteorological Sciences (NIMS) [16], Korean Statistical Information Service (KOSIS) [18], Korean Ministry of Trade, Industry and Energy (MOTIE) [19], Korea Energy Economics Institute (KEEI) [20], and the Korean Energy Agency (KEA) [11] were comprehensively reviewed and analyzed. Moreover, the “Seventh Basic Plan for Long-Term Electricity Supply and Demand” [21] and the “Second South Korea Energy Master Plan” [22] that were developed by the Ministry of Trade, Industry, and Energy were reviewed. These national plans provide detailed information about the increase of installed capacity and a prediction of yearly electricity consumption until 2035. We also obtained data from studies that were published by reputable journals in this field.
In this study, a combination of quantitative and qualitative approaches is adopted to maintain a balanced discussion in the main sections and ensure readability through a smooth flow of ideas. Each section presents a comprehensive discussion of the following areas: (i) opportunities and potential of using energy; (ii) comparison and analysis of the energy output across different geographical areas; (iii) current status and prospects; and (iv) challenges and potential solutions. The latest updated annual reports and periodic publications are reviewed in the following order:
(a)
publications of central, state, and local governments;
(b)
technical reports and publications of the industry; and
(c)
articles by research scholars, universities, and economists.

3. Solar Energy

This section presents a comprehensive vision about the opportunities, comparison and analysis of solar energy output across different geographical areas, current status, and prospects. Furthermore, this section highlights the challenges and limitations of a solar energy system.

3.1. Opportunities and Potential of Solar Energy

South Korea is located between 35.9° N latitude and 127.7° E longitude with excellent potential for using solar energy. The average daily solar radiation in South Korea is estimated to be 4.01 kWh/m2, varying between 2.56 kWh/m2 in December and 5.48 kWh/m2 in May [14,15,16], as shown in Figure 3. The monthly variation of solar radiation is largely attributed to the shift in the elevation angle of the sun. The amount of direct solar radiation in winter in South Korea is 330–590 MJ in December, 390–590 MJ in January, and 370–470 MJ in February [16]. The rainy weather in early summer decreases the global horizontal irradiance in June and July.
However, solar radiation varies from one city to another. The map of average daily solar radiation in Figure 4 reveals the high average daily solar radiation of over 5 kWh/m2 obtained in the southeastern coastal area, including Jeju Island. By contrast, monthly average daily solar radiation is lowered to approximately 4.7 kWh/m2 in the northwestern region around Seoul, whereas Gochang, located at the western coast of South Korea, shows the lowest monthly average daily solar radiation of 4.48 kWh/m2. However, solar radiation in South Korea is considered relatively high compared with other countries located at similar latitudes. For example, the annual average global horizontal irradiation in Jeonju, South Korea (latitude 36° N, longitude 127° E) is 4.01 kWh/m2, compared with the 3.64 kWh/m2 of Tokyo, which is located at a similar latitude, but at a longitude of approximately 139° E [15]. Moreover, South Korea has more than 470 MJ distribution in Gyeongsang and east coast regions in December, and cumulative distribution is over 470 MJ in most parts of the country except Jeolla’s west coast, Ulleungdo, and Dokdo areas in January. Cumulative distribution is more than 450 MJ in most areas of Gyeongsang in February [16]. Accordingly, South Korea’s climatic conditions are desirable for extending the utilization of photovoltaic (PV) systems due to the high amount of solar radiation received throughout the year.

3.2. Statistical Analysis and Comparisons

The daily energy output (E) of a PV system is directly proportional to the total solar panel area or photovoltaic array area (A), efficiency of solar panel (r), daily average solar radiation (H), and performance ratio (PR). The E increases with a large A. Meanwhile, the A of the solar system is limited. Thus, the factor that can increase the E at limited A is solar radiation, where the output energy of the solar system increases with increasing solar radiation at constant A. However, PV panels offer relatively low efficiency at 4–12% for thin film panels and under 22% for crystalline panels [25,26], which affect the production of energy regardless of the availability of solar radiation. In addition, dirt, dust, tree debris, moss, sap, water spots, snow, and mold significantly affect the performance of PV panels, thereby causing further reduction in the overall efficiency. Accordingly, the E of a PV system can be calculated by using the formula [23,27,28]
E = A × r × H × PR
where A is the total solar panel area (m2); r is the solar panel yield or efficiency (%); which is calculated based on the electrical power (kW) of one solar panel divided by the area of one panel (m2); H is the daily average solar radiation (kWh/m2); and PR is the performance ratio, and coefficient for losses range between 0.5 and 0.9 with default value = 0.75.
Equation (1) shows that the energy output of PV depends on manufacturing factors besides solar radiation. To conduct the analysis and comparison, a Sharp ND-250QCs model (polycrystalline) of PV with an area of 10 m2 is considered in this study to examine the possibility of using PVs for residential consumption (private use), representing 38.5% of total consumption (Figure 1). Sharp ND-250QCs has a voltage of 29.80 Vdc, current of 8.40 A, and power of 250 W with an area of 1.6 m2. More details about the electrical and mechanical characteristics of this kind of PV are provided in [29]. Figure 5 presents the average daily energy output for the four cities with the lowest solar radiation in decreasing order—Gangneung, Gochang, Wonju, and Seoul. The results presented in Figure 4 reveal that the daily energy output of PV is estimated to be at least 5 kWh across different cities, which can satisfy primary household energy consumption.
However, increased attention is devoted to Seoul city (capital) because it has the largest energy consumption compared with other cities; this consumption includes roughly half of the population, as well as most industrial and commercial areas [18]. Figure 6 shows the monthly average of solar radiation in Seoul city over 37 years (1 January 1981 to 31 December 2017) according to the hourly solar radiation data obtained from the KMA [30]. Table 1 presents the basic statistics related to the collected data.
Figure 6 indicates that the highest average value of solar radiation was 338.7 W/m2 on May, whereas the lower adjacent was 251.1 W/m2 and the upper adjacent was 377 W/m2. The red cross represents the outliers with almost all outliers being lower adjacent. Thus, the outliers should not be considered to reduce their effect on the collected data, in which the two lower outliers were 209.2 W/m2 and 224.8 W/m2, which occurred on May 1990 and 1981, respectively. The lowest average value of solar radiation was 166.1 W/m2 on December, whereas the lower adjacent was 129 W/m2 in December 1992 and the upper adjacent was 207.7 W/m2 in December 1985. The two lower outliers 98.3 W/m2 and 113.4 W/m2 occurred in December 1990 and 1991, respectively. By contrast, September witnessed the largest variation in solar radiation which may be attributed to seasonal weather fluctuations in this period of the year.
Hence, solar energy is considered the most promising energy source among all renewable energy sources due to its suitability for application in vast areas of South Korea and in remote areas where electrification progress and success rates are remain low due to geographical limitations and challenging terrains, making access to these sites difficult [31]. Moreover, the deployment of solar energy systems includes many benefits for environment, economy, and society. Perhaps the most important benefit is its environment friendliness with its negligible emissions of harmful gases or pollutants; wherein, an emission of approximately 0.7 kg of CO2 is prevented when generating solar power per each kWh [32]. In addition, solar energy systems have low operation and maintenance costs.
The following section highlights in details the current status of installed solar stations in terms of locations and capacity and discusses the cumulative energy production of solar stations over the last decade (2007–2016). In addition, the next section presents the government’s future vision and plans for its solar energy project.

3.3. Current Status and Prospects

Solar energy is considered to be the most important renewable energy in South Korea and the capacity of the PV systems installed in South Korea is rapidly increasing as shown in Figure 7. The cumulative capacity of PV systems in 2016 was 5000 MW which amounted to 32.5% of the total capacity of new and renewable energy in South Korea [33]. The proportion of the PV systems was 26.3% in 2015 and the increase in the relative proportion of the PV systems continued in recent years. The installed PV systems are classified into two types in accordance with those purposes. A solar power plant is for the commercial profits and the others are for the private use. In South Korea, the commercial PV systems are usually installed and the total cumulative capacity of the commercial PV systems was 4450 MW in 2016. On the other hand, the total cumulative capacity of the PV systems for the private use was only 551 MW [34]. In 2017, South Korea has 5.7 GW of generating capacity from solar power and 1.2 GW from wind power [35]. Moreover, the Korean government seeks to increase contribution of the solar power to 37 GW and wind power to 16.5 GW by 2030 [33,36].
The largest solar power plant in South Korea was recently constructed in Haenam, South Jeolla Province. The installed capacity of the system is amounts to 57 MW with which the electricity can be supplied to more than 20,000 families [34]. Moreover, the construction of the biggest floating solar power plant in the world is expected to be finished by 2020. The power plant will be capable of generating 100 MW of electricity that will be sufficient to supply power to approximately 140,000 residents [37].
Furthermore, the Korean government has established basic and detailed action plans for the technical development and supply expansion of the renewable energy, and gradual decrease in use of coal and fossil fuel [19]. In the plans, the renewable energy percentage of the total energy consumption will be expanded up to 11% by 2030 [6]. Also, the solar and wind energy will be promoted as the most important energy sources with cutting down the role of the waste energy. Accordingly, the waste energy proportion of the new and renewable energy will decrease to 29.2% (67.0% in 2014) and the solar energy proportion will increase to 14.1% (4.9% in 2014) by 2035 [11], as shown in Figure 2. To accomplish this goal, the Korean government would switch the new and renewable energy market of South Korea from the government-driven deployment to the market with the public–private partnership.

3.4. Challenges and Potential Solutions

Despite the many benefits offered by solar cells, some challenges should be considered. The following paragraph highlights and discusses the most important challenges.
A. Cost
People strongly want to use solar energy systems, particularly for residential or personal consumption. However, cost is a major limitation for the widespread application of solar energy. According to the International Energy Agency [38], comparing the cost of generating electricity from various technologies relies on the levelized cost of energy (LCOE) method. LCOE represents the per-unit value of the total cost (i.e., capital, operation, and maintenance fuel); it can be calculated using the equation [25,38]
LCOE = O C C F × 8760 × C R F + O M C + F C   w i t h   C R F = r × ( 1 + r ) T ( 1 + r ) T 1
where OC is the overnight construction cost (or investment without accounting for interest payments during construction), OMC is the series of annualized operation and maintenance (O&M) costs, FC is the series of annualized fuel costs, CRF is the capital recovery factor, CF is the capacity factor, r is the discount rate, and T is the economic life of the plant.
Figure 8 summarizes LCOE, O&M, and fuel costs for the baseload technologies of electricity generation at 3% discount rate based on the International Energy Agency (IEA) report [38]. It is clear that the LCOE for various scenarios of solar technologies—namely, residential, commercial, and large ground-mounted—are US$ 155.56/MWh (US$ 0.156/kWh = 170.04 South Korean Won), US$ 122.56/MWh (US$ 0.123 /kWh = 134.07 Won), and US$ 101.86/MWh (US$ 0.102/kWh = 111.18 Won), respectively. By contrast, LCOE for conventional energy technologies coal-pc800 is US$ 77.66/MWh (US$ 0.078/kWh = 85.02 Won), coal-pc1000 is US$ 74.30/MWh (US$ 0.074/kWh = 80.66 Won), and combined cycle gas turbine (CCGT) is US$ 121.82/MWh (US$ 0.122/kWh = 132.98 Won). Despite the sustained decrease in the costs of solar energy over the last few years, LCOE of solar energy technology is still higher compared with conventional technologies for electricity generation [39,40]. The main reason for the significant increase in LCOE of solar energy technology is the large variations in capital costs. Capital cost accounts for over 80% of LCOE for solar energy technology and accounts for under 60% in conventional fossil fuel technologies (e.g., coal, gas combined cycle) [38]. Fuel costs are the major component in the majority of fossil fuel technologies. Moreover, fossil fuels produce negative externalities at the local level (e.g., local air pollution) and global level (e.g., GHG emissions), whereas solar energy technologies do not. Evidently, comparing solar energy technology with fossil fuel technologies without accounting for these externalities would be biased.
To overcome this challenge, the solution has two points that should be achieved with the support and encouragement of the government:
  • In the last decade, solar energy technology has experienced strong support of the government through various policies. After nearly one decade (2002–2011) of experience with feed-in tariffs (FITs), South Korea replaced FITs with the renewable portfolio standards (RPS) scheme in 2012 [41]. The renewable portfolio standards (RPS) subsidies policy led to increase the competitiveness of solar energy and related industries by reducing costs and encouraging new technological developments through competition among both renewable sources and electricity suppliers. RPS refers to regulations that require electric power suppliers to supply a minimum percentage or amount of their loads through eligible renewable energy sources. RPS applies to 13 electricity suppliers. The annual renewable energy quota of individual suppliers, which is fixed until 2022, is calculated by multiplying their total electricity generation (excluding that from renewables) by the annual obligatory RPS percentage. This percentage was initially set at 2% in 2012 and is planned to reach 10% by 2022 [42,43]. However, still need to overcome a few technical, financial, regulatory, and institutional barriers. Accordingly, the complementary policies to alleviate market risks for small suppliers may be required. An optional FIT for small increments in capacity is a probable policy option. Besides, better financing infrastructure needs to be devised by cooperation between NGOs and government organizations to spur the PV industry and boost the consumption of its products. Thus, we can conclude that the continued support for several decades through policies is necessary to maintain and enhance the growth of solar energy.
  • Despite the huge technical potential for large-scale deployment of solar energy technologies with acceptable cost in South Korea, the country needs to increase the independence of manufacturers and reliance on local solar cell manufacturers to greatly reduce costs and enhance the growth of solar energy.
B. Energy Source
Solar energy availability is intermittent and unpredictable and can only be used during the day. Solar energy is also vulnerable to changes in weather conditions such as sudden onsets of cloudy or rainy weather [44]. Fortunately, competent short and long-term forecasting and careful planning and analysis help us to arrive at an optimal solution to these limitations. Moreover, uninterrupted power supply may be ensured through the design of the solar system:
  • Stand-alone solar system (off-grid PV solar power): The territory of South Korea has approximately 3000 islands, of which around 500 are inhabited. Most of these islands are quite far from the mainland, and the supply of electricity from the mainland to such islands is unfeasible. Currently, most of these islands use diesel generators to produce electricity. Thus, stand-alone PV systems are ideal for remote rural areas and applications wherein other power sources are either impractical or unavailable. To ensure an uninterrupted power supply, a solar system should be coupled with storage devices or other energy sources. However, batteries are important elements and the heart of any stand-alone solar power system, whether that is using a large array of panels to power a home or farm. During hours of sunshine, the PV system is directly fed to the load, with excess electrical energy being stored in the batteries for later use. During the night, or during a period of low solar irradiance, such as a cloudy or rainy day, energy is supplied to the load from the battery.
  • Hybrid solar system (on-grid PV solar power): A solar system connected to the power grid is the most commonly used system in major cities and solar power plants. The hybrid solar system saves more money with solar panels through better efficiency rates and net metering, as well as lowering equipment and installation costs. Batteries and other stand-alone equipment required for a fully functional off-grid solar system are unnecessary in the hybrid solar system. Therefore, grid-tied solar systems are generally cheaper and simpler to install. Moreover, home solar panels often generate more electricity than what is typically consumed. With net metering, homeowners can place this excess electricity in the utility grid, and utility companies purchase electricity from homeowners at the same rate they sell it themselves.
C. Technical Hindrances
  • Lightning strikes may damage electronic components. Diodes, which are mounted on the termination box under each panel, may either crack or short circuit under high humidity and heat conditions. Monitoring systems in solar power plants can easily determine the faults, whereas, the government can develop a program to train those who wish to use the home solar system about its basic operation, maintenance, and management.
  • Building capacity is vital to producing a workforce for the successful implementation of PV systems. Training and producing a competent workforce to drive industry growth and PV diffusion is yet another challenge that this industry faces. A focused, collaborative, and goal-oriented workforce is required to achieve technological leadership in PV. To generate a competent workforce, the government can develop a program to train those wishing to use the home solar energy system about its basic operation, maintenance, and management.
  • The increasing distance between solar power plants and homes increases costs and complicates the industry’s risk management of transmission technologies. Establishing a systematic approach to maximize the use of existing network assets is, therefore, important. In locations where solar power plants are small and dispersed over the low voltage grid (e.g., rooftop solar PVs), managing the interface between the high voltage transmission network and low voltage local networks is a priority. Careful planning and analysis also help reach optimal solutions. Moreover, enhancing intra-industry cooperation is needed for expanding the PV supply chain and motivating technical knowledge sharing through conferences and workshops.
D. Ecological and Social Impacts
After the complete life cycle of solar modules (20–30 years), safety, environmental, and health concerns arise because the disposal of the modules is another challenge [45,46]. Most estimates of life cycle emissions for PV systems are between 0.07 and 0.18 pounds of CO2 per kWh [26]. Thus, the disposing of the large quantities of modules in a single landfill can cause potential risks to humans and biota (i.e., animal and plant life of an area during a time period). Harmful chemicals can seep into these landfills and contaminate local ground and surface water. The future solar market is assessed to be fairly large. Thus, now is the perfect time to plan the management of future solar waste, as any delay may result in the tedious task of attending to tons of waste.
Various toxic materials are utilized in the manufacturing process of solar modules, especially in the extraction of solar cells. Cadmium (Cd) is a toxic element that is utilized in the thin film of solar cells as a semiconductor converting solar energy into electrical energy. According to the National Institute of Occupational Safety & Health, Cd dust and vapors can cause severe diseases, such as cancer. Many other harmful chemicals are also used as solvents for cleaning dust and dirt from PV modules. Upon seeing their harmful effects, the European Union prohibited the use of Cd, Pb, Hg, and other harmful compounds as per the regulations of the Restriction of Hazardous Substances Directive [45]. This prohibition emphasizes that research on new materials is crucial for this industry.
Solar power plant projects require relatively large areas for deployment and last 15–20 years or more, thereby preventing land usage for any other purpose. Utility-scale PV systems commonly require approximately 3.5–10 acres per megawatt [26]. This requirement is a serious concern as several current issues relate to this problem, such as the population explosion that has already resulted in the occupation of several useful lands. Moreover, the removal of trees and bushes may be required to produce the optimum solar site if they happen to block sunrays, thereby adversely affecting wildlife. The Korean government has, therefore, resorted to establishing floating solar power plants since 2014. Establishing such power plants also allows the government to avoid social costs, especially on-land requisition problems.
E. Performance Limitations
PV panels offer a rather low efficiency at 4–12% for thin film panels and under 22% for crystalline panels [25,26]. In addition, dirt, dust, tree debris, moss, sap, water spots, snow, and mold significantly affect the performance of PV panels and may, thus, cause further reduction in the overall efficiency. Fortunately, efficiency may be improved through a dual-axis tracking system that allows wind, rain, and gravity to remove most debris and dust. Moreover, the dual-axis tracking system can increase the total amount of energy produced by a PV system by approximately 20–30% [23,47].

4. Wind Energy

South Korea declared its plan to reduce its greenhouse gas emissions by 30% by 2020 to the international community by deploying renewable energy systems, especially wind energy conversion systems [31]. This section investigates the opportunities and feasibility of wind energy, as well as the prospects and challenges. In addition, wind directions in summer and winter seasons are discussed; and a wind energy analysis for different cities of South Korea is provided.

4.1. Opportunities and Potential of Wind Energy

Wind energy is another free available energy source that can be converted to electricity. According to wind speed data obtained from both the KMA [14,30] and National Institute of Meteorological Science (NIMS) [17], the annual average wind speed of South Korea is 4.0 m/s, varying between 3.5 m/s in September and 4.6 m/s in March, as shown in Figure 9. In summer, the wind speed evidently and considerably decreases compared with that in winter. This seasonal variation of wind speed is deeply related with the atmospheric pressure and wind direction in South Korea. Figure 10 depicts the wind monsoon trend that affects South Korea in winter and summer. In summer, the North Pacific atmospheric pressure is directed south of South Korea and affects every region in South Korea. This condition directs the wind in summer considerably southeast or southwest. By contrast, the main wind direction in winter is northwest in most areas, and northeast wind appears in some parts of the southwestern and southern coasts of Gyeongnam. In addition, southwestern winds can be seen in Gangwon Province. The distribution of wind direction reflects the northwestern wind system due to the Siberian high pressure during winter in the northern part of Korea.
The change of wind direction when season changes is one of the weak points of using wind energy in South Korea. However, wind speed varies per province. According to the resource ‘Maps’ in NIMS [17] shown in Figure 11, most of inland areas have low wind speed at less than 5.0 m/s. However, wind speed above 7.5 m/s can be observed in the mountainous regions of the nearby east coast (Mt. Seorak, Mt. Odaesan, Mt. Taebaek, and Mt. Deogyu), the southeastern coast, and Jeju Island located below the peninsula. In case of offshore wind, wind velocity of 6.5–7.0 m/s appears in the east west coasts of Gangwon-do, and strong wind speed of 7.5 m/s or more is observed on the southern coast. Moreover, the average top wind in winter of more than 8.5 m/ s appear in Jeju Island, Gyeongnam’s east coast, and Gangwon Province mountainous areas (Mt. Seorak, Odaesan, and Taebaek) in December. In January, stronger than 8.5 m/s winds appear on the east coast of Pohang and Uljin, along the southwest coast of Jeju Island and Mokpo. Stronger than 8.5 m/s wind in February is observed in Gangwon-do’s mountainous area. In Gangwon-do, the mountainous areas in Gangwon-do have winds of over 8.5 m/s, and strong winds are observed in the east coast of Gyeongnam Province, the southwest coast of South Jeonnam, and Jeju Island.
Figure 12 shows the monthly average of wind speed for Seoul city (capital) over 37 years (1 January 1981 to 31 December 2017), according to an hourly solar radiation data that obtained from the Korea Meteorological Administration (KMA) [30].
Figure 12 reveals that the highest average value of wind speed was 2.85 m/s in March; whereas the lower adjacent was 2.13 m/s and the upper adjacent was 3.52 m/s. While, the lowest average value of wind speed was 2.0 m/s in September with lower adjacent was 1.35 m/s and upper adjacent was 2.51 m/s. In a nutshell, use of wind energy in Seoul city is not recommended.

4.2. Statistical Analysis and Comparisons

Evaluation of the wind power and energy per unit area is important in the assessment of the wind power project. A wind turbine (WT) produces energy by converting the flowing wind speed into mechanical energy and then to electricity. Wind power is determined by the size of rotor blades, wind velocity, and air density. Moreover, the theoretical power in moving air is the flow rate of kinetic energy per second by a WT and is given by the equation [48,49,50]
P = 1 2 ρ A V 3 C p
where V is the monthly wind speed (m/s), and Cp is the coefficient by Betz limit, which can achieve the maximum value of 59% for all types of WTs. A is the swept area (πD2/4, D is the rotor diameter in m2 and π = 3.1416), and ρ is the corrected monthly air density (kg/m3), which can be estimated by the following equation [48,49,50],
ρ = P R T ,
where P is the monthly mean air pressure (N/m2); T is the monthly mean air temperature (K); and R is the specific gas constant for air (287 J/kg K).
As shown in Equation (3), if the rotor area in m2 is fixed and the air density is fixed for a given location, then the energy contained in wind is only dependent on the wind speed. Then, we can simplify the aforementioned equation to obtain K.V3, where K is a fixed constant representing the combined fixed rotor blade area, air mass, and efficiency of the turbine. Thus, the “available wind energy is proportional to the cube of the wind speed” or wind velocity. This statement is important because a small change in wind speed results in a huge change in the power contained within it.
The power output from WT to another varies due to different manufacturing factors besides wind speed. In our case, choosing a suitable wind turbine for low wind speed and considering wind energy potential for different regions, where the performance of wind energy generator increases in open areas are important. The Skystream 3.7 WT model is considered in this study to investigate the possibility of using WTs for residential consumption (private use). The Skystream 3.7 WT model, designed for homes and businesses, paved the way as the first compact, all-inclusive personal wind generator (with built-in controls and inverter) designed to work in very low winds. More details about the electrical and mechanical characteristics of the Skystream 3.7 WT are provided in [51]. Figure 13 shows the estimation of annual energy output for various wind speeds that represents all possible areas of South Korea. In addition, Figure 12 illustrates that wind energy production is much less than that of solar energy, which explains why the use of wind generators is uncommon in residential consumption (home systems).
However, wind farms (stations) in open areas that include a set of WTs achieve positive results. A total of 51 wind farms are installed in South Korea. Moreover, the Korean government plans to invest approximately $7.5 billion into wind farms to increase the total capacity to 2.5 GW by 2019 [31]. Details are provided in the following section.

4.3. Current Status and Prospects

This section highlights details about the cumulative wind energy production over the last decade (2007–2016), the location and capacity of the current wind farms, and the government’s strategies and future plans.
Figure 14 shows the cumulative production of wind power in South Korea over the last decade. Evidently, the power output increases annually, which reflects the high interest of the Korean government to shift toward green energy and reduce the significant economic and ecological influence of energy provided by fossil fuels in the coming years [52]. The cumulative wind power was 1089 MW in 2016 from 51 installed sites and 345 units [53], in which the cumulative wind power increased by 20.20% compared with that in 2015 (869 MW) [54]. The highest cumulative wind power produced was in Gangwon, which was 189,140 kW from 11 sites and 113 units, whereas, the lowest wind power produced was in Busan’s wind farm, which was 750 kW from one site and one unit [53]. In addition, the cumulative wind power generated by Jeju’s wind farms was 128,150 kW. Figure 15 summarizes the location and capacity of the installed wind farm in South Korea.
Most wind farms are in Gangwon Province and Jeju Island due to the strong winds in winter of more than 9 m/s that appeared in Jeju Island, Gyeongnam’s east coast, and Gangwon Province mountainous areas (Mt. Seorak, Odaesan, and Taebaek) in December. In January, stronger than 9 m/s winds appeared on the east coast of Pohang and Uljin and along the southwest coast of Jeju Island and Mokpo. Stronger than 9 m/s of wind was observed in in Gangwon-do’s mountainous area in February. In Gangwon-do, the mountainous areas have widespread winds stronger than 9 m/s, and strong winds can be seen in the east coast of Gyeongnam Province, southwest coast of South Jeonnam, and Jeju Island [17].
Jeju Island is a major island off the southern end of the South Korea, where the construction of an offshore wind farm is planned based on the excellent wind energy resources. In 1992, a wind turbine with a 250 kW capacity was installed near Jeju Island. This was the first wind turbine connected to the national grid in the country [31]. After that, the construction of wind energy farms rapidly increased due to the highly increasing demand of electricity. In the sea off of Gujwa-eup, 2-MW and 3-MW wind power generators were installed as a test, whereas 30-MW, 100-MW, and 84-MW commercial wind farms are planned in the sea off of Hangyeong-myeon, Hanlim-eup, and Daejeong-eup of Jeju Island, respectively [55,56].
Moreover, several studies [57,58] have been conducted to assess the possibility of installing off-shore wind farms in different places of South Korea. Kim and Kim [59] assessed the wind energy resources of the Yulchon district in Korea and conducted a comparative economic analysis in order to determine the feasibility of establishing a 30 MW capacity wind farm. They shortlisted three wind turbines as potential candidates and conducted a techno-economic analysis to determine the optimum wind turbine for the Yulchon district. They shortlisted six different wind turbines which are best suited for the development of the wind farm and also estimated their annual energy productions (AEP) and capacity factors. The study, conducted by Kim et al. [58], focused on the selection of an optimal candidate site around the Korean Peninsula through an economic evaluation for the development of Korea’s first large-size off-shore wind farm. They used different criteria to select optimum site(s) which include the expected B/C (benefit/cost) ratio, the possible installation capacity of the wind farm, the convenience of grid connection, and so on. They found that there are multiple locations around the Korean Peninsula best suited for large-scale off-shore wind farms. A similar study was also conducted by Oh et al. [60] in order to assess the wind energy potential around the Korean Peninsula, and also to determine the feasibility of a 100 MW class off-shore wind farm. Lee et al. [61] conducted a feasibility study to assess the wind potential of the Younggwang district in South Korea, which is a candidate site for the development of an off-shore wind farm, which is planned to be constructed by 2019.
Wind farms play a decisive role in meeting energy demands and achieving a climate-friendly environment. The Korean government plans to invest approximately $7.5 billion in wind farms to increase the total capacity to 2.5 GW by 2019 [31]. Furthermore, the Korean government seeks to develop the solar and wind power sector as major alternative energy resources, which will account for 11.0% of total energy production by 2035 [31]. Wind power will play an important role in the long-term deployment plan, where wind farms will supply 18.2% of total energy by 2035 [11].

4.4. Challenges and Potential Solutions

Despite the huge potential and numerous benefits of wind energy, many challenges which may affect the future of wind energy should be considered. The main barriers and challenges are summarized as follows:
A. Cost
Figure 16 LCOE, O&M, and fuel costs for the baseload technologies of electricity generation with various scenarios of wind technologies at 3% discount rate. The LCOE for onshore wind and offshore wind are US$ 111.64/MWh (US$ 0.112/kWh = 122.08 South Korean Won) and US$ 214.47/MWh (US$ 0.214/kWh = 233.26 Won), respectively. Meanwhile, the LCOE for conventional energy technologies coal-pc800 is US$ 77.66/MWh (US$ 0.078/kWh = 85.02 won), US$ 74.30/MWh (US$ 0.074/kWh = 80.66 Won) for coal-pc1000, and US$ 121.82/MWh (US$ 0.122/kWh = 132.98 Won) for CCGT [38]. Despite the general sustained decrease in the cost of renewable energy for the past years, the LCOE of wind energy technology is still higher than that of conventional technologies for electricity generation. The main reason for the increase in the LCOE of wind energy technology is the significant variation in capital costs, which accounts for more than 80% of LCOE for wind energy technology. However, the fact that positive externality that green energy technology (wind energy) does not rely on fuel, which is subject to significant price fluctuations and associated risks, should be considered. In addition, using green energy technology may lead to reduced CO2 and other pollutant emissions, decreased need for other generation capacity, and potentially reduced need for grid usage and associated losses [34].
Most wind turbine systems were supplied by local turbine manufacturers since 2011. However, one of the leading turbine manufacturers (Vestas) has 42.2% market share in the Korean wind energy industry, and many wind farm owners are not fully satisfied with Vestas’ service due to its high cost [53]. Increasing the independence of manufacturers and reliance on local turbine manufacturers may considerably reduce costs (replacement and maintenance). Nevertheless, local turbine manufacturers should enhance the size, length, cost, reliability, and efficiency of wind turbines.
B. Energy Source
Wind sources are intermittent and unpredictable. To ensure uninterrupted power supply, wind energy systems should be coupled with other energy sources (public electrical grid). In addition, competent short- and long-term forecasting and careful planning and analysis would help reach an optimal solution.
C. Technical Hindrances
  • Local turbine manufacturers should enhance the size, length, cost, reliability, and efficiency of wind turbines. Numerous manufacturing issues must be addressed because wind turbine components undergo excessive forces and tremendous joint stresses and failures. For instance, blades, towers, and casings must be able to withstand heat, cold, rain, and ice and adapt to changing wind speeds. Blades must also be constructed with a high strength-to-weight ratio, and thus research into new materials is crucial.
  • The increasing distance between offshore wind farms and destinations makes the costs and risk management of transmission technologies an even more complex challenge to the industry. Careful planning and analysis would help reach optimal solutions.
  • Turbines might cause noise due to turbine blades. However, this problem is resolved or greatly reduced through technological development and by choosing the locations of wind plants properly.
D. Environmental Factors
Another barrier to using wind turbines is lightning activity—strikes by lightning and damage to the electronic components. However, this problem may be considerably reduced through technological developments and monitoring systems and through periodic maintenance that increases system performance.

5. Conclusions and Recommendations

This paper discussed the opportunities, prospects, and challenges of solar and wind energy in South Korea. The findings of this study can help the decision of policy makers to frame strong policies by understanding the overall perspective of implementing solar and wind energy, considering the strength, weakness, opportunities, and challenges associated with it. Furthermore, the findings revealed that the opportunities and strengths of solar and wind energy are much stronger than their weaknesses and challenges. Hence, the present study strongly recommends the adoption, deployment, growth, and installation of solar and wind energy technology and related projects for a sustainable future in South Korea. Note that the results obtained are in the context of South Korea but more or less can be generalized to neighboring countries, because strengths, weaknesses, and opportunities are common attributes selected in research.
Herein, some recommendations are suggested that can help in the decision-making process of policy makers to frame strong policies to efficiently develop and ensure sustainability with improved planning to provide clean energy.
  • The southeastern coastal area, including Jeju Island, is considered a suitable place to establish solar power plants due to these locations having a high radiation rate of over 5 kWh/m2. In addition, using a dual-axis tracking system for the PV array increase the total amount of energy produced by a PV system by approximately 20% to 30%, and dual-axis tracking system also allows wind, rain, and gravity to remove most debris and dust. On the other hand, it is necessary to consider the area that will be uses for installation of solar power plants. Solar power plants floating on top of the water near these islands is recommended, thereby promoting land use to accommodate potential population growth in the future without any obstacles.
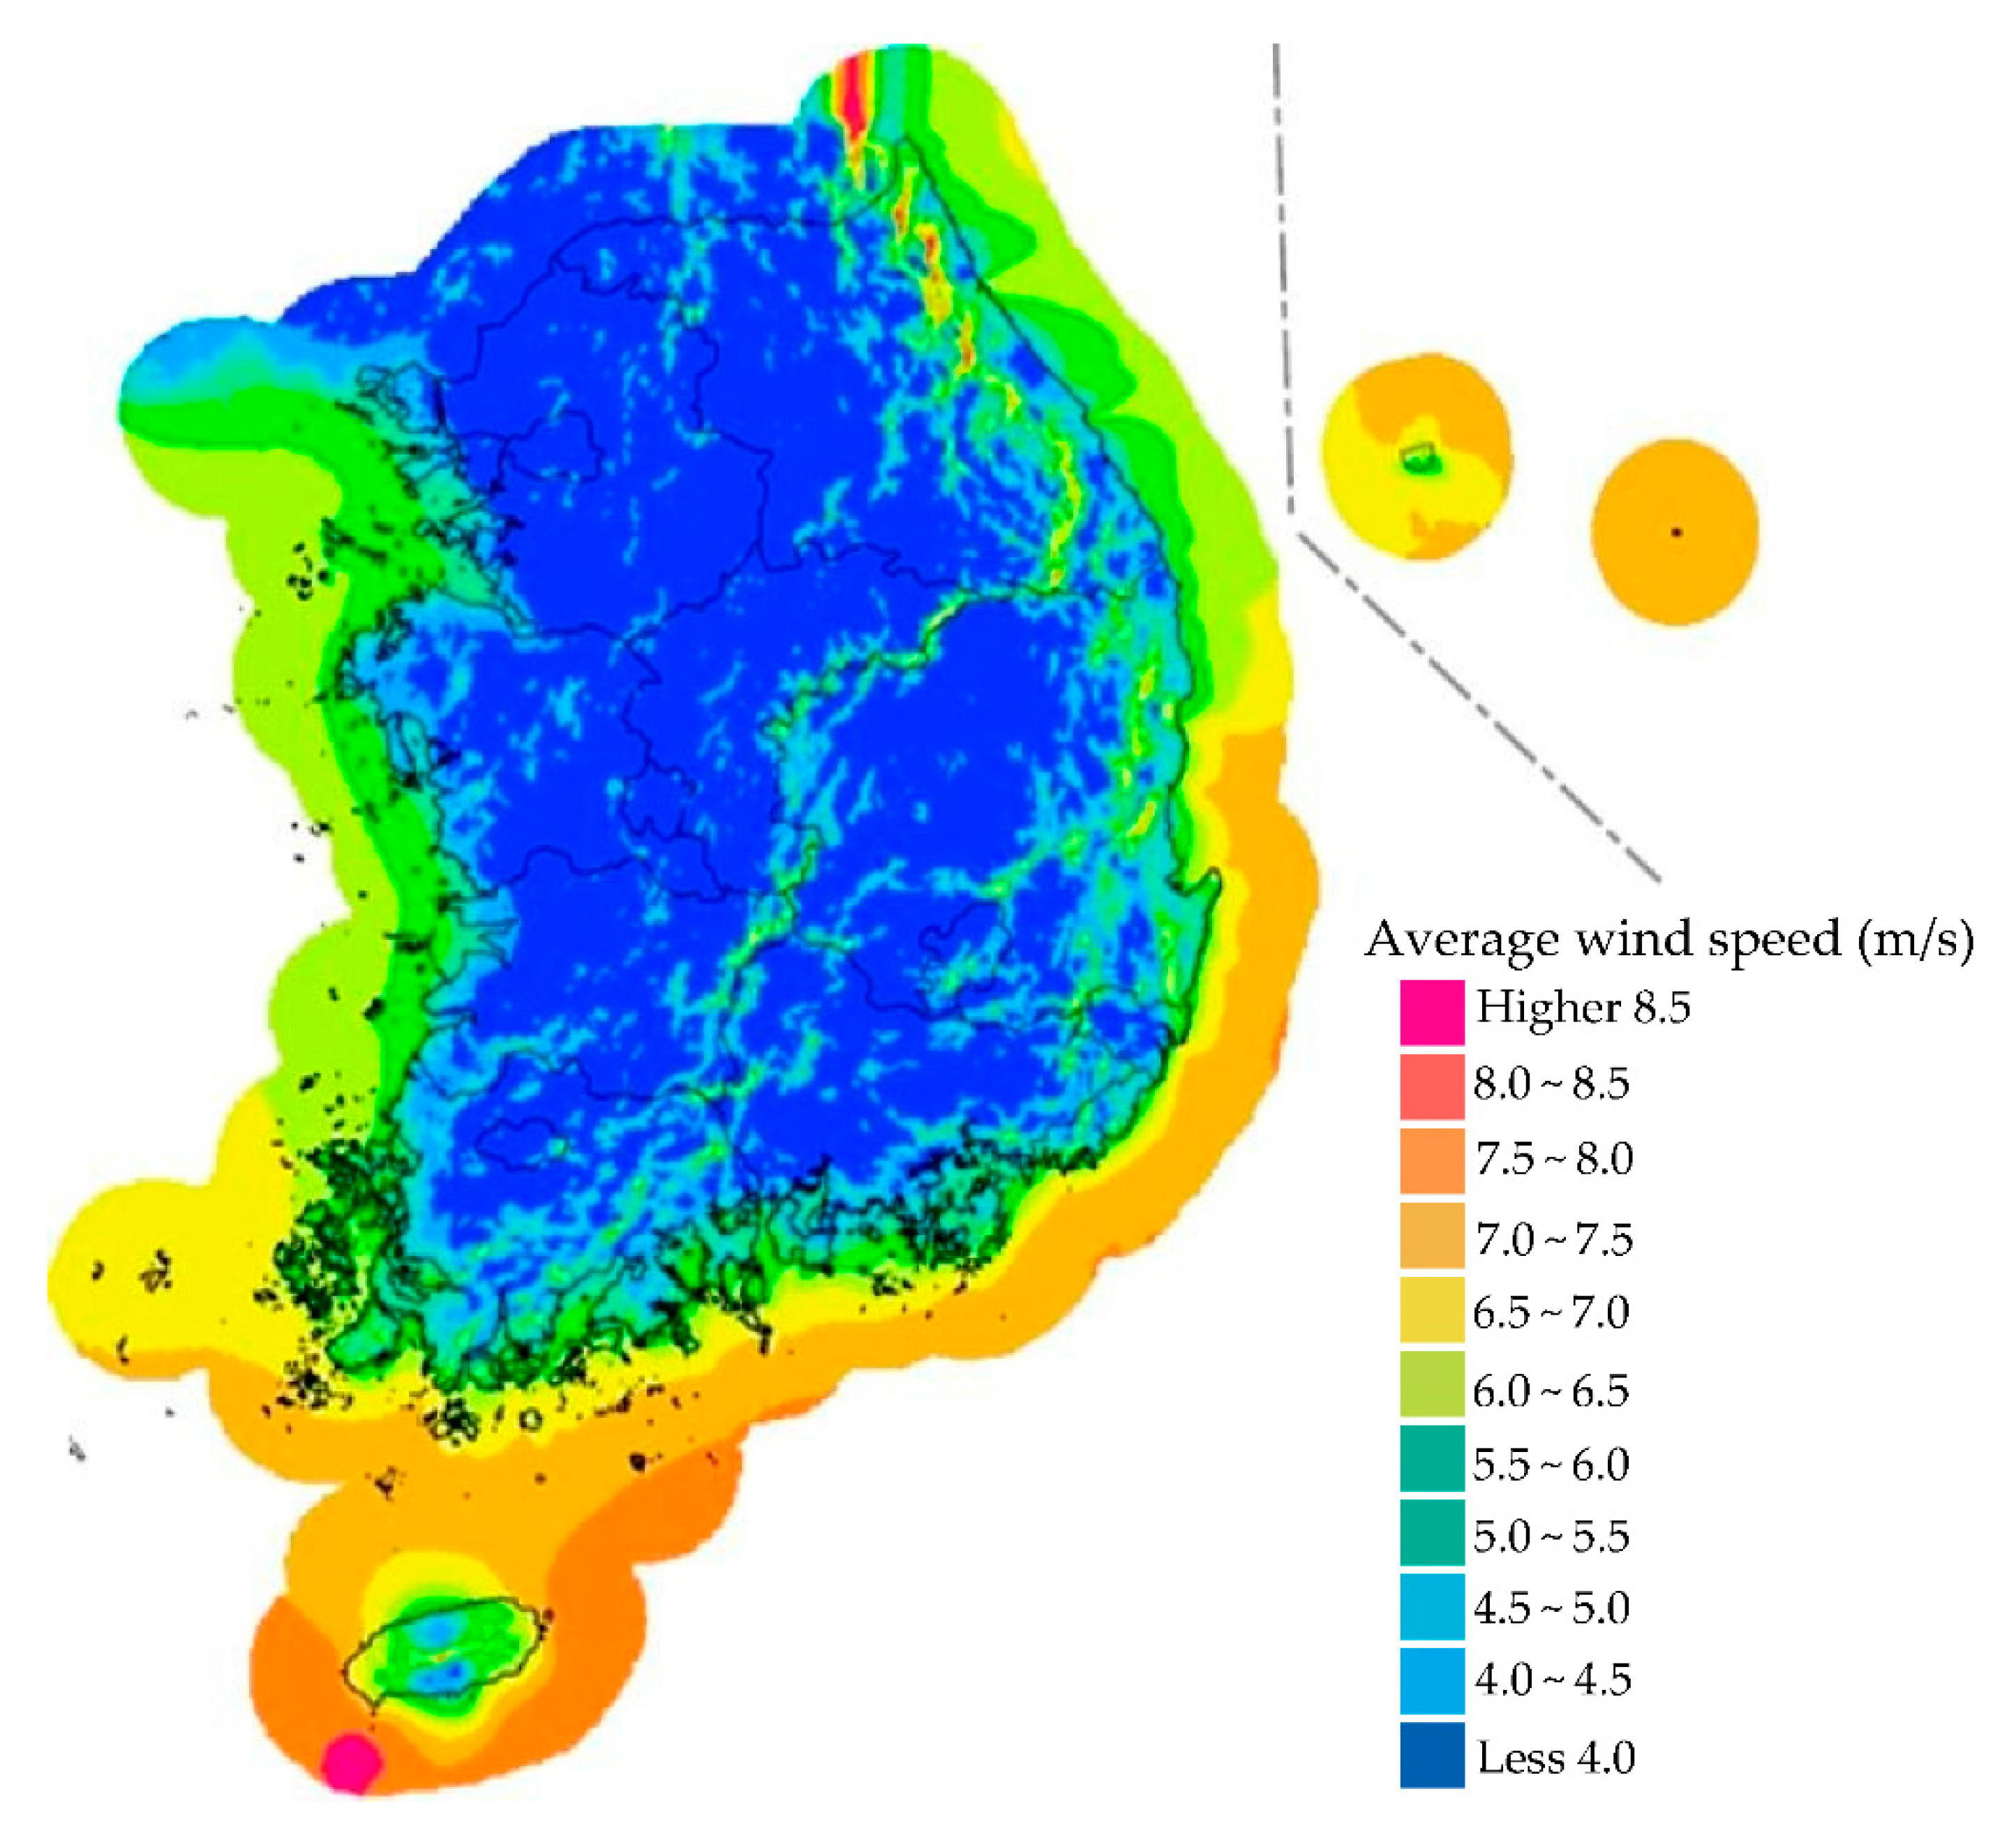
  • Jeju Island, Gyeongnam’s east coast, Gangwon Province mountainous areas (Mt. Seorak, Odaesan, Taebaek), the southwest coast of south Jeonnam, and the eastern coasts of Pohang and Uljin are a suitable places to use energy acquired from wind power. Moreover, the government should support and encourage local turbine manufacturers. The local turbine manufacturers need to make wind turbines larger, taller, less expensive, more reliable, and more efficient.
  • The infrastructure of transmission systems requires particular attention and care from officials to reduce transmission and distribution losses as much as possible. Careful planning and analysis would help reach the optimal solution.
  • Generally, renewable energy markets have experienced phenomenal growth in South Korea in the last decade because of significant technological improvements and government policies that support the development and utilization of renewable energy, thereby leading to a reduction in cost. Despite the huge technical potential, the development and large-scale deployment of renewable energy technologies in South Korea must overcome technical, financial, regulatory, and institutional barriers. The continued support through policies may be necessary to maintain and enhance the growth of renewable energy. In addition, the cooperation between the government and NGOs should be strengthened by devising an improved financing infrastructure to boost renewable energy technology and its products.
  • Excess energy of homes’ installed solar power systems can be added to the public electrical grid, and utility companies can buy electricity from homeowners at the same rate as they sell it themselves.
  • Competent forecasting and careful planning and analysis of solar radiation and wind speed would help achieve an optimal long term system.
In this study, we extensively reviewed the opportunities and prospects of solar and wind energy, as well as its present challenges and potential solutions. One of the most crucial challenges that solar and wind energy systems face is their energy source (i.e., solar radiation and wind, respectively) which is extremely variable. Such variability may increase risk and uncertainty levels in expected solar and wind energy generation, which is considered an inhibiting factor toward energy security. Thus, our future research will focus on the long-term prediction of mean hourly wind speeds and solar radiation values in a region. Such prediction is feasible through the application of a combination of different approaches to minimize the risk of failure within the energy system and to forecast its reliability by modeling or simulating future scenarios in line with the vision of the government.

Author Contributions

As the first author, M.H.A. wrote the main parts and the first draft of this paper as well as reviewed the literature on sustainable power supply. J.H.K. conducted a study on the locations and capacity of solar power plants in South Korea, and wrote Section 3.3 (current status and prospects of the solar power plants). J.K. revised the final version of paper.

Acknowledgments

This work was supported by the Human Resources Development of the Korea Institute of Energy Technology Evaluation and Planning (KETEP) grant funded by the Korean Ministry of Trade, Industry & Energy (no. 20164030201340).

Conflicts of Interest

The authors declare that they have no competing interests.

References

  1. BP Statistical Review of World Energy. 2017. Available online: https://www.bp.com/content/dam/bp/en/corporate/pdf/energy-economics/statistical-review-2017/bp-statistical-review-of-world-energy-2017-full-report.pdf (accessed on 22 May 2018).
  2. Park, S.; Jung, W.; Kim, T.; Lee, S.T. Can renewable energy replace nuclear power in Korea? An economic valuation analysis. Nucl. Eng. Technol. 2016, 48, 559–571. [Google Scholar] [CrossRef]
  3. Lee, J.-S.; Kim, J.-W. South Korea’s urban green energy strategies: Policy framework and local responses under the green growth. Cities 2016, 54, 20–27. [Google Scholar] [CrossRef]
  4. U.S. Energy Information Administration (EIA). Country Analysis Brief: South Korea. Available online: http://www.iberglobal.com/files/2017/corea_eia.pdf (accessed on 22 May 2018).
  5. The Annual Report Korea Energy Agency. Available online: http://www.energy.or.kr/web/kem_home_new/energy_issue/mail_vol22/pdf/publish_05_201507.pdf (accessed on 22 May 2018).
  6. Maennel, A.; Kim, H.-G. Comparison of Greenhouse Gas Reduction Potential through Renewable Energy Transition in South Korea and Germany. Energies 2018, 11, 206. [Google Scholar] [CrossRef]
  7. Ministry of Trade, Industry and Energy. The Fourth National Basic Plan for New and Renewable Energies (2014–2035), Rep. of Korea, 2014. Available online: http://www.index.go.kr/com/cmm/fms/FileDown.do?apnd_file_id=1171&apnd_file_seq=6 (accessed on 22 May 2018).
  8. Baek, S.; Kim, H.; Chang, H.J. Optimal hybrid renewable power system for an emerging island of South Korea: The case of Yeongjong Island. Sustainability 2015, 7, 13985–14001. [Google Scholar] [CrossRef]
  9. Kwon, T.-H. Is the renewable portfolio standard an effective energy policy?: Early evidence from South Korea. Util. Policy 2015, 36, 46–51. [Google Scholar] [CrossRef]
  10. Korean Ministry of Trade, Industry and Energy (MOTIE) & Korea Energy Economics Institute (KEEI). Available online: https://www.keei.re.kr/main.nsf/index_en.html (accessed on 22 May 2018).
  11. Korean Energy Agency (KEA). Annual Report 2015. Available online: http://www.energy.or.kr/renew_eng/resources/resources_view.aspx?no=12&page=1 (accessed on 22 May 2018).
  12. Lee, C.-Y.; Huh, S.-Y. Forecasting new and renewable energy supply through a bottom-up approach: The case of South Korea. Renew. Sustain. Energy Rev. 2017, 69, 207–217. [Google Scholar] [CrossRef]
  13. Alsharif, M.H.; Kim, J. Hybrid Off-Grid SPV/WTG Power System for Remote Cellular Base Stations Towards Green and Sustainable Cellular Networks in South Korea. Energies 2016, 10, 9. [Google Scholar] [CrossRef]
  14. Korea Meteorological Administration (KMA). Annual Climatological Report 2013; Korea Meteorological Administration: Seoul, South Korea, 2013. Available online: http://web.kma.go.kr/eng/index.jsp (accessed on 22 May 2018).
  15. NASA Surface Meteorology and Solar Energy Web Site. Available online: https://eosweb.larc.nasa.gov/cgi-bin/sse/homer.cgi?email=skip%40larc.nasa.gov&step=1&lat=37.499&lon=126.54958&submit=Submit&ms=1&ds=1&ys=1998&me=12&de=31&ye=1998&daily=swv_dwn (accessed on 22 May 2018).
  16. National Institute of Meteorological Sciences (NIMS). Cumulative Solar Irradiance Map. Available online: http://www.greenmap.go.kr/02_data/data02_1_1.do#2#2#1 (accessed on 22 May 2018).
  17. National Institute of Meteorological Sciences (NIMS). Wind Weather Map. Available online: http://www.greenmap.go.kr/02_data/data01.do#2#1#1 (accessed on 22 May 2018).
  18. KOrean Statistical Information Service (KOSIS). Available online: http://kosis.kr/statHtml/statHtml.do?orgId=111&tblId=DT_1B040A4&vw_cd=&list_id=&scrId=&seqNo=&lang_mode=ko&obj_var_id=&itm_id=&conn_path=E1 (accessed on 22 May 2018).
  19. Ministry of Trade, Industry and Energy. The Fourth Basic Plan for New & Renewable Energy. Available online: http://english.motie.go.kr/en/tp/alltopics/bbs/bbsView.do?bbs_cd_n=3&bbs_seq_n=19 (accessed on 22 May 2018).
  20. Korea Energy Economics Institute (KEEI). Available online: https://www.keei.re.kr/main.nsf/index_en.html (accessed on 22 May 2018).
  21. Ministry of Trade, Industry and Energy. The Seventh Basic Plan for Long-term Electricity Supply and Demand (2015–2029); Rep. of Korea; Korea Power Exchange: Naju, Korea, 2015. Available online: https://www.kpx.or.kr/eng/selectBbsNttView.do?key=328&bbsNo=199&nttNo=14547&searchCtgry=&searchCnd=all&searchKrwd=&pageIndex=1&integrDeptCode= (accessed on 22 May 2018).
  22. Ministry of Trade, Industry and Energy. The Second Korea Energy Master Plan. Outlook & Policies to 2035; Rep. of Korea; Ministry of Trade, Industry and Energy: Sejong City, Korea, 2014. Available online: https://policy.asiapacificenergy.org/sites/default/files/2nd%20Energy%20Master%20Plan.pdf (accessed on 22 May 2018).
  23. Alsharif, M.H.; Kim, J. Optimal Solar Power System for Remote Telecommunication Base Stations: A Case Study Based on the Characteristics of South Korea’s Solar Radiation Exposure. Sustainability 2016, 8, 942. [Google Scholar] [CrossRef]
  24. Koo, C.; Hong, T.; Lee, M.; Park, H.S. Estimation of the Monthly Average Daily Solar Radiation using Geographic Information System and Advanced Case-Based Reasoning. Environ. Sci. Technol. 2013, 47, 4829–4839. [Google Scholar] [CrossRef] [PubMed]
  25. Timilsina, G.R.; Kurdgelashvili, L.; Narbel, P.A. Solar energy: Markets, economics and policies. Renew. Sustain. Energy Rev. 2012, 16, 449–465. [Google Scholar] [CrossRef] [Green Version]
  26. Sindhu, S.; Nehra, V.; Luthra, S. Solar energy deployment for sustainable future of India: Hybrid SWOC-AHP analysis. Renew. Sustain. Energy Rev. 2017, 72, 1138–1151. [Google Scholar] [CrossRef]
  27. Khatib, T.; Mohamed, A.; Sopian, K.; Mahmoud, M. A new approach for optimal sizing of standalone photovoltaic systems. Int. J. Photoenergy 2012, 2012. [Google Scholar] [CrossRef]
  28. Kumar, B.S.; Sudhakar, K. Performance evaluation of 10 MW grid connected solar photovoltaic power plant in India. Energy Rep. 2015, 1, 184–192. [Google Scholar] [CrossRef]
  29. Sharp Solar Electricity Incorporation. Available online: http://www.sharp-world.com/solar/en/ (accessed on 22 May 2018).
  30. Korea Meteorological Administration (KMA). Synoptic Weather Observation. Available online: https://data.kma.go.kr/data/grnd/selectAsosList.do?pgmNo=34 (accessed on 22 May 2018).
  31. Ali, S.; Lee, S.M.; Jang, C.M. Techno-Economic Assessment of Wind Energy Potential at Three Locations in South Korea Using Long-Term Measured Wind Data. Energies 2017, 10, 1442. [Google Scholar] [CrossRef]
  32. Kamalapur, G.; Udaykumar, R. Rural electrification in India and feasibility of photovoltaic solar home systems. Int. J. Electr. Power Energy Syst. 2011, 33, 594–599. [Google Scholar] [CrossRef]
  33. Yang, H.J.; Lim, S.Y.; Yoo, S.H. The environmental costs of photovoltaic power plants in South Korea: A choice experiment study. Sustainability 2017, 9, 1773. [Google Scholar] [CrossRef]
  34. Nematollahi, O.; Kim, K.C. A feasibility study of solar energy in South Korea. Renew. Sustain. Energy Rev. 2017, 77, 566–579. [Google Scholar] [CrossRef]
  35. International Renewable Energy Agency (IRENA 2018) Report 2018. Available online: http://www.irena.org/publications/2018/Mar/Renewable-Capacity-Statistics-2018 (accessed on 22 May 2018).
  36. Global Wind Energy Council Report 2016, Global Wind Report 2016-Annual Market Update. Available online: http://gwec.net/publications/global-wind-report-2/global-wind-report-2016/ (accessed on 22 May 2018).
  37. Hanwha Corporation. Build World’s Largest Floating Solar Farm. Available online: https://www.hanwha.com/en/news_and_media/press_release/hanwha-to-build-worlds-largest-floating-solar-farm.html (accessed on 22 May 2018).
  38. International Energy Agency (IEA)/Nuclear Energy Agency (NEA). Projected Cost of Generating Electricity; IEA/NEA: Paris, France, 2015; Available online: https://www.oecd-nea.org/ndd/pubs/2015/7057-proj-costs-electricity-2015.pdf (accessed on 22 May 2018).
  39. Alsharif, M.H.; Kim, J.; Kim, J.H. Green and Sustainable Cellular Base Stations: An Overview and Future Research Directions. Energies 2017, 10, 587. [Google Scholar] [CrossRef]
  40. Chamola, V.; Sikdar, B. Solar powered cellular base stations: Current scenario, issues and proposed solutions. IEEE Commun. Mag. 2016, 54, 108–114. [Google Scholar] [CrossRef]
  41. Korean Energy Agency (KEA). Renewable Portfolio Standards (RPS). Available online: http://www.energy.or.kr/renew_eng/new/standards.aspx (accessed on 22 May 2018).
  42. Kwon, T.H. Rent and rent-seeking in renewable energy support policies: Feed-in tariff vs. renewable portfolio standard. Renew. Sustain. Energy Rev. 2015, 44, 676–681. [Google Scholar] [CrossRef]
  43. Korea Energy Management Corporation (KEMCO). Program for Promoting NRE Deployment. Available online: http://www.kemco.or.kr/new_eng/pg02/pg02040705.asp (accessed on 22 May 2018).
  44. Ohunakin, O.S.; Adaramola, M.S.; Oyewola, O.M.; Fagbenle, R.O. Solar energy applications and development in Nigeria: Drivers and barriers. Renew. Sustain. Energy Rev. 2014, 32, 294–301. [Google Scholar] [CrossRef]
  45. Aman, M.; Solangi, K.; Hossain, M.; Badarudin, A.; Jasmon, G.; Mokhlis, H. A review of Safety, Health and Environmental (SHE) issues of solar energy system. Renew. Sustain. Energy Rev. 2015, 41, 1190–1204. [Google Scholar] [CrossRef]
  46. Fthenakis, V.M. End-of-life management and recycling of PV modules. Energy Policy 2000, 28, 1051–1058. [Google Scholar] [CrossRef] [Green Version]
  47. Lee, J.F.; Rahim, N.A.; Al-Turki, Y.A. Performance of dual-axis solar tracker versus static solar system by segmented clearness index in Malaysia. Int. J. Photoenergy 2013, 2013. [Google Scholar] [CrossRef]
  48. Kusakana, K.; Vermaak, H.J. Hybrid renewable power systems for mobile telephony base stations in developing countries. Renew. Energy 2013, 51, 419–425. [Google Scholar] [CrossRef]
  49. Borhanazad, H.; Mekhilef, S.; Saidur, R.; Boroumandjazi, G. Potential application of renewable energy for rural electrification in Malaysia. Renew. Energy 2013, 59, 210–219. [Google Scholar] [CrossRef]
  50. Ahmed, A.S. Wind energy as a potential generation source at Ras Benas, Egypt. Renew. Sustain. Energy Rev. 2010, 14, 2167–2173. [Google Scholar] [CrossRef]
  51. Skystream 3.7 Website. Available online: http://www.windenergy.com/products/skystream/skystream-3.7 (accessed on 22 May 2018).
  52. Choi, D.G.; Min, D.; Ryu, J.H. Economic Value Assessment and Optimal Sizing of an Energy Storage System in a Grid-Connected Wind Farm. Energies 2018, 11, 591. [Google Scholar] [CrossRef]
  53. Report on Wind Power Industry 2015, South Korea. Available online: https://www.rvo.nl/sites/default/files/2016/03/Rapport%20Windenergie%20Zuid-Korea.pdf (accessed on 22 May 2018).
  54. International Renewable Energy Agency (IRENA). Renewable Energy Capacity 2017. Available online: http://www.irena.org/-/media/Files/IRENA/Agency/Publication/2017/Jul/IRENA_Renewable_Energy_Statistics_2017.pdf (accessed on 22 May 2018).
  55. Kim, T.; Park, J.I.; Maeng, J. Offshore wind farm site selection study around Jeju Island, South Korea. Renew. Energy 2016, 94, 619–628. [Google Scholar] [CrossRef]
  56. Ko, K.; Kim, K.; Huh, J. Variations of wind speed in time on Jeju Island, Korea. Energy 2010, 35, 3381–3387. [Google Scholar] [CrossRef]
  57. Oh, K.-Y.; Kim, J.-Y.; Lee, J.-K.; Ryu, M.-S.; Lee, J.-S. An assessment of wind energy potential at the demonstration offshore wind farm in Korea. Energy 2012, 46, 555–563. [Google Scholar] [CrossRef]
  58. Kim, J.-Y.; Oh, K.-Y.; Kang, K.-S.; Lee, J.-S. Site selection of offshore wind farms around the Korean Peninsula through economic evaluation. Renew. Energy 2013, 54, 189–195. [Google Scholar] [CrossRef]
  59. Kim, H.; Kim, B. Wind resource assessment and comparative economic analysis using AMOS data on a 30 MW wind farm at Yulchon district in Korea. Renew. Energy 2016, 85, 96–103. [Google Scholar] [CrossRef]
  60. Oh, K.-Y.; Kim, J.-Y.; Lee, J.-S.; Ryu, K.-W. Wind resource assessment around Korean Peninsula for feasibility study on 100 MW class offshore wind farm. Renew. Energy 2012, 42, 217–226. [Google Scholar] [CrossRef]
  61. Lee, M.E.; Kim, G.; Jeong, S.-T.; Ko, D.H.; Kang, K.S. Assessment of offshore wind energy at Younggwang in Korea. Renew. Sustain. Energy Rev. 2013, 21, 131–141. [Google Scholar] [CrossRef]
Figure 1. Summary of energy sources, strategies, and policies of South Korea in December 2017 [10]. Abbreviations: thou, thousand; bil, billion; mil, million; toe, tonne; KSA, Kingdom of Saudi Arabia; UAE, United Arab Emirates; bbl, barrel; LNG, liquefied natural gas.
Sustainability 10 01822 g001
Figure 2. Korean government’s long-term plan for new and renewable energy supply 2014–2035 [11].
Sustainability 10 01822 g002
Figure 3. Monthly average daily solar radiation in South Korea [23].
Sustainability 10 01822 g003
Figure 4. Map of average daily solar radiation of South Korea [24].
Sustainability 10 01822 g004
Figure 5. Average daily energy output for four cities with the lowest daily solar radiation.
Sustainability 10 01822 g005
Figure 6. Monthly average of solar radiation in Seoul city over 37 years.
Sustainability 10 01822 g006
Figure 7. Cumulative solar power capacity in South Korea.
Sustainability 10 01822 g007
Figure 8. LCOE, O&M, and fuel costs for baseload technologies of electricity generation with various scenarios of solar technologies.
Sustainability 10 01822 g008
Figure 9. Average monthly wind speed of South Korea [17].
Sustainability 10 01822 g009
Figure 10. Wind monsoon trend in South Korea in winter and summer seasons [8].
Sustainability 10 01822 g010
Figure 11. Meteorological map of wind speeds in South Korea [17].
Sustainability 10 01822 g011
Figure 12. Monthly average of wind speed in Seoul city over 37 years.
Sustainability 10 01822 g012
Figure 13. Estimated annual energy production for various wind speeds of the Skystream 3.7 WT model for residential use.
Sustainability 10 01822 g013
Figure 14. Cumulative wind power capacity in South Korea [54].
Sustainability 10 01822 g014
Figure 15. Locations and capacity of wind farms in South Korea [53].
Sustainability 10 01822 g015
Figure 16. LCOE, O&M, and fuel costs for baseload technologies of electricity generation with various scenarios of wind technologies.
Sustainability 10 01822 g016
Table 1. Summary of the descriptive statistics of the solar radiation data from KMA
Variables Value of Daily Average Value of Monthly Average
Number of readings13,513444
Minimum (W/m2)9.485.6
Maximum (W/m2)676.2377
Mean (W/m2)244.6244
Median (W/m2)244.8244.5
Standard deviation 117.2558.6
Range666.8291.4

