Abstract
The amount of damage caused by landslides has increased due to climate change. Adaptation plans are required to help cope with landslides in order to reduce the extent of the damage. Landslide hazard analysis can help create adaptation plans. Analyzing the cost of damage of and the effect of adaptation to landslides is an effective way to support decision makers. The cost of damage is calculated using the costs of damage incurred in residential and transportation areas in the past, based on data from annual reports. Spatial distribution models are used to analyze landslide hazard areas in the present and the future. Future or potential landslide hazards are estimated by using climate change scenarios through representative concentration pathways. The effects of adaptation measures are assessed using modified variables and a cost-benefit analysis. The uncertainty of the cost of damage is considered using average, minimum, and maximum values. As a result, the methods used to estimate future costs of damage are developed, and the effects of adaptation are analyzed. The future cost of damage is calculated for every climate change scenario. The effect of adaptation are analyzed and areas with a reduced risk of landslides are identified, reducing the cost of damage and adaptation costs, as well as the costs and benefits of adaptation measures. Improving soil drainage is the most effective measure among the four measures analyzed. This study can help estimate future costs of damage and analyze the effect of adaptation in creating effective adaptation plans.
1. Introduction
Negative impacts of climate change have been on the rise [1]. The most common natural disaster in the Republic of Korea (ROK) is landslides [2]. ROK has suffered significant damage to human life, property and infrastructural facilities due to landslides [3]. Reducing the damaging impacts of landslides is one of the most important objectives of creating adaptation plans related to climate change. However, adaptation budgets are limited, and thus, effective adaptation plans should be established within limited means.
Analyzing landslide hazard areas is a good way to support the creation and implementation of adaptation measures. Several studies have focused on finding landslide hazard areas [4,5,6,7,8]. Those studies were largely centered round analyzing spatial information from areas vulnerable to landslides. Some studies estimate potential landslide hazard areas of the future using climate change scenarios [9,10,11].
Only a few studies have assessed the cost of damage of landslides, because it is difficult to collect enough data to analyze this aspect. Generally, relevant institutes restore damaged areas right after the occurrence of a landslide [12]. However, they do not record detailed data of the extent of damage or its cost [13]. Therefore, a few authors assessed the cost of damage due to landslides in small areas to collect long-term data by themselves [14].
Moreover, it is much harder to find studies about the effects of adaptation. The effect of adaptation can be defined as the extent of reduction or avoidance of damage by implementing an adaptation plan [15]. To assess the effect of adaptation, its impact should be quantified. However, quantification is difficult, due to qualitative properties of data for adaptation measures.
Accordingly, studies seeking to assess the cost of damage and the effects of adaptation are limited for a variety of reasons. It is especially hard to find studies on the effects of adaptation. A few studies provide only conceptual diagrams or simple frameworks. However, this study develops methodologies based on these studies to support the establishment of an effective adaptation plan. This study also needs to consider the element of uncertainty during the analysis. Since the exact cost of damage or the effect adaptation cannot calculated, this uncertainty is important.
The objective of this study is threefold: first, to develop a method to calculate the cost of damage caused by potential landslides in the future, taking into consideration uncertainty; second, developing a method to analyze the effect of adaptation based on simulations; and third, analyzing the costs and benefits of adaptation plans toward implementing measures that support effective decision making. This study seeks to contribute to the establishment of efficient landslide adaptation plans to address climate change.
2. Methods
2.1. Assessment Process
This study is composed of two steps (Figure 1). First, this study analyzes the cost of damage caused by landslides based on the landslide hazard area and the cost of damage in the past. Landslide hazard areas are assessed using spatial distribution models (SDMs). SDMs estimate hazard areas using landslide occurrence points and environmental variables. The target years are: 2006 to 2010, the 2040s (2041 to 2050), and the 2090s (2091 to 2100). The cost of damage is calculated by multiplying damage cost per unit area (won/ha) by hazard area (ha). This study followed concepts of previous studies for the landslide susceptibility and associated hazard [16,17,18,19]. This study focuses on landslide hazard rather than susceptibility or risk. Because this study consider effects of existing development such as roads, residential areas.
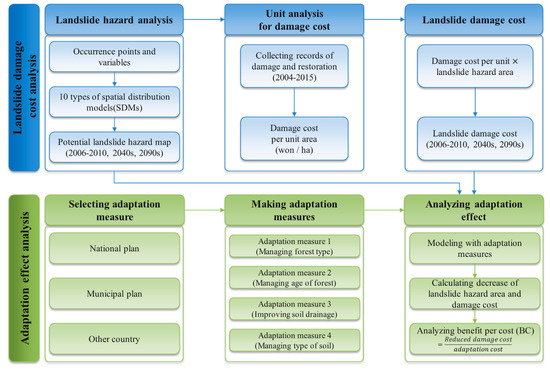
Figure 1.
Framework for assessing landslide hazard, damage cost, and adaptation effect and benefit per cost.
Second, the effect of adaptation is analyzed for each measure that has been implemented. The landslide hazard model is conducted again with modified variables according to the adaptation measures used. Through the analysis, the reduced hazard area and decreased damage cost due to the adaptation measures are derived. The adaptation benefit per cost is also assessed using reduced damage cost (benefit) and relevant climate adaptation projects (cost).
2.2. Landslide Hazard Assessment
Data on the occurrence of landslides pertains to the period between 2006 and 2010, in ROK. Variables consist of climate, topography, soil, and vegetation (Table 1). Climate variables are determined by calculating representative concentration pathways (RCP) climate change scenario data. All variables are converted to (1 × 1) km grid data. Every variable is applied to the first round of modeling and making a proper model by removing variables that have low importance.

Table 1.
Input variables for landslide hazard model.
Various landslide impact assessment models are reviewed to find credible and representative SDMs. Following the review process, three statistic-based models, namely, GLM, GAM, and MARS, and seven models based on machine learning, namely, GBM, CTA, ANN, SRE, MDA, RF, and MAXENT are selected (Table 2). Each SDM is run five times and the average of the results is calculated to consider the uncertainty of each individual model. This study applies an ensemble method to the ten SDMs to analyze the landslide hazard, considering the uncertainty gathered from the models [20].
Table 2.
Ten SDMs for landslide hazard analysis.
2.3. Cost of Damage Caused by Landslides
Past studies related to the cost of damage of landslides are reviewed [21,22,23]. However, there are not many studies on the subject. Most studies have mainly dealt with the cost of damage for the destruction of human life, buildings, roads, and other facilities. Such costs of damage were calculated based on past records of damage caused by landslides. Thus, this study estimates the cost of damage caused by landslides based on data from the annual report for natural disasters [3].
The cost of damage for the purpose of this study includes landslide restoration costs, adaptation costs, and management costs based on the contents of past records. Data on damage caused by landslides from 1997 to 2014 is collected, and the cost of damage per unit area from the records is calculated. Table 3 shows the cost of damage caused by landslides and the areas where landslides occur. The cost of damage for each year is standardized using the 2010 GDP deflator.
Table 3.
Data collected on cost of damage caused by landslides [3].
The cost of damage is estimated by multiplying the cost of unit area and the landslide hazard area. For validation, the cost of damage based on modeling is compared with past records. This method has an advantage arriving at reliable data, in that the cost can include the empirical costs incurred for many years and complex costs due to landslide disasters. Additionally, the uncertainty of the impact assessment model is considered by aggregating results of 10 SDMs.
To calculate the cost of damage, this study focuses on residential and transportation areas that are vulnerable to landslides. There are various land-use types in landslide hazard areas. Generally, peoples’ daily lives center around residential and transportation areas. Thus, when a landslide occurs, these areas could face greater damage than other areas. Data on the cost of damage from past records are also concentrated on damages faced by people. Thus, this approach is appropriate. In this context, vulnerable residential and transportation areas to landslides are found from the landslide hazard map.
The areas where landslides occur and restoration efforts take place show similar trends. The restoration cost per ha is high in 2004 and 2009, but other years show lower values. The average cost of restoration per ha for 18 years is 169.06 million won (maximum value: 483.78 million won, minimum value: 90.75 million won, and standard deviation: 80.14).
2.4. The Effect of Adaptation
There are a few studies analyzing the effects of adaptation plans in addressing climate change. Past studies have focused on simulating various situations by modifying variables in spatial models [24,25,26]. The measures should also consider general adaptation plans to deal with climate change. Thus, four adaptation measures are made considering representative adaptation plans of ROK to deal with landslides, and then to evaluate the properties of input variables for a landslide model (Table 4). The effect of adaptation is analyzed by reanalyzing the landslide model with modified variables.
Table 4.
List of adaptation measures (Please see Appendix A for more information).
The first and second adaptation measures involve managing the type and age of forests. The first adaptation measure involves managing the type of forests, specifically varied across deciduous, coniferous, and mixed forests. There is a lower probability of landslides in mixed forests than in deciduous and coniferous forests. The second adaptation measure manages the age of the forest by reforestation. The Korea Forest Service provides information on the age of forests using a scale of six grades. Each grade is divided by 10 years; the first grade includes 1 to 10 year old forests, the second grade includes 11 to 20 year old forests, and the sixth grade includes over 51 years old forests. The landslide hazard analysis has determined that landslides have occurred in old forests, specifically forests of grades 3, 4, 5, and 6 [27,28]. Therefore, grade 3, 4, 5, and 6 are susceptible to landslide occurrence. The landslide occurrence can be reduced by changing the forest grade by using adaptation plans such as forest management. In this context, grades 3, 4, 5, and 6 are changed into grade 2, and use the changed data as the input data of modeling to simulate the effect of adaptation to landslides.
The following adaptation measures are related to soil. The third adaptation measure aims at improving soil drainage. The Korea Water Resources Corporation (KWRC) provides information on soil drainage using a scale comprising of six grades (Appendix A). The grades 1, 2, and 3 are changed into grade 6, based on the previous studies and results of landslide hazard analyses. The previous study shows that grades 1, 2, and 3 (high level of soil drainage) can cause landslides in the forestland of ROK [29]. According to the previous studies, this relates to the underground water level and soil properties of ROK [29,30].
The fourth adaptation measure relates to the type of soil. Soil is classified into six types, after studying seventeen types provided by KWRC [27]. The six types consist of 1 (gravel), 2 (sand), 3 (loamy sand), 4 (silty sandy loam), 5 (silty clayey loam), and 6 (clayey loam) (Appendix A). The results of landslide hazard modeling revealed that types 1, 2, and 3 are susceptible to landslides. Thus, this study changed types 1, 2, and 3 into type 6 to decrease the probability of landslide.
The “Benefit/Cost” of adaptation (“adaptation BC”) is calculated to check the economic effect of adaptation measures. Benefit refers to decreased cost of damage by reducing the number of areas that are vulnerable to landslides. Thus, BC is same as “decreased cost of damage per adaptation cost.”
Benefit/Cost = (Original cost of damage − Cost of damage considering adaptation measures)/(Required cost for adaptation measures)
Details on projects related to the four adaptation measures mentioned above are collected. The cost of adaptation is calculated by taking the average of the cost of relevant cases. The unit of adaptation cost is South Korean won (KRW) per 1 ha.
Data and the number of past studies are insufficient. Thus, adaptation BC analysis is difficult to calculate quantitatively. However, this study suggests using adaptation BC analysis to support the establishment of effective adaptation plans. Generally, the government has a limited budget for adaptation plans. Adaptation BC analysis can provide expected results for various options for adaptation plans, and help decision making toward effective planning.
3. Results
3.1. Landslide Hazard Assessment (Example)
In this section, the study focus on the shallow landslide, which is the most general landslide type in ROK. Table 1 shows input variables for the assessment. The soil type includes six types such as gravel, sand, loamy sand, silty sandy loam, silty clayey loam, and clayey loam. (Appendix A). Appendix A also shows detailed information of soil depth and drainage.
The ten SDMs are used to assess landslide risks. As a result of the modeling test, each run of the model shows a slight difference in reliability (Table 5). However, the AUC value of every model is over 0.78. Thus, the statistical reliability is high. The differences among AUC values come from optimizing the model’s process. Thus, this study uses the results of five runs in order to consider errors in the modeling process.
Table 5.
Statistical reliability of SDMs.
To make an aggregated landslide hazard map, this study synthesizes the results of ten SDMs through an ensemble method. The ensemble method involves synthesizing results of ten SDMs considering the statistical reliability of each model. The result map reveals an almost similar distribution of hazard areas to the present landslide occurrence map (Appendix B).
Future landslide hazard areas are estimated by applying climate change scenarios to the present landslide hazard model. This study applies RCPs 2.6, 4.5, 6.0 and 8.5 scenarios, and sets target years as the 2040s (2041 to 2050) and the 2090s (2091 to 2100). The landslide assessment model estimates future landslide hazard areas based on changes in the intensity of rainfall. Thus, the distribution of landslide hazard area also changes according to the properties of rainfall in the future.
In the 2040s, there is no increase of landslide hazard areas (Table 6). However, every scenario has landslide hazard areas. Thus, an adaptation plan is required to adapt to landslides. On the other hand, in the 2090s, every scenario, except for RCP 2.6, shows an increase in hazard areas. This is because the intensity of rainfall is low in the 2040s and high in the 2090s.
Table 6.
Future landslide hazard areas.
3.2. Cost of Damage
The cost of damage per ha is analyzed using the records of the cost of damage of landslides across the nation over 18 years. The chosen standard monetary value is from 2010. As a result of the analysis, the average cost of damage is 169 million won per ha (Table 7). The minimum value is 90.75 million won per ha and the maximum value is 483.78 million won per ha. The average, minimum, and maximum costs of damage are used to consider the uncertainty of the cost because the average costs of damage can’t be the most reliable value. Thus, this study considers average, minimum, and maximum costs together. The cost of damage is defined as the cost including landslide restoration, adaptation, and management costs, based on the contents of past records.
Table 7.
Cost of damage per unit area [3].
As previously mentioned, this study focuses on residential and transportation area considering the concentration of damage and data from past records. This study finds vulnerable land-use areas based on landslide hazard maps. The vulnerable residential areas are 12,900 ha and vulnerable transportation areas are 1100 ha.
According to records containing reports on disasters over the past eighteen years, the cost of damage caused by landslides is concentrated in areas where landslides commonly occur. This means that severe instances of landslide damage converge on a limited area. This study calculates using data from past records and obtains 5.11% as the average of the ratio of limited areas. Therefore, this study focuses on the cost of damage considering 5.11% to avoid overestimation of the cost. The damaged area is multiplied with average, minimum, and maximum costs of damage per ha (Table 8).
Table 8.
Estimated cost of damage by using landslide hazard model and past cost of damage per unit.
The cost of damage based on the average value of cost of damage per unit (120.8 billion won) is most similar to the real cost of damage, which is 131.2 billion won. The model underestimates the cost of damage by about 7.93%. Meanwhile, the cost of damage is 64.8 billion won (50.58% underestimation) when the minimum value of cost of damage per unit is applied. The maximum cost of damage is 345.9 billion won (163.47% overestimation). Therefore, the cost of damage based on average shows the most reliable result.
This study estimates future costs of damage caused by landslides by using the above method of estimating the present cost of damage. First of all, vulnerable residential and transportation areas are found among landslide hazard areas. The ratio of increase among these areas is much higher than the ratio among all landslide hazard areas (Table 9). Thus, this study considers that the distribution of areas vulnerable to landslides in the future is more highly concentrated among residential and transportation areas. The areas vulnerable to landslides are decreased in the 2090s with RCP 2.6. However vulnerable residential and transportation areas will not decrease much in same target year and scenario. This means that vulnerability will decrease in other land-use types such as farmland, rice paddy, forest land, but residential and transportation areas remain vulnerable to the landslide. Though RCP 2.6 supposes successful mitigation plans, adaptation plans are required for residential and transportation areas, considering future landslide hazards. In the 2040s, with RCP 4.5 and 6.0, areas vulnerable to landslides have decreased, but the future cost of damage has increased.
Table 9.
Areas vulnerable to landslides among residential and transportation areas.
The cost of damage is estimated by multiplying vulnerable areas of the future and the cost of damage per ha (minimum, average, and maximum) (Table 10). According to the results of the present costs of damage, the future costs of damage based on an average would be most reliable. Future costs of damage in the 2090s (RCPs 6.0 and 8.5) have increased to about three to four times that of the present. According to the RCP 8.5 scenario, huge costs of damage are estimated in residential and transportation areas.
Table 10.
Estimation of future landslide cost of damage.
3.3. Effects of Adaptation and Cost-Benefit Analysis (Example)
As a result of analyzing the effects of adaptation to landslides, the reduced future landslide hazard areas are assessed using four adaptation measures (Appendix C). A table is made for each adaptation measure, the many climate change scenarios, and target years (Table 11). Since there are too many values in the table, the “hazard areas of each adaptation measure” is aggregated and the “average of ratio compared to no measure” is calculated to compare effectiveness with other measures.
Table 11.
Results of adaptation effect analysis.
Adaptation measure 1 is the most effective option among the four measures (1,937,200 ha and 74.79%). On average, this option reduces about 25.21% of the hazard areas, when compared to no measures being employed. The second most effective option is adaptation measure 4 (1,589,600 ha and 79.71%). The third effective option is adaptation measure 2, and the fourth is adaptation measure 3.
Table 8 shows an interesting result on the effectiveness of adaptation measures, according to RCP scenarios. RCPs 8.5 and 6.0 show a lower “ratio compared to no measure” than RCPs 4.5 and 2.6. This means that the effect of rainfall can affect the effectiveness of the adaptation measure greatly. RCPs 8.5 and 6.0 estimate heavier rainfall in the future than RCPs 4.5 and 2.6.
The cost of damage considering the effect of adaptation is calculated using hazard area and cost of damage per ha (Table 12). The cost of damage based on average is used to estimate the reduction in the cost of damage by implementing adaptation measures. As a result of the analysis, every adaptation measure can help reduce the cost of damage. Adaptation measure 1 exhibits the highest reduction in the cost of damage among the four measures. This result is the same in all the target years, except for the 2090s of RCP 6.0.
Table 12.
Reduced cost of damage by adaptation measures.
The adaptation cost is analyzed by investigating adaptation projects of relevant institutes (Table 13). The minimum, average, and maximum adaptation costs are calculated to consider the uncertainty of different projects. The adaptation cost is used in the BC analysis.
Table 13.
Estimated adaptation cost for adaptation measures.
Table 14 exhibits the results of adaptation BC analysis. The minimum, average, and maximum values of adaptation cost is used to analyze the extent of BC. Understandably, BC based on minimum adaptation cost is higher than the average and maximum values. The differences among the average, minimum, and maximum values constitute about 10%.
Table 14.
BC analysis for adaptation measures.
In the 2040s, almost every BC is lower than 1, except for RCP 4.5. Since the estimated landslide hazard in the 2040s is low, the adaptation cost is bigger than the benefit. In the 2090s, BC differs across adaptation measures, target years, and scenarios. Adaptation measure 1 displays a higher BC than other measures. Meanwhile, the target years, the 2090s, show higher a BC than the 2040s do. This means that the bigger the landslide hazard area, the better the BC. In other words, adaptation measures are essential in order to respond to high levels of hazard.
Table 14 is rearranged to interpret the results clearly. The average of each adaptation measure is calculated to compare effectiveness (Table 15). Adaptation measure 1 has the highest BC value and adaptation measure 2 has the second highest. Adaptation measure 3 has the lowest among the four measures.
Table 15.
BC based on average of adaptation cost.
Adaptation measure 1 exhibits the most decreased hazard areas and has the highest BC value among the four measures. Meanwhile, adaptation measure 4 shows the second most decreased hazard areas, but its BC value is third among the four measures. Adaptation measure 2 demonstrates the third most decreased hazard areas and its BC value is the second. Lastly, adaptation measure 3 exhibits the lowest effectiveness among the four measures in the effects of adaptation and BC analysis. Thus, adaptation measure 1 is the most effective option to adapt to landslide hazard areas.
4. Conclusions
The objective of this study is to identify a means to analyze the cost of damage due to landslides, and to identify a way to assess the effect of adaptation and adaptation BC plans for landslide. This study calculated the average cost of damage per unit area by using past records of the cost of damage of landslides. This study also estimated future costs of damage using the cost of damage per unit and landslide hazard area derived from SDMs and climate change scenarios. Input variables are modified to consider adaptation measures and SDMs are run with modified variables to analyze the effect of adaptation. Adaptation BC is analyzed by using benefit (reduced hazard area by adaptation measures) and cost (required cost for adaptation projects). Adaptation BC exhibits effectiveness of adaptation measures in addressing future landslide hazards.
Various studies have focused on analyzing properties of landslide damage, finding hazard areas and predicting future hazard areas. These studies intend to support decision making to reduce landslide hazards. However, policy makers find it difficult to understand the results of these studies. Therefore, analyzing and estimating economic cost of damage is aimed at supporting decision makers. Additionally, the effect of adaptation and adaptation BC can help give information on the effectiveness of adaptation measures. This study suggests quantitative methodologies to support policy makers by introducing the economic cost of damage and effects of adaptation into existing research methods.
Meanwhile, this study has several limitations and difficulties. First, collecting reliable economic data is difficult. The definition of the cost of damage is vague. It is difficult to collect detailed data. Thus, continuously gathering data on the cost of damage caused by landslides and adaptation cost is required in order to establish effective adaptation plans. Second, it is difficult to analyze the effect of adaptation using an objective method. To solve this problem, simulating with various adaptation measures is needed to analyze the effects of adaptation. However, it is difficult to find proper options or projects related to climate change. Thus, the reality and the concreteness of adaptation measures should be considered.
This study suggests methods to analyze future costs of damage caused by landslides, the effects of adaptation, and adaptation BC for various climate change scenarios to find effective adaptation measures. Climate change affects the entire world, and thus, both, developed and developing countries need proper climate adaptation plans. Therefore, frameworks and methods of this study can be used as important tools to support decision making for the creation and establishment of adaptation plans.
Author Contributions
H.G.K. analyzed GIS data and wrote the paper; D.K.L. contributed to collect materials and revise manuscript; C.P. contributed to conduct economic assessment and write the paper.
Acknowledgments
This work was supported by Korea Ministry of Environment (MOE, Project No. 2016000210004) as “Public Technology Program based on Environmental Policy”, and the BK 21 Plus Project in 2015 (Seoul National University Interdisciplinary Program in Landscape Architecture, Global Leadership Program toward Innovative Green Infrastructure).
Conflicts of Interest
The authors declare no conflicts of interest.
Appendix A
Table A1.
Detailed information of soil variables.
Table A1.
Detailed information of soil variables.
| Variable | Class | Contents | Standard |
|---|---|---|---|
| Soil type | 1 | Gravel | - |
| 2 | Sand | Silt < 15%, Sand ≥ 85% | |
| 3 | Loamy sand | Silt < 30%, Sand 75~85% | |
| 4 | Silty Sandy loam | Clay < 7%, Silt < 50%, Sand 43~52% | |
| 5 | Silty clayey loam | Clay 27~40%, Sand < 20% | |
| 6 | Clayey loam | Clay 27~40%, Sand 20~45% | |
| Soil depth | 1 | Very deep | >150 cm |
| 2 | Deep~Very deep | 125~150 cm | |
| 3 | Deep | 100~125 cm | |
| 4 | Normal~Deep | 75~100 cm | |
| 5 | Normal | 50~75 cm | |
| 6 | Shallow~Normal | 35~50 cm | |
| 7 | Shallow | 20~35 cm | |
| 8 | Very shallow | <20 cm | |
| Soil drainage | 1 | Very good | Relative class is decided by water permeability, underground water level, soil color. |
| 2 | Good~Very good | ||
| 3 | Good | ||
| 4 | Moderately good | ||
| 5 | Poor | ||
| 6 | Very poor |
Appendix B
Table A2.
Potential landslide hazard areas (2006–2010, 2040s, 2090s).
Table A2.
Potential landslide hazard areas (2006–2010, 2040s, 2090s).
 | |
| Present | |
 |  |
| 2040s | 2090s |
| RCP 2.6 | |
 |  |
| 2040s | 2090s |
| RCP 4.5 | |
 |  |
| 2040s | 2090s |
| RCP 6.0 | |
 |  |
| 2040s | 2090s |
| RCP 8.5 | |
Appendix C
Table A3.
Landslide hazard areas considering adaptation measures.
Table A3.
Landslide hazard areas considering adaptation measures.
| Adaptation Measure | Climate Change Scenario | Target Year | |
|---|---|---|---|
| 2040s | 2090s | ||
| 1 (Managing forest type) | RCP 2.6 |  |  |
| RCP 4.5 |  |  | |
| RCP 6.0 |  |  | |
| RCP 8.5 |  |  | |
| 2 (Managing age of forest) | RCP 2.6 |  |  |
| RCP 4.5 |  |  | |
| RCP 6.0 |  |  | |
| RCP 8.5 |  |  | |
| 3 (Improving soil drainage) | RCP 2.6 |  |  |
| RCP 4.5 |  |  | |
| RCP 6.0 |  |  | |
| RCP 8.5 |  |  | |
| 4 (Managing type of soil) | RCP 2.6 |  |  |
| Rcp 4.5 |  |  | |
| RCP 6.0 |  |  | |
| RCP 8.5 |  |  | |
References
- IPCC. Summary for Policymakers. In Managing the Risks of Extreme Events and Disasters to Advance Climate Change Adaptation; IPCC: Cambridge, UK; New York, NY, USA, 2012. [Google Scholar]
- Kee, K.-D. Abnormal Climate and Landslide in South Korea. J. Clim. Res. 2012, 7, 119–135. [Google Scholar]
- Ministry of Public Administration and Security, Annual Report for Disaster; Seoul, Korea, 2014. Available online: http://www.mpss.go.kr/board/board.do?boardId=bbs_0000000000000042&mode=view&cntId=17 (accessed on 10 April 2018).
- Guzzetti, F.; Reichenbach, P.; Cardinali, M.; Galli, M.; Ardizzone, F. Probabilistic landslide hazard assessment at the basin scale. Geomorphology 2005, 72, 272–299. [Google Scholar] [CrossRef]
- Yesilnacar, E.; Topal, T. Landslide susceptibility mapping: A comparison of logistic regression and neural networks methods in a medium scale study, Hendek region (Turkey). Eng. Geol. 2005, 79, 251–266. [Google Scholar] [CrossRef]
- Pradhan, B.; Mansor, S.; Pirasteh, S.; Buchroithner, M.F. Landslide hazard and risk analyses at a landslide prone catchment area using statistical based geospatial model. Int. J. Remote Sens. 2011, 32, 4075–4087. [Google Scholar] [CrossRef]
- Lari, S.; Frattini, P.; Crosta, G.B. A probabilistic approach for landslide hazard analysis. Eng. Geol. 2014, 182, 3–14. [Google Scholar] [CrossRef]
- Jiménez-Perálvarez, J.D. Landslide-risk mapping in a developing hilly area with limited information on landslide occurrence. Landslides 2018, 15, 741–752. [Google Scholar] [CrossRef]
- Kim, H.G.; Lee, D.K.; Park, C.; Kil, S.; Son, Y.; Park, J.H. Evaluating landslide hazards using RCP 4.5 and 8.5 scenarios. Environ. Earth Sci. 2015, 73, 1385–1400. [Google Scholar] [CrossRef]
- Wood, J.L.; Harrison, S.; Reinhardt, L. Landslide inventories for climate impacts research in the european alps. Geomorphology 2015, 228, 398–408. [Google Scholar] [CrossRef]
- Ciabatta, L.; Camici, S.; Brocca, L.; Ponziani, F.; Stelluti, M.; Berni, N.; Moramarco, T. Assessing the impact of climate-change scenarios on landslide occurrence in Umbria Region, Italy. J. Hydrol. 2016, 541, 285–295. [Google Scholar] [CrossRef]
- Yun, H.S.; Suh, Y.C.; Lee, D.H. Preparation of Landslide Hazard Map Using the Analysis of Historical Data and GIS Method. J. Korean Assoc. Geogr. Inf. Stud. 2009, 12, 59–73. [Google Scholar]
- Ok, J.; Kang, S.; Ryu, G. Analysis on the Properties and Systematic Management of Potential Landslide Sites; Gyeonggi Research Institute: Suwon, Korea, 2011. [Google Scholar]
- Klose, M.; Damm, B.; Terhorst, B. Landslide cost modeling for transportation infrastructures: A methodological approach. Landslides 2015, 12, 321–334. [Google Scholar] [CrossRef]
- IPCC. Managing the Risks of Extreme Events and Disasters to Advance Climate Change Adaptation. A Special Report of Working Groups I and II of the Intergovernmental Panel on Climate Change; IPCC: Cambridge, UK; New York, NY, USA, 2012. [Google Scholar]
- Fell, R.; Corominas, J.; Bonnard, C.; Cascini, L.; Leroi, E.; Savage, W.Z. Guidelines for landslide susceptibility, hazard and risk zoning for land use planning. Eng. Geol. 2008, 102, 85–98. [Google Scholar] [CrossRef]
- Mavrouli, O.; Fotopoulou, S.; Pitilakis, K.; Zuccaro, G.; Corominas, J.; Santo, A.; Cacace, F.; De Gregorio, D.; Di Crescenzo, G.; Foerster, E.; et al. Vulnerability assessment for reinforced concrete buildings exposed to landslides. Bull. Eng. Geol. Environ. 2014, 73, 265–289. [Google Scholar] [CrossRef]
- Peduto, D.; Ferlisi, S.; Nicodemo, G.; Reale, D.; Pisciotta, G.; Gullà, G. Empirical fragility and vulnerability curves for buildings exposed to slow-moving landslides at medium and large scales. Landslides 2017, 14, 1993–2007. [Google Scholar] [CrossRef]
- Korea Meteorological Administration. White Paper for Typhoon of Republic of Korea; Korea Meteorological Administration: Seoul, Korea, 2011; ISBN 1113600160. [Google Scholar]
- Thuiller, A.W.; Georges, D.; Engler, R.; Georges, M.D.; Thuiller, C.W. The Biomod2 Package: The Updated Object-Oriented Version of BIOMOD Package. 2016. Available online: https://cran.r-project.org/web/packages/biomod2/index.html (accessed on 10 April 2018).
- Galve, J.P.; Cevasco, A.; Brandolini, P.; Piacentini, D.; Azañón, J.M.; Notti, D.; Soldati, M. Cost-based analysis of mitigation measures for shallow-landslide risk reduction strategies. Eng. Geol. 2016, 213, 142–157. [Google Scholar] [CrossRef]
- Dahal, B.K.; Dahal, R.K. Landslide hazard map: Tool for optimization of low-cost mitigation. Geoenviron. Disasters 2017, 4, 8. [Google Scholar] [CrossRef]
- Klimeš, J.; Stemberk, J.; Blahut, J.; Krejčí, V.; Krejčí, O.; Hartvich, F.; Kycl, P. Challenges for landslide hazard and risk management in “low-risk” regions, Czech Republic—landslide occurrences and related costs (IPL project no. 197). Landslides 2017, 14, 771–780. [Google Scholar] [CrossRef]
- Seyed, A.H.; Reza, L.; Majid, L.; Ataollah, K.; Aidin, P. The effect of terrain factors on landslide features along forest road. Afr. J. Biotechnol. 2011, 10, 14108–14115. [Google Scholar] [CrossRef]
- Regmi, A.D.; Yoshida, K.; Dhital, M.R.; Devkota, K. Effect of rock weathering, clay mineralogy, and geological structures in the formation of large landslide, a case study from Dumre Besei landslide, Lesser Himalaya Nepal. Landslides 2013, 10, 1–13. [Google Scholar] [CrossRef]
- Kim, M.S.; Onda, Y.; Kim, J.K.; Kim, S.W. Effect of topography and soil parameterisation representing soil thicknesses on shallow landslide modelling. Quat. Int. 2015, 384, 91–106. [Google Scholar] [CrossRef]
- Kim, K.H.; Jung, H.R.; Park, J.H.; Ma, H.S. Analysis on Rainfall and Geographical Characteristics of Landslides in Gyeongnam Province. J. Korean Environ. Restor. Technol. 2011, 14, 33–45. [Google Scholar]
- Yoo, N.; Yoon, B.; Um, D.; Kim, J.; Park, D. Analysis of Rainfall Characteristics and Landslides at the West Side Area of Gangwon Province. J. Korean Geoenviron. Soc. 2012, 13, 75–82. [Google Scholar]
- Choi, J.; Park, K.; Kim, Y. Landslide Risk Assessment Using HyGIS-Landslide. J. Korean Assoc. Geogr. Inf. Stud. 2012, 15, 119–132. [Google Scholar]
- Yeon, Y.K. Evaluation and Analysis of Gwangwon-do Landslide Susceptibility Using Logistic Regression. J. Korean Assoc. Geogr. Inf. Stud. 2011, 14, 116–127. [Google Scholar] [CrossRef]
© 2018 by the authors. Licensee MDPI, Basel, Switzerland. This article is an open access article distributed under the terms and conditions of the Creative Commons Attribution (CC BY) license (http://creativecommons.org/licenses/by/4.0/).