Abstract
In this paper, the thermal performance of a sunspace attached to a house with a central air conditioning system was experimentally investigated. The house with a south-facing sunspace is located in Miyazaki, Japan, where heating is required in winter. In order to reduce the heating energy in winter, the hot air from the attached sunspace is sent to the central air conditioning room, from where it is then distributed and stored throughout the house by way of air circulation. Only when the temperature in the sunspace exceeds 24 °C is the hot air in the sunspace sent to the central air conditioning room. The air circulation between the attached sunspace and central air conditioning room is 500 m3/h. The temperature of the attached sunspace and each room were measured. The results showed that a house with a sunspace can save about 12.2% of energy compared to a house without a sunspace.
1. Introduction
Building energy demands play an important role in the world’s total energy consumption. Japan’s buildings account for more than 30% of its energy consumption [1]. The government recently formulated a policy requiring that all new buildings meet Japan’s energy efficiency standards by 2020, aiming to increase the ratio of renewable energy for each energy supply by 10% by 2020 through the preferment of solar heat and solar light [1]. International regulations increasingly encourage sustainable development strategies that integrate solar energy systems with buildings. The solar techniques can reduce yearly heating requirements by 25% [2]. The optimal architectural design strategies could save 63% to 76% of energy [3]. Several different architectural method designs, such as Trombe walls [4], solar roofs [5], solar chimneys [6], sunspace and so forth, are used in construction. The attached sunspace is considered for the heating season, as they capture the maximum sunlight coming in through the glazing surface causing the inner wall surfaces and air to increase in temperature [7].
Many researchers have investigated various parameters to help increase the efficiency of the sunspace such as glazing area and types, ventilation, shading devices, the storage wall’s materials, orientation and the sunspace’s configurations.
Oliveti et al. [8,9] compared the solar radiation absorption characteristics of a house attached with 10 different geometrical configurations of sunspaces to a house with a single glazed surface. They concluded that the optical characteristics of the sunspaces and the proportion of the glazed area and opaque surfaces are the main factors. They also characterized the optical and thermal efficiency of the sunspace by the evaluation of the solar energy effectively absorbed in the sunspace [10]. They concluded that in the presence of a shading system, the effective absorption coefficient values are between 0.52 and 0.61 in the case of more absorbent walls (the wall absorption coefficients = the floor absorption coefficients = 0.5) and between 0.39 and 0.44 in the case of opaque internal surfaces that are only slightly absorbent (the wall absorption coefficients = the floor absorption coefficients = 0.2). In the absence of a shading device, the effective absorption coefficient values are between 0.54 and 0.62 for the first configuration and between 0.40 and 0.44 for the second.
Monge-Barrio et al. [11] explored the improved design and energy effectiveness of the sunspace for different climatic zones in Spain and concluded that solar heating systems must be designed for the whole year. Bastien et al. [12] used FD (finite difference thermal network) and FR (frequency response) models to analyze the key design objectives of sunspaces equipped with various passive TES (thermal energy storage) systems and concluded that passive TES (thermal energy storage) in sunspaces can most significantly impact the minimum operative temperature, the daily average operative temperature swing and the timing of the heat delivery. Babaee et al. [13] studied the optimal design for the passive heating of a sunspace in an apartment block in Tabriz (cold climate) and showed that the optimum orientation for the sunspace in Tabriz is 5° southeast and the best orientation is 0–10° southeast. The sunspace with a transparent side facing south and three opaque sides is the most efficient.
Chiesa et al. [14] studied the potential efficiency of a sunspace in reducing an apartment’s sensible heat requirement by using EnergyPlus software and concluded that increasing the inner wall capacity did not significantly affect the average performance of sunspaces in adjacent rooms. Ulpiani et al. [7] studied the energy performance of a nearly zero-energy building with different sunspaces (irradiative single-glazed, irradiative double-glazed and convective double-glazed) and concluded that the convective double-glazed sunspace achieves the best energy performance. Lu et al. [15] studied the heating energy performance of a building with a PCM wall attached with a sunspace combined with a PCM floor on the campus of Tianjin University and proved that this heating system can effectively improve indoor temperature. Sánchez-Ostiz et al. [16] studied the thermal energy performance of a house attached with a sunspace and concluded that in summer, adequate ventilation and solar protection systems are the keys to avoiding overheating caused by the sunspace. Bataineh et al. [17] studied the thermal performance of a sunspace with an inclined front surface and proposed that the use of an inclined front surface with double glazing can further reduce the cooling and heating load demands.
Mottard, J.-M. and Fissore, A. [18] developed a new model of an attached sunspace, which focuses on the treatment of solar radiation distribution and internal long-wave radiation exchanges and the model is validated by experimental results. They concluded that it is very important to use geometric methods to distribute the direct solar radiation to the inner surfaces of the sunspace, rather than using the view factors. Rempel et al. [19] investigated the energy performance of four different sunspaces using EnergyPlus software and concluded that the orientation has little effect on performance and large amounts of stored energy are lost through the central. They also [20] assessed traditional massing, a larger range of floor mass thicknesses and various ground connection alternatives in a series of field-validated sunspace models to reveal thermal mass design parameters more suitable to the Pacific Northwest and concluded that the perimeter insulation is not enough and the mass must be separated from the moist soil.
However, no scholars have studied the use of temperature-controlled fans to transfer heat from the sunspace to the interior to reduce the heating load. With the promotion of highly insulated and sealed houses, the central air conditioning systems that integrate ventilation, cooling and heating have received attention. In addition, solar heat utilization is attracting attention as an effective means of reducing energy consumption of cooling/heating and hot water supply. Based on the above, research and development of houses combining the central air conditioning system and solar energy utilization are necessary for a comfortable thermal environment and energy saving. The purpose of this paper is to analyze the thermal performance of a sunspace attached to a house with a central air conditioning system. We conducted a field study investigation to understand heat utilization of the sunspace and proposed suggestions for further effective utilization of the heat in the attached sunspace to reduce heating load.
2. Method
2.1. Experimental Procedure and Simulation Software
We studied the thermal effects and operation methods of the sunspace by using measurements and simulations. In this study, from February 2015 to 2016, we measured the temperature and humidity of each room and the sunspace using the RTR-503 device. The time step was ten minutes. Figure 1 shows the floor plans and the temperature measurement points. The height of the sensors was at the middle height of each space. The Vantage Pro2 Console device was used to measure the humidity outdoors, wind speed, wind direction, solar radiation and temperature. The experimental work introduced here mainly focused on the analysis of the performance of the sunspace when the air was sent to the air conditioning room from the air cavity of the sunspace. THERB for HAM (Simulation Software of the Hygrothermal Environment of Residential Buildings for Heat, Air and Moisture) was used to study the energy performance of a house with a sunspace in winter. THERB for HAM is a dynamic calculation software that can calculate the temperature, humidity, heating and cooling loads for multi-zone buildings [21].
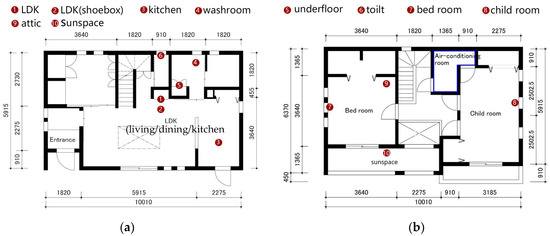
Figure 1.
The measurement points: (a) 1st floor; (b) 2nd floor.
2.2. Experimental House Description
Figure 2 shows the sunspace and exterior of the investigational house located in Miyazaki, Japan. Table 1 shows the house’s specifications. The annual insolation area classification was used to distinguish the potential of solar power generation. The annual insolation area is divided into five classifications in Japan. A4 means an area where the annual insolation is high. The winter insolation area classification is a solar radiation area classification in the heating period (a period when the average daily temperature is less than 15 degrees). The winter insolation area is divided into five classifications in Japan. H3 means that a region has a moderate amount of solar radiation. Area classification of the energy saving standard is determined by the heating degree day (HDD). The seven region means that the heating degree day (D18-18) is more than 500 and less than 1500.
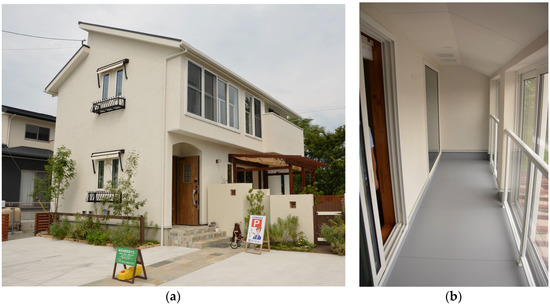
Figure 2.
The experimental house: (a) The exterior; (b) The attached sunspace.

Table 1.
Specifications for the house.
2.3. Air Circulation System
Figure 3 shows the central air conditioning and circulation system in winter. In the central air conditioning and circulation system, external air is sent to the air conditioning room through a total enthalpy heat exchanger and air filters. The air in the central air conditioning room is then sent to each room after its humidity and temperature are adjusted by a residential heat pump air conditioning unit. The air in the rooms returns to the central air conditioning room through duct, hallway and vent layers in the wall. Part of the air is discharged to the outside by a total enthalpy heat exchanger. The rest of the air is sent back to the rooms after going through the central air conditioning room again.
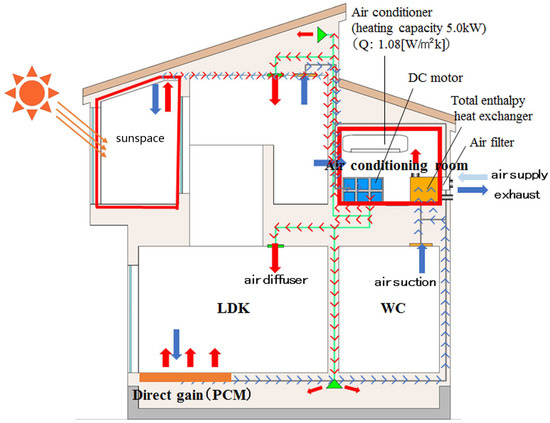
Figure 3.
Central air conditioning and circulation system in winter.
In order to reduce the heating energy, in winter, the heat from the sunspace is sent to the central air conditioning room, from where it is then distributed and stored throughout the building by way of air circulation. Further, in summer, the cooling energy can be reduced by opening the windows on the outside of the sunspace and using the wing walls and roof to provide shade from the sun.
3. Results and Discussion
3.1. Analysis of the Thermal Environment in Winter
We measured the results of March 2015 and results from November 2015 to February 2016. Figure 4, Figure 5, Figure 6, Figure 7 and Figure 8 show the changes in the temperature of each room and the outside air. During the period from 1 to 8 March, the air conditioning was turned on (the set temperature of the air conditioner was 20 °C) and the air in the sunspace was sent to the air conditioning room when the sunspace temperature exceeded 24 °C. From 9 to 31 March and from 1 to 24 November, the air conditioning was turned off and the air in the sunspace was sent to the air conditioning room when the temperature in the sunspace exceeded 24 °C. During the period from 25 November to 29 February, the air conditioning was turned on (the set temperature of the air conditioner was 20 °C) and the air in the sunspace was sent to the air conditioning room when the sunspace temperature exceeded 24 °C.
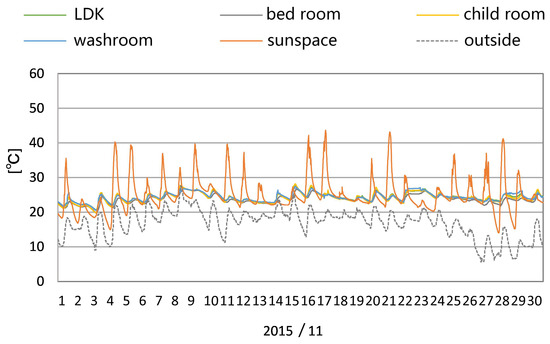
Figure 4.
Each room temperature and outdoor air temperature (November).
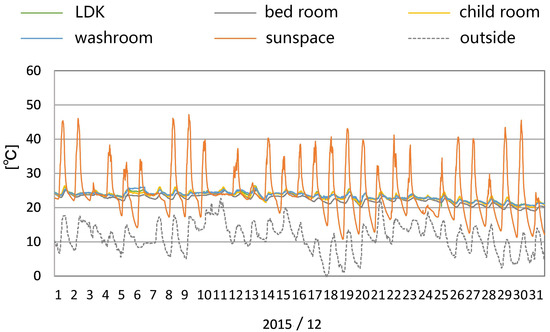
Figure 5.
Each room temperature and outdoor air temperature (December).
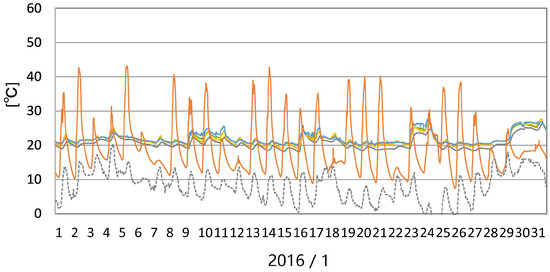
Figure 6.
Each room temperature and outdoor air temperature (January).
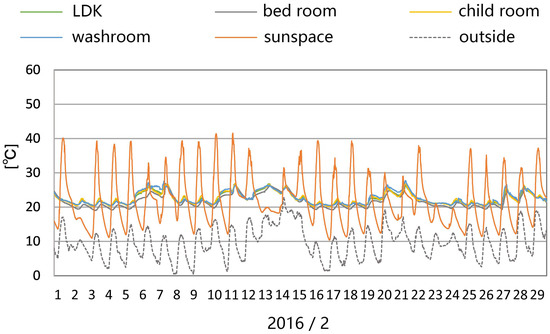
Figure 7.
Each room temperature and outdoor air temperature (February).
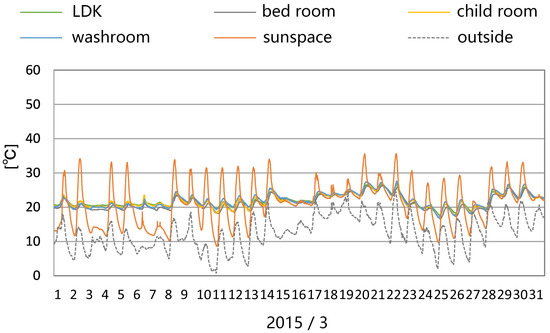
Figure 8.
Each room temperature and outdoor air temperature (March).
In November, December, January and February, on some days the temperature in the sunspace exceeded 40 °C and 70% of the days it exceeded 30 °C in the four months. Even if the air in the sunspace was sent to the air conditioning room, the temperature in the sunspace was still high, so the heat in the sunspace could be further utilized. Even in December, January and February when the outside temperature was low, the heat in the sunspace could be used to reduce the heating load because the temperature in the sunspace reached a high temperature during the daytime.
In November, December, January, February and March, the proportion of days in which the sunspace temperature was over 24 °C (the control temperature when the air in the sunspace is sent to the air conditioning room) was 49%, 40%, 20%, 32% and 29%, respectively (Table 2). In other words, even if the air is sent to the air conditioning room during the time when the temperature in the sunspace exceeds 24 °C, the number of days in the sunspace where the temperature exceeds 24 °C accounts for a large proportion. Therefore, it can be said that the heat in the sunspace cannot be sufficiently utilized only by sending the air in the sunspace to the air conditioning room. Therefore, it is necessary to consider ways to further use the heat inside the sunspace, such as adding additional thermal storage in the sunspace.
Table 2.
The proportion of days in which sunspace temperature over 24 °C.
In November, December, January and February, the proportion of days in which the LDK (living/dining/kitchen) room temperature above was 20 °C was 100% but in March it was 90% (Table 3). As the air conditioning room temperature in March was set at 20 °C, the temperature in each room was lower than 20 °C because the air was sent to each room from the air conditioning room. In addition, from 9 to 31 March, the LDK (living/dining/kitchen) room temperature was lower than 20 °C because the air conditioner was turned off. However, air conditioning was not used from 1 to 24 November but the LDK (living/dining/kitchen) room temperature in November maintained a comfortable temperature (18 °C to 22 °C [22]). In November, the outdoor temperature is higher than in March, so the temperature of the LDK (living/dining/kitchen) room can be kept comfortable by sending hot air from the sunspace to the air conditioning room.
Table 3.
The proportion of days in which the temperature of each room exceeds 20 °C.
In November, December, January and February, the proportion of days in which the washroom temperature was above 20 °C was 100% but in March it was 90% (Table 3). The reason why the percentage of the washroom above 20 °C in March is lower than the other months is the same reason as for the LDK (living/dining/kitchen) room. In addition, as the LDK (living/dining/kitchen) room is located on the south side and the washroom is located on the north side, affected by solar radiation, the percentage of temperatures above 20 °C in the washroom in March was lower than that of the LDK (living/dining/kitchen) room.
The ratio of the temperature of the children’s room above 20 °C was about 100% in November, December and February, 90% in January and 87% in March (Table 3). The ratio of the bedroom temperature above 20 °C was about 100% in November, 94% in December, about 67% in January, 82% in February and 67% in March (Table 3). The percentage of temperatures above 20 °C in the bedroom was lower than that of the children’s room. It can be seen that until the outside air temperature reaches the maximum as shown in Figure 8 (10 to 13 March), the children’s room had a higher temperature than the bedroom and at night the temperature of the bedroom was higher than that of the children’s room. It can be considered that this was influenced by the orientation (east and west). Therefore, owing to the influence of solar radiation, when the outdoor air temperature in the morning became lower, the temperature of the children’s room rose faster than the bedroom temperature and, therefore, the ratio of the bedroom temperature above 20 °C was lower than that of the children’s room.
Figure 9 and Figure 10 show the temperature of each room, the temperature of the outside air and solar radiation. On sunny days, owing to the large temperature difference between daytime and nighttime and the large amount of solar radiation during the daytime, the temperature difference between daytime and nighttime in the sunspace was relatively large. The difference on 4 February was 27.2 °C. As the hot air in the sunspace was sent to the air conditioning room, the temperature in each room increased as the temperature of the sunspace rose. When the amount of solar radiation is relatively small on a rainy day, the temperature difference in the sunspace was relatively small. The difference on 13 February was 3.25 °C. When the temperature in the sunspace was lower than 24 °C, the air in the sunspace was not sent to the air conditioning room, so the central air conditioning machine kept the temperature of each room at a constant temperature and the temperature rose as the outdoor air temperature rose.
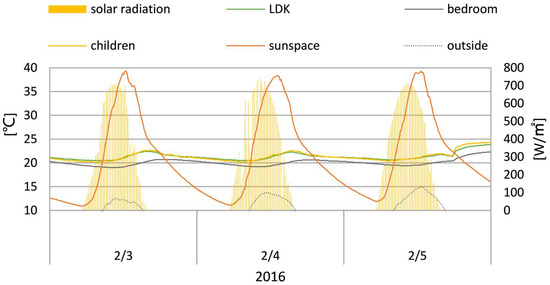
Figure 9.
Each room and outdoor air temperature and solar radiation (three sunny days in February).
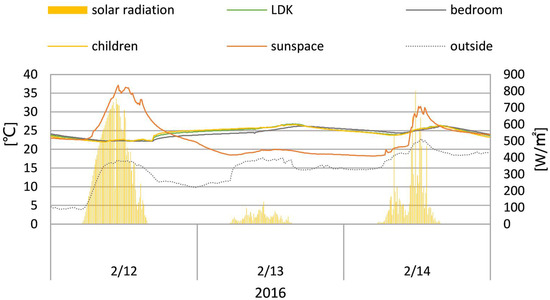
Figure 10.
Each room and outdoor air temperature and solar radiation (three rainy days in February).
3.2. Analysis of the Thermal Environment in the Intermediate Period
Figure 11, Figure 12 and Figure 13 show the temperature of each room and the temperature of the outside air. From 1 to 26 April, the air conditioning was turned off and the air in the sunspace was sent to the air conditioning room when the temperature in the sunspace exceeded 24 °C. From 27 April to 19 June, the air conditioning was turned off and the air in the sunspace was not sent to the air conditioning room. After 20 June, the air conditioning was turned on (dehumidification, the air conditioning temperature was set at 27 °C) and the outside window of the sunspace was opened.
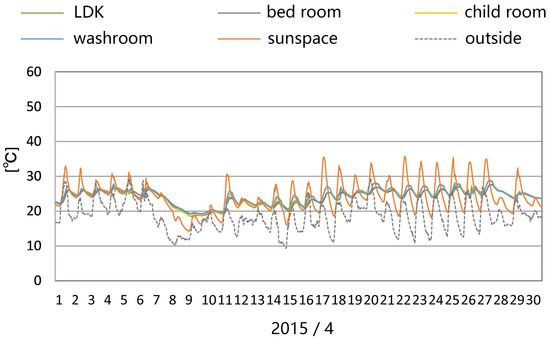
Figure 11.
Each room temperature and outdoor air temperature (April).
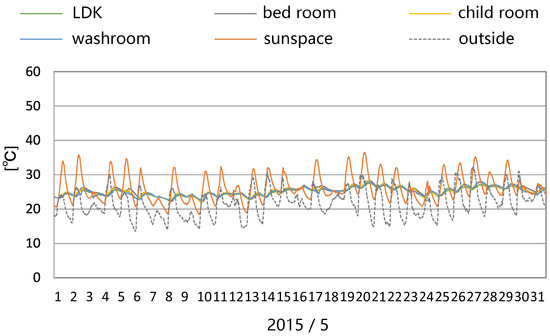
Figure 12.
Each room temperature and outdoor air temperature (May).
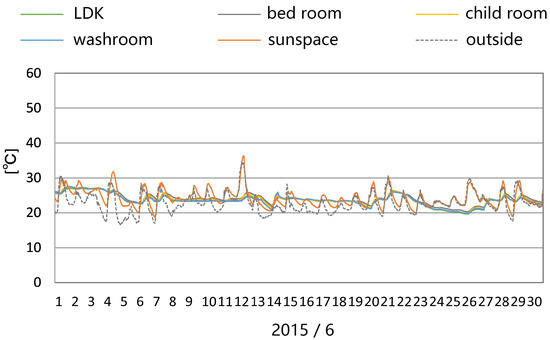
Figure 13.
Each room temperature and outdoor air temperature (June).
In April and May, the temperature in the sunspace did not exceed 40 °C and the temperature difference between daytime and nighttime in the sunspace was not large. This is because the outdoor temperature rose and the amount of incident solar radiation decreased. From April to May, about 60% of the days in the sunspace have a temperature of more than 30 °C, which is 10% lower than in winter. In April and May, the solar altitude became larger and the amount of solar radiation was less than in winter. In April and May, the proportion of days in which the sunspace temperature was over 24 °C (the control temperature when the air in the sunspace is sent to the air conditioning room) was 48% and 71%, respectively. Compared with winter, the proportion increased. It can be concluded that as the outside air temperature rises, the temperature in the sunspace rises as a whole.
From 1 to 19 June, the difference between the temperature in the sunspace and the outdoor air temperature was small, although the outside windows of the sunspace were closed. This is because outside temperatures rise and the amount of incident solar radiation was less than in winter. In addition, it was the rainy season, which has many rainy days and there was not enough radiation to increase the sunspace temperature. However, there was a small difference between the sunspace temperature and the outside temperature, which indicates that the night temperature drops less. This confirms that the heat accumulated during the day is stored in the sunspace.
In all rooms, the proportion of days in which temperatures exceeded 20 °C was 91% in April, 100% in May and 97% in June. From 6 to 10 April (cloudy or rainy), the outdoor air temperature was low and the temperature in the sunspace was less than 20 °C. On 24 to 27 June, the room temperature was lower than the outside air temperature. It is considered that the set temperature of dehumidification was lowered. From 1 to 26 April (the air conditioning was turned off), even if the outdoor temperature was lower than 20 °C, each room was kept comfortable only by sending the heat from the sunspace to the air conditioning room. Therefore, in the intermediate period, the use of a combination of the sunspace and the central air circulation system can maintain the thermal environment of each room.
Figure 14 and Figure 15 show the temperature of each room, the temperature of the outside air and solar radiation. On sunny days, owing to the large temperature difference between daytime and nighttime and the large amount of solar radiation during the daytime, the temperature difference between daytime and nighttime in the sunspace was relatively large. The difference on 26 April was 14.4 °C. On 25 and 26 April, the air in the sunspace was sent to the air conditioning room and the temperature in each room fluctuated greatly. On 27 April, the temperature in each room moderately changed because the air in the sunspace was not sent to the air conditioning room. When the amount of solar radiation is relatively small on a rainy day, the temperature difference in the sunspace is relatively small. The difference on 4 April was 6.2 °C. When the temperature in the sunspace was lower than 24 °C, the air in the sunspace was not sent to the air conditioning room, so the central air conditioning machine could keep the temperature of each room at a constant temperature and the temperature rose as the outdoor air temperature rose. However, even on rainy days, the temperature in the sunspace exceeded 24 °C. It can be concluded that the heat in the sunspace can be used during the intermediate period.
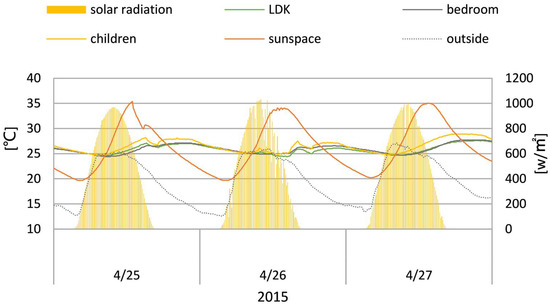
Figure 14.
Each room and outdoor air temperature and solar radiation (three sunny days in April).
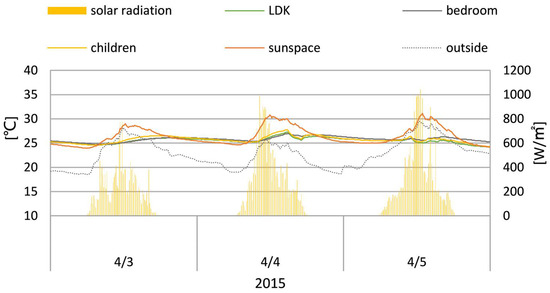
Figure 15.
Each room and outdoor air temperature and solar radiation (three rainy days in April).
3.3. Analysis of Thermal Environment in Summer
Figure 16, Figure 17, Figure 18 and Figure 19 show the temperature of each room and the temperature of the outside air. From 1 to 23 July, the air conditioning with dehumidification function was turned on (the air conditioning temperature was set at 27 °C) and the outside window of the sunspace was opened. From 23 August to 16 October, the air conditioning was turned on (cooling, the air conditioning temperature was set at 26 °C) and the outside window of the sunspace was closed. At this time, the air in the sunspace was sent to the air conditioning room only during the time when the temperature in the sunroom was lower than 24 °C. From 17 to 30 October, the air conditioning was turned off and the air in the sunspace was sent to the air conditioning room when the temperature in the sunspace exceeded 24 °C. From 23 to 31 August, September and 1 to 16 October, the ratio of temperatures below 24 °C in the sunspace was 0%, 8% and 1%, respectively.
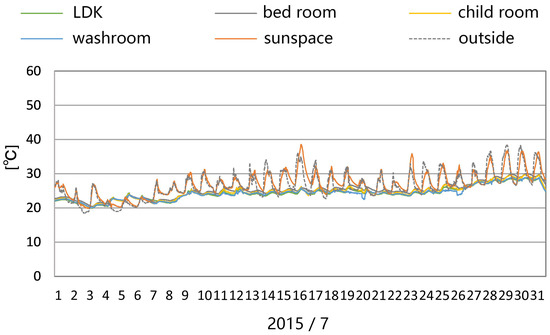
Figure 16.
Each room temperature and outdoor air temperature (July).
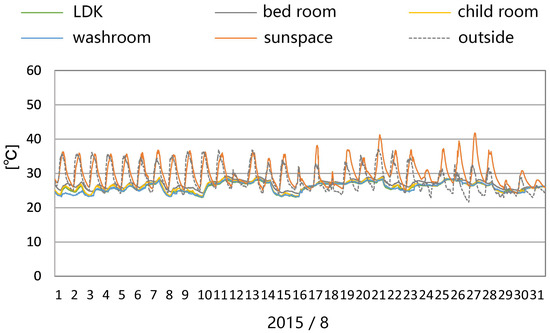
Figure 17.
Each room temperature and outdoor air temperature (August).
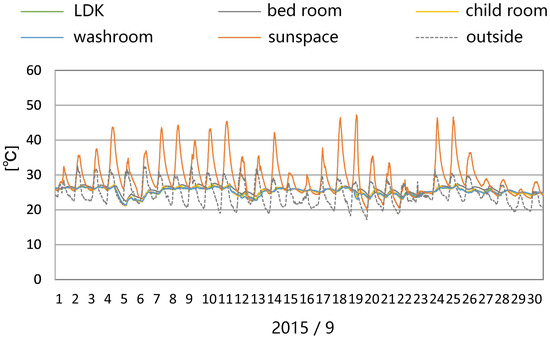
Figure 18.
Each room temperature and outdoor air temperature (September).
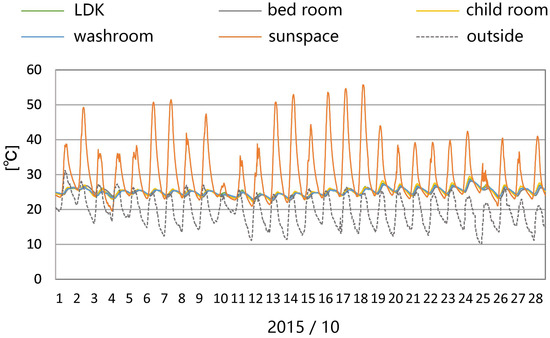
Figure 19.
Each room temperature and outdoor air temperature (October).
Figure 20 and Figure 21 show the temperature of each room, the temperature of the outside air and solar radiation. In summer, the outer window of the sunspace was opened, so the outdoor air temperature and the sunspace temperature show similar values. On sunny days, the outdoor air temperature reached around 35 °C while the temperature in each room was maintained at around 25 °C. On sunny days, the temperature difference in each room was affected by solar radiation but the temperature difference in each room on 4 August was 3.1 °C. It can be concluded that the central air conditioning system effectively improved indoor comfort. During the rainy days from 4 to 5 July, the outside temperature was declining and the temperature in each room was rising. The air conditioner was in the dehumidification mode and the temperature of each room was close to the air conditioner’s set temperature by dehumidifying the 20 °C humid air by heating.
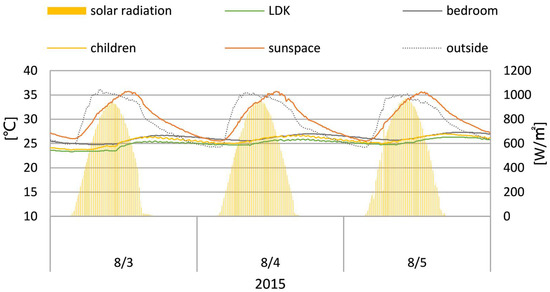
Figure 20.
Each room and outdoor air temperature and solar radiation (3 sunny days in August).
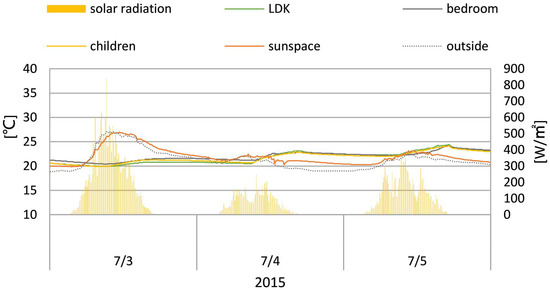
Figure 21.
Each room and outdoor air temperature and solar radiation (three rainy days in July).
3.4. Simulation Model Validation and Energy Performance of a Sunspace
In order to verify the model by experiment, the measured meteorological data of Miyazaki was configured as a data input file of the simulation program based on the state of the demonstration house. The time step was ten minutes. The experiment was carried out with air conditioning all day. The air was sent to the central air conditioning room from a sunspace only when the temperature inside the sunspace was above 24 °C. The air circulation between the sunspace and the central air conditioning room was 500 m3/h. Figure 22 shows a comparison of simulated temperature and monitored temperature for the LDK (living/dining/kitchen) and the sunspace. The fact that the simulated temperatures roughly match the actual ones confirms that the simulation software is highly accurate.
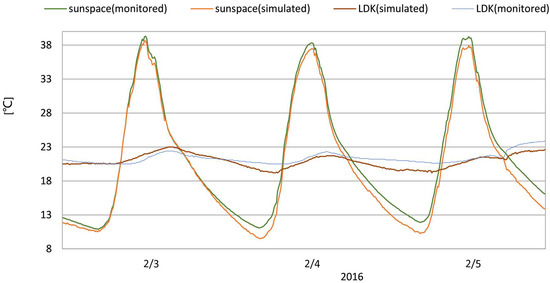
Figure 22.
Monitored and simulated temperatures.
Simulation studies were conducted during all-day air conditioning. In January and February, the central air conditioning was set at 24 °C and was set at 22 °C in November, December, March and April. The air was sent to the central air conditioning room from a sunspace only when the temperature inside the sunspace was above 24 °C. The air circulation between the sunspace and central air conditioning room was 560 m3/h. The air circulation between each room and central air conditioning room was 840 m3/h for the LDK (living/dining/kitchen), 560 m3/h for the children’s room and the bedroom and 150 m3/h for the others. In all-day air conditioning, the annual heating loads of a house without a sunspace and a house with a sunspace was 14.82 GJ and 13.02 GJ, respectively. Compared to a house without a sunspace, a house with a sunspace can save about 12.2% of energy (Figure 23).
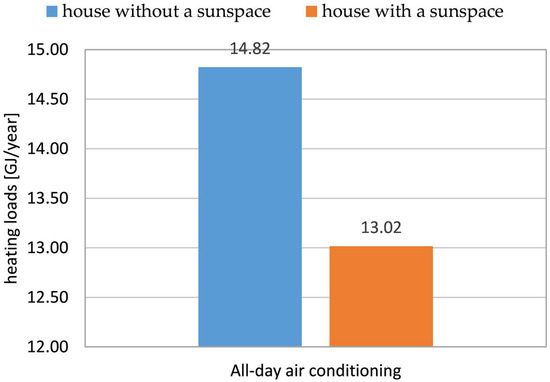
Figure 23.
Annual heating load.
4. Conclusions
A field study survey was conducted in this paper to investigate the thermal performance of a sunspace attached to a house with a central air conditioning and air circulation system. The main conclusions are as follows:
- (1)
- In winter, when the air conditioning temperature was set to 22 °C, the temperature of each room were maintained at 20 °C by the central air conditioning even in the lowest outdoor air temperature. When the solar radiation was sufficient, the temperature inside the sunspace was 40 °C or higher, so we can confirm that sunspace is effective in collecting heat. On sunny days, when the air in the sunspace was sent to the air conditioning room, the temperature in the sunspace dropped slightly and the temperature was kept high. Therefore, it is necessary to consider ways to further use the heat inside the sunspace, such as adding additional thermal storage in the sunspace. Compared to a house without a sunspace, a house with a sunspace can save about 12.2% of energy.
- (2)
- In the intermediate period, the air conditioner was turned off and the temperature of each room was maintained by sending the heat from the sunspace to the air conditioning room. In addition, in May, although the nighttime outdoor air temperature was lower than 20 °C, the air conditioning was turned off and the air in the sunspace was not sent to the air conditioning room but each room was at a comfortable temperature (22 °C~28 °C). That’s because the high insulation performance of the house prevented the temperature from falling.
- (3)
- In summer, each room was kept at a comfortable temperature (25 °C~28 °C) by opening the outside window of the sunspace and turning on the air conditioning. Owing to the high thermal insulation of the house, outdoor air had little effect on the cooler indoor air.
- (4)
- During the days and nights of the whole year, the temperature of each room will change with the change of outdoor air temperature and solar radiation and be kept at a comfortable temperature. In addition, as a result of the influence of solar radiation, there is a certain temperature difference between the north and south and the east and west rooms (±3 °C). It can be concluded that the central air conditioning and air circulation system can adjust the comfort quickly and efficiently.
For future work, it is recommended that the storage materials (floors and walls), the optimum thickness of the sunspace and the optimal fan speed are studied.
Author Contributions
Qingsong Ma, Hiroatsu Fukuda and Takumi Kobatake conceived and designed the experiments; Qingsong Ma and Hiroatsu Fukuda performed the experiments; Qingsong Ma and Hiroatsu Fukuda analyzed the data; Akihito Ozaki, Yuko Kuma and Myonghyang Lee contributed materials; Qingsong Ma and Xindong Wei wrote the paper.
Acknowledgments
This study was in part carried out under the Technology Development for the Application of Solar Energy in Housing Project at NEDO (New Energy and Industrial Technology Development Organization). We are deeply grateful for the considerable contributions made by everyone at the FH Alliance and Ai Home, Inc. The authors would like to express their gratitude to Midori Inoue and Yohei Hama (The University of Kitakyushu) for their contributions.
Conflicts of Interest
The authors declare no conflict of interest
References
- Lee, H.; Ozaki, A.; Lee, M. Energy saving effect of air circulation heat storage system using natural energy. Build. Environ. 2017, 124, 104–117. [Google Scholar] [CrossRef]
- Liu, Y.W.; Feng, W. Integrating passive cooling and solar techniques into the existing building in South China. In Advanced Materials Research; Trans Tech Publ.: Zürich, Switzerland, 2012; pp. 3717–3720. [Google Scholar]
- Naboni, E.; Malcangi, A.; Zhang, Y.; Barzon, F. Defining The Energy Saving Potential of Architectural Design. Energy Procedia 2015, 83, 140–146. [Google Scholar] [CrossRef]
- Koyunbaba, B.K.; Yilmaz, Z. The comparison of Trombe wall systems with single glass, double glass and PV panels. Renew. Energy 2012, 45, 111–118. [Google Scholar] [CrossRef]
- Fiaschi, D.; Bertolli, A. Design and exergy analysis of solar roofs: A viable solution with esthetic appeal to collect solar heat. Renew. Energy 2012, 46, 60–71. [Google Scholar] [CrossRef]
- Zhai, X.Q.; Song, Z.P.; Wang, R.Z. A review for the applications of solar chimneys in buildings. Renew. Sustain. Energy Rev. 2011, 15, 3757–3767. [Google Scholar] [CrossRef]
- Ulpiani, G.; Giuliani, D.; Romagnoli, A.; di Perna, C. Experimental monitoring of a sunspace applied to a NZEB mock-up: Assessing and comparing the energy benefits of different configurations. Energy Build. 2017, 152, 194–215. [Google Scholar] [CrossRef]
- Oliveti, G.; De Simone, M.; Ruffolo, S. Evaluation of the absorption coefficient for solar radiation in sunspaces and windowed rooms. Solar Energy 2008, 82, 212–219. [Google Scholar] [CrossRef]
- Oliveti, G.; Simona, M.; Ruffolo, S. Solar contribution evaluation for building attached sunspace in the Mediterranean climate. In Proceedings of the International Conference Passive and Low Energy Cooling for the Built Environment, Santorini, Greece, 19–21 May 2005. [Google Scholar]
- Oliveti, G.; Arcuri, N.; De Simone, M.; Bruno, R. Solar heat gains and operative temperature in attached sunspaces. Renew. Energy 2012, 39, 241–249. [Google Scholar] [CrossRef]
- Monge-Barrio, A.; Sánchez-Ostiz, A. Energy efficiency and thermal behaviour of attached sunspaces, in the residential architecture in Spain. Summer Conditions. Energy Build. 2015, 108, 244–256. [Google Scholar] [CrossRef]
- Bastien, D.; Athienitis, A.K. Passive thermal energy storage, part 2: Design methodology for solaria and greenhouses. Renew. Energy 2017, 103, 537–560. [Google Scholar] [CrossRef]
- Babaee, F.; Fayaz, R.; Sarshar, M. The optimum design of sunspaces in apartment blocks in cold climate. Arch. Sci. Rev. 2016, 59, 239–253. [Google Scholar] [CrossRef]
- Chiesa, G.; Simonetti, M.; Ballada, G. Potential of attached sunspaces in winter season comparing different technological choices in Central and Southern Europe. Energy Build. 2017, 138, 377–395. [Google Scholar] [CrossRef]
- Lu, S.; Tong, H.; Pang, B. Study on the coupling heating system of floor radiation and sunspace based on energy storage technology. Energy Build. 2018, 159, 441–453. [Google Scholar] [CrossRef]
- Sánchez-Ostiz, A.; Monge-Barrio, A.; Domingo-Irigoyen, S.; González-Martínez, P. Design and experimental study of an industrialized sunspace with solar heat storage. Energy Build. 2014, 80, 231–246. [Google Scholar] [CrossRef]
- Bataineh, K.M.; Fayez, N. Analysis of thermal performance of building attached sunspace. Energy Build. 2011, 43, 1863–1868. [Google Scholar] [CrossRef]
- Mottard, J.-M.; Fissore, A. Thermal simulation of an attached sunspace and its experimental validation. Solar Energy 2007, 81, 305–315. [Google Scholar] [CrossRef]
- Rempel, A.R.; Rempel, A.W.; Cashman, K.V.; Gates, K.N.; Page, C.J.; Shaw, B. Interpretation of passive solar field data with EnergyPlus models: UN-conventional wisdom from four sunspaces in Eugene, Oregon. Build. Environ. 2013, 60, 158–172. [Google Scholar] [CrossRef]
- Rempel, A.R.; Rempel, A.W.; Gates, K.R.; Shaw, B. Climate-responsive thermal mass design for Pacific Northwest sunspaces. Renew. Energy 2016, 85, 981–993. [Google Scholar] [CrossRef]
- Ozaki, A.; Watanabe, T.; Takase, S. Simulation software of the hydrothermal environment of buildings based on detailed thermodynamic models. In Proceedings of the eSim 2004 Canadian Conference on Building Energy Simulation, Vancouver, BC, Canada, 13–14 June 2004; pp. 45–54. [Google Scholar]
- CRECER What Is the Comfortable Temperature and Humidity? Available online: http://www.crecer.jp/Q-A/HTML/A-11.html (accessed on 30 January 2017).
© 2018 by the authors. Licensee MDPI, Basel, Switzerland. This article is an open access article distributed under the terms and conditions of the Creative Commons Attribution (CC BY) license (http://creativecommons.org/licenses/by/4.0/).