Abstract
Both sorting on public goods and tastes for segregation contribute to the persistence of segregation in America. Incorporating Schelling’s (1969, 1971) concept of “neighborhood tipping” into a two-stage equilibrium sorting model, in which both neighborhood demographic composition and public goods (e.g., environmental quality) affect households’ residential location choice, this study investigates how preferences for neighborhood demographic composition could obscure the role of exogenous public goods on segregation. The results reveal that non-white households face higher level of exposure to air pollution, suggesting the presence of environmental injustice in Franklin County, OH. Using a counterfactual scenario of switching off heterogeneous taste for environmental quality, this study identifies that sorting on Toxic Release Inventory (TRI) emissions drives little correlations between emissions and demographics. However, when taste parameters of the interactions between neighborhood demographic composition and household race are eliminated, segregation (as measured by over-exposure to households of the same race) of black and white households decreases by 7.63% and 16.36%, respectively, and own-race neighbor preferences contribute to segregation differently according to household income. These results may help explain some recent puzzles in the relationship between environmental quality and demographics.
1. Introduction
Racial inequality and residential segregation, which play an important role in social sustainability, remain a significant social concern in the United States. Segregation leads to vastly unequal neighborhoods, with minority households (especially African American) living in socioeconomically-and environmentally-disadvantaged neighborhoods. Addressing this important topic, researchers have investigated the social mechanisms driving segregation. In the economics literature, the most influential explanatory frameworks are Tiebout-type models and Schelling-type social interaction models [1]. After Tiebout’s [2] seminal work suggesting that households move into the community that maximizes their utility with regard to taxes and bundle of local public goods, researchers have shown how sorting on public goods can result in segregation. The association of an unequal ability to pay for public goods, and varying patterns of preferences leads to the segregation of similar households across different neighborhoods [3,4,5]. Schelling-type social interaction models follow Schelling’s [6,7] “spatial proximity model”, which specified a spatial setup in which households care about the ethnic or social composition of their own local neighborhood [8]. From this perspective, economists examined the role of preferences for neighborhood racial composition (tastes for segregation/integration), and showed that the dynamics of neighborhood “tipping” can force segregated outcomes—wherein white households flee neighborhoods once they became majority minorities [9,10].
Although demonstrated in the existing literature that both sorting on public goods and preferences for segregation/integration contribute to the persistence of segregation, studies of sorting on public goods have tended to ignore the potential role of sorting over endogenous demographics while studies of racial interaction have tended to ignore the potential role of sorting over public goods and other locational amenities. On the one hand, when making residential choices, minority households may face different constraints and have different preferences than white households. These different constraints and preferences may interact with localized environmental amenities/disamenities, leading to disproportionate exposure to various environmental hazards by minorities in residential housing choices [7,8]. On the other hand, reducing environmental inequality between races may actually increase segregation, since wealthier minority households no longer need to live in white-dominated neighborhoods to take advantage of high-level environmental quality. Considering both the roles of public goods sorting and tastes for segregation, this study aims: (1) to examine the relationship between location-specific environmental amenities/disamenities and racial and socioeconomic characteristics; and (2) to investigate different roles of heterogeneous preferences for public goods (environmental quality) and tastes for segregation in driving current segregation patterns. A good understanding of segregation mechanisms will be helpful to achieve social equity and cohesion through public policies.
This study advances the literature in two ways. Firstly, a structural model, other than the Difference-in-Difference models applied by Banzhaf and Walsh [3] and Gamper-Rabindran et al. [9], is employed in this study. Incorporating Schelling’s [10,11] idea of “neighborhood tipping” into a two-stage equilibrium sorting model, both neighborhood demographic composition and location-specific environmental quality affect households’ residential location decision. The second contribution of this study is to use counterfactual simulations to examine the extent to which heterogeneous preferences for environmental quality and tastes for segregation drive current segregation patterns. There is an abundance of evidence indicating that communities with fewer socioeconomic resources and those with higher proportions of minority households are more likely to be subject to greater environmental burdens [3,12,13,14,15]. Based on this fact, if one considers only sorting on public goods, improving environmental quality of the dirty neighborhoods should reduce segregation. However, the opposite may also be true if segregation is driven more by demographic tastes than by preferences for public goods. This study explores the correlation between toxic emissions presented in the Toxic Release Inventory (TRI) and the demographic composition of Franklin County, Ohio. Starting with a realistic specification of household preferences that produce the existing pattern of residential sorting, this study simulates counterfactual changes in taste for environmental quality and own-race neighbor preference, tracing the impact of these changes on racial segregation.
The empirical analysis of this study reveals that non-white households face higher level of exposure to air pollution confirms issues of environmental injustice. Employing Bayer et al. [16] exposure rate measures, our counterfactual simulation results show that heterogeneous taste for neighborhood TRI emissions has little effect on racial segregation. However, when additionally turning off heterogeneous tastes for neighborhood demographic composition, the segregation (as measured by the over-exposure to households of the same race) of black and white households decreases by 7.63% and 16.36%, respectively, and own-race neighbor preference contributes to segregation differently according to household income. These results may help explain some recent puzzles in the relationship between environmental quality and demographics. For example, Greenstone and Gallagher [11] found that Superfund clean-ups are associated with economically small and statistically indistinguishable from zero local changes in residential property values, property rental rates, housing supply, total population, and the types of individuals living near the sites. Gamper-Rabindran et al. [12] showed that cleaning up a dirty neighborhood leads to not only increases in population density and housing unit density and increases in mean household income and shares of college-educated, but also to increases in the shares of minorities. Banzhaf and Walsh [13] found that investments in low-public good communities can actually increase segregation. The rest of this study is organized as follows: Section 2 focuses on a brief literature review; Section 3 presents our model of sorting over both exogenous public goods and endogenous demographics; Section 4 describes data and techniques used to create neighborhood level variables; Section 5 discusses the estimation results based on a two-stage sorting model; and Section 6 is the conclusion.
2. Literature Review
This study follows three strands of literature: the role of public goods sorting on segregation, impact of demographic tastes on segregation, and institutional/political discrimination-induced segregation. After Tiebout’s [2] seminal paper, empirical Tiebout sorting models became one of the important tools to analyze the relationship between location choices and household preferences for local public goods. The basic idea of Tiebout sorting is that households face many communities offering different levels of public goods. As households sort to choose their most preferred community, their demands for public goods are revealed. Applications of the sorting model framework in the previous literature mainly focused on the household residential location choice as bounded among a set of possible alternatives by households. These alternatives are often defined by structural characteristics of a house and the neighborhood attributes associated with each house. Bayer et al. [14] developed a discrete choice model incorporating moving cost to examine the impact of air quality on metropolitan areas throughout the US during 1990 and 2000. They innovatively used pollution from distant point sources as instrumental variables to deal with the endogeneity between air pollution and unobservable local characteristics. Using a rich dataset spanning 17 years of home sales in the Twin Cities area of Minnesota, Klaiber and Phaneuf [15] analyzed how open space amenities affected households’ residential location choices applying a horizontal sorting model. To capture the variation across space and time, which was neglected in the sorting model framework, Klaiber and Phaneuf defined housing type by location, size and time. From the sorting model estimates, they found that heterogeneity across types of open space and across households was shown to be a critical determinant of the welfare impacts of the clean water, land, and legacy constitutional amendments.
Sorting on public goods has also been used to investigate the impact of public goods sorting on demographic composition and racial inequality. Following Tiebout’s sorting model, Banzhaf and Walsh [5] examined impacts of changes in exogenous public goods on local community demographics, and the results provided strong empirical support for the notion that households “vote with their feet” in response to changes in environmental quality. Bayer et al. [16] found that increased educational attainment of blacks relative to whites in a city between 1990 and 2000 led to a significant rise in segregation, especially for older blacks, and to a marked increase in the number of middle-class black communities. Their research showed that these community measures intended to increase welfare could actually result in increased segregation. This is important because many policies being discussed in current American political spheres are aimed to decrease racial inequality. Since 1990, activists, academics, and policymakers have devoted great efforts to “environmental equity”, and produced an extensive and sophisticated literature on the dimensions of differential environmental risks on the basis of race and socioeconomic class position [17,18,19,20,21,22]. Mohai and Bryant [22] performed a meta-analysis of 16 empirical studies on race and class disparities in the distribution of environmental hazards, all of which found environmental disparities that were based on either race or income or both. Therefore, cleaning up local disamenities may lead to further racially-based segregation, which may result in negative outcomes for racially targeted policies aimed to encourage racial equality through integration, since minority households no longer need to join white neighborhood to take advantage of higher socioeconomic status. In the context of sorting over public goods, Banzhafand Walsh [13] evaluated policy remedies that involved place-based investments in minority communities for reducing group inequity, and showed that investments in low-public good communities could actually increase segregation.
The second strand literature followed by this study is studies of how demographic tastes affect segregation. Racial inequity and residential segregation has been interesting topics for researchers over a long period. Schelling [6,7] showed that “neighborhood tipping” can generate segregated outcomes. Pancs et al. [8] examined the robustness of Schelling’s model, and found that, even if all individual agents had a strict preferences for perfect integration, best-response dynamics would still lead to segregation. More recently, Caetano and Maheshri [9] developed a method to empirically implement the Schelling model of segregation to study racial segregation. The results showed substantial heterogeneity in the existence and locations of tipping points and stable equilibria.
In addition to the role of sorting over public goods and tastes for segregation in driving racial segregation, researchers also investigated the extent to which racial segregation can be blamed on past discriminatory policies [23,24,25]. Glaeser and Vigdor [25] indicated that, in the 1940s, discrimination by realtors and lenders was legal, and in fact effectively encouraged by Federal mortgage insurance underwriting policies. Restrictive covenants were legal, and groups of whites terrorized blacks who moved into white communities. It was also found in a number of studies that durably segregated black neighborhoods are the product of pre-Civil Rights apartheid created by housing and urban development policies [26,27,28].To solve problems of racial segregation from a political/institutional perspective, place-based, people-based, and indirect policies are introduced by policy makers [29]. However, the effectiveness of these policies is doubtful. For example, the place-based policies aiming to improve amenities in black neighborhoods often lead to increases in local housing prices. At the new prices, existing residents may no longer be able to afford to live in the neighborhood, so that a black neighborhood may simply convert into a white neighborhood, rather than becoming an integrated area [30,31].
Although much research so far has focused on the forces driving segregation, studies of how sorting on public goods alone drives segregation ignore the potential role of tastes for neighborhood demographic composition, while studies of demographic tastes on segregation ignore the role of sorting over public goods. Therefore, to explore the social mechanisms underlying the correlation between public goods (particularly toxic emissions from TRI facilities) and local demographics, this paper advances these three strands of literature through incorporating endogenous demographics in a two-stage equilibrium sorting model, which is primarily designed to study sorting over exogenous public goods. The equilibrium sorting model applied in our study closely follows the one developed by Bayer et al. [32,33].
3. Empirical Methodology
3.1. Conceptual Model
This section describes a two-stage equilibrium sorting model that links neighborhood demographic composition, public goods, and residential location choices. The sorting model begins with the simple assumptions that the quantity and types of housing characteristics and public goods vary across locations, and households choose a particular housing type to maximize household utility. Housing type is characterized by both the vector of structural housing characteristics, , and the vector of location specific neighborhood attributes, . To show that demographic composition is determined in equilibrium, this study considers it separately from other neighborhood characteristics, denoted as . The neighborhood attribute of this study, i.e., TRI emissions, is included in the neighborhood attribute vector, denoted by . Each household chooses the dwelling location from a set of housing types , which is defined by location in this study. Let denote the price of housing type ; then, the explicit indirect utility function form is defined as:
where represents the indirect utility of household choosing housing type ; denotes the unobserved attributes of the housing type , which is valued the same by all households; is the idiosyncratic error term; and , and are parameters to be estimated.
Defining each parameter associated with housing and neighborhood characteristics, neighborhood demographics, and price as , for , then can be decomposed as a mean parameter common across all households and an individual-specific component that varies with a household’s observable characteristics, and the function of the household taste for attribute is given as:
where Q is the number of household characteristics and denotes the characteristic of household . This specification of the sorting model has two advantages. Firstly, households are not required to have the same preference ordering across locations, and their preferences are allowed to vary over each choice characteristic. The other advantage is the parameter for heterogeneity of preferences for neighborhood demographic composition determines the role of demographic tastes on segregation. In Equation (2), the household characteristics could also be interacted with house price, but this study assumes a homogenous price parameter to simplify the counterfactual simulation.
To estimate the locational equilibrium, it is assumed that the idiosyncratic error term is identically and independently distributed and has a Type I Extreme Value distribution. Given this assumption, the probability household select housing type can be calculated and is denoted here as . Using these probabilities, the predicted aggregated demand for housing type is obtained by integrating the choice probabilities over the sample population:
The market clearing condition implies that the demand for houses of type must be equal to the supply of such houses, and then we have:
Given the indirect utility defined in Equation (1) and a fixed set of housing and neighborhood attributes, Bayer et al. [34] showed that a unique set of prices clears the market.
3.2. Econometric Implementation
Estimation of the model follows a two-step strategy. In the first step, estimates are derived for household preference parameters and the alternative-specific tastes parameters while in the second step the mean taste parameters are recovered. Before proceeding to the second step of the estimation strategy, Equation (2) is substituted into Equation (1) as:
where
and
In Equations (5)–(7), defines variables common to all the households regardless of their characteristics and defines variables unique to households which arise from differences in their observed characteristics. With this expression of the indirect utility function, the first stage estimation recovers the alternative-specific constant, , and the household-specific taste parameters in via maximum likelihood estimation (MLE). With any combination of heterogeneous parameters in and the alternative-specific constant, , the probability that each household chooses housing type can be predicted. First stage estimates are contingent on assumptions that is identically and independently distributed and has a Type I Extreme Value distribution. Then, the conditional logit probability of household choosing housing type is defined as:
The log-likelihood for the household choices is defined as:
where is a dummy variable that equals 1 if household chooses housing type , and 0 otherwise. The first stage estimation procedure aims to search parameters of and the vector of mean indirect utilities to maximize .
However, when the choice set is large, like in this paper, the estimation of the conditional Logit model is computationally restrictive. Following McFadden [35,36] to address the independence of irrelevant alternatives problems associated with the logit specification, the estimation is simplified using a subset of non-chosen alternatives for each household along with the chosen alternative in order to estimate the household specific taste parameters. To get estimates of mean taste parameters, one for each housing type, a proposed contraction mapping by Berry [37] is used. The mean taste parameters derived from this method is consistent with the MLE.
In the second stage, the mean indirect utility estimated in the first stage is decomposed into observable and unobservable components, as shown in Equation (6). Price endogeneity is a problem that needs to be addressed before moving forward—that is, housing price is likely to be correlated with housing and neighborhood characteristics that are not observed in the data. To solve this endogeneity issue, a set of proper instruments for prices should be applied and estimated in the second stage. Following Bayer et al. [32], this study creates instruments for prices based on the spatial foundations of the housing market in that house prices in a given neighborhood are affected not only by the attributes of the neighborhood itself, but may also be correlated with the features of distant neighborhoods. Since the attributes of neighborhoods at a reasonable distance from a particular neighborhood can affect equilibrium prices but not utility, the exogenous features of these distant neighborhoods may be good instruments for prices. Two steps are applied to construct the instrumental variables.
The first step is to rearrange Equation (6) by moving the price to the left-hand side of the equation:
where denotes mean indirect utility for housing type , and other variables are defined the same as before. Then, a plausible value for needs to be approximated, which is denoted as and a vector containing attributes of distant neighborhoods within 1-, 2-, 3-, 4-, and 5-mile radius rings around location of housing type are added to the equation. The new equation is expressed as:
where the tildes indicate the inclusion of distant neighborhood attributes. With these new variables, Equation (12) is estimated using ordinary least square (OLS). By setting the OLS residual, , to zero, the instrument for housing price is obtained:
To eliminate the dependence of the instrument on the initial value of , this study applies the strategy introduced by by Klaiber [15]. This strategy involves approximating the initial value of , then using the first estimates of and running the regression with this variable as an instrument for price to get the new price coefficient. Replacement of this coefficient with the initial value and estimating the equation with the second value of should be repeated until the price coefficient stabilizes.
3.3. Counterfactual Segregation Analysis
To explore the effects of preferences for environmental quality and neighborhood demographic composition on segregation, counterfactual simulations are carried out in this study. The core idea of the simulation is to compare “observed” distribution of households with the “counterfactual” scenarios in terms of segregation level.
The counterfactual simulations are conducted by switching off the heterogeneous preferences for toxic emissions and neighborhood demographic composition. Under this new counterfactual environment, the probability of households’ choices of each housing type can be calculated, and the choices can be aggregated to the neighborhood level to predict the new demographic composition of the neighborhood. The predicted neighborhood demographic composition is expressed in terms of the probability that each household observed in the data chooses each house type in that neighborhood. The contribution of household made to the demographic composition of neighborhood is:
The initial neighborhood demographic composition is then replaced by the predicted demographic composition. The degree of residential segregation can be described from various dimensions, such as evenness, exposure, concentration, centralization, and clustering [38]. This study examines the dimension of “exposure”, following the definition of Bayer et al. [34]. To construct exposure rate, calculations by neighborhood are made to determine the fraction of households in each of the race categories that reside in the same neighborhood as a given household. The average exposure, , of households of race to households of race are expressed as:
where is a dummy variable which equals 1 if household is of race , and represents the fraction of households of race in household ’s neighborhood.
4. Data Sources
4.1. Neighborhood Attributes
This study draws on the census block group (CBG) to approximate residential neighborhoods, and all the CBGs make up the choice set of neighborhoods. Each neighborhood is characterized by sociodemographic composition and the level of public goods. For demographic composition, this study only focuses on neighborhood racial composition. Other neighborhood attributes include school-district quality, and environmental quality. School-district quality is measured by a ranking score which is calculated based on test scores released by the Ohio Department of Education. The area of interest in this study is Franklin County, OH as it has the 29th largest black population in the US (Source: 2010-2014 American Community Survey 5-Year Estimates), while being fairly highly segregated with a white–black dissimilarity index of 66.9 compared to a high of 87.9 and a low 31.7 among all US cities (Source: William H. Frey and Dowell Myers’ analysis of Census 2000; and the Social Science Data Analysis Network). Figure 1 shows neighborhood racial change from 2000 to 2016 in Franklin County, in which the 2000 CBG boundary shapefile is used. For CBGs with changing boundaries between 2000 and 2016, a share of each demographic count is assigned to CBGs based on the percentage of the 2016 CBGs’ geographic area lying within each 2000 CBG. According to changes in racial composition, this study classifies all CBGs into seven categories: Steady (261 CBGs), white rise and black decline (68 CBGs), White rise and other races decline (26 CBGs), Black rise and white decline (229 CBGs), Black rise and other races decline (17 CBGs), Other races rise and white decline (213 CBGs), and Other races rise and black decline (69 CBGs). For those categories marked “Steady”, the proportion change of each race in the neighborhood is less than 5% throughout the study period. For those mixed categories of one rise and one decline, it means that the majority demographic has risen at least 5%, while a secondary demographic has declined at least 5%. As can be seen in Figure 1, the eastern half of the county is in much greater flux than the western half, and most of the areas are marked as “Black rise and white decline” and “Other races rise and white decline”, indicating that there are far more CBGs with a growing non-white population than there are with a growing white population. Therefore, the idea of whites moving into neighborhoods and displacing residents is not a major issue in Franklin County. It is important to notice from the racial change in Franklin County that about half of its CBGs (442 CBGs) experienced a decline of white residents, and now have fairly large shares of non-white residents. This contradicts the notion that many anti-segregation policies encourage white households to move into non-white neighborhood. What are the reasons for this racial change? Sorting on public goods or tastes for neighborhood demographic? Does this racial change lead to residential segregation? Answers to these questions will provide policy implications for the integration of Franklin County, OH.
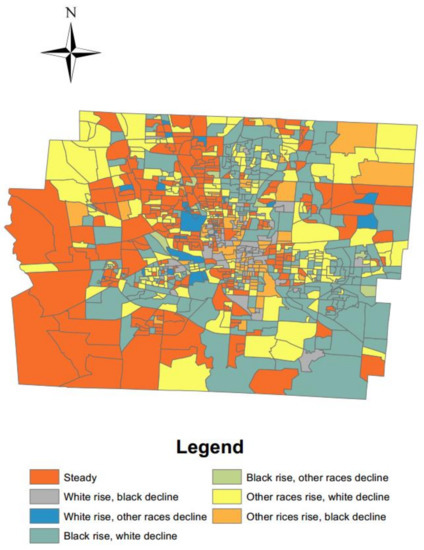
Figure 1.
Franklin county neighborhood racial change, 2000–2016.
The interest of this study is to investigate the correlation between environmental quality and neighborhood demographic composition (environmental justice), and how changes in heterogeneous preferences for local environmental quality and neighborhood demographic composition will lead to change in segregation patterns. Following the existing environmental justice literature [39,40,41], environmental quality in this study is measured by toxic emissions at firms from Environmental Protection Agency’s (EPA) TRI. The TRI Program was created in 1986 to track the management of certain toxic chemicals that are emitted by industrial facilities and may pose a threat to human health and the environment. The advantages of this dataset are: (1) The TRI program provides rich information on quantities, types, and release pathways (air, water, off-site, etc.) of approximately 650 toxic substances, and covers a wide range of industry sectors. The information collected and presented has provided a way for households to better understand possible sources of pollution in their communities. Since many toxic pollutants are known or suspected to cause serious health effects, the availability of this information would affect households’ neighborhood choice; (2) Most importantly, the EPA also gives the spatial coordinates, latitude and longitude, of each facility. Using this geographic information enables the assigning of environmental quality data to each neighborhood. The assumption of this study is made that toxic chemicals released from the TRI facilities only affect neighborhoods within 0.25 miles (alternatively 0.5 miles) from the facility. Following Banzhaf and Walsh [5,13], this study constructs 0.25-mile (alternatively 0.5-mile) buffers around each TRI facility, representing the pollutant area. Release levels are assigned to neighborhoods based on the percentage of the pollutant geographic area lying within each community. Considering the correlation between populations and TRI emissions (i.e. neighborhoods with larger population size have more manufacturing facilities and thus higher TRI emissions), the TRI emissions are weighted by population size during the estimation.
Issues using TRI data include: (1) EPA only requires facilities that use or produce more than the threshold amount of listed toxic substances to report releases, and facilities may go in and out of reporting even while continually emitting toxic chemicals; and (2) the list of toxic substances has expanded over time to include more industries and chemicals. To reduce the amount of informative misleading caused by these problems, this study uses a three-year lagged average and keeps every facility that reported toxic emissions to the EPA between 2007 and 2009 for the year 2010. Using a three-year lagged average toxic emission amount for each facility, this paper can represent sufficient release level data that include all 67 TRI facilities. In addition, some other limitations to consider are the assumption that information about environmental and neighborhood amenities provided by the TRI dataset influence household behavior. This assumption is substantiated by previous studies. For example, applying a series of hedonic property value models, Asadoorian [42] showed that citizens were aware and concerned about TRI sites nearest to their homes. Recent studies by Sanders [43] and Mastromonaco [44] also found that listing an existing firm in the TRI lowered housing prices, and housing market participants did internalize information provided by TRI dataset into prices. Next, pollution areas are defined arbitrarily as a set of 0.25-mile radius circles and the estimation results may be sensitive to the defined size. To control for this, a sensitivity analysis replicates the steps of the equilibrium sorting model using 0.5-mile radius buffer zones instead of 0.25-mile radius buffers.
4.2. Household and Housing Characteristics
The housing data used in this study include single-family residential real estate transaction data between 2006 and 2010from Franklin County, Ohio. The property transaction data provide transaction records for residential properties located in Franklin County. Each record includes the property’s address, transaction price and the structural characteristics of the house. The structural characteristics used in this study include the number of bedrooms, age of structure, central air conditioner, and fireplace. Each transaction is assigned to a neighborhood based on its geographic location. After organizing the data, there are 43,252 transaction records in the dataset.
Although providing a comprehensive set of housing characteristics and precise location for each house, these housing transaction data do not include information about the households occupying the houses. The absence of individual household data makes researchers applying sorting models confront a tradeoff between spatial resolution of variables and the ability to observe individual household characteristics. In this study, household characteristics are approximated using census block (CB) and CBG level data from 2010 census. Individual household income and household size, and whether have children in family are approximated at CBG level (household income data for each block group in 2010 are obtained from 2007–2011 American Community Survey 5-year estimate). Household race is approximated at CB level, and is divided into three categories: white, black and other races. To assign a race to each householder, this study assumes that population is uniformly distributed. If the percentage of white population in the block is higher than that in the total sample, then all the householders in this block are white. The same logic is used to define households of black and other races. The measurement error from approximating individual household characteristics by assigning block and block group aggregates may have implications for the efficiency and consistency of the estimates. For efficiency, the loss of variation across households will result in lost precision in first-stage estimates, as the assignment process reduces the variability in these demographic variables. However, to address the efficiency issue, a large sample size increases variability within the full sample dataset, resulting in consistent first stage estimates. Since the unobserved attribute is subsumed into during estimation, the second stage population average parameter estimates should be consistent in any case [15]. Dropping neighborhoods, which are defined by the census block groups, with no single family housing transaction records, our sample contains 848 neighborhoods.
The household, housing, and neighborhood characteristics based on pollution status summary statistics are shown in Table 1. For household characteristics, Table 1 shows that non-white households with lower income and lower educational attainment are more likely to live in the neighborhoods with TRI emissions. As to neighborhood characteristics, the table indicates that 92 (10.8% of the total sample) neighborhoods are exposed to TRI toxic emissions, and neighborhoods exposed to TRI toxic releases have larger non-white population than neighborhoods with no release exposure. The summary statistics for housing attributes show that house prices in the polluted neighborhoods are lower than houses in the neighborhoods without pollution.

Table 1.
Summary statistics for key variables.
5. Estimation Results
5.1. First Stage Estimation Results
Using the dataset created above, this study explores the correlation between TRI toxic emissions and racial segregation, and how tastes for endogenous demographics blur the role of exogenous public goods on segregation. Primary results focus on estimations using 0.25-mile radius buffer around TRI facilities. The model regressed in this study is a two-stage equilibrium sorting model, in which the first stage estimation recovers the household-specific taste parameters as well as a vector of mean indirect utilities for each neighborhood. In specifying the model, a limited set of interactions is included between household characteristics and neighborhood attributes to conserve the estimation’s degrees of freedom and limit potential problems of collinearity. The first stage estimation results using the specified interactions of household characteristics with housing and neighborhood attributes are shown in Table 2.
Table 2.
Sorting model estimation results—first-stage estimation.
Coefficients of interactions from the first stage indicate variation in the households’ preferences for specific housing and neighborhood characteristics of their housing choice. The interest of the first-stage estimation is the signs rather than the magnitude of the coefficients. Signs for Coefficients of interactions are all as expected, and statistically significant. More specifically, the a priori expectations concerning interactions of household specific characteristics with levels of TRI releases, and with neighborhood demographic composition are as expected. A positive coefficient for interactions of blacks and other races with TRI emissions indicates that households of black and other races have an increased likelihood of choosing neighborhoods with increased TRI emissions than whites. The negative coefficient for the interaction of household income with emission level is interpreted as, if households’ observed income increases, there is a decreasing likelihood of those households to choose housing in neighborhoods exposed to pollution. These results are consistent with previous studies [45,46] that non-white households are more likely to sort into neighborhoods with higher toxic release levels, and relatively wealthy households are more able to afford access to environmentally superior neighborhoods, confirming that TRI emissions do enter households’ residential location decision making [5]. As communities exist with various levels of TRI emissions, interactions from the first-stage estimation describe households’ heterogeneous preferences for neighborhood environmental quality. The interactions of household race with neighborhood demographic composition (race “White” is dropped in the regression to avoid collinearity) implies that households prefer living in a closer spatial proximity to households of the same race as themselves. The negative coefficient for the interaction between black households and “Percent Census Block Group other races” indicates that, compared with neighbors of other races, black households are more prone to live with white neighbors. Similarly, compared with black neighbors, households of other races are more likely to select white neighbors. Looking at interactions of household income with neighborhood demographic composition, the negative coefficients imply that, while controlling for all the other factors, an increase in household income will decrease the likelihood of choosing a neighborhood with a higher proportion of non-white population. The coefficient of interaction between householder’s educational attainment and neighborhood demographic composition shows that households with higher educational attainment are less likely to select neighborhoods with higher percentage of non-white population. The first-stage estimation confirms the heterogeneity in preferences for both neighborhood public goods and demographic composition.
Other interactions of household characteristics with housing and neighborhood characteristics include the interaction between household size and number of bedrooms, the interaction of whether have children in family with school-district ranking score, and interaction of householders’ educational attainment with the school-district ranking score. In accordance with previous studies [15,47], larger households prefer larger houses. The coefficient for the interaction of households have children with the school-district ranking score is positive, indicating households with children care more about school quality. A positive coefficient for interactions of householder’s educational attainment with school-district ranking score indicates that highly educated households are more inclined to choose neighborhoods with higher school quality.
5.2. Second Stage Estimation Results
Using the estimation results of the mean utility from the first stage estimation as dependent variables, the second stage estimation can be implemented. As shown in Equation (10), there may be a correlation between housing prices and unobserved housing/neighborhood characteristics in the second stage estimation. For example, two identical houses in neighborhood of identical quality may have different prices, depending on how they are situated compared with other houses in nearby communities. To solve this endogeneity problem, following Bayer et al. [32], an instrumental variable is introduced in the second stage, which is created based on Equations (11) and (12). The auxiliary regression includes the same variables as those estimated in the second stage for the 1-, 2-, 3-, 4-, and 5-mile rings around each neighborhood centroid. With this instrument in place an IV regression of Equation (10) is run and the results are reported in Table 3.
Table 3.
Sorting model estimation results—second-stage estimation.
Parameters estimated in the second stage returned the mean preferences for housing and neighborhood characteristics. Table 3 shows that the price coefficient is negative and statistically significant, which means that houses with higher price result in lower utility ceteris paribus. Houses with more bedrooms and equipped with fireplaces and central air conditioning are more preferred, while older houses provide lower utility. Of particular interest for this study are the coefficients for TRI emission variables and neighborhood demographic composition (Percent Census Block Group black and Percent Census Block Group other races) in the second stage. The expected negative and significant coefficients for TRI emissions are obtained, which is consistent with previous literature finding that TRI facilities lower nearby housing values [44]. The negative coefficients for the variables of “Percent Census Block Group Black” and “Percent Census Block Group Other Races” indicating that neighborhoods with higher percentages of non-white population are less attractive than neighborhoods composed mostly of white residents. Sensitivity analysis is used to check the robustness of results from Table 2 and Table 3. An alternative definition of the toxic release exposure variable is tested using 0.5-mile radius buffer around each TRI reported facility instead of 0.25-mile. The estimation process is then replicated. As shown in Table A1, though the magnitude of the coefficients related to TRI emissions from the sensitivity analysis is bigger, the qualitative nature of the results does not change with the new specification.
5.3. Simulation Results
The results of our sorting model reveal that preferences for environmental quality and own-race neighbors might drive residential segregation among households according to race. The disutility associated with environmental hazards is likely to cause households to move to neighborhoods with lower levels of environmental hazards, resulting in excess housing supply in neighborhoods with higher levels of environmental hazard exposure, with an overall decrease of housing prices. Thus, households (such as low-income black households) that put priority of house price over environmental safety would move to neighborhoods with increased environmental hazards, resulting in potential housing segregation and public good (e.g., clean air) inequality. In addition, sorting over endogenous demographics could also drive segregation. Persistent racial residential segregation is often considered as the result of whites preferring to live with whites while blacks wish to live near many other blacks [48].
To explore the relationship between residential segregation and household preferences for environmental quality and neighborhood demographics, a counterfactual simulation is conducted by switching off heterogeneous preference for TRI emissions and preferences for self-segregation. In the simulation, this study assumes that households’ preferences over TRI emissions and neighborhood demographic composition do not change with household race and thus taste parameters of interactions between neighborhood TRI release and neighborhood demographic composition with household race are turned off. While the probabilities that each neighborhood is selected as a result of households change in response to the two counterfactual scenarios, the corresponding predicted demographic composition is calculated to replace the initial composition applying these probabilities. Since the sorting model itself does not perfectly predict the location choices each household makes, it is important to point out that the neighborhood sociodemographic measures initially estimated by the model will not match the observed sociodemographic composition of each neighborhood. Therefore, before calculating the predicted demographic compositions for each simulation scenario, this study first solved for the initial estimation error associated with each neighborhood, and added this initial prediction error to the sociodemographic measures calculated in each counterfactual scenario. Using the new neighborhood demographic composition, the degree of neighborhood racial segregation, which is measured by own-race exposure rate following the definition of Bayer et al. (2004), is calculated. To construct own-race exposure rate, calculations by neighborhood are made by determining the fraction of households in the three different race categories that reside in the same neighborhood as the household of interest, and averages are then created for these neighborhoods over all households of a given race. The sorting model results show that households with different income differ in preferences for TRI emissions and neighborhood demographic composition. Therefore, the own-race over-exposure rate by income quantiles summarized to investigate the different effects of TRI emissions and demographic composition on racial segregation among different income classes.
The counterfactual simulation results summarized in Table 4 describe effects of preferences for exogenous TRI emission and endogenous demographic composition on shaping the extent of neighborhood residential segregation by reporting three sets of exposure rate: (1) observed own-race exposure rate; (2) simulated own-race exposure rate by switching off only heterogeneous preference for TRI emissions with respect to race; and (3) the simulated own-race exposure rate by switching off both TRI emissions and same-race neighbor preferences. The main purpose of the simulation analysis is the comparison between the observed and both simulated segregation patterns. The overall neighborhood racial composition of Franklin County is 67.35% white, 23.92% black and 8.73% other races. Table 4A reports the observed race exposure rates in the sample. Taking black households as an example, these measures imply that black households in Franklin County live in communities comprised of 41.00% white, 50.76% black and 8.23% other races on average. Comparing the measured exposure rates to the racial composition of the whole sample—67.35% white, 23.92% black and 8.73% other races—there is obvious evidence that black households live in communities with approximately two times the fraction of black households than would be found if they were uniformly distributed across the study area. The majority of the additional fraction of black households in communities in which black households live is offset by a decrease of white households. The remaining race exposure rates indicate that households of each race living with households of same race in proportion, are higher than the proportion for the entirety of Franklin County.
Table 4.
Simulation Results of Race Exposure Rates.
Table 4B shows the counterfactual exposure rates of eliminating heterogeneous tastes for TRI emissions. Differences between the simulated and observed own-race over-exposure rate in the last column of Table 4 show that own-race over-exposure rates changed little, indicating that differences in neighborhood TRI emissions have a modest effect on neighborhood demographics. The slight increase in black residential segregation in this simulation scenario suggests that cleaning up all the dirty neighborhoods will not alleviate the residential segregation of black households. Therefore, the current residential segregation pattern is driven more by other factors (e.g., own-race neighbor preference) than the TRI emissions. To investigate further, another counterfactual simulation is conducted, during which both heterogeneous tastes for TRI emission with respect to race and own-race neighbor preferences are switched off. Results are reported in Table 4C. When additionally turning off taste parameters of the interactions of neighborhood demographic composition with household race, the segregation (as measured by the over-exposure to households of the same race) of black household and white households decreases by 7.63% and 16.36%, respectively, while own-race over-exposure rate of other races changes slightly. Compared with Table 4B, changes of exposure rates reported in Table 4C are much larger than those reported in Table 4B, indicating that segregation is driven more by demographic tastes than by tastes for exogenous environmental quality.
Intuitively, if neighborhoods segregation is driven by differences in the TRI release level, cleaning up polluted neighborhoods would reduce segregation, and our results show that sorting on TRI emissions drive little correlation between emissions and demographics. However, changes in TRI emissions could trigger sorting on demographics based on income level. Since higher income minorities do not need to join white neighborhoods to enjoy higher levels of public goods, they select to live in a closer spatial proximity to households of the same race with themselves. To test whether effects of heterogeneous tastes for TRI emissions and demographic composition on racial segregation vary according to household income level, Table 5 reports the own-race over-exposure rate based on income quantiles. Table 5A shows that white households are more segregated in higher income groups, while black households are more segregated in lower income groups. For households of other races, this study finds that 1st and 4th income quantiles are the most segregated groups. When turning off heterogeneous preference for TRI emissions, slight changes are found in own-race over-exposure rates for white and other other-race households of different income quantiles. However, segregation of black households in the 3rd and 4th income quantiles increases by 2.81% and 3.49%, respectively, which confirms that changes of TRI release levels could trigger segregation of black households with higher income. Table 5C shows that the effects of heterogeneous tastes for TRI emissions with respect to race and own-race neighbor preferences on racial segregation are different according to income level. Compared with Table 4B, the own-race over-exposure rates decrease most in the 4th income quantile for the white households, but decrease most in the 1st income quantile for black households. The segregation pattern of other-race households in all four income groups changes slightly. The analysis results reveal a more significant role of own-race neighbor preference in residential racial segregation dynamics, and this preference contributes to segregation differently according to household income.
Table 5.
Simulation Results of Own-Race Over-Exposure Rates by Income Quantile.
Racial residential segregation has been a continuous issue in American society, which may attribute to the combination of sorting over public goods and preferences over neighborhood demographic composition. Segregation holds a longstanding position as one of the prime suspects in explaining the persistent inequality between blacks and whites, such as increases rates of black poverty and overall black–white income disparities [49]. However, consistent with previous research findings that investments in low-public good communities have no effect on or can actually increase segregation [4,13], the simulation results show that public goods, such as neighborhood environmental quality, make little contribution to racial segregation, and current racial distribution patterns are driven more by neighborhood demographic preference. These findings imply that, to reduce racial segregation, by making investments in public goods, other factors such as own-race preference should also be considered when making segregation-reducing policies.
6. Conclusions
Tiebout stylized models describe the distribution of public goods across different demographic groups, and how changes in public goods drive sorting over neighborhood demographics. However, Tiebout models have tended to ignore the role of sorting over endogenous demographics on segregation. Following the idea of a two-stage equilibrium sorting model, this paper argues that both sorting on exogenous public goods and endogenous sorting on demographics can drive segregation, using Franklin County, Ohio as the study area.
The two-stage equilibrium sorting model used in this paper allows households’ preferences for housing and neighborhood characteristics to vary with households’ characteristics, with the first stage estimation recovering household-specific taste parameters. Results from first stage estimation indicate that non-white households are more likely to sort into neighborhood with higher TRI emissions, and households with lower income are also more likely to choose houses exposed to increased toxic releases. Coefficients for interactions of household race with neighborhood demographic composition indicate that households prefer to live close to households of same race as themselves.
To shed light on the role of heterogeneous tastes for public goods and endogenous demographics on shaping the extent of segregation, two counterfactual scenarios are designed: (1) simulated own-race exposure rate by switching off only heterogeneous preference for TRI emissions with respect to race; and (2) simulated own-race exposure rate by switching off both heterogeneous taste for TRI emissions and own-race preferences. The counterfactual simulations of this study show that, although sorting on TRI emissions drive correlations between emissions with demographics, the effect is limited. In particular, since there is little reason to sort on exogenous public goods, improving public good levels in disadvantaged neighborhood in Franklin County may not decrease segregation. Residents who sort into neighborhoods with lower environmental quality place high priority on low-cost housing compared to environmental quality. Improving environmental quality may lead to increases in housing prices, and poor residents have to move to neighborhood with lower housing prices—for example, by moving to neighborhoods with higher proportion of minorities, which leads to greater segregation. However, a more significant role of own-race neighbor preference in residential racial segregation dynamics is revealed, and this preference contributes to segregation differently according to household income. A video experiment carried out by Krysan et al. [48] showed that, net of social class, neighborhood racial composition significantly influence households’ neighborhood preferences, which is consistent with findings of this study.
Regarding the racial change in Franklin County from 2000 to 2016, results of this study have two implications. First, finding that non-white households face higher levels of exposure to air pollution confirms issues of environmental injustice, and highlight the need for strategies to reduce race disparities in environmental hazard exposure. Second, place-based anti-segregation policies may pose a dilemma for Franklin County. The goal of place-based policies is either to improve the housing stock or exogenous public goods in black neighborhoods to encourage white households to move in or to create affordable housing options that allow black households to move into white neighborhoods. Figure 1 shows that there are far fewer CBGs with a growing white population than there are with a growing non-white population, suggesting policies aiming to improve exogenous public goods in underserved neighborhoods have not effectively attracted white population. On the contrary, policies such as increasing affordable housing options in predominantly white neighborhoods may decrease segregation, as Figure 1 shows that about half of the CBGs experienced a rise of non-white population. However, Figure 1 also shows that CBGs with a growing non-white population also experienced a decline of white population, which can be explained by Schelling’s “Neighborhood Tipping”. Tipping refers to a process in which entrance of a few members of a minority into a neighborhood causes some among the formerly homogeneous population to leave, leading to severe segregation. The result that own-race preference plays a more important role in driving segregation confirms the tipping effect.
Limitations of this analysis include using a limited set of neighborhood characteristics for the reason of data accessibility and aggregation of neighborhood level data as a proxy for household composition. Future research should include a comprehensive set of neighborhood and individual attributes to overcome the shortcomings of the present study. Moreover, this paper assumes that all households are fully informed about neighborhood disamenities caused by TRI releases, and further research should take an effort to distinguish between informed and uninformed households.
Acknowledgments
This study was financially supported by Natural Science Foundation of China (71503181).
Author Contributions
Zhaohua Zhang and Diane Hite developed the idea and reviewed the article. Zhaohua Zhang and Derrick Robinson analyzed the results and wrote the manuscript. All authors read and approved the final manuscript.
Conflicts of Interest
The authors declare no conflict of interest.
Appendix A
Table A1.
Sensitivity Test Results of the Sorting Model Estimation with 0.5-mile Radius Buffers around each TRI Facility.
Table A1.
Sensitivity Test Results of the Sorting Model Estimation with 0.5-mile Radius Buffers around each TRI Facility.
| Estimate | Std. Err. | |
|---|---|---|
| Interaction parameters from first stage estimation | ||
| Household Size ×Number of Bedrooms | 0.001 | 0.016 |
| Children in Family× School-district Ranking Score | 0.737 *** | 0.035 |
| Educational Attainment × School-district Ranking Score | 0.173 *** | 0.031 |
| Educational Attainment× Percent Black | −0.754 *** | 0.065 |
| Educational Attainment × Percent Other Races | −4.015 *** | 0.213 |
| Black × Percent Black | 7.085 *** | 0.057 |
| Black × Percent Other Races | −3.461 *** | 0.221 |
| Other Races × Percent Other Races | 1.965 *** | 0.020 |
| Other Races × Percent Black | −0.177 ** | 0.066 |
| Black × TRI Release | 0.590 *** | 0.052 |
| Other Races × TRI Release | 0.041 * | 0.054 |
| Household Income × TRI Release | −0.157 *** | 0.016 |
| Household Income × Percent Black | −0.868 *** | 0.012 |
| Household Income × Percent Other Races | −1.094 *** | 0.028 |
| Second-stage IV estimation results | ||
| House price ($10,000) | −0.403 *** | 0.012 |
| Number of Bedrooms | 2.410 *** | 0.088 |
| Fire Place | 1.559 *** | 0.066 |
| House Age | −0.718 *** | 0.024 |
| Air Conditioner | 1.064 *** | 0.059 |
| TRI Release | −0.684 *** | 0.129 |
| Percent Black population | −3.341 *** | 0.121 |
| Percent Other race population | −2.492 *** | 0.377 |
| School-district Ranking Score | 3.361 *** | 0.138 |
Note: This table reports the estimation results of the two-stage sorting model defining 0.5-mile radius buffers as the TRI pollutant areas. To avoid collinearity, race “white” is dropped in the estimation. The second-stage is estimated using IV method. The instrumental variables for house price are created based on attributes of distant neighborhoods within 1-, 2-, 3-, 4-, and 5-mile rings around each location. *** indicates statistical significance at 1% level; ** indicates statistical significance at 5% percent level; * indicates statistical significance at 10% percent level.
References
- Schaeffer, Y.; Cremer-Schulte, D.; Tartiu, C.; Tivadar, M. Natural amenity-driven segregation: Evidence from location choices in French metropolitan areas. Ecol. Econ. 2016, 130, 37–52. [Google Scholar] [CrossRef]
- Tiebout, C.M. A pure theory of local expenditures. J. Polit. Econ. 1956, 64, 416–424. [Google Scholar] [CrossRef]
- Epple, D.; Romer, T.; Sieg, H. Interjurisdictional Sorting and Majority Rule: An Empirical Analysis. Econometrica 2001, 69, 1437–1465. [Google Scholar] [CrossRef]
- Gamper Rabindran, B.S.; Timmins, C.; Banzhaf, S.; Walsh, R.P. Hazardous Waste Cleanup, Neighborhood Gentrification, and Environmental Justice: Evidence from Restricted Access Census Block Data. Am. Econ. Rev. 2011, 101, 620–624. [Google Scholar] [CrossRef]
- Banzhaf, H.S.; Walsh, P.R. Do People Vote with Their Feet? An Empirical Test of Tiebout. Am. Econ. Rev. 2008, 98, 843–863. [Google Scholar] [CrossRef]
- Schelling, T.C. Models of Segregation. Am. Econ. Rev. 1969, 59, 488–493. [Google Scholar]
- Schelling, T.C. Dynamic models of segregation. J. Math. Sociol. 1971, 1, 143–186. [Google Scholar] [CrossRef]
- Pancs, R.; Vriend, N.J.; Mary, Q.; Equilibria, M.N. Schelling’s Spatial Proximity Model of Segregation. J. Public Econ. 2007, 91, 1–24. [Google Scholar] [CrossRef]
- Caetano, G.; Maheshri, V. School segregation and the identification of tipping behavior. J. Public Econ. 2017, 148, 115–135. [Google Scholar] [CrossRef]
- Card, D.; Mas, A.; Rothstein, J. Tipping and the Dynamics of Segregation. Q. J. Econ. 2008, 123, 177–218. [Google Scholar] [CrossRef]
- Greenstone, M.; Gallagher, J. Does Hazardous Waste Matter? Evidence from the Housing Market and the Superfund Program. Q. J. Econ. 2008, 123, 951–1003. [Google Scholar] [CrossRef]
- Gamper-Rabindran, S.; Timmins, C. Does cleanup of hazardous waste sites raise housing values? Evidence of spatially localized benefits. J. Environ. Econ. Manage. 2013, 65, 345–360. [Google Scholar] [CrossRef]
- Banzhaf, H.S.; Walsh, R.P. Segregation and Tiebout sorting: The link between place-based investments and neighborhood tipping. J. Urban Econ. 2013, 74, 83–98. [Google Scholar] [CrossRef]
- Bayer, P.; Keohane, N.; Timmins, C. Migration and Hedonic Valuation: The Case of Air Quality. J. Environ. Econ. Manage. 2009, 58, 1–14. [Google Scholar] [CrossRef]
- Klaiber, A.H.; Phaneuf, D.J. Valuing Open Space in A Residential Sorting Model of the Twin Cities. J. Environ. Econ. Manage. 2010, 60, 57–77. [Google Scholar] [CrossRef]
- Bayer, P.; Fang, H.; McMillan, R. Separate when equal? Racial inequality and residential segregation. J. Urban Econ. 2014, 82, 32–48. [Google Scholar] [CrossRef]
- Hite, D. Environmental Equity. Growth Change 2000, 31, 40–58. [Google Scholar] [CrossRef]
- Ringquist, E.J. Assessing Evidence of Environmental Inequities: A Meta-Analysis. Soc. Polit. Anal. Manag. 2005, 24, 223–247. [Google Scholar] [CrossRef]
- Booth, J.M.; Teixeira, S.; Zuberi, A.; Wallace, J.M. Barrios, ghettos, and residential racial composition: Examining the racial makeup of neighborhood profiles and their relationship to self-rated health. Soc. Sci. Res. 2018, 69, 19–33. [Google Scholar] [CrossRef] [PubMed]
- Mohai, P.; Pellow, D.; Roberts, J.T. Environmental Justice. Annu. Rev. Environ. Resour. 2009, 34, 405–430. [Google Scholar] [CrossRef]
- Kravitz-Wirtz, N.; Crowder, K.; Hajat, A.; Sass, V. The Long-Term Dynamics of Racial/Ethnic Inequality in Neighborhood Air Pollution Exposure, 1990-2009. Du. Bois. Rev. 2016, 13, 237–259. [Google Scholar] [CrossRef] [PubMed]
- Mohai, P.; Bryant, B. Environmental Racism: Reviewing the Evidence. In Race and the Incidence of Environmental Hazards: A Time for Discourse; Westview Press: Boulder, CO, USA, 1992. [Google Scholar]
- Bader, M.; Warkentien, S. The Fragmented Evolution of Racial Integration since the Civil Rights Movement. Sociol. Sci. 2016, 3, 135–164. [Google Scholar] [CrossRef]
- Spiegel, S. Prison Race Rights: An Easy Case for Segregation. Calif. Law Rev. 2007, 95, 2261–2293. [Google Scholar]
- Glaeser, E.L.; Vigdor, J.L. Racial Segregation in the 2000 Census: Promising News. Brook. Insitution Surv. Ser. 2001, 1–16. [Google Scholar]
- Massey, D.S.; Denton, N.A. American Apartheid Segregation and the Making of the Underclass; Harvard University Press: Cambridge, MA, USA, 1993. [Google Scholar]
- Jackson, K.T. Crabgrass Frontier The Suburbanization of America; Oxford University Press: New York, NY, USA, 1985. [Google Scholar]
- Sugrue, T.J. The Origins of the Urban Crisis: Race and Inequality in Postwar Detroit; Princeton University Press: Princeton, NJ, USA, 1996. [Google Scholar]
- Boustan, L.P. Racial Residential Segregation in American Cities. 2013. Available online: http://www.nber.org/papers/w19045.pdf (accessed on 8 April 2018).
- Kennedy, M.; Leonard, P. Dealing With Neighborhood Change: A Primer on Gentrification and Policy Choices. Brookings Inst. Cent. Urban Metrop. Policy 2001. [Google Scholar]
- Vigdor, J.L. Does Gentrification Harm the Poor? Brookings-whart. Pap. Urban Aff. 2002, 3, 133–182. [Google Scholar] [CrossRef]
- Bayer, P.; Ferreira, F.; McMillan, R. A Unified Framework for Measuring Preferences for Schools and Neighborhoods. J. Polit. Econ. 2007, 115, 588–638. [Google Scholar] [CrossRef]
- Bayer, P.; McMillan, R. Tiebout sorting and neighborhood stratification. J. Public Econ. 2012, 96, 1129–1143. [Google Scholar] [CrossRef]
- Bayer, P.; Robert, M.; Kim, R. An Equilibrium Model of Sorting in An Urban Housing Market. Available online: http://homes.chass.utoronto.ca/~mcmillan/methods.pdf (accessed on 8 April 2018).
- McFadden, D. Modelling the Choice of Residential Location. Transp. Res. Rec. 1978, 672, 72–77. [Google Scholar]
- McFadden, D. Conditional Logit Analysis of Qualitative Choice Behavior; Academic Press: New York, NY, USA, 1973; ISBN 0127761500. [Google Scholar]
- Berry, S.T. Estimating Discrete Choice Models of Product Differentiation. RAND J. Econ. 1994, 25, 242–262. [Google Scholar] [CrossRef]
- Massey, D.S. The Dimensions of Residential Segregation. Soc. Forces 1988, 67, 281–315. [Google Scholar] [CrossRef]
- Wilson, S.M.; Fraser-Rahim, H.; Williams, E.; Zhang, H.; Rice, L.; Svendsen, E.; Abara, W. Assessment of the distribution of toxic release inventory facilities in metropolitan Charleston: An environmental justice case study. Am. J. Public Health 2012, 102, 1974–1980. [Google Scholar] [CrossRef] [PubMed]
- Kalnins, A.; Dowell, G. Community Characteristics and Changes in Toxic Chemical Releases: Does Information Disclosure Affect Environmental Injustice? J. Bus. Ethics 2017, 145, 277–292. [Google Scholar] [CrossRef]
- Johnson, R.; Ramsey-White, K.; Fuller, C.H. Socio-demographic differences in toxic release inventory siting and emissions in metro Atlanta. Int. J. Environ. Res. Public Health 2016, 13. [Google Scholar] [CrossRef] [PubMed]
- Asadoorian, M.O. The Toxic Release Inventory: Public Awareness or Common Ignorance? Interdiscip. Environ. Rev. 2001, 3, 113–131. [Google Scholar] [CrossRef]
- Sanders, N.J. Toxic Assets: How the Housing Market Responds to Environmental Information Shocks. 2012. Available online: http://economics.wm.edu/wp/cwm_wp128.pdf (accessed on 8 April 2018).
- Mastromonaco, R. Do Environmental Right-to-Know Laws Affect Markets? Capitalization of Information in the Toxic Release Inventory. J. Environ. Econ. Manage. 2015, 71, 54–70. [Google Scholar] [CrossRef]
- Fishman, J.; Smith, V.K. Latent Tastes, Incomplete Stratification, and the Plausibility of Vertical Sorting Models. Environ. Resour. Econ. 2017, 66, 339–361. [Google Scholar] [CrossRef]
- Binner, A.; Day, B. How Property Markets Determine Welfare Outcomes: An Equilibrium Sorting Model Analysis of Local Environmental Interventions. Environ. Resour. Econ. 2017. [Google Scholar] [CrossRef]
- Tra, C.I.; Lukemeyer, A.; Neill, H. Evaluating the Welfare Effects of School Quality Improvements: A Residential Sorting Approach. J. Reg. Sci. 2013, 53, 607–630. [Google Scholar] [CrossRef]
- Krysan, M.; Couper, M.P.; Farley, R.; Forman, T. Does Race Matter in Neighborhood Preferences? Results from a Video Experiment. Am. J. Sociol. 2009, 115, 527–559. [Google Scholar] [CrossRef] [PubMed]
- Ananat, E.O. The Wrong Side(s) of the Tracks Estimating the Causal Effects of Racial Segregation on City Outcomes. Am. Econ. J. Appl. Econ. 2011, 3, 34–66. [Google Scholar] [CrossRef]
© 2018 by the authors. Licensee MDPI, Basel, Switzerland. This article is an open access article distributed under the terms and conditions of the Creative Commons Attribution (CC BY) license (http://creativecommons.org/licenses/by/4.0/).