Article

Health Risk Assessment of Heavy Metals in Surface Water near a Uranium Tailing Pond in Jiangxi Province, South China

1
College of Water Resources and Environmental Engineering, East China University of Technology, Nanchang 330013, China
2
Department of Earth Sciences, The University of Hong Kong, Hong Kong, 999077, China
*
Authors to whom correspondence should be addressed.
Sustainability 2018, 10(4), 1113; https://doi.org/10.3390/su10041113
Submission received: 7 March 2018 / Revised: 30 March 2018 / Accepted: 5 April 2018 / Published: 8 April 2018

Abstract

:
This study was performed in the Linshui River Watershed to explore the contents of heavy metals in river water, their species, and health risks. The test results show that the contents of arsenic (As), chromium (Cr), copper (Cu), uranium (U), and thorium (Th) are relatively low and below the limit of class III of the environmental quality standards for surface water. According to the analysis through PHREEQC (version 2.18), the main species of As, Cr, Cu, U, and Th are H2AsO4 and HAsO42−, HCrO4, Cr2O72− and CrO42−, Cu2+, CuSO4 and CuCO3, UO2CO3, (UO2)2CO3(OH)3, and UO2(CO3)22−, Th(OH)4, Th(OH)22+, and Th(OH)3+, respectively. Health risk assessment demonstrates that the average total risk value is 5.68 × 10⁻⁵ year−1, which is higher than the maximum acceptable level of 5.05 × 10⁻⁵ year−1 recommended by International Commission on Radiological Protection (ICRP). Moreover, the average of total radionuclide risk (U and Th) is calculated to be 7.85 × 10⁻⁹ year−1, which is five orders of magnitude lower than the standard value of 5.0 × 10⁻⁴ year−1. The health risk of chemical non-carcinogenic (Cu) is lower than that of chemical carcinogenic (As and Cr). Human health risk values descend in the order of Cr, As, U, Th, and Cu. Therefore, As and Cr in the study area are labeled as the priority pollutants.

1. Introduction

Rivers are of both ecological and economic significances to society [1]. However, river waters are quite vulnerable to pollution because they are naturally open, easily accessible, and substantially used in agricultural, industrial, and municipal processes [2]. China’s per capita arable land area and per capita water resources are less than half and about one quarter of their world average, respectively [3]. Moreover, the drying up of rivers may also lead to food shortage [4]. Meanwhile, rapid urbanization and intensive anthropogenic activities have already brought and will bring a series of water pollution to rivers around the world [5,6]. Therefore, the influences of these water pollutions should be systematically evaluated. Great and continuous endeavors are required to recover the polluted water bodies. Thus, both the government and the public have already realized that most rivers in China are suffering from severe pollution from different sources [7].
As heavy metals are subject to environmental toxicity, abundance, and persistence, the contamination by these metals in the aquatic environment becomes a global concern [8]. In recent years, accelerating exploitation of numerous mines in China has brought many environment problems [9,10,11], especially the contamination of river water caused by an overdose of dissolved metals. Some metals like Cu are crucial for normal body growth, whereas other metals, such as Cr and As, are deemed toxic for human health [12,13]. For instance, Cr is a kind of carcinogenic, mutagenic, and teratogenic heavy metal [14,15]. Cu overdose is a causative factor for brain and kidney damage [16]. U can cause genotoxic carcinogen and cell mutation [17]. Heavy metals released to surface water by mining activities may pose a severe risk to human health via drinking water and bathing. Thus, it is important to assess the health risk of toxic metals in surface water surrounding uranium tailing pond.
With a length of 165 km across four towns and a catchment area of 5151 km2, Linshui River is an important tributary of Fuhe River in Jiangxi Province. A uranium mining plant, located in the upstream of the river, has been in use for more than 60 years. The operation of uranium mining produces wastewater, abandoned rocks, and residues. These contaminants are carried to Linshui River by rainwater, streams, and soil migration, leading to heavy metal pollution to the river water.
The health risk assessment is an efficient method for evaluating the relationship between the environment and people’s health, which can be quantitatively assessed in terms of hazard degree [18]. Recently, Muhammad et al. [19] ascertained potential health risk of heavy metal concentrations to local population and the results revealed that geogenic processes and anthropogenic activities were major sources of water contamination in Kohistan region. Meanwhile, Cherfi et al. [20] demonstrated that irrigation with treated waters can reduce the estimated daily intake and the target hazard quotient for Cu, Zn, Pb, and Cr by more than 85%. Unfortunately, although there are numerous studies that focus on pollution and health risk of heavy metals in drinking water, soil, or sediments [21,22], there are relatively limited studies on health risk of heavy metals in river water, especially for the surface water surrounding uranium tailings ponds [23].
The human health risk of heavy metals and radionuclides is generally subject to chemical carcinogens, chemical non-carcinogens, and radionuclide carcinogen. Chemical toxicity is the ability of a chemical molecule or compound to damage susceptible sites or cells in the human body [24]. Radiotoxicity is through radioactive substances that enter the human body continue to emit multiple rays in the body to cause internal radiation. Recently, although researchers have gradually paid more attention on heavy metal risk assessment over China, limited studies have been conducted to evaluate the human health risk of riverine heavy metals and radionuclides in Jiangxi Province [2,25].
In this study, the health risk assessment of heavy metals and radionuclides for Linshui River was fully investigated. First, the concentrations and characteristics of heavy metals in the river water samples from Linshui River were presented. Second, systematical discussions on the levels of heavy metal and radionuclide with respect to their standards of the United States Environmental Protection Agency (EPA) were made [16]. Finally, the human health risks of these heavy metals and radionuclide via the processes of drinking were assessed. By comparing with the heavy metal tolerable intakes of the EPA, the results of this study will provide a guideline of a potential health risk for local citizens.

2. Materials and Methods
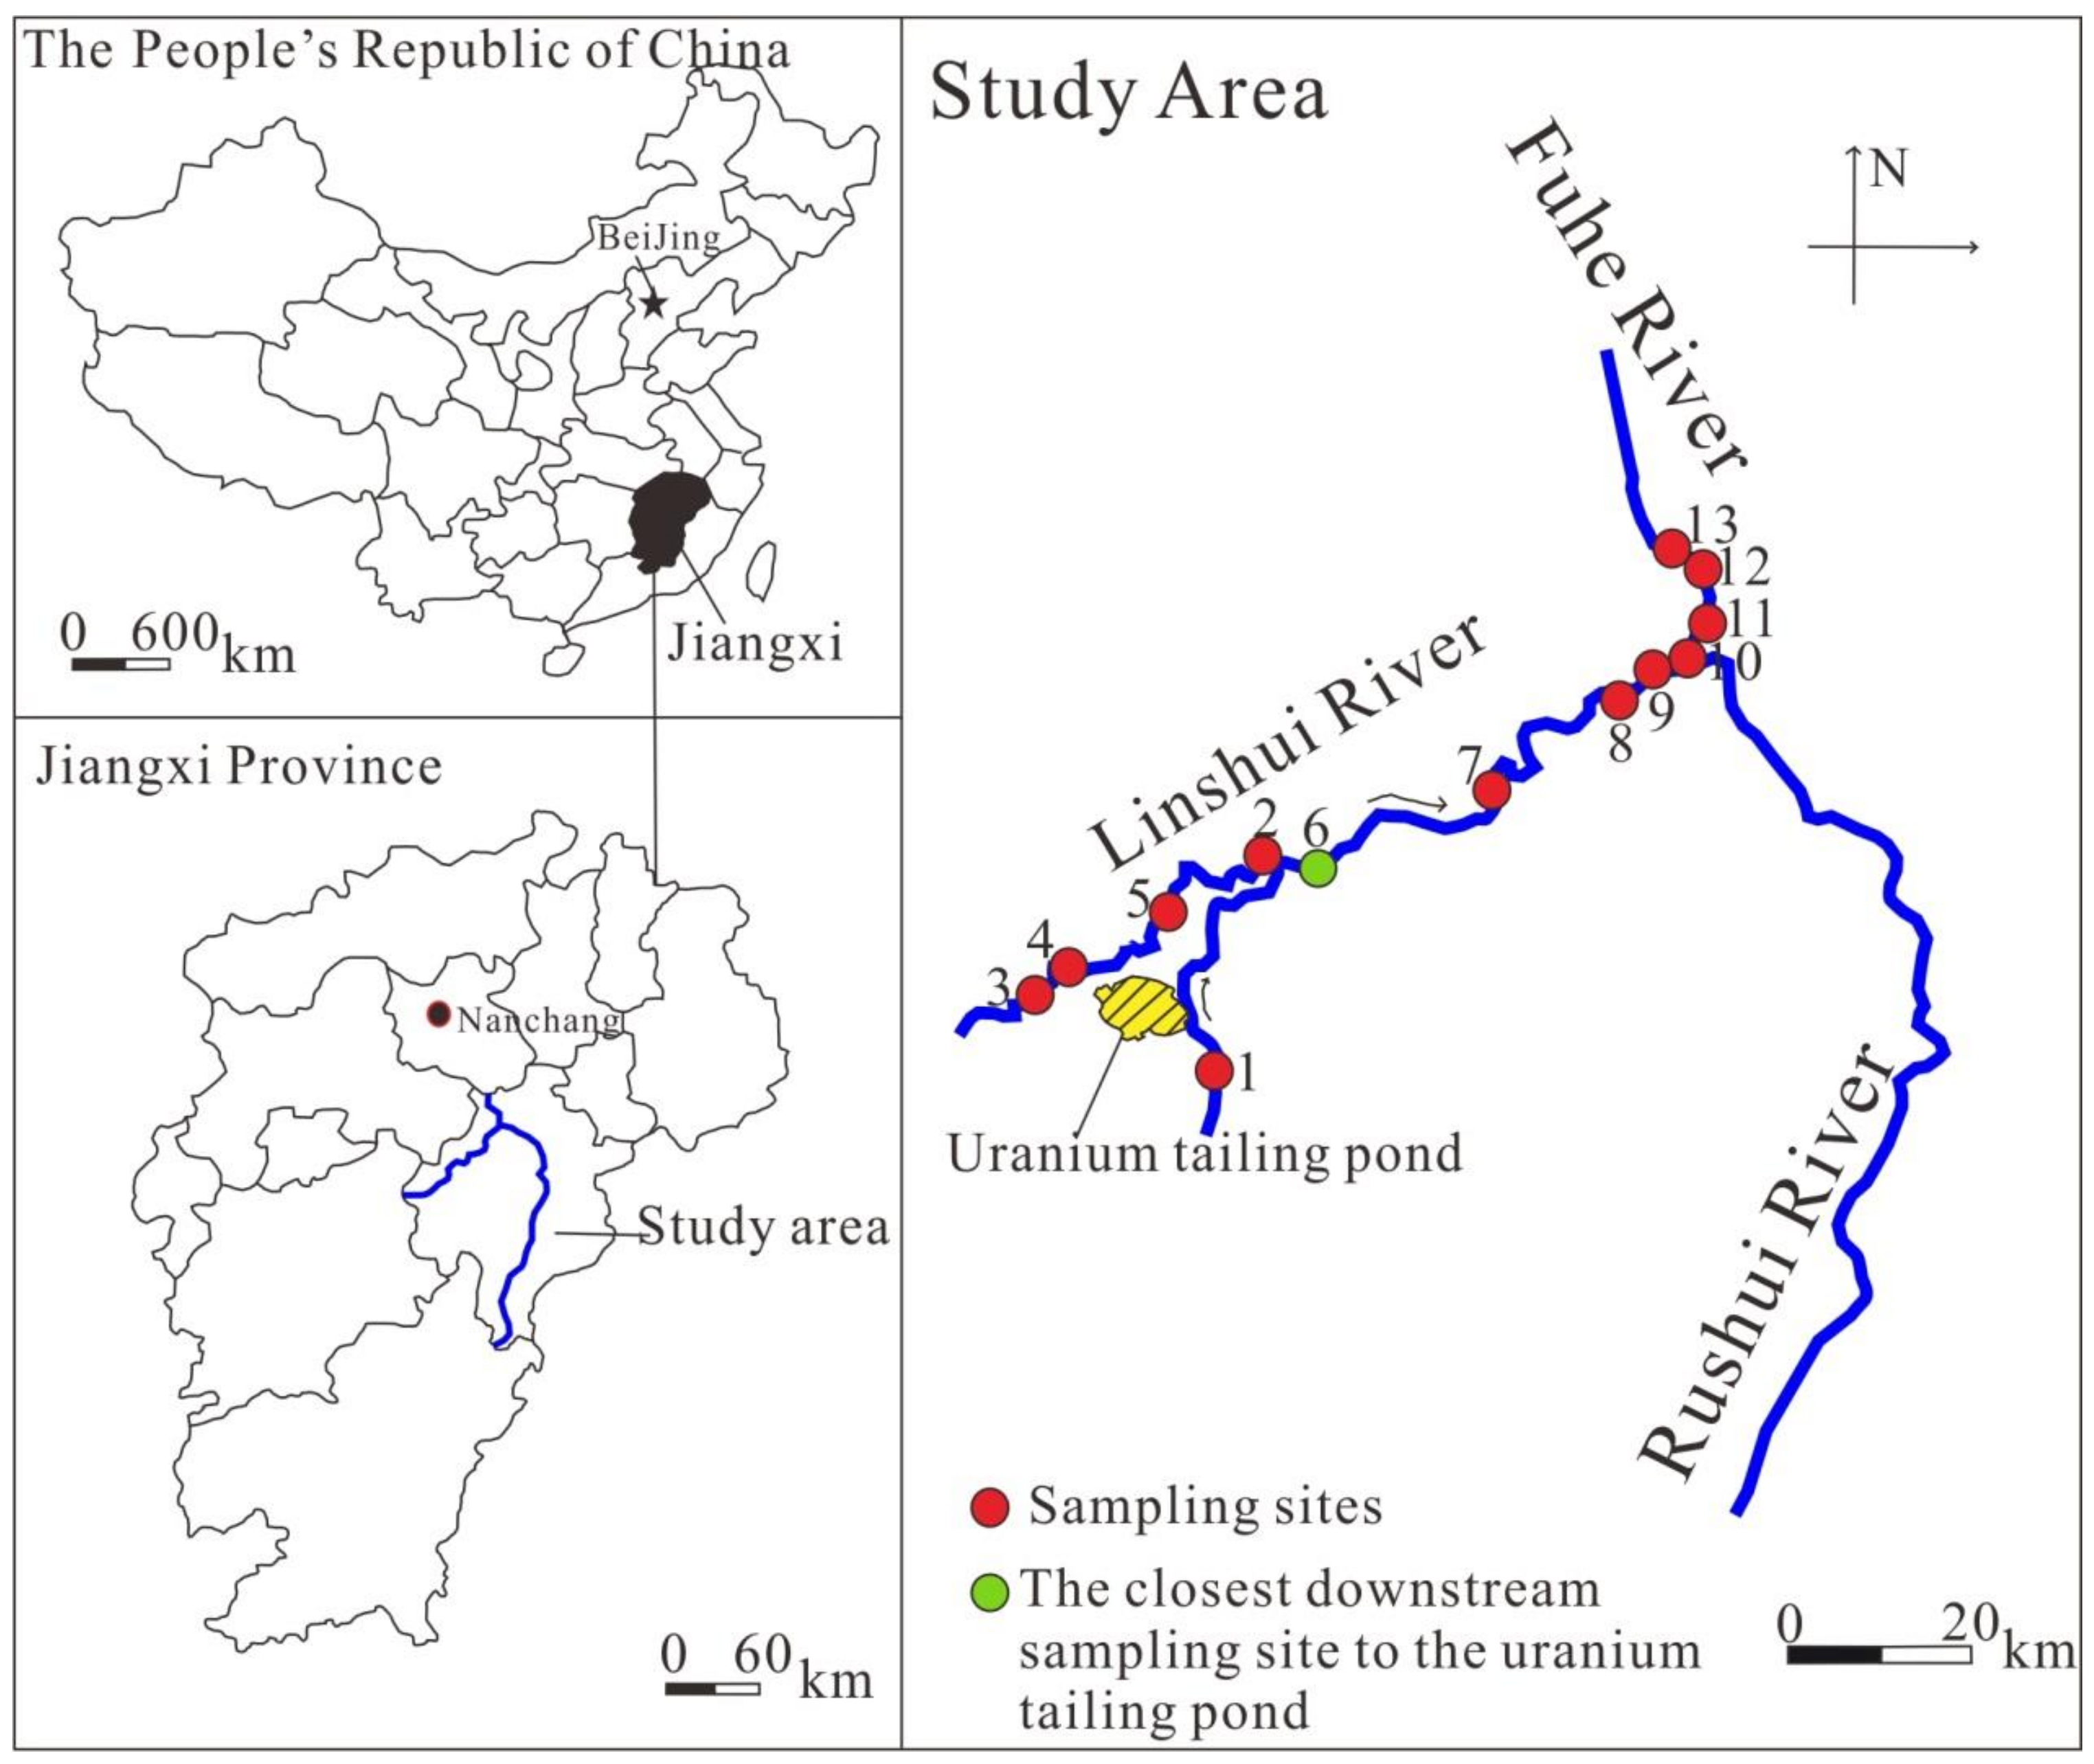
2.1. Study Area

Linshui River, located within 116°17′ E–116°19′ E and 28°11′ N–28°01′ N, is the most important third-order tributary of Fuhe River (Figure 1). It exists in a subtropical monsoon climate with four distinct seasons. The mean annual sunshine duration is 1579 h. The mean annual temperature is 15.9 °C. The frost-free period is 240 d. The mean annual rainfall is 1713 mm [26]. Linshui River flows from south to north and passes through four towns, with three sub-tributaries connected to it. The Linshui River Watershed has higher terrain at southwest corner and is habituated by high-density plants [27]. The upstream is bounded by high mountains, and the valley upstream is serpentine, narrow, and deep. At the low relief downstream, the river water flows straightly and gently.
The watershed area is around 5151 km2, and the river length is approximately 162 km. The river provides irrigation water for farmland with the areas up to 67,000 hm2. The mean annual rainfall and water yield is 1890.0 mm and 50.57 × 10⁸ m3, respectively. The average, maximum, and minimum values of flow rate are 162 m3·s−1, 4380 m3·s−1, and 0.92 m3·s−1, respectively, based on the record of Lu village hydrological station. Xiangshan uranium ore field was built in the upland of the basin and has been in use for more than 60 years [26]. There are more than 100,000 residents living around the ore field and potentially affected by the mining activity. The ore field is situated in the Mesozoic Gan-Hang volcanic belt and is influenced by volcano invasion [28]. The ore-hosting rocks are formed from rhyolite dacite, crustal lava, sub-granite porphyry volcanoes, and subvolcanic rocks. The river water quality may be at risk due to the short distance to the ore field and the mining activities in this uranium ore field.

2.2. Sampling Sites and Analytical Methods

The sampling activities were conducted in October 2016. A total of 13 samples were taken based on the river topography and residing places along the river (Figure 1). Water samples were filtered through a 0.45 μm Millipore filter in situ and delivered into a 500 mL water flushed plastic bottle. The samples were sealed until they were measured in the laboratory. Trace metals of As, Cr, and Cu and radionuclides of U and Th were analyzed. Trace metals were analyzed by atomic absorption spectrometer (ICE3500, Thermo Fisher Scientific, Waltham, Massachusetts, USA). The contents of U and Th in water samples were detected by inductively coupled plasma optical emission spectrometer (ICP-OES, Thermo Fisher Scientific, USA). The results of six duplication measurements indicate that the errors are less than 5%.

2.3. Health Risk Assessment

Heavy metals are conveyed into human bodies via different ways, which lead to unequal influence on human health [19]. Chronic daily intake (CDI) is an index recommended by USEPA to estimate oral intake as follows:
CDI = D·Ci/BW
where D (L·d−1) represents average daily drinking water intake, and has a value of 1.488 L·d−1 as suggested by Q et al. [29]; Ci (μg·L−1) denotes the concentration of heavy metals; BW (kg) is body weight and given to be 61.75 kg based on [30].
As different types of chemicals bring different influences on human bodies, risk assessments of these chemicals can be characterized by non-carcinogenic risk (HI) and carcinogenic risk (RI). The index of HI can be calculated by the following equation:
HI = [CDI/(RfDi·76.5)]·106
where RfDi (mg·kg−1·d−1) represents the oral reference dose, 76.5 is the average life expectancy based on the statistic recommended by WHO, and CDIi represents the different index recommended by the EPA to estimate oral intake.
The index of RI can be calculated by the following equation:
RI = (CDIi·SFi)/76.5
where SFi (kg·d·mg−1) is the slope factor of a carcinogen.
The carcinogenic risk of radionuclide (AI) can be calculated by the following equation:
AI = 1.25 × 10²·C·D·gg
where C (Bq·L−1) and gg (Sv·Bq−1) represent the concentrations of U and Th and intake dose conversion factor, respectively.
The method of health risk assessment was recommended by the EPA. The accuracy of model parameters will influence the results directly. Many countries, excluding China, have also published their own Exposure Parameter Manual as a supplementary to that of the EPA. The following calculation in this study will use the exposure parameters recommended by the EPA. Table 1 shows the toxicological characteristic parameters used in this study.

3. Results and Discussion

3.1. Water Characteristics

The results of heavy metals and radionuclides in the river water are shown in Table 2. Five heavy metals, namely As, Cr, Cu, U, and Th, are detectable. Their concentration sequence is Cu > Cr > As > U > Th. Belonging to carcinogenic elements, As ranges from 1.76 to 6.97 μg·L−1, with an average of 2.61 μg·L−1, and Cr ranges from 0 to 7.3 μg·L−1, with an average of 3.45 μg·L−1. Cu is non-carcinogenic element, and has a concentration of 20.1 to 28.2 μg·L−1, with an average of 22.82 μg·L−1. The heavy metals in Linshui River are subject to class III of the environmental quality standards for surface water (GB3838-2002) and standards for irrigation water quality (GB5084-2005). The obtained heavy metal concentrations do not exceed the class III standard or standards for irrigation water quality as presented in Table 2. However, radioactive contamination is quite significant in Linshui River. The concentration of U ranges from 0.006 to 3.75 μg·L−1, with an average of 0.89 μg·L−1, and the concentration of Th ranges from 0.09 to 0.316 μg·L−1, with an average of 0.15 μg·L−1. The concentrations of U at sites 5 and 6 situated in the vicinity of uranium mining area are higher than the values at other sampling sites (Figure 2), since these two sites are intermediately adjacent to the uranium mining area. This phenomenon has also been observed for heavy metals of As and Cr, which reach their maximum concertation at site 6. It is concluded that Linshui River is most likely affected by mining activities. Therefore, it is crucial to evaluate the health risk in this area. The radionuclides of U and Th are compared to the regulations for radiation and environment protection in uranium mining and milling (GB23727-2009). The maximum tolerant values of U and Th before it is discharged into the downstream of the river are 50 and 100 μg·L−1, respectively. Thus, all the obtained U and Th concentrations in Linshui River are lower than the values above.

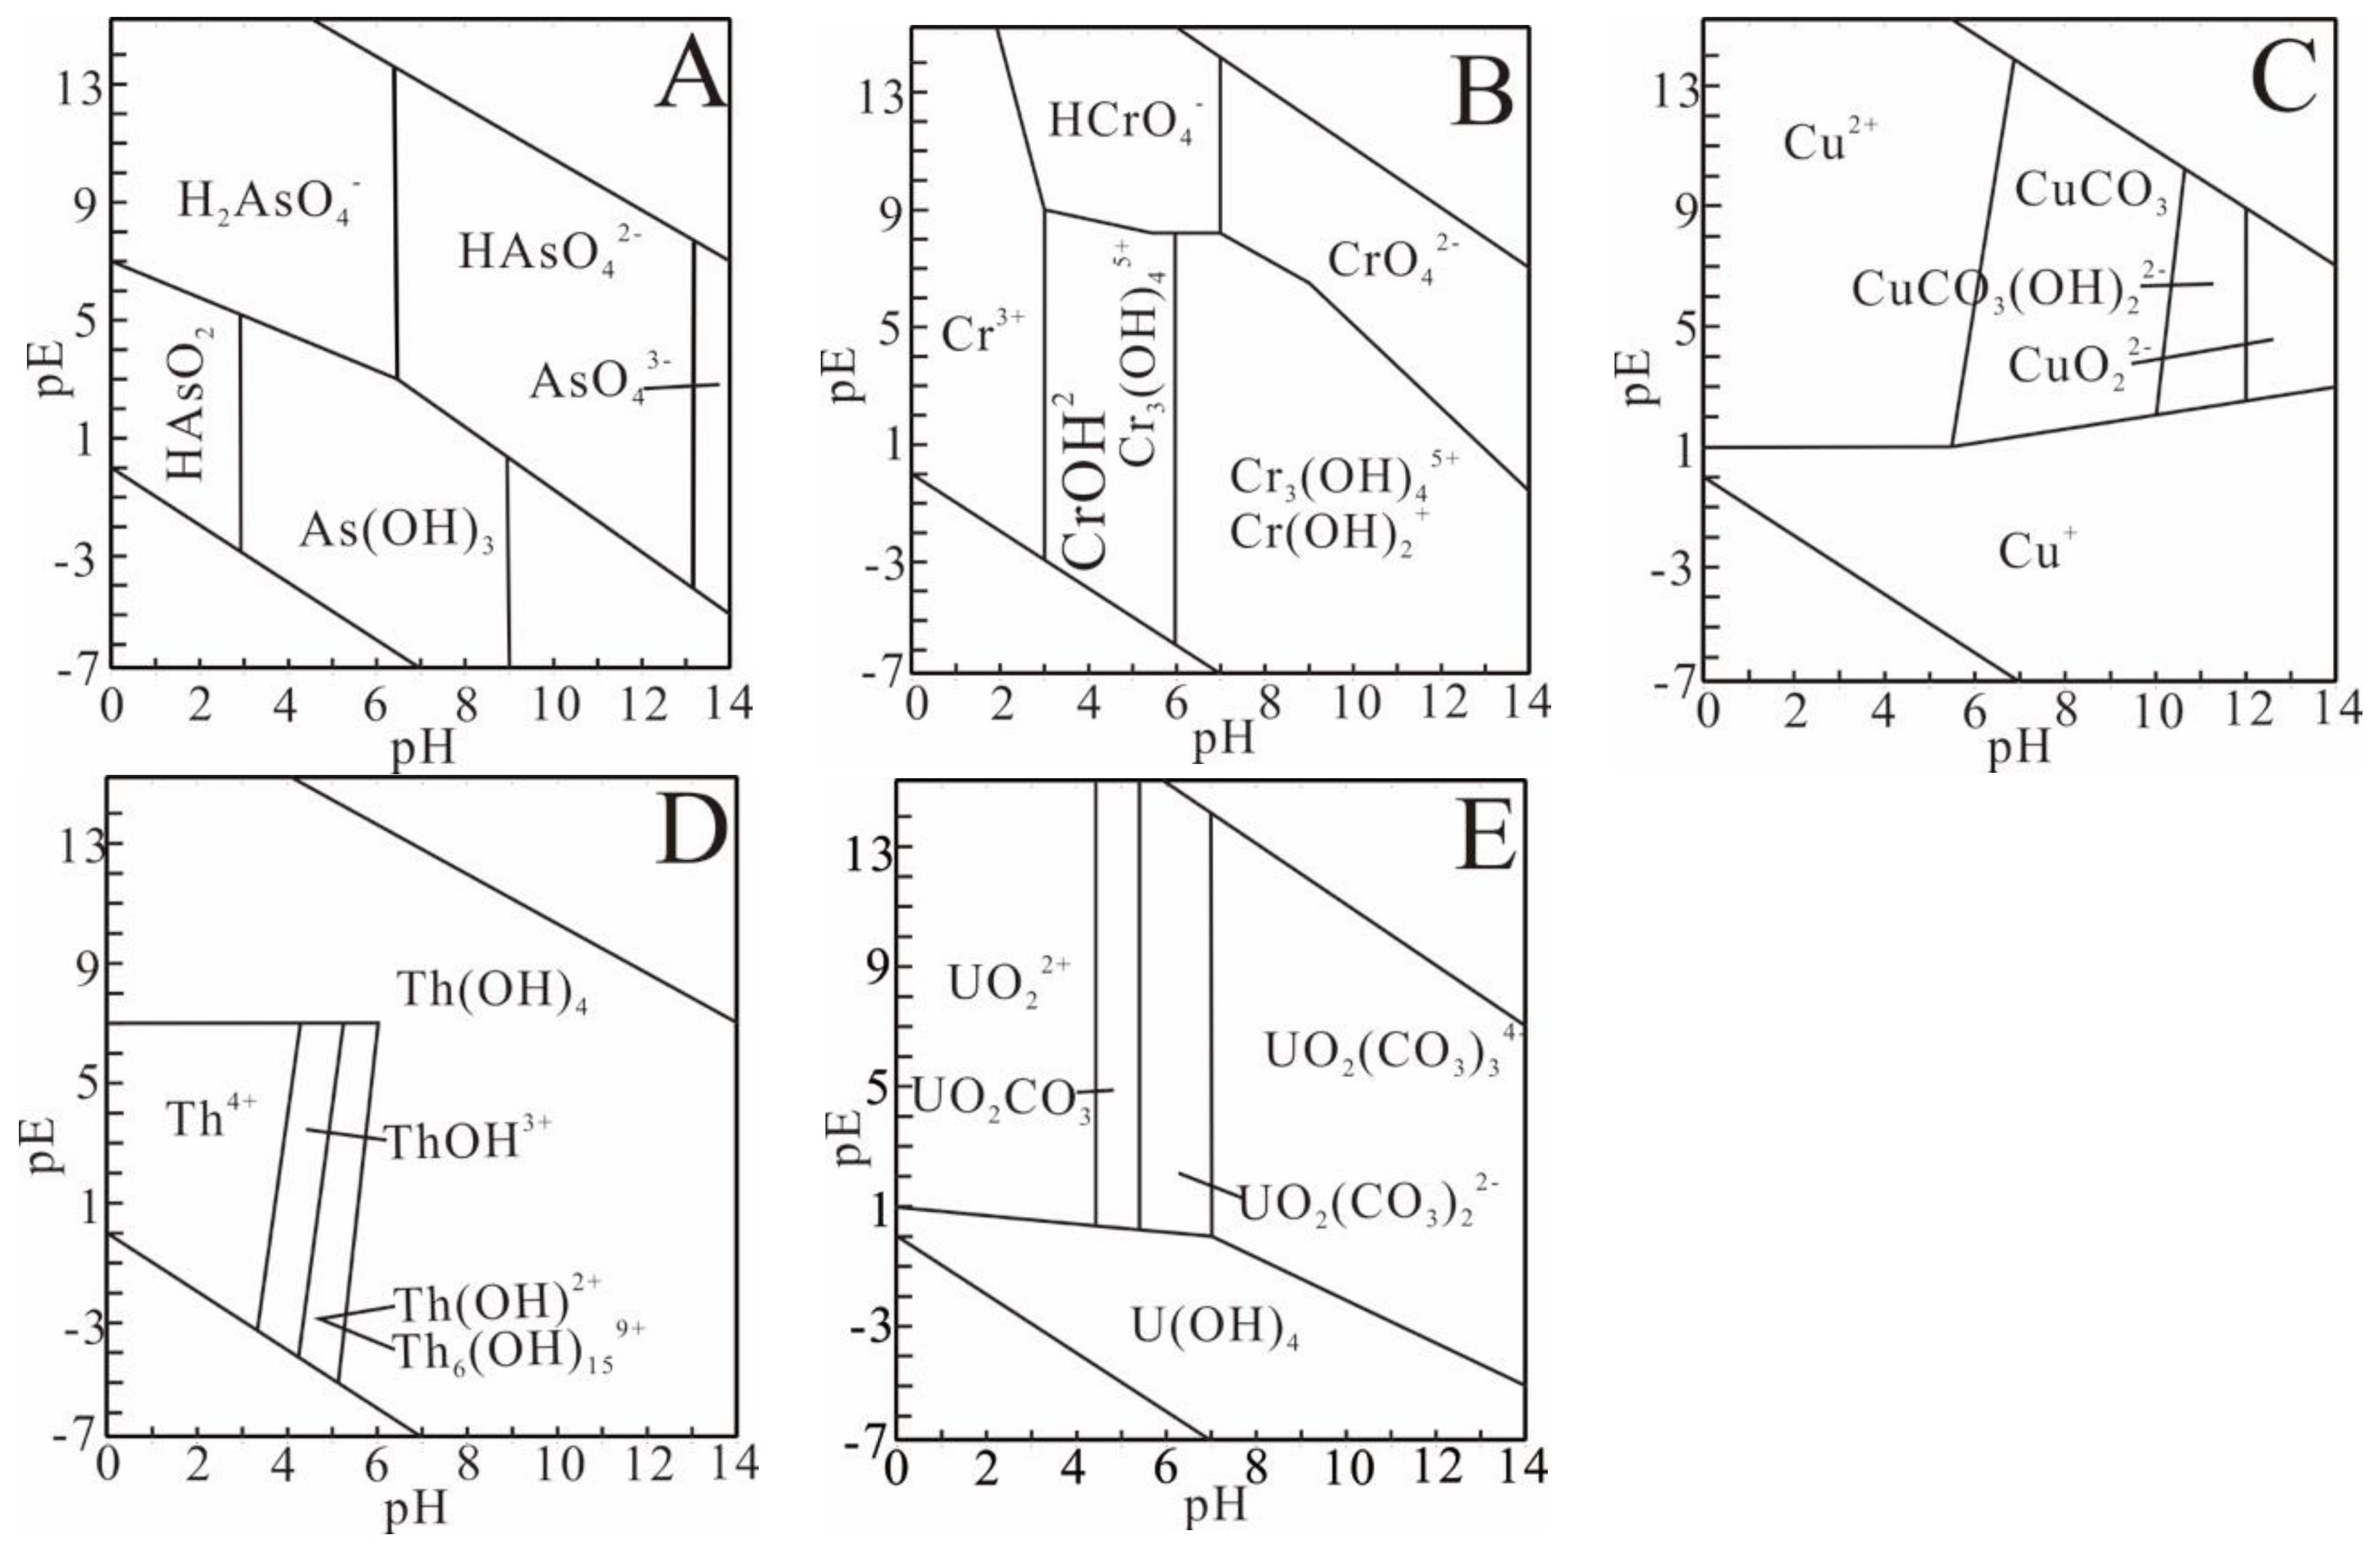
3.2. Influences of Uranium Tailing Pond on the Speciation of Heavy Metals

The toxicity of heavy metals is dependent on their valence states. Many heavy metals even have biotoxic effects on human beings because of their chemical reaction in human body [31]. Hence, in order to extensively investigate the toxicity of different valence states of heavy metals under the influence of the uranium tailing pond, PHREEQC was used to simulate the speciation of heavy metals under different pE—pH conditions in site 6 (Figure 1), which is the closest downstream sampling site to the Uranium Tailing Pond. Under the natural condition, As has +5, +3, +1, 0, and −3 valences, whereas the most widely species in water are H2AsO4- and HAsO42- in +5 valence [32]. In this study, H2AsO4 and HAsO42− also account for the largest portion (Figure 2A). Under oxidizing condition, As exists in the form of H2AsO4 and HAsO42−. HAsO42− and As(OH)3 become the dominant chemical components when the water turns to a neutral condition. However, AsO43− predominates under strong alkaline condition. The pE—pH diagram of Cr is shown in Figure 2B. Cr3+ exists only under acidic condition [33]. When 3 < pH < 7 and pE > 7, HCrO4 is the predominant form. From a neutral condition to an alkaline condition, Cr3(OH)45+, CrOH2+, and Cr(OH)2+ are present. In addition, Cr3(OH) 45+ and CrOH2+ appear when pH < 6, and Cr3(OH)45+ and Cr(OH)2+ are existential when pH > 6. CrO42− only exists under the alkaline condition. As shown in Figure 2C, Cu is subject to two forms under pE = 1. Cu+ appears only when pE < 1 and Cu2+ is predominant when pE > 1. With the increase of alkalinity, the major chemical components are converted from CuCO3 to CuCO3(OH)22− by hydrolysis, which is finally oxidized to CuO22−. This phenomenon is consistent with the study of Geoffrey and Alan [34]. The oxidized state of Cu is favored by high pH. The pE—pH diagram for Th is presented in Figure 2D. Thorium only exists in quadrivalent, and it is a non-redox heavy metal [35]. The pH value has a significant effect on the hydrolysis reaction intensity. When pH < 3, Th4+ is the only species. With the increase of pH, the predominant form of Th changes from ThOH3+ to Th(OH)2+, and terminates at Th(OH)4. This phenomenon can be ascribed to gradually enhanced hydrolysis [27]. U usually appears in the oxidation states of either U6+ or U4+. The main species of U are shown in details in Figure 2E. When pH < 4.5, the dominant component is UO22+. When pH > 4.5, UO22+ will react with OH- firstly. After carbonate complex appears, OH will be replaced by carbonate. Uranyl-carbonate complexes are existential in weak acid-alkaline water [23,36]. When 4.5 < pH < 5.5, UO2CO3 is the dominant component; When 6.5 < pH < 7.5, UO2(CO3)22− becomes the predominant form; when pH > 7.5, the dominant form turns to UO2(CO3)34−. Moreover, U(IV) exits in the form of U(OH)4 only if pE < 1.

3.3. Speciation of Heavy Metals in the River Water

Using the obtained basic physiochemical parameters (Table A1) as the initial conditions and input parameters, the speciation of heavy metals (U, Th, As, Cr, and Cu) in the river water based on the pE-pH condition was simulated by the geochemical modular PHREEQC (version 2.18). Table 3 summarizes the main heavy metal species and their contents. Some species that are less than 7% of their total concentrations are not presented in Table 3. The main species of As are H2AsO4 and HAsO42−, whereas the other species (HAsO3F and AsO3F2−) are minimal. The dominant species of Cr are HCrO4, Cr2O72−, and CrO42−. The species of Cu are Cu2+, CuSO4, and CuCO3. The chemical valence of Cu in the surface water is divalent. The species of Th include Th(OH)4, Th(OH)22+, Th(OH)3+, and Th(SO4)2. The chemical valence of Th in the surface water exists in quadrivalent. The species of U are UO2CO3, (UO2)2CO3(OH)3, UO2(CO3)22−, UO22+, and UO2(CO3)34−, within which UO2CO3, UO2(CO3)22− and UO2(CO3)34− are predominant. The valence state of U exists in hexavalent [37].
According to the simulation result, the main species of As is quinquevalence arsenic. Arsenic is a protoplastic poison that leads to malfunctioning of cell respiration, cell enzymes and mitosis [38]. The simulation result indicates that chromium in the river water is in hexavalent valence state. Both Cr (VI) and Cr (III) present their toxicity to human beings, but the former is much more dangerous than the latter [38]. Agita F. et al. [39] reported that the toxicity of Cu2+ is stronger than that of Cu+. In addition, the radioactive U is of high toxicity and U6+ is most reactive and poisonous [40]. Th can lead to oxidative stress in the liver and therefore influence liver functions [35]. Thus, the heavy metals in river water of the study area all exist in the valence state of toxicity and are harmful to human health.

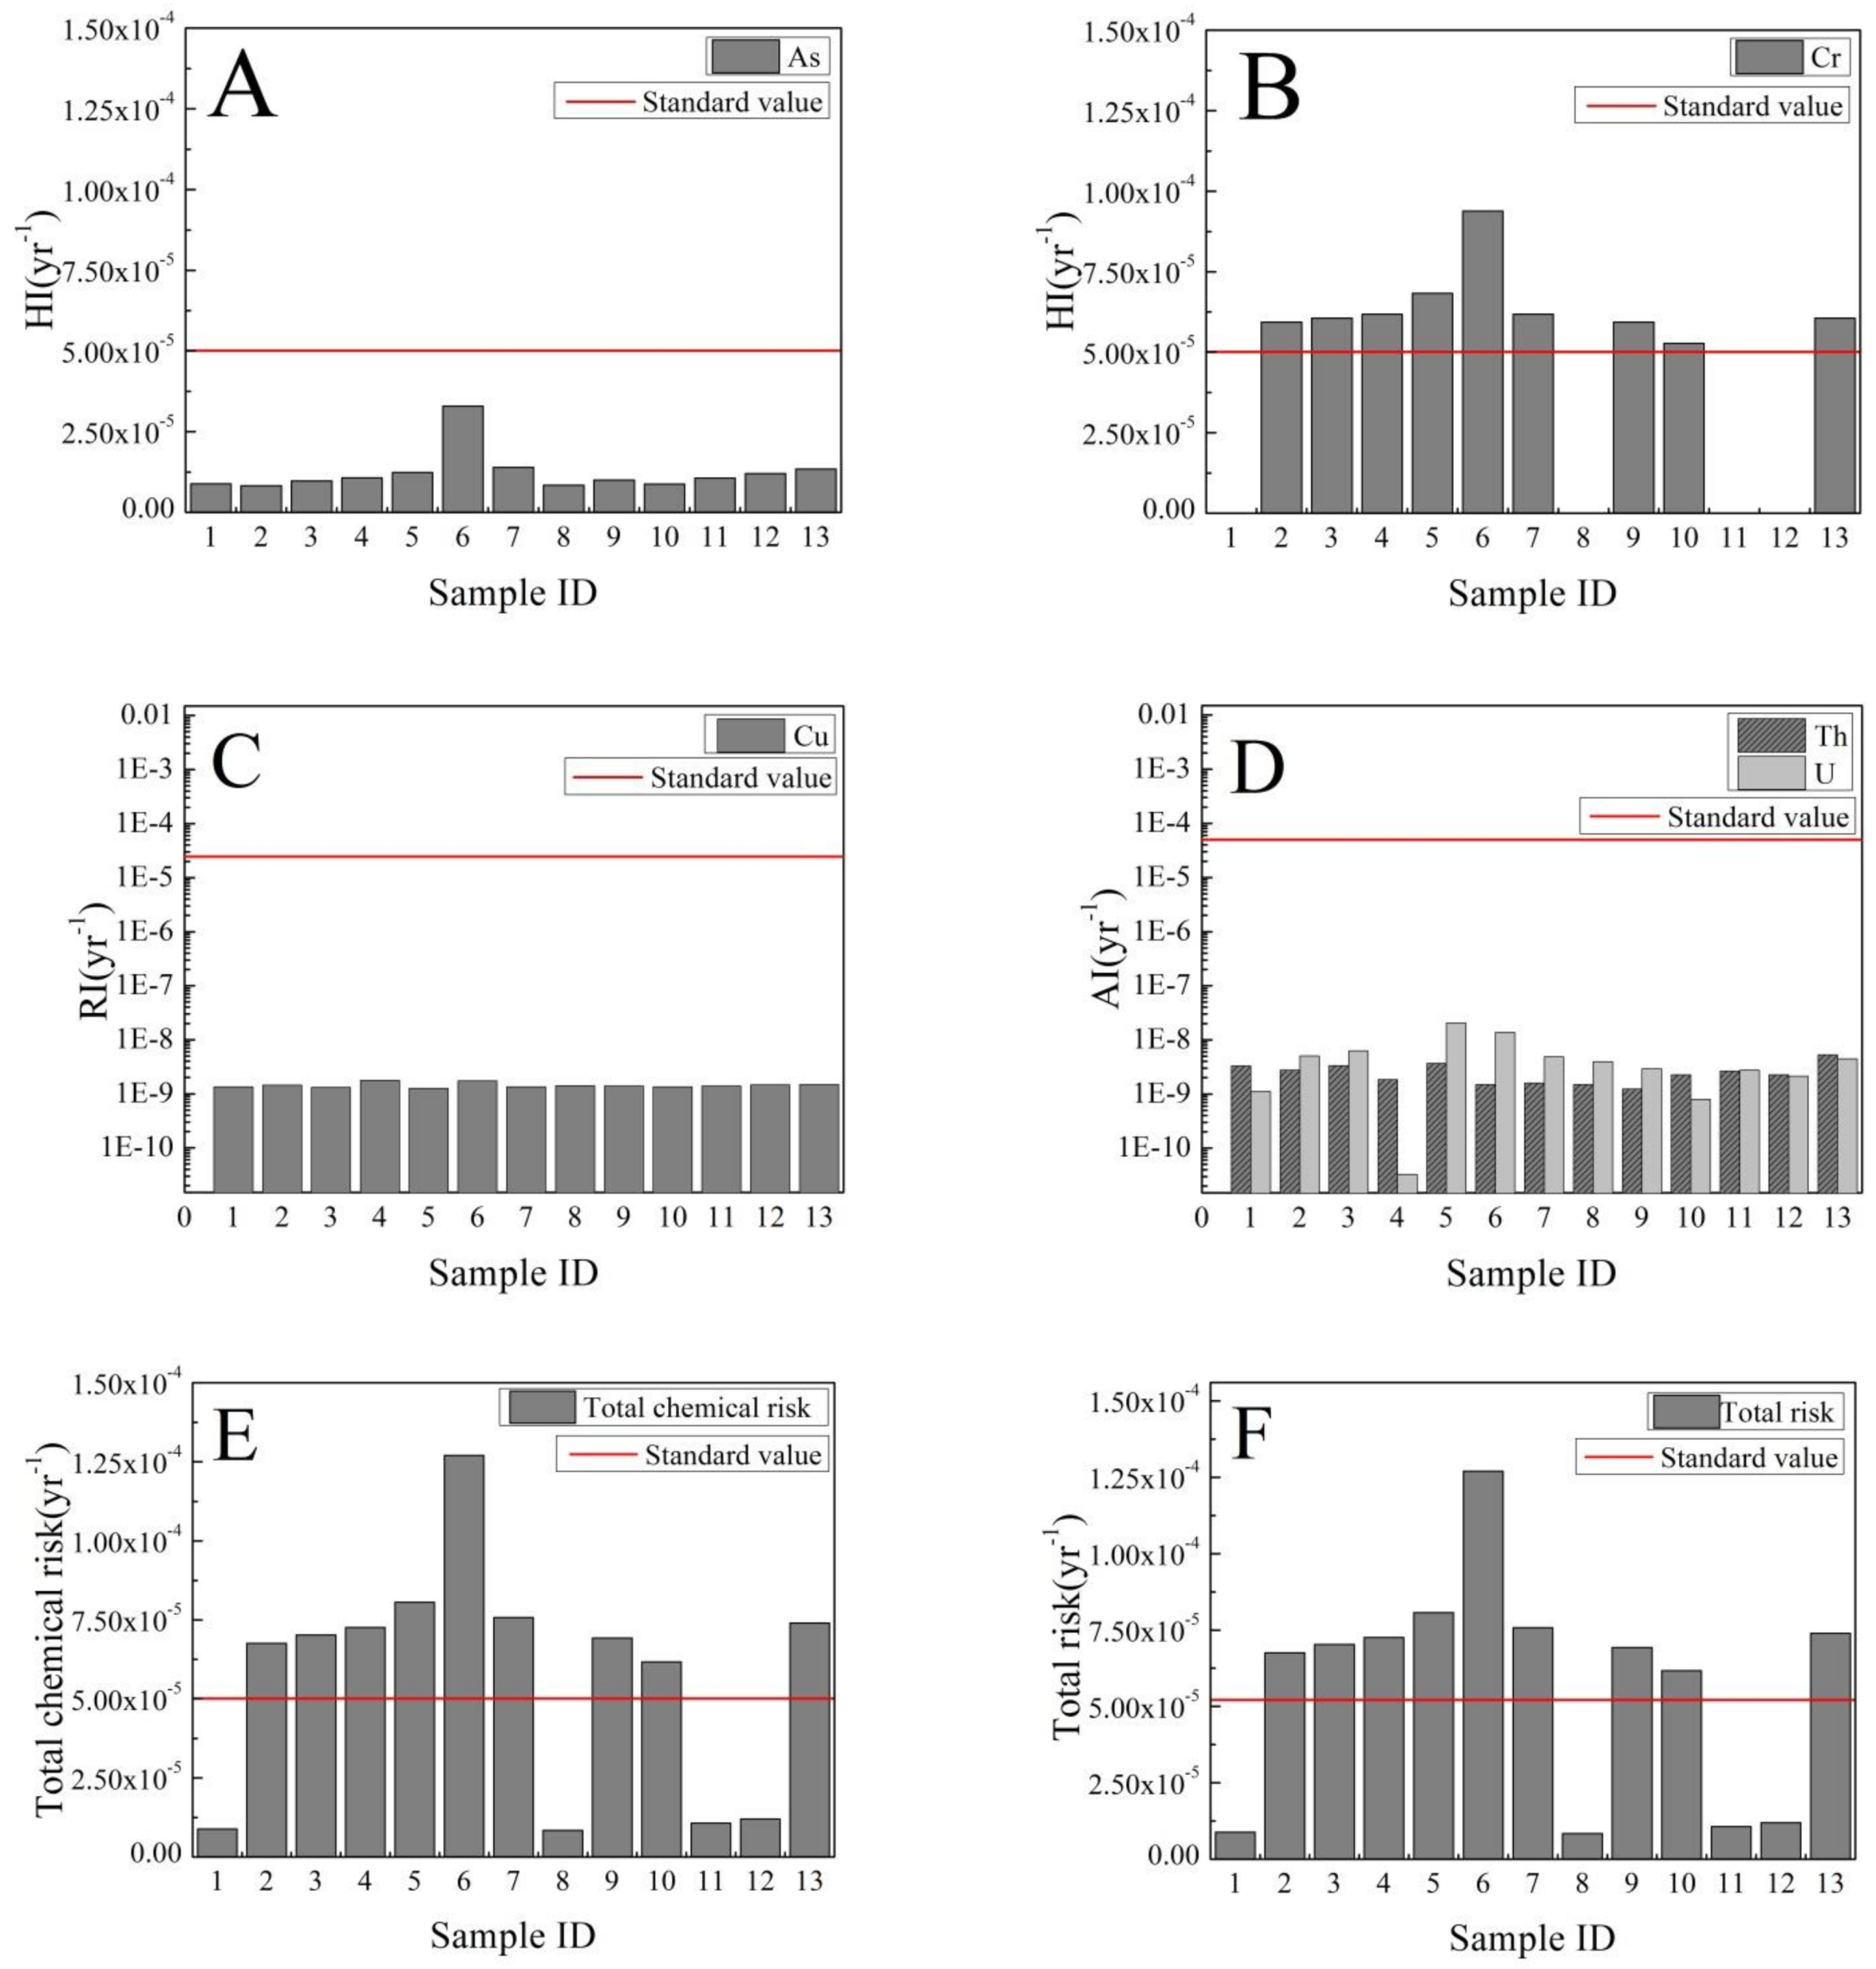
3.4. Health Risk Assessment

Heavy metals, such as U, Th, Cu, As, and Cr, can cause serious organism depletion in some critical nutrients, and in turn enhance the occurrence of upper gastrointestinal cancer [7]. The health risks of heavy metals in Linshui River are assessed and listed in Table 4. The average chemical non-carcinogens risk is 1.44 × 10⁻⁹ year−1, which is four orders of magnitude lower than the average chemical carcinogens risk (1.20 × 10⁻⁵ and 4.45 × 10⁻⁵ year−1). The average total radionuclide risk is four orders of magnitude lower than the average total chemical risks (5.68 × 10⁻⁵ year−1). The highest risk to human body in Linshui River is ascribed to Cr, with the health risk ranging from 0 to 9.39 × 10⁻⁵ year-1. As is closely behind, which leads to an average risk of 1.20 × 10⁻⁵ year−1 to local residents. The health risks of the heavy metals of Cu, U, and Th range from 3.27 × 10⁻¹¹ to 2.04 × 10⁻⁸ year−1 (Table 4).
Figure 3 presents the health risks in Linshui River and the maximum acceptable level (5.05 × 10⁻⁵ year−1) recommended by USEPA. The risks of As are all below the maximum acceptable level (Figure 3A), while three quarters of the samples for Cr have health risks, where the HI value exceeds the standard (Figure 3B). The health risk of Cu, U and Th are four orders of magnitude lower than the maximum acceptable level (Figure 3C,D). The total chemical risk and the total risk of most sampling sites exceed the maximum acceptable level (Figure 3E,F). There is a trend that the health risks of all heavy metals reach the maximum at site 5 or 6 (Figure 3A–D). Site 5 is adjacent to the uranium ore field and site 6 is close to tributary joint place (Figure 1). Thus, these two sites are supposed to be affected by the uranium ore field. The rapid rise of the health risk of U at site 5 also indicates that Linshui River is influenced by the uranium ore field (Figure 3D). The total chemical risk is close to the total risk (Figure 3E,F). Meanwhile the average total radionuclide risk is obtained to be 7.85 × 10⁻⁹ year−1 and is four orders of magnitude lower than the average total chemical risk (Table 4). It is concluded that most potential health risks to human body in Linshui River are caused by chemical carcinogens.
Wu et al. [41] investigated the main heavy metals in the Nanjing Section of Yangtze River, China. The results showed that the risk brought by As is the highest human health risk in this area. Wongsasuluk et al. [42] assessed the heavy metal contamination in groundwater in Ubon Ratchathani province, Thailand and only As was found at an unacceptable cancer risk level. Kavcar et al. [43] discussed the health risk of drinking water in Province of I˙zmir, Turkey and concluded that 46% arsenic non-carcinogenic risks were higher than the acceptable level. Giri and Singh [44] assessed the groundwater of Subarnarekha River Basin, India. The largest contributors to chronic risks were Mn, Co. and As. Kim et al. [45] evaluated the human risk of uranium in Korean groundwater, and suggested that radiological risk were within acceptable levels. Compared with health risk assessment of other studies, the results in this study is similar to their consequences. Arsenic non-carcinogenic risk is a problem to the world, regardless of neither drinking surface water nor groundwater. Most radiological risk was acceptable due to rather low uranium.

4. Conclusions

The levels, ionic speciation and health risk assessment of heavy metals in Linshui River were evaluated in this study. The concentrations of U at sites 5 and 6 situated in the vicinity of uranium mining area are higher than the values at other sampling sites, since these two sites are intermediately adjacent to the uranium mining area. It is concluded that the concentration of heavy metals in river water was likely to be affected by a series of uranium mining activities. The contents of As, Cr, Cu, U, and Th in all the water samples do not exceed class III of the environmental quality standards for surface water (GB3838-2002) or standards for irrigation water quality (GB5084-2005). All the obtained U and Th concentrations in Linshui River are lower than the maximum tolerance values (GB23727-2009). PHREEQC simulation results are: (1) the main species of As are H2AsO4 and HAsO42−; (2) the dominant species of Cr are HCrO4, Cr2O72−, and CrO42−; (3) the species of Cu are Cu2+, CuSO4, and CuCO3; (4) the species of Th include Th(OH)4, Th(OH)22+, Th(OH)3+ and Th(SO4)2; (4) the species of U are UO2CO3, (UO2)2CO3(OH)3, and UO2(CO3)22− are predominant. The simulation results also show that heavy metals in the river water are in the toxicity state. Harmful heavy metals in river water not only enter human body via drinking, but also migrate into crops, soil and groundwater by irrigating farmland. Thus, it is speculated that despite the lower concentration in water, the elements may get accumulated in the crops, leading to the exponential increase in the concentration in the harvest. Meanwhile, health risk assessment shows that the average value of total risk (As, Cr, Cu, U, and Th) is 5.68 × 10⁻⁵ year−1, which is higher than the maximum acceptable level recommended by ICRP (5.05 × 10⁻⁵ year−1). Nevertheless, the average value of total radionuclide risk (U and Th) is 7.85 × 10⁻⁹ year−1, which is lower than standard value (5.0 × 10⁻⁴ year−1). The health risks of chemical non-carcinogens (Cu) are lower than the value of the chemical carcinogens (As and Cr). The highest risk to the human body in Linshui River is ascribed to Cr, with the health risk ranging from 0 to 9.39 × 10⁻⁵ year−1. Arsenic is closely behind, which leads to an average risk of 1.20 × 10⁻⁵ year−1 to local residents. The health risks of the heavy metals of Cu, U and Th range from 3.27 × 10⁻¹¹ to 2.04 × 10⁻⁸ year−1. The average values of the total risks are ranked in the order of Cr > As > U > Th > Cu. It is concluded that the river water in the study area does not pose a significant health risk to people. However, the presence of multiple heavy metals may be toxic to human health, and the river water should not be used for drinking without treatment. Based on the results of this study, there are some suggestion for the future studies. First, heavy metals are subject to high migration and accumulation ability. It is necessary to investigate heavy metals and evaluate the health risks in crops, soils, and groundwater. More soil and plants samples will be detected in the future study. Second, this study only adopts some regular data for Chinese people, such as weight, life span, and daily drinking water intake, to assess the health risks for Chinese people. To give a more realistic assessment, population exposure scenarios need to be evaluated in the future. Third, children usually have a higher health risk than adults, and therefore it is necessary to evaluate health risk to local children.

Acknowledgments

This study was financially supported by the National Natural Science Foundation of China (41362011 and 41502235) and the International Atomic Energy Agency Coordinated Research Project (IAEA No. 21122). The study is supported by the Internship program between HKU-ECUT and HKU postdoc fellowship.

Author Contributions

Liu He: data analysis and interpretation, manuscript writing; Bai Gao: Conceiving and designing the study; Xin Luo: Conceiving, data analysis and manuscript writing; Jimmy Jiao, Huanhuan Qin and Yihui Dong: contribution to manuscript construction; Chunyan Zhang: field assistant and data analysis.

Conflicts of Interest

The authors declare no conflicts of interest.

Table A1. The starting conditions of PHREEQC (mg/L).
Sample IDK+Na+Ca2+Mg2+NH4+Cl-SO42-HCO3-NO3-F-Ionic StrengthpHpE
Mg/LMol/L
11.452.731.311.120.460.86031.72.150.041.08 514.94
21.642.451.491.10.380.8311.329.7118.761.551.87 513.57
35.522.794.831.850.450.88037.641.8901.75 517.15
45.994.939.252.80.590.786.6547.544.220.12.94 7.546.88
54.133.94.51.690.370.2039.622.5701.72 7.446.95
62.63.8310.72.621.550.09061.412.3402.87 6.76.79
74.294.184.951.970.337.115.9641.65.180.112.35 613.03
83.434.794.071.680.45.676.1936.452.830.142.07 6.0314.47
93.542.994.21.460.540.330211.7901.30 6.0212.44
102.054.352.941.490.434.486.0735.665.1201.85 513.15
113.495.743.351.570.385.4911.8928.533.130.132.13 6.0115.01
123.445.733.281.520.315.1710.627.732.950.142.03 614.20
133.677.883.721.730.367.3318.8233.683.60.142.73 614.38

References and Note

  1. Chen, W.Y. Environmental externalities of urban river pollution and restoration: A hedonic analysis in Guangzhou (China). Lands. Urban Plann. 2017, 157, 170–179. [Google Scholar] [CrossRef]
  2. Li, Z.; Mao, X.Z.; Li, T.S.; Zhang, S.Y. Estimation of river pollution source using the space-time radial basis collocation method. Adv. Water Resour. 2016, 88, 68–79. [Google Scholar] [CrossRef]
  3. Lu, Y.; Song, S.; Wang, R.; Liu, Z.; Meng, J.; Sweetman, A.J.; Jenkins, A.; Ferrier, R.C.; Li, H.; Luo, W.; et al. Impacts of soil and water pollution on food safety and health risks in China. Environ. Int. 2015, 77, 5–15. [Google Scholar] [CrossRef] [PubMed]
  4. Hanjra, M.A.; Qureshi, M.E. Global water crisis and future food security in an era of climate change. Food Policy 2010, 35, 365–377. [Google Scholar] [CrossRef]
  5. Wang, J.; Da, L.; Song, K.; Li, B.L. Temporal variations of surface water quality in urban, suburban and rural areas during rapid urbanization in Shanghai, China. Environ. Pollut. 2008, 152, 387–393. [Google Scholar] [CrossRef] [PubMed]
  6. Borges, R.C.; dos Santos, F.V.; Caldas, V.G.; Lapa, C.M.F. Use of geographic information system (GIS) in the characterization of the Cunha Canal, Rio de Janeiro, Brazil: Effects of the urbanization on water quality. Environ. Earth Sci. 2014, 73, 1345–1356. [Google Scholar] [CrossRef]
  7. Türkdoğan, M.K.; Kilicel, F.; Kara, K.; Tuncer, I.; Uygan, I. Heavy metals in soil, vegetables and fruits in the endemic upper gastrointestinal cancer region of Turkey. Environ. Toxicol. Pharmacol. 2003, 13, 175–179. [Google Scholar] [CrossRef]
  8. Islam, M.S.; Ahmed, M.K.; Raknuzzaman, M.; Habibullah-Al-Mamun, M.; Islam, M.K. Heavy metal pollution in surface water and sediment: A preliminary assessment of an urban river in a developing country. Ecol. Indic. 2015, 48, 282–291. [Google Scholar] [CrossRef]
  9. Finkelman, R.B.; Tian, L.W. The health impacts of coal use in China. Int. Geol. Rev. 2017, 1–11. [Google Scholar] [CrossRef]
  10. Zhou, M.; Liao, B.; Shu, W.S.; Yang, B.; Lan, C.Y. Pollution Assessment and Potential Sources of Heavy Metals in Agricultural Soils around Four Pb/Zn Mines of Shaoguan City, China. Soil Sediment Contam. Int. J. 2014, 24, 76–89. [Google Scholar] [CrossRef]
  11. Packey, D.J.; Kingsnorth, D. The impact of unregulated ionic clay rare earth mining in China. Resour. Policy 2016, 48, 112–116. [Google Scholar] [CrossRef]
  12. Imperato, M.; Adamo, P.; Naimo, D.; Arienzo, M.; Stanzione, D.; Violante, P. Spatial distribution of heavy metals in urban soils of Naples city (Italy). Environ. Pollut. 2003, 124, 247–256. [Google Scholar] [CrossRef]
  13. Valko, M.M.H.C.M.; Morris, H.; Cronin, M.T.D. Metals, Toxicity and Oxidative Stress. Curr. Med. Chem. 2005, 12, 1161–1208. [Google Scholar] [CrossRef] [PubMed]
  14. Wei, X.; Gao, B.; Wang, P.; Zhou, H.; Lu, J. Pollution characteristics and health risk assessment of heavy metals in street dusts from different functional areas in Beijing, China. Ecotoxicol. Environ. Saf. 2015, 112, 186–192. [Google Scholar] [CrossRef] [PubMed]
  15. Li, N.; Kang, Y.; Pan, W.; Zeng, L.; Zhang, Q.; Luo, J. Concentration and transportation of heavy metals in vegetables and risk assessment of human exposure to bioaccessible heavy metals in soil near a waste-incinerator site, South China. Sci. Total Environ. 2015, 521–522, 144–151. [Google Scholar] [CrossRef] [PubMed]
  16. Ali, H.; Khan, E.; Sajad, M.A. Phytoremediation of heavy metals—Concepts and applications. Chemosphere 2013, 91, 869–881. [Google Scholar] [CrossRef] [PubMed]
  17. Hu, B.; Wang, C.; Xu, X.; Zhang, S.; Bao, S.; Li, Y. Assessment of radioactive materials and heavy metals in the surface soil around uranium mining area of Tongliao, China. Ecotoxicol. Environ. Saf. 2016, 130, 185–192. [Google Scholar]
  18. Ma, Y.; Egodawatta, P.; McGree, J.; Liu, A.; Goonetilleke, A. Human health risk assessment of heavy metals in urban stormwater. Sci. Total Environ. 2016, 557–558, 764–772. [Google Scholar] [CrossRef] [PubMed]
  19. Muhammad, S.; Shah, M.T.; Khan, S. Health risk assessment of heavy metals and their source apportionment in drinking water of Kohistan region, northern Pakistan. Microchem. J. 2011, 98, 334–343. [Google Scholar] [CrossRef]
  20. Cherfi, A.; Achour, M.; Cherfi, M.; Otmani, S.; Morsli, A. Health risk assessment of heavy metals through consumption of vegetables irrigated with reclaimed urban wastewater in Algeria. Process Saf. Environ. Prot. 2015, 98, 245–252. [Google Scholar] [CrossRef]
  21. Noli, F.; Tsamos, P. Concentration of heavy metals and trace elements in soils, waters and vegetables and assessment of health risk in the vicinity of a lignite-fired power plant. Sci. Total Environ. 2016, 563–564, 377–385. [Google Scholar] [CrossRef] [PubMed]
  22. Zhang, Y.; Han, Y.; Yang, J.; Zhu, L.; Zhong, W. Toxicities and risk assessment of heavy metals in sediments of Taihu Lake, China, based on sediment quality guidelines. J. Environ. Sci. 2017, 62, 31–38. [Google Scholar] [CrossRef] [PubMed]
  23. Abdelouas, A. Uranium Mill Tailings: Geochemistry, Mineralogy, and Environmental Impact. Elements 2006, 2, 335–341. [Google Scholar] [CrossRef]
  24. Lechat, M.F. Disasters and public health. Bull. WHO 1979, 57, 11. [Google Scholar] [PubMed]
  25. Teng, Y.; Li, J.; Wu, J.; Lu, S.; Wang, Y.; Chen, H. Environmental distribution and associated human health risk due to trace elements and organic compounds in soil in Jiangxi province, China. Ecotoxicol. Environ. Saf. 2015, 122, 406–416. [Google Scholar] [CrossRef] [PubMed]
  26. Xiang, L.; Liu, P.H.; Yang, Y.Y. Contamination characteristics and health risk assessment of radionuclide uranium in rice of a uranium mine in east china. Resour. Environ. Yangtze Basin 2017, 26, 419–427. [Google Scholar]
  27. Ding, X.Y.; Zhang, C.Y.; Gao, B.; Liu, Y.Y.; Jiang, Y.F. Distribution Characteristics and Evaluation of Radioactivity in Linshui River. Nonferr. Met. (Extr. Metall.) 2017, 2, 59–64. [Google Scholar]
  28. Yang, S.Y.; Jiang, S.Y.; Jiang, Y.H.; Zhao, K.D.; Fan, H.H. Zircon U-Pb geochronology, Hf isotopic composition and geological implications of the rhyodacite and rhyodacitic porphyry in the Xiangshan uranium ore field, Jiangxi Province, China. Sci. China Earth Sci. 2010, 53, 1411–1426. [Google Scholar] [CrossRef]
  29. Zhang, Q.; Hu, X.Q.; Zou, S.R.; Zuo, J.L.; Liu, Z.H.; Pan, Q.; Liu, C.X.; Pan, H.; Ma, G.S. Water intake of adults in four cities in China in summer. Chin. J. Prev. Med. 2011, 45, 677–682. [Google Scholar]
  30. National Health Commission of the People’s Republic of China. Chinese Citizen Chronic Diseases Survey; National Health Commission of the People’s Republic of China: Beijing, China, 2015. [Google Scholar]
  31. Duruibe, J.O.; Ogwuegbu, M.O.C.; Egwurugwu, J.N. Heavy metal pollution and human biotoxic effects. Int. J. Phys. Sci. 2007, 2, 112–118. [Google Scholar]
  32. Douglas, G.B. Geochemical behavior of antimony, arsenic, cadmium and thallium: Eh-ph diagrams for 25 °C, 1-bar pressure. Chem. Geol. 1986, 54, 271–278. [Google Scholar]
  33. Krishna, R.R; Charlie, Y.X; Chinthamreddy, S. Assessment of electrokinetic removal of heavy metals from soils by sequential extraction analysis. J. Hazard. Mater. 2001, B84, 279–296. [Google Scholar]
  34. Geoffrey, M.G.; Alan, J.G. Microorganisms and Heavy Metal Toxicity. Microb. Ecol. 1978, 4, 303–317. [Google Scholar]
  35. Kumar, A.; Mishra, P.; Ghosh, S.; Sharma, P.; Ali, M.; Pandey, B.N.; Mishra, K.P. Thorium-induced oxidative stress mediated toxicity in mice and its abrogation by diethylenetriamine pentaacetate. Int. J. Radiat. Biol. 2008, 84, 337–349. [Google Scholar] [CrossRef] [PubMed]
  36. Sui, J.J.; Yu, Z.G.; Jiang, X.Y.; Xu, B.C. Behavior and budget of dissolved uranium in the lower reaches of the Yellow (Huanghe) River: Impact of Water–Sediment Regulation Scheme. Appl. Geochem. 2015, 61, 1–9. [Google Scholar] [CrossRef]
  37. Robinson, R.A.; Stokes, R.H. Electrolyte Solutions; Courier Corporation: North Chelmsford, MA, USA, 2002. [Google Scholar]
  38. Jaishankar, M.; Tseten, T.; Anbalagan, N.; Mathew, B.B.; Beeregowda, K.N. Toxicity, mechanism and health effects of some heavy metals. Interdiscip. Toxicol. 2014, 7, 60–72. [Google Scholar] [CrossRef] [PubMed]
  39. Fargašová, A.; Bumbálová, A.; Havránek, E. Ecotoxicological effects and uptake of metals (Cu+, Cu2+, Mn2+, Mo6+, Ni2+, V5+) in freshwater alga scenedesmus quadricauda. Chemosphere 1999, 38, 1165–1173. [Google Scholar] [CrossRef]
  40. Gerber, U.; Zirnstein, I.; Krawczyk-Barsch, E.; Lunsdorf, H.; Arnold, T.; Merroun, M.L. Combined use of flow cytometry and microscopy to study the interactions between the gram-negative betaproteobacterium Acidovorax facilis and uranium(VI). J. Hazard. Mater. 2016, 317, 127–134. [Google Scholar] [CrossRef] [PubMed]
  41. Wu, B.; Zhao, D.Y.; Jia, H.Y.; Zhang, Y.; Zhang, X.X.; Cheng, S.P. Preliminary risk assessment of trace metal pollution in surface water from Yangtze River in Nanjing Section, China. Bull. Environ. Contam. Toxicol. 2009, 82, 405–409. [Google Scholar] [CrossRef] [PubMed]
  42. Wongsasuluk, P.; Chotpantarat, S.; Siriwong, W.; Robson, M. Heavy metal contamination and human health risk assessment in drinking water from shallow groundwater wells in an agricultural area in Ubon Ratchathani province, Thailand. Environ. Geochem. Health 2014, 36, 169–182. [Google Scholar] [CrossRef] [PubMed]
  43. Kavcar, P.; Sofuoglu, A.; Sofuoglu, S.C. A health risk assessment for exposure to trace metals via drinking water ingestion pathway. Int. J. Hyg. Environ. Health 2009, 212, 216–227. [Google Scholar] [CrossRef] [PubMed]
  44. Giri, S.; Singh, A.K. Human health risk assessment via drinking water pathway due to metal contamination in the groundwater of Subarnarekha River Basin, India. Environ. Monit. Assess. 2015, 187, 63. [Google Scholar] [CrossRef] [PubMed]
  45. Kim, Y.S.; Park, H.S.; Kim, J.Y.; Park, S.K.; Cho, B.W.; Sung, I.H.; Shin, D.C. Health risk assessment for uranium in Korean groundwater. J. Environ. Radioact. 2004, 77, 77–85. [Google Scholar] [CrossRef] [PubMed]
Figure 1. The location of the study area and the sampling sites in Jiangxi Province.
Sustainability 10 01113 g001
Figure 2. The speciation of heavy metals under different pE—pH conditions in site 6, which is the closest downstream sampling site to the uranium tailing pond. (A) The speciation of As; (B) The speciation of Cr; (C) The speciation of Cu; (D) The speciation of Th; (E) The speciation of U.
Sustainability 10 01113 g002
Figure 3. Health risk values of different heavy metals and radionuclides. (A) The HI value of As; (B) The HI value of Cr; (C) The HI value of Cu; (D) The HI value of U and Th; (E) The value of total chemical risk; (F) The value of total risk.
Sustainability 10 01113 g003
Table 1. Toxicological characteristic parameters adopted in this study.
ElementSFi (kg·d·mg−1)RfDi (mg·kg−1·d−1)gg (Sv·Bq−1)
As15--
Cr41--
Cu-5.00 × 10⁻³-
U--6.50 × 10⁻⁸
Th--2.00 × 10⁻⁷
Table 2. The concentrations of heavy metals and radionuclides (μg·L−1).
Sample IDUThAsCrCu
10.2060.1961.88021.2
20.930.1651.764.622.8
30.1160.22.064.720.8
40.0060.112.284.828.2
53.750.2192.625.320.1
62.550.096.977.327.6
70.8920.0952.954.821.5
80.7270.091.79022.3
90.5350.0742.124.622
100.1460.1351.874.121.4
110.5050.1592.26022
120.3920.1362.55023.1
130.8240.3162.844.723.7
Max3.750.3166.977.328.2
Min0.0060.091.76020.1
Average0.890.152.613.4522.82
Surface water quality standard III501005050100
Standards for irrigation water quality 50100100
Table 3. The main species of heavy metals in the river water.
Heavy MetalsSpeciesPercentage Contents (%)
12345678910111213
As(V)H2AsO4-9512978103472697597717171
HAsO3F--69-----------
AsO3F2--19-----6-----
HAsO42----889066242325-242325
Cr(VI)HCrO4--715356-54-5473--53
Cr2O72--1222-94-7-712--7
CrO42- ---95--32-33---33
Cu(II)Cu2+97799990-938396286444540
CuSO4-19-----7-11141318
CuCO3----9288545236-414041
ThTh(OH)435222510010010098989835989898
Th(OH)22+7-49------7---
Th(OH)3+6-14------26---
Th(SO4)2-59-----22-222
U(VI)UO2CO3593873----586067-
UO2(CO3)22-151087151860644718646756
(UO2)2CO3(OH)3-918------19-77-
UO22+5-16----------
UO2(CO3)34----9377661411--9912
Table 4. Results of human health assessment for heavy metals (year−1).
Sample IDChemical Carcinogens (HI)Chemical Non-Carcinogens (RI)Total Chemical RiskRadionuclide Carcinogen (AI)Total Radionuclide RiskTotal Risk
AsCrCu UTh
18.88 × 10−601.34 × 10−98.88 × 10−61.12 × 10−93.29 × 10−94.41 × 10−98.89 × 10−6
28.31 × 10−65.93 × 10−51.44 × 10−96.76 × 10−55.07 × 10−92.77 × 10−97.84 × 10−96.76 × 10−5
39.73 × 10−66.06 × 10−51.31 × 10−97.03 × 10−56.32 × 10−93.35 × 10−99.68 × 10−97.03 × 10−5
41.08 × 10−56.18 × 10−51.78 × 10−97.26 × 10−53.27 × 10−111.84 × 10−91.88 × 10−97.26 × 10⁻⁵
51.24 × 10−56.83 × 10−51.27 × 10−98.06 × 10−52.04 × 10−83.67 × 10−92.41 × 10−88.07 × 10−5
63.29 × 10−59.39 × 10−51.74 × 10−91.27 × 10−41.39 × 10−81.51 × 10−91.54 × 10−81.27 × 10−4
71.39 × 10−56.18 × 10−51.35 × 10−97.58 × 10−54.86 × 10−91.59 × 10−96.45 × 10−97.58 × 10−5
88.46 × 10−501.41 × 10−98.46 × 10−63.96 × 10−91.51 × 10−95.47 × 10−98.46 × 10−6
91.00 × 10−55.93 × 10−51.39 × 10−96.93 × 10−52.92 × 10−91.24 × 10−94.16 × 10−96.93 × 10−5
108.83 × 10−65.28 × 10−51.35 × 10−96.17 × 10−57.96 × 10−102.26 × 10−93.06 × 10−96.17 × 10⁻⁵
111.07 × 10−501.39 × 10−91.07 × 10−52.75 × 10−92.67 × 10−95.42 × 10−91.07 × 10−5
121.20 × 10−501.46 × 10−91.20 × 10−52.14 × 10−92.28 × 10−94.42 × 10−91.20 × 10−5
131.34 × 10−56.06 × 10−51.49 × 10−97.40 × 10−54.49 × 10−95.30 × 10−99.79 × 10−97.40 × 10−5
Max3.29 × 10−59.39 × 10−51.78 × 10−91.27 × 10−42.04 × 10−85.30 × 10−92.42 × 10−81.27 × 10⁻⁴
Min8.31 × 10−601.27 × 10−98.46 × 10−63.27 × 10−111.24 × 10−91.88 × 10−98.46 × 10⁻⁶
Average1.20 × 10−54.45 × 10−51.44 × 10−95.68 × 10−55.29 × 10−92.56 × 10−97.85 × 10−95.68 × 10⁻⁵

