Abstract
As a consequence of policies such as the EU Public Sector Initiative, authorities across Europe have been moving towards providing free access to a wide range of statistical data and in particular geodata. From the diverse end-users’ perspective (general public, interest groups, students, other authorities, etc.), access to data requires specific knowledge, methods, and guidance in identifying and using the relevant content. Metadata are a key concept for the description and classification of data and thus also for ensuring their long-term value. We analyze the European Data Portal as well as one national metadatabase (Austrian Data Portal) with regard to aspects such as data search functionality, keyword consistency, spatial referencing, data format and data license information. In both cases, we found extensive inconsistencies and conceptual weaknesses that heavily limit the practical accessibility. The mere presence of metadata is no indicator for the usability of the data. We argue for a better definition and structuring of the interface between the numerous data providers and the metadatabases.
1. Introduction
Providing open access to a wide range of data creates opportunities for individuals and groups to participate in collaborative decision processes; it also facilitates cooperation between authorities [1] and supports education for sustainable development [2] as well as democratic processes [3].
Driven by the EU Public Sector Initiative PSI [1] and the EU Directive for Infrastructure for Spatial Information INSPIRE [4], public authorities across Europe and to a lesser extent also private sector companies provide access to thematic datasets such as statistical data as well as geodata. Publicly accessible web portal sites have been established to facilitate searching in data catalogues. The usability of these sites is an important aspect for utilizing the potentials of open data in an efficient manner [5]. Furthermore, a wide range of target-group specific requirements need to be considered [6] for avoiding access barriers across different user groups.
The design of the user interface is a widely investigated aspect of usability studies. Our article focuses on a less visible aspect, namely the structure and quality of the metadata behind the actual data. In particular, in large data portals, the availability and quality of metadata as “data about data” [7] is indispensable to supporting the usefulness of data and to ensuring interoperability and integrability among different systems. The goal of a metadata standard is to provide a data scheme that is necessary to describe datasets of a certain topic with the purpose to make data understandable and searchable and to preserve the value of a dataset. This means that the main objective is to guarantee the quality and completeness of metadata but also to ensure the use of a target-group-orientated description language as well as the definition of standardized classes, groups, and categories to avoid disorientation during searching and structuring processes. Depending on the respective thematic field and application context, several metadata standards exist to provide optimal solutions for different purposes. It is difficult to estimate the number of existing metadata standards, yet the Digital Curation Centre lists approximately 40 different standards [8]. This number might even be way too low, as each discipline defines additional individual schemes for metadata management.
Recent developments of providing free access to data stimulate a high potential for supporting societal goals, citizen initiatives (participatory projects, bottom-up initiatives) as well as educational strategies (ESD). Nevertheless, access to data requires comprehensive metadata structures, a high-quality metadata and user-centered interfaces for search operations and data download. A study published in 2016 highlighted the case of the US data portal Data.gov [3] at a meta level to identify political and administrative issues as well as challenges for ensuring public value but avoided a closer look on the information (metadata) itself. A report from the European Commission [9] analyzed the maturity of the European Data Portal and addresses existing political, legal and technical barriers. The overall importance of metadata quality and harmonization is stated there, but an in-depth analysis of the metadata content is missing.
This gap shall be closed by this article: as quality, readability, and completeness of metadata is a central key to enabling access to data across different target groups, the central research question is how metadata need to be managed regarding content and structure to ensure practical accessibility of data in open data portal sites for a wider audience. The empirical study cases for this investigation are the European Data Portal (europeandataportal.eu) as well as the national data portal of Austria (data.gv.at).
2. Open Data: Societal Needs and Legal Frameworks
“Digitalization progress”, “transparent authorities”, “responsible citizens” are key terms that together with the ongoing opening of politics and science towards society require new strategies and tools to provide open access to data of public interest. The development towards open data takes place at different levels and varies across countries and cultures [10]. Access to data and information enables citizens to contribute to democratic processes and allows them to shape and alter their living conditions [11,12].
Furthermore, public access to environmental information should “contribute to a greater awareness of environmental matters, a free exchange of views, more effective participation by the public in environmental decision-making and, eventually, to a better environment” [13] (p. 1).
This development supports strategies for sustainable development as defined in the Brundtland Report by ensuring a “development that meets the needs of the present without compromising the ability of future generations to meet their own needs” [14] (p. 37).
Access to open data and information can also significantly support educational strategies [15]. For example, education for sustainable development (ESD) [2] should contribute to a solidary coexistence in freedom and prosperity in times of increasing scarcity of resources. Therefore, there is a high potential for open accessible data to support the implementation of ESD and comparable educational strategies.
Teaching curricula should be directed towards increasing competencies for sustainable development, so-called “Gestaltungskompetenz” [16], and many of these competencies require an examination of data and information using different tools.
Furthermore, open educational resources [17] have the goal of providing easy access to a wide range of teaching and learning material in higher education [16,18] to facilitate openness and access to information.
Therefore, there is a high potential of open data to support society, knowledge transfer, learning strategies as well as decision-making processes, but this requires a high metadata quality to minimize the risk of data misuse and misunderstanding as well as to prevent frustrations. Besides standardization processes to minimize the technical barriers for data exchange and access, a main emphasis must be on the communication of data content and information, which can be provided using comprehensive target-group-centered metadata.
2.1. Public Sector Initiative and INSPIRE: The European Framework to Access Open Data
In the European Union, collaborative frameworks and directives are the legal basis for the implementation and provision of open data across the member countries.
The Public Sector Initiative (PSI) is the legal framework for the re-use of public sector information in Europe with the goal to enable every citizen to “gain new ways of accessing and acquiring knowledge” [1] in an increasing information and knowledge society.
Nevertheless, the PSI has a clear focus on the economic aspects of information re-use rather than on the access of individual citizens to information. This is stated in the directive under point 5: “One of the principal aims of the establishment of an internal market is the creation of conditions conducive to the development of Community-wide services.” [1]
Specific concepts and requirements regarding the access of individuals are missing, which is a clear restriction for bottom-up data utilization in participatory projects, transdisciplinary initiatives or for individual information and problem-solving processes. The economic and innovation-centered approach also aggravates strategies addressing education for sustainable development [2]. Furthermore, it remains unclear what type of organizations can realize innovation benefits from open data and big data [19].
The Directive for Infrastructure for Spatial Information in the Europe (INSPIRE) of the European Parliament and Council is the legal and technical foundation towards interoperable spatial data infrastructures across Europe [20]. INSPIRE is based on a comprehensible framework of international standards, where ISO 19115 (geo-information metadata) and ISO 19119 (geo-information services) are the most important. The metadata norm has the goal of defining global standards to describe geographic information and services. Metadata should ensure the understanding of data as well as interoperability with different systems. Therefore, file formats that support machine-reading (e.g., XML) are in focus [21]. The geo-information services norm deals with the definition of standardized interfaces and software architectures to provide platform and software independent services. Most of these standards had been defined by the Open GIS Consortium (OGC), a non-profit organization with members from governments, commercial organizations, non-governmental organizations as well as academic and research organizations. About 60 different geospatial information related standards have been published by the OGC so far ranging from file formats and data schemes (e.g., KML, GML, GeoJSON) up to different web mapping standards such as WMS—Web Map Server [22], WFS—Web Feature Service [23], WCS—Web Coverage Service [24] or WMTS-Web Map Tile Service [25].
These standards are well established and rely on open file and data structures. The implementation in common GIS software products (e.g., ESRI ArcGIS or QGIS) is sometimes difficult due to version conflicts. However, these issues can be mostly solved by expert knowledge or the utilization of additional software products (e.g., file converters and translators).
2.2. Open Government Data
In recent years, the European Union and the member states started several open data initiatives with the goal to grant free access to data produced by the public sector. The Open Government Data (OGD) concept was considered in the revision of the Public Sector Initiative (PSI) from 2013 [26], and most of the European countries (61%) follow the open data policies defined in the PSI, containing rules regarding availability, accessibility, and transparency of open data [9]. Only Finland addresses the utilization of data and provides strategies to ensure the availability of data free of charge to public authorities and extensively throughout society [27]. Free and open data have a long tradition in some other countries (e.g., United States), but the concept is fairly new in Europe. One of the major reasons for these different developments are substantial differences regarding data protection and privacy, which are a fundamental right in Europe without any equivalent framework in the United States [10]. OGD means more transparency, citizen orientation, open administration and public relations with the goal to strengthen the society [28] by simultaneously ensuring privacy and data protection by avoiding the publication of personalized data [1]. Free access to OGD also enables citizens to inform themselves, support decision-making and enhances bottom-up processes, participatory projects or citizen science initiatives [3,29]. The latter, however, also implies a society trained in the active participation of societal processes, which requires specific education and practical training.
3. Study Cases
This section gives a brief overview about the chosen study cases as well as the implemented analysis methods. We selected metadata platforms from two different administrative levels, the European Data Portal on the supranational level and the Austrian Open Data Portal as an example for the implementation on the national level.
3.1. Austrian Data Portal—Data.gv.at
The website data.gv.at is the official metadata catalogue (Austrian Data Portal) for open government data as well as information regarding PSI in Austria. The analysis in this paper refers to the database state on 11 October 2017. In total, 2475 individual metadata sets provided by 40 different organizations and authorities were available at this date. Since the start of the platform in September 2015, the amount of provided data per time period has been fluctuating but increasing (see Figure 1 below)
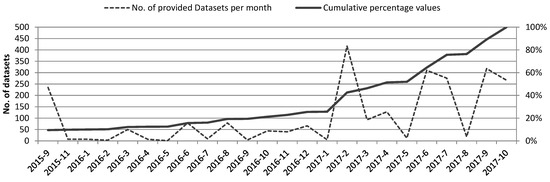
Figure 1.
Datasets provided per month since the start of the Austrian Data Portal in September 2015 (data derived from the metadata creation date).
The platform was initiated by the “Cooperation OGD Österreich”, a consortium founded by the Austrian Federal Chancellery together with the City administrations of Vienna, Linz, Salzburg, and Graz. It is the most important entry point for open data in Austria. Technically, the platform is based on CKAN (Version 2.6.0), an open source solution for data portal sites (www.ckan.org). With a provided API (application programming interface), all metadata of the platform can be accessed by returning a JSON data string (JavaScript Object Notation). This interface can also be used to harvest data for other applications and data portals (e.g., the European Data Portal). Scripts and specifications (e.g., CKAN API to DACT-AP harvesting) are published on Github (github.com/datagvat).
The majority of the data (90%) has been provided by provincial and municipal authorities, the rest (10%) comes from federal authorities and companies. While all nine federal states of Austria are represented in the database, only ten municipalities contributed datasets up to now. These municipal datasets cover only very small areas and have a rather local relevance (e.g., garbage collection calendar, municipality events, city parking lots, etc.).
3.2. European Data Portal—Europeandataportal.eu
The European Data Portal is funded by the European Union and has been implemented by a consortium led by Capgemini Consulting, including INTRASOFT International, Fraunhofer FOKUS, con terra, Sogeti, the Open Data Institute, Time.Lex and the University of Southampton. The portal is the major entry point to access data from the public sector [26] across European countries with the goal to provide information and access to data for supporting economic, societal and democratic processes—from data publishing to data re-use. It harvests metadata from currently 69 national data catalogues as well as four different catalogues from the European Union (also the national Austrian data catalogue is part of the European Data Portal), whereby all data are governmental data (ranging from national to local authorities) but not necessarily open data. All indicators and statistics derived from the European Data Portal for this study refer to 3 November 2017. The European Data Portal is based on the DCAT-AP 1.1 (Data Catalog Vocabulary application profile) metadata standard specification [30].
On that date, 787,892 metadata sets were available, complied from 73 different data catalogues from 34 European countries (Figure 2).
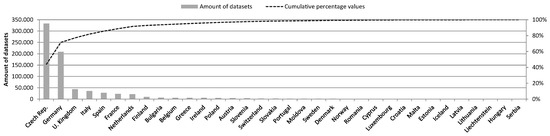
Figure 2.
Amount of data provided for the European Data Portal by European countries.
At first look, it comes as a surprise that 71% of all datasets were contributed by only two countries: the Czech Republic and Germany. However, this number does not fully reflect the actual information content, as some data from these two participants had been subdivided into a huge number of individual tiles, thus inflating the total number of records. In contrast to the Austria Data Portal, not all data are accessible online; 45% of the metadata entries provide a contact point for further information. The platform allows data search and browsing by providing the most common keywords and categories. A special metadata quality dashboard, accessible via the website, informs about quality aspects of the provided metadata in form of descriptive charts. The quality analysis on this dashboard is based on three criteria: the accessibility of distributions, their machine readability and their compliance to the Data Catalog Vocabulary (DCAT) application profile specification [30].
4. Methods
4.1. Data Gathering from the Metadatabases
Due to the different dimensions of the two analyzed metadata services regarding the amount of datasets as well as the integration of different data catalogues, different analysis steps were performed to analyse the metadata quality. Metadata from the Austrian Data Portal was gathered using server-based PHP scripts [31] to access the CKAN API (www.data.gv.at/katalog/api/3/). The JSON strings returned from the API were decoded (PHP command json_decode), and the variables were stored in a mySQL database [32] for further sorting, filtering (e.g., geodata) and analysis.
Search and replace functions, regular expressions and text clipping operations were used to clean the raw text content (title and description fields) and extract the relevant metadata information (e.g., removing stop words for quantitative text analysis).
The European Data Portal was viewed predominantly from a meta perspective with the goal to analyze the issues in finding a needle in a haystack by analyzing the structure and content of the most frequently used keywords, data formats and license types The data from the European Data Portal was gathered by performing SPARQL-queries the using the SPARQL-Manager (www.europeandataportal.eu/sparql-manager/en/) to access the most frequently used data for structuring and classification (e.g., keywords, themes, license types and file types). The following SPARQL-statement returns the 90 most frequent (count) keywords (GROUP BY) from the European Data Portal:
SELECT ?keyword (count(?keyword) AS ?count) WHERE {?s a dcat:Dataset . ?s dcat:keyword ?keyword} GROUP BY ?keyword ORDER by desc (?count) LIMIT 90
The returning entries are provided in descending order (ORDER by desc (?count)).
Aside from the analysis of most frequently used entries, issues in data quality were explored on a random basis (e.g., sample geographic searches)
4.2. Quantitative Text Analysis
Quantitative text analysis is a method to analyze text content statistically avoiding interpretation shifts through prejudices or expectations of the researcher [33]. For this article, the program KH Coder [34], an open source software for quantitative content analysis and text mining, has been applied. The software uses different open frameworks for data management and analysis such as mySQL and R. The software also uses a set of different Part-Of-Speech (POS) Taggers such as the Stanford POS Tagger [35] or FreeLing [36] that also support German language for analysis. Data needs to be prepared by removing stop words (e.g., github.com/solariz/german_stopwords) to reduce the text to the essential content.
In a first step, word frequencies and their contextual meaning can be analyzed, and co-occurrence networks [37,38] allow the examination of terms that are frequently used together to identify thematic groups within the text content. Different aspects regarding the quality and readability can be estimated by analyzing the used terms (e.g., technical terms) and abbreviations.
4.3. Descriptive Quantitative Data Analysis
The content of the Austrian Data Portal was prepared for descriptive quantitative data analysis with the goal to get an overview about data characteristics (e.g., file formats and document type), completeness (absence or presence of different aspects) as well as comprehensiveness (e.g., text lengths) and similarity.
Metadata structures and content are a complex multidimensional matter that requires respectively appropriate methods for data analysis. Therefore, the investigation was separated into an evaluation of the search capability, an analysis of keywords, geographic reference systems, data formats and data license information, an analysis of the textual content and readability as well as the completeness of different sections such as attributes, and data formats. Table 1 gives an overview about the examined thematic fields and the respective methods and data sources.

Table 1.
Thematic fields for the analysis and the respective methods and data sources for each metadatabase under investigation.
5. Results
5.1. Access to Metadata: Linkage between Interface and Metadata
At first glance, both platforms have a clear look with a navigation bar, a search field and thematic categories visualized using icons—they are very similar in their overall structure. The search functions of both platforms provide simple text search as well as combined search operations (AND, OR), wildcards or additional filters.
The Austrian Data Portal provides a search field to perform a text search. This search can be refined with an additional filter list, where filter terms from different metadata categories (e.g., publisher, thematic category, keywords, data formats or license definitions) can be selected. For these selections, the logical operators “AND” or “OR” can be chosen. A geographic map search is missing; therefore, the spatial extent of a data set can only be estimated by performing a text search with geographic names.
The European Data Portal also uses a simple text search field for initial data access and provides additional filters for countries, catalogues, categories as well as the most frequently used keywords, data formats, and licenses. A more specific data search is implemented by providing a SPARQL interface, a complex query language to access databases [39]. SPARQL is an expert tool with a clear focus on a structured machine-based data processing that requires highly experienced users. Thus, the European Data Portal has difficulty searching for laypersons except for simple text phrase operations. Due to the high amount of data, it is hard to find specific data the easy way in the European Data Portal.
The European Data Portal also provides also a map tool, where users can search for a city, state or region name. Alternatively, a bounding box for a region of interest can be drawn on a map. This search tool has a methodological issue, as the bounding boxes overlap with neighboring regions and countries. This was explored by applying sample searches for different European cities. For example, a geographic search for the pre-defined search window of Vienna returns 4100 seemingly appropriate datasets, whereby 1650 resulting datasets are from Germany and 940 are from the Czech Republic. The reason for that is that the bounding boxes of neighboring countries overlay regions outside the country largely (see Figure 3 below).
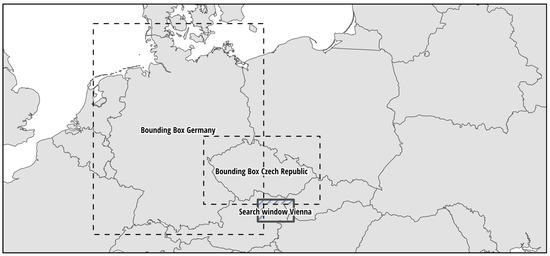
Figure 3.
The default search window of Vienna is overlapping the bounding boxes of many datasets from Germany and the Czech Republic, which leads to incorrect search results.
Furthermore, many bounding boxes have incorrect region definitions (see Figure 4 below on the left side). Hence, many datasets appear in the results list, where not even a neighborhood situation exists. The above-mentioned geographic search for Vienna returns 149 datasets from Finland, 106 from Great Britain and 63 from France as a result of wrong bounding box definitions. Thus, when performing a geographic search with a bounding box around the city of Vienna, only 16.1% of the resulting datasets are at least from Austria.
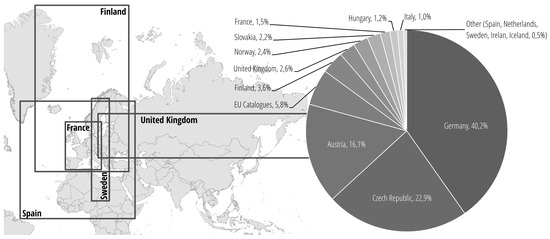
Figure 4.
Examples for bounding box definitions from different countries in the European Data Portal (left). Resulting datasets from different countries returned by a geographic search for Vienna, Austria.
Other exemplary geographic searches for Munich, Paris and Rome illustrate the same issue (Figure 5). Depending on the search region, between 23 and 69% of the returned data are from other countries.
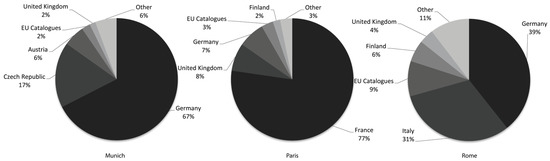
Figure 5.
Resulting datasets grouped by countries from example geographic searches in the European Data Portal for Munich, Paris and Rome.
While the issue with wrong bounding boxes could be addressed easily, the methodological issue with overlapping bounding boxes of neighbouring countries and regions remain unsolved with that approach.
5.2. Keywords
Keywords are a common concept to associate different topics or categories to a dataset. They usually represent the core information that describes a dataset. Both platforms provide keywords that can be used to browse in-depth by using single keywords as a search filter.
The Austrian Data Portal contains 3486 unique keywords, but, when browsing the list, one can recognize that many keywords represent the same topic (see examples in Table 2). Often, only different letter cases (upper or lower case) make the difference. A PHP script-based analysis regarding equality of different keywords shows that 286 keywords (8,2% of all keywords) differ only by varying letter cases. Furthermore, 311 unique keywords (8,9%) could be removed by normalizing singular and plural notations; harmonizing the German umlauts (ae—ä, ue—ü, oe—ö) removes further 33 keywords (0,9%). In total, 18% of all keywords could be removed without losing any information. In addition, 114 keywords (3,9%) contain date specifications that should be avoided as keywords. Dates and year specifications should be part of the title or description (e.g., year specifications), or defined as creation date.
Table 2.
Examples of similar keywords used in the Austrian Data Portal with different spellings and a possible primary keyword for simplifying the keyword structure. Terms in bold letters differ only by varying letter cases.
The table above shows the general potential to group similar terms into primary keywords for streamlining the keyword structure.
The same issue can be observed in the European Data Portal, where multilingualism further exacerbates the situation. An analysis of the 90 most frequently used keywords (Table 3) shows that they could be reduced to 19 primary keywords, which is a reduction of keywords by 80%.
Table 3.
Ninety most frequently used keywords of the European Data Portal and a possible primary keyword.
The dominance of keywords in the Czech language can be explained by the circumstance that Czech authorities provide 43% of all datasets of the European Data Portal (see Figure 2). The most frequently used keyword is “5000”. Interestingly, this keyword is not self-explanatory and it appears in the three different variations “5000”, “5000” and “5.000”. The keyword “5000” just describes the scale of map documents and is also used frequently by Czech authorities. Aside from the circumstance that scale information should not be described in the keyword section, this example demonstrates how one single contributor can impact the whole system by attaching one single keyword to a very large amount of data.
The fact that there is an imbalance regarding the amount of data provided by a certain organization leads to shifts in the filter lists of keywords, tags or file formats. As the European Data Portal is currently dominated by two major data providers, this leads to unusable filter lists for the mentioned data fields. This problem is exacerbated by the absence of a defined vocabulary for classifications such as keywords or file formats and the use of different languages.
5.3. Geographic Reference Systems and Projections
A well-defined, standardized and complete scheme for the definition of geographic reference systems and projections is important to support a seamless integration of data at the project and software level. In project workflows, different data sources in different spatial reference systems and projections require comprehensive information about geographic reference systems and, if necessary, transformation parameters.
There are different approaches to implement geographic reference systems across different software platforms (e.g., ArcGIS, QGIS, Web-mapping frameworks, etc.), whereby well-known-text (WKT) is the most common technique. WKT is an OGC-Standard for coordinate reference systems [40] using a structured language that is machine-readable. However, there are also industry standards such as the projection metadata file (.PRJ) for shapefiles introduced by the GIS software leader ESRI (Redlands, CA, USA). These PRJ files are a kind of WKT dialect and dominate the market due to the abundance of shapefiles for storing vector data.
Furthermore, the EPSG (European Petroleum Survey Group Geodesy) code system is available, which provides unique codes for several spatial reference aspects such as reference systems, ellipsoid definitions, projections as well as transformation parameters between different reference systems. The codes and the corresponding WKT definitions are accessible via an online database [41].
Besides a clear structure for the definition of geographic reference systems, valid content is crucial for a seamless interoperability of geographic projections across different GIS platforms. Therefore, the projection files of all shapefiles provided by the Austrian Data Portal were analyzed regarding content and completeness. In total, 661 PRJ files associated with shapefiles were analyzed. The analysis focused on the availability of different thematic blocks such as, “geographic reference system”, “projected reference system”, “geodetic datum”, “spheroid definitions”, EPSG codes, units and specific parameters as well as transformation parameters.
Generally, all analyzed PRJ files on the Austrian Data Portal can be associated to one of the three reference systems relevant for Austria: the Austrian reference system MGI, the European reference system ETRS89 and the global reference system WGS84 [42]. The MGI system is dominating with 57%, followed by WGS84 with 36%. ETRS89 as European reference system is only used by 7% of all analyzed datasets.
Increasing global dynamics and interrelations require spatial references that are valid and interchangeable outside national borders. For instance, Austria assured in 1995 the transition of Austria’s military maps from the national MGI system to the UTM system until 1999, the reason for this being Austria’s participation in the NATO program “Partnership for Peace”. Seen from an implementation perspective (different systems and different data), the current distribution of references systems in the Austrian Data Portal indicates that many projects need further coordinate system transformations, as MGI is based on a different reference ellipsoid than ETRS89 and WGS84. Furthermore, many GIS projects utilize web map services such as GoogleMaps or OpenStreetMap—which both use WGS84—or integrate European datasets (e.g., Corine Landcover) that use the ETRS89 system.
Through the absence of a defined name nomenclature (in contrast to EPSG codes) for reference systems, identical systems are named differently causing serious barriers when it comes to the correct identification of reference systems in different software products.
Table 4 illustrates the different names, used for the three occurring geographic coordinate systems MGI, ETRS89 and WGS84. The same issue appears in the section of the defined projections (Table 5).
Table 4.
Different names used in the PRJ files (n = 661) of the Austrian Data Portal to describe one of the three geographic reference systems commonly used in Austria.
Table 5.
Different names used in the PRJ files (n = 391) of the Austrian Data Portal to describe cartographic projection systems.
In general, names for references systems can be chosen freely, but many software platforms cannot identify them correctly. This can cause serious issues when using the data together with other reference systems (e.g., for coordinate system transformations). Furthermore, a high-level expertise in coordinate systems is required to find the right data integration strategy for GIS projects.
The issue of different name definitions could be easily fixed by providing EPSG codes, as they are unique for a specific geographic reference system, a projection or a reference ellipsoid and independent from the given name. The chart below (Figure 6) shows that only 45% of the analyzed PRJ files provide EPSG codes, which means that more than half of all data can cause serious problems and additional effort for data integration tasks. As 57% of all shapefiles use the national MGI datum in the Austrian Data Portal, it is important to provide adequate information for coordinate transformation to ETRS89 or WGS84. Only 14% of the analyzed PRJ files fulfill this requirement.
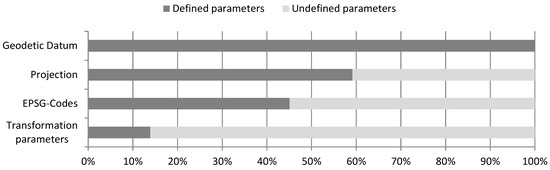
Figure 6.
Information provided by the shapefile projection files (PRJ) on the Austrian Data Portal (n = 661).
5.4. Data Formats
Depending on the data type category, the amount of data formats varies significantly. In both databases, geodata are the most prominent data category in terms of the amount of data and the number of different data formats. The data format is usually described by providing the file extension. As there is neither automatic file format recognition nor a standardized list of allowed file format descriptions, there is a broad range of different descriptions for technically identical file formats in both portals.
Figure 7 illustrates the same tendencies across the two metadata platforms in the provisioning of different file formats for different data types. Table 6 illustrates the potential for harmonizing data format descriptions. Sixty-nine different definitions/extensions of geodata formats can be synthesized into 13 data formats, which is a reduction of information complexity by 82%.
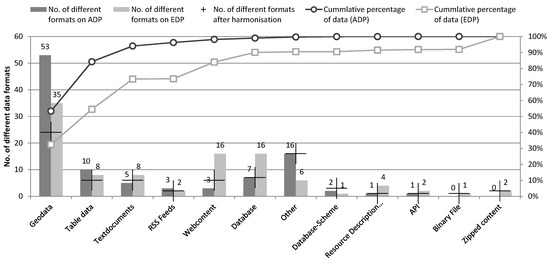
Figure 7.
Data type categories used in the Austrian (ADP) and the European Data Portal (EDP) and the potential for harmonisation of data format descriptions. The cross marker in the data format bars indicates the number of file formats when harmonizing the different data format descriptions.
Table 6.
The 13 most frequently used geodata formats and their different spellings in the Austrian and in the European Data Portal. The bold terms differ only by varying letter cases.
5.5. Data License Information
The two platforms differ significantly regarding the management and description of data license information. In the Austrian Data Portal, all datasets have valid license information, where 98% have a Creative Commons License (CC-BY), and 2% are published as Public Domain (PD or CC-0). While overall license information is available for all provided datasets, 45% have missing information about how to cite the copyright owner correctly, which may lead to uncertainties and different interpretations.
The European Data Portal contains a broad range of different license types, of which the 100 most frequently used licenses can be grouped to six major license groups: Creative Commons-Attribution, Open Database License, Open Data License, OGL, Public Domain and Other. The license group “Other” contains 29% of the mentioned licenses (Top-100) and contains licenses that are not clearly defined or unknown to the system. The license descriptions have the same issues as the keywords in the European Data Portal—identical meanings but different spellings. For example, the Public Domain license appears in the following different spellings: cc-zero 10, cc-0, publiek-domein, None, Other (Public Domain), DL-DE-ZERO 2.0, CC0 1.0, CC0-1.0, CC Zero, public_domain, ODC Public Domain.
The data quality dashboard of the European Data Portal points out that 90% of all datasets have an unknown license type, but this is mainly because the open text field for the license information is difficult to handle for machine reading.
The failure of the machine-based interpretation of license information can be explored by comparing the license information from the Austrian Data Portal with the license indicators for this catalogue on the data quality dashboard of the European Data Portal. The data quality dashboard returns the information that 98% of the Austrian datasets are lacking a known license. The reason is that Austria uses a modified CC-BY license named “Creative Commons Namensnennung 3.0 Österreich” for 98% of the datasets, and this license is apparently unknown to the European Data Portal license system. The remaining 2% with a known license are datasets published as Public Domain. This problem is caused mainly by interface issues between the CKAN API (Austrian Data Portal) and the DCAT-AP (European Data Portal). Therefore, the quality measures needs to be reflected very critically regarding their validity.
5.6. Descriptive Data Content and Quality
The overall data descriptions of the Austrian Data Portal were analysed by calculating a co-occurrence network (Figure 8) to identify the most frequently provided topics and the overall style of the data descriptions. Different contextual framings and overall topics can by identified by using this method. To prepare the dataset, the text patterns (metadata descriptions) are grouped regarding their thematic category defined in the Austrian Data Portal to identify thematic clusters and interrelations. In total, 6849 sentences grouped into 2470 paragraphs were analysed.
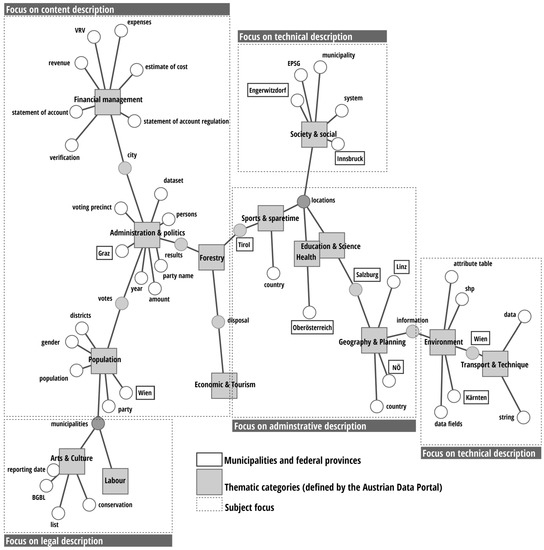
Figure 8.
Co-occurrence network of the 150 most frequent terms used for the data description in the Austrian Data Portal.
The co-occurrence network indicates that most of the thematic categories are dominated by single data providers as specific names of municipalities or data providers appear frequently. This also suggests that most categories contain very specific data for a certain region or municipality. Regarding the content, some thematic categories (e.g., “Society”, “Environment” as well as “Traffic and Technique”) focus more on technical descriptions with a frequent use of specific GIS and other technical terms (e.g., EPSG, String, attribute table, system), whereas others highlight information regarding the data content (e.g., the thematic categories “Administration and Politics”, “Population” or “Financial Management”). Thematic categories with very little or even no terms in the co-occurrence network have too few data entries (for readability reasons, only the 150 most frequently used word patterns are displayed in Figure 8).
The strong dominance of certain term combinations can also be explained, as some data providers use copy and paste strategies of text portions to describe a larger amount of datasets. This appears for instance in the “Arts and Culture” category, where a standard text regarding the legal conditions for preservation of sites of historic interest was used for one third of all datasets in this category. In general, data providers handle the meaning and content of the metadata description very differently. There is no common understanding or a guideline regarding the structure and content of metadata descriptions.
Text lengths are short for most of the datasets. As shown in Figure 9, more than 50% of all datasets use less than 14 words in one to two short sentences. Approximately 30% use less than eight words for describing the dataset.
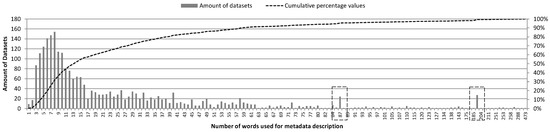
Figure 9.
Word counts across metadata descriptions in the Austrian Data Portal and cumulative percentage values.
The two peaks (87 and 187 words) indicate a use of copy and paste across a certain amount of datasets. Most of the description text is very short. In addition, 60% of data descriptions use less than 160 characters in total, which is the size of a phone text message (SMS).
These short descriptions are often just slightly modified copy and paste versions of the title. The Figure 10 below shows the similarity [43] as well as the Levenshtein distance [44] between title and description. The Levenshtein distance represents the number of characters that need to be replaced, inserted or deleted to shift from on string (title) to another (description) [44]. Furthermore, 20% of all descriptions exhibit a very high similarity between title and text.
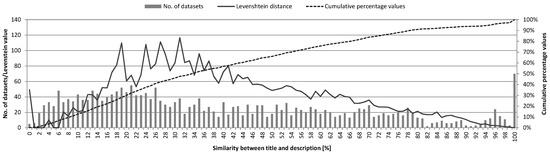
Figure 10.
Similarity and Levenshtein distance between title and description for all datasets in the Austrian Data Portal.
5.7. Machine Readability vs. Human Readability
Both metadatabases are lacking a quality management of the metadata content. This leads to fragmented headlines and text descriptions that are difficult to understand. For the European Data Portal, the aggravating fact of multilingualism come along with the effect that many contributing countries use machine translators that produce unreadable content. Here are three examples of headlines and metadata descriptions provided by the European Data Portal:
Digital ortho-imagery Germany (32,529 metadata sets in the European Data Portal contain this data description)
“Title: dop20 dop20rgb_32532_6010_1_sh_2012,
Description: The ortho-photo dop20rgb_32532_6010_1_sh_2012 was calculated using the DGM10 The aerial survey took place in 2012. “The ortho-photo dop20rgb_32532_6010_1_sh_2012 issued by: The Federal State of Schleswig-Holstein. This is an orthophoto color-darstellung. An aerial photograph of the ortho-photos has connections with the accuracy of a card. A differenziell orthorectified aerial ortho-photos is at a scale of 1: 5000. In the aerial photo and caused by flights undertaken by the altitude of the land constructed distortions are eliminated. Are the sources for the ausgangsdatensatz aerial photos. The ortho-photo can replace or supplement a card are illustrative. The dimensions of 20 × 20 cm abgabeformats, those indications shall correspond to 1 × 1 km in nature. There is no online access for dop20!”
German basemap (651 metadatasets in the European Data Portal contain this data description).
“Title: Sheet 7072—Haan—DGK5 tk25-nr. 4808/01
Description: The German Land Map (DGK5) 1:5000 is a topographic base map. It represents the earth’s surface is geometrically, taking into account the caps. The continuation in the future was discontinued at the end of 2013, the official will be the base map (DGK5 by ABK).”
Digital landscape model (1155 metadatasets in European Data Portal contain this data description).
„In 325105980, things—friedrichshof, basis-landschaftsmodell (ATKIS ®—digital basis-dlm)
The set of 325105980—and with the tile of the ATKIS ®—digital friedrichshof basis-landschaftsmodell (basis-dlm). The timeliness of the topography, ‘date of production’ and the ‘update date spitzenaktualität is under revision). The ATKIS ® -basis-dlm contains the topographic features of the landscape in vector format. These are 2d-koordinaten by geographical location (in metres), its geometry type, their characteristics (attributes) and relations with other objects (relationship). Any object has a nationwide unique identification number. The content of the ATKIS ® -basis-dlm are given in the relevant basis-dlm -ok atkis-objektartenkatalog (ATKIS ® the current geoinfodok-version). The objektumfang follows the digital 1:25,000 topographical map. The positional accuracy is ± 3 m.”
The above examples show a set of flawed sentences in English language mingled with German terms as a product from machine-based language translations. Moreover, the comprehensive use of technical terms, quadrant codes, as well as abbreviations (e.g., ortho-photo, dop, DGM10, DGK, TK25, DLM, OK) makes this text hardly legible for laypersons, but even professional users might get lost in these kinds of data descriptions.
Furthermore, a lot of the provided information it just not relevant for human users. This includes the appearance of numerous primary keys and unique identifiers, several internal identifiers (e.g., revision id or package id) as well as the use of data formats that are difficult to read (e.g., time dates in the format 2017-10-30T07:57:17.574292).
5.8. Completeness
A large number of metadata fields has the goal to specify different aspects of the data (e.g., license details, geographic region, data quality, etc.) or explains specific data characteristics (e.g., attribute descriptions for geodata or tables). Evaluating the completeness of these data helps to gain a deeper insight into the data content and applicability. The abundance of these metadata fields has been analyzed for the Austrian Data Portal.
As shown in Figure 11, many fields suffer from missing data. For example, attribute descriptions are crucial for a broader understanding and proper application of data such as geodata or tables (82% of all data on the Austrian Data Portal are one of these two data types). Missing citation information may cause legal implications especially when data is used in publicly accessible projects (e.g., web services, mobile apps). Information on data quality is important when it comes to the interpretation of data. Additional descriptions in English language open further markets and applications, in particular also with regards to international demand for data integration in the context of global challenges (e.g., climate change, land use change, etc.)
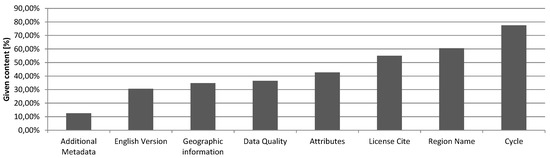
Figure 11.
Existing content for different metadata fields in the Austrian Data Portal (n = 2475).
6. Discussion and Recommendations
The goal of this research was to analyze the content, quality, and completeness of metadata for the provision of open data to a non-expert audience. While a large number of metadatabases exists across Europe, two databases were analyzed—one of national importance (Austrian Data Portal) and one with a European scope (European Data Portal). The European Data Portal integrates 73 national and European catalogues into one large platform. It has to be clear that detailed results from one national database cannot be extrapolated to all other national databases in Europe, but the closer look at the European Data Portal indicates that issues regarding data harmonization and completeness are obvious. Generally, a large amount of data across a broad range of thematic fields and regions is available and has the overall potential to support societal needs and development as well as educational and bottom-up strategies. Nevertheless, a high quality and completeness of metadata is a key issue that needs to be ensured to prevent a “data garbage dump”, where nobody finds a way.
Based on the above analysis, recommendations and needs are formulated to improve the access to open data. The recommendations address mainly areas of responsibilities of data providers and metadata portal distributors (Table 7).
Table 7.
Recommendations to increase the user-experience and the quality of open data portal sites.
7. Conclusions
Access to data is a vital need in an increasingly digitized society and open data can contribute to the creation of a knowledge society [19]. The frequently used term digital native for younger generations that grew up with digital devices and network services induce that this group has the potential to utilize open data services to gain insights or help to build opinions in societal processes.
The analysis of two major metadata platforms for Austria and Europe show that the mere availability of metadata services does not warrant easy access to data and information as the quality and completeness of metadata is very important. GIS professionals, programmers or data scientists can rely on their professional knowledge and have an opportunity to understand even less documented data with greater effort or trial and error procedures. However, it is an economic uncertainty and additional data processing efforts are difficult to substantiate. Laypersons fail in the confusing system of incomplete and unstructured metadata as well as complex user interfaces. Search interfaces are often too complex for laypersons, and may deliver a high amount of incorrect data due the methodological or data quality issues. Furthermore, many of the analyzed geodata are lacking essential information about projections and attributes or have projections that are difficult to identify by many GIS programs, which mean that professional knowledge is indispensable to having vital change utilizing some of these data.
Open data policies mostly refer to rules regarding availability, accessibility, and transparency of open data. One can note that the current conditions lead to exclusive expert access to open data rather than free access to data for the society. Both platforms fail widely with the self-defined objectives to contribute to societal processes.
One important key issue is the absence of a quality management system for metadata and the missing emphasis on the importance of metadata quality. When providing open data, the quality and completeness of metadata must have the same importance as the quality of the data itself. Currently, there is a strong emphasis on the structure of a metadata scheme while neglecting the importance of the quality of the metadata content. It is clear that a large amount of data providers, as well as different metadata standards’ organizational differences and language barriers, leads to a highly complex data environment and the responsible authorities behind these platforms are working hard to improve the platform accessibility and the quality of metadata.
We assume that a major reason for the current situation is a discrepancy between the general political agreement towards open data for an open society and the budget resources to maintain and improve the metadata quality sufficiently. The formulated recommendations can help to lower or remove current barriers, but this requires additional resources. It also requests that GI departments of authorities and companies also integrate experts into the fields of communication, language translations as well as knowledge transfer to ensure real access to open data for an open society.
Acknowledgments
This research article was developed within the research-education cooperation project “ThinkSpatial! Development and evaluation of tools for spatial and visual learning with adolescents” (2015–2018). ThinkSpatial! is funded by the “Sparkling Science” research program (www.sparklingscience.at) of the Austrian Federal Ministry of Science, Research and Economy (www.bmbwf.gv.at). The PHP script for harvesting data from the Austrian Data Portal is available on GitHub (github.com/boku-ilen/CKAN-API-Access).
Author Contributions
Thomas Schauppenlehner developed the data gathering methods, analyzed the data and conceptualized the paper; Thomas Schauppenlehner and Andreas Muhar wrote the paper.
Conflicts of Interest
The authors declare no conflict of interest.
References
- EUR-Lex. European parliament and council Directive 2003/98/EC of the European parliament and of the council on the re-use of public sector information. Available online: http://eur-lex.europa.eu/legal-content/en/ALL/?uri=CELEX%3A32003L0098 (accessed on 17 February 2018).
- United Nations Educational, Scientific and Cultural Organization. Education for Sustainable Development: Sourcebook; United Nations Educational, Scientific and Cultural Organization, Ed.; United Nations Educational, Scientific and Cultural Organization: Paris, France, 2012. [Google Scholar]
- Krishnamurthy, R.; Awazu, Y. Liberating data for public value: The case of Data.gov. Int. J. Inf. Manag. 2016, 36, 668–672. [Google Scholar] [CrossRef]
- European parliament and council Directive 2007/2/EC of the European parliament and of the council establishing an Infrastructure for Spatial Information in the European Community (INSPIRE). Offi. J. Eur. Union 2007, 108, 14.
- Bruun, A.; Stage, J. New approaches to usability evaluation in software development: Barefoot and crowdsourcing. J. Syst. Softw. 2015, 105, 40–53. [Google Scholar] [CrossRef]
- Wagner, N.; Hassanein, K.; Head, M. The impact of age on website usability. Comput. Hum. Behav. 2014, 37, 270–282. [Google Scholar] [CrossRef]
- Inmon, W.H.; Linstedt, D. 5.4—Metadata. In Data Architecture: A Primer for the Data Scientist; Morgan Kaufmann: Boston, MA, USA; 2015; pp. 189–194. ISBN 978-0-12-802044-9. [Google Scholar]
- Digital Curation Centre List of Metadata Standards. Available online: http://www.dcc.ac.uk/resources/metadata-standards/list (accessed on 19 October 2017).
- Carrara, W.; Nieuwenhuis, M.; Vollers, H. Open Data Maturity in Europe 2016: Insights into the European State of Play; European Commission: Directorate General for Communications Networks, Content and Technology: Brussels, Belgium, 2016; p. 71. [Google Scholar]
- European Union. A Comparison between US and EU Data Protection Legislation for Law Enforcement Purposes; Policy Department C—Citizens’ Rights and Constitutional Affairs, Ed.; European Union: Brussels, Belgium, 2015. [Google Scholar]
- Ruijer, E.; Grimmelikhuijsen, S.; Meijer, A. Open data for democracy: Developing a theoretical framework for open data use. Gov. Inf. Q. 2017, 34, 45–52. [Google Scholar] [CrossRef]
- Harrison, T.M.; Sayogo, D.S. Transparency, participation, and accountability practices in open government: A comparative study. Gov. Inf. Q 2014, 31, 513–525. [Google Scholar] [CrossRef]
- European parliament and council. Directive 2003/4/EC of the European parliament and of the council of 28 January 2003 on public access to environmental information and repealing Council Directive 90/313/EEC. Offi. J. Eur. Union 2003, 41, 7. [Google Scholar]
- Brundtland Commission. Our Common Future; World Commission on Environment and Development, Ed.; United Nations: Oxford; New York, NY, USA, 1987. [Google Scholar]
- Agenda 21: Programme of action for sustainable development. Rio Declaration on Environment and Development; In Statement of Forest Principles; the Final Text of Agreements Negotiated by Governments At the United Nations Conference on Environment and Development (UNCED), 3–14 June 1992, Rio de Janeiro, Brazil, United Nations, Ed.; 2nd ed.; Department of Public Information, United Nations: New York, NY, USA, 1994; ISBN 978-92-1-100509-7. [Google Scholar]
- Bundesministerium für Land- und Forstwirtschaft, Umwelt und Wasserwirtschaft; Bundesministerium für Wissenschaft und Forschung. Österreichische Strategie zur Bildung für nachhaltige Entwicklung; Bundesministerium für Unterricht, Kunst und Kultur: Wien, Austria, 2008; p. 31.
- Roeder, I.; Severengiz, M.; Stark, R.; Seliger, G. Open Educational Resources as a Driver for Manufacturing-related Education for Learning of Sustainable Development. Proced. Manuf. 2017, 8, 81–88. [Google Scholar] [CrossRef]
- United Nations Educational, Scientific and Cultural Organization. 2012 Paris OER Declaration; World Open Educational Resources Congress; United Nations Educational, Scientific and Cultural Organization: Paris, France, 2012; p. 2. [Google Scholar]
- Marcus-Quinn, A.; Diggins, Y. Open Educational Resources. Procedia Soc. Behav. Sci. 2013, 93, 243–246. [Google Scholar] [CrossRef]
- Wessels, B.; Finn, R.; Wadhwa, K.; Sveinsdottir, T. Open Data and the Knowledge Society; Amsterdam University Press: Amsterdam, The Netherlands, 2017; ISBN 978-90-485-2936-0. [Google Scholar]
- Patroumpas, K.; Georgomanolis, N.; Stratiotis, T.; Alexakis, M.; Athanasiou, S. Exposing INSPIRE on the Semantic Web. J. Web Semant. 2015, 35, 53–62. [Google Scholar] [CrossRef]
- De la Beaujardiere, J. OpenGIS® Web Map Server Implementation Specification; Open Geospatial Consortium Inc.: Wayland, MA, USA, 2006. [Google Scholar]
- Vretanos, P.A. OpenGIS Web Feature Service 2.0 Interface Standard; Open Geospatial Consortium Inc.: Wayland, MA, USA, 2014. [Google Scholar]
- Baumann, P. OGC® WCS 2.0 Interface Standard-Core: Corrigendum; Open Geospatial Consortium Inc.: Wayland, MA, USA, 2012. [Google Scholar]
- Masó, J.; Pomakis, K.; Núria, J. OpenGIS® Web Map Tile Service Implementation Standard; Open Geospatial Consortium Inc.: Wayland, MA, USA, 2010; p. 129. [Google Scholar]
- European parliament and council. Directive 2013/37/EU of the European parliament and of the council of 26 June 2013—Amending Directive 2003/98/EC on the re-use of public sector information. Off. J. Eur. Union 2013, 175, 8. [Google Scholar]
- Valtiov arainministeriö. Open Data Policy in the Finnish Government (Memorandum); Valtiov arainministeriö: Helsinki, Finland, 2015.
- Von Lucke, J. Open Government—Öffnung von Staat und Verwaltung; Deutsche Telekom Institute for Connected Cities: Friedrichshafen, Germany, 2010. [Google Scholar]
- Von Lucke, J. Entdeckung, Erkundung und Entwicklung 2.0: Open Government, Open Government Data und Open Budget 2.0; epubli; Deutsche Telekom Institute for Connected Cities: Friedrichshafen, Germany, 2012; ISBN 978-3-8442-1799-5. [Google Scholar]
- European Union. DCAT Application Profile for Data Portals in Europe (Version 1.1); European Union: Brussels, Belgium, 2017; p. 29. [Google Scholar]
- Heiderich, M.; Nava, E.A.V.; Heyes, G.; Lindsay, D. PHP. In Web Application Obfuscation; Heiderich, M., Nava, E.A.V., Heyes, G., Lindsay, D., Eds.; Syngress: Boston, MA, USA, 2011; pp. 151–175. ISBN 978-1-59749-604-9. [Google Scholar]
- Dunlap, I.H. Building block V: MySQL. In Open Source Database Driven Web Development; Dunlap, I.H., Ed.; Chandos Information Professional Series; Chandos Publishing: Cambridge, UK, 2006; pp. 105–124. ISBN 978-1-84334-161-1. [Google Scholar]
- Higuchi, K. A Two-Step Approach to Quantitative Content Analysis: KH Coder Tutorial using Anne of Green Gables (Part I). Ritsumeikan Soc. Sci. Rev. 2016, 52, 77–91. [Google Scholar]
- Higuchi, K. KH Coder; Ritsumeikan University: Osaka, Kyoto, Japan, 2017. [Google Scholar]
- Toutanova, K.; Klein, D.; Manning, C.; Singer, Y. Feature-Rich Part-of-Speech Tagging with a Cyclic Dependency Network. In Proceedings of the HLT-NAACL 2003, Edmonton, Canada; 2003; pp. 252–259. [Google Scholar]
- Carreras, X.; Chao, I.; Padró, L.; Muntsa, P. FreeLing: An Open-Source Suite of Language Analyzers. 2004. Available online: https://www.researchgate.net/profile/Muntsa_Padro2/publication/228976391_FreeLing_An_open-source_suite_of_language_analyzers/links/02bfe50fd836ec3df3000000/FreeLing-An-open-source-suite-of-language-analyzers.pdf (accessed on 17 February 2018).
- Danowski, J.A. Network analysis of message content. In Progress in Communication Sciences; Richards, W.D., Jr., Barnett, G., Eds.; Ablex: Norwood, NJ, USA, 1993; pp. 197–221. [Google Scholar]
- Osgood, C.E. The Representational Model and Relevant Research Methods. In Trends in Content Analysis; Pool, I.d.S., Ed.; University of Illinois Press: Urbana, IN, USA, 1959. [Google Scholar]
- W3C. SPARQL Query Language for RDF; W3C, 2008. Available online: https://www.w3.org/TR/rdf-sparql-query/ (accessed on 17 February 2018).
- Lott, R. Geographic Information—Well Known Text Representation of Coordinate Reference Systems; Open Geospatial Consortium Inc.: Wayland, MA, USA, 2015; p. 96. [Google Scholar]
- International Association of Oil & and Gas producers EPSG. Available online: www.epsg.org (accessed on 17 February 2018).
- Bundesamt für Eich- und Vermessungswesen. 3-D Referenzsysteme in Österreich. 2015. Available online: http://www.bev.gv.at/pls/portal/docs/PAGE/BEV_PORTAL_CONTENT_ALLGEMEIN/0200_PRODUKTE/SCHNITTSTELLENBESCHREIBUNGEN/SYSTEME_LANDESVERMESSUNG_2015.PDF (accessed on 17 February 2018).
- Oliver, I. Programming Classics: Implementing the World’s Best Algorithms; Prentice Hall: Upper Saddle River, NJ, USA, 1993; ISBN 978-0-13-100413-9. [Google Scholar]
- Levenshtein, V.I. Binary Codes Capable of Correcting Deletions, Insertions and Reversals. Sov. Phys. Dokl. 1966, 10, 707–710. [Google Scholar]


© 2018 by the authors. Licensee MDPI, Basel, Switzerland. This article is an open access article distributed under the terms and conditions of the Creative Commons Attribution (CC BY) license (http://creativecommons.org/licenses/by/4.0/).